# Altcoin Investor
> Practical guides to earning income from crypto. Yield-bearing stablecoins, liquid staking, NFTs and DeFi. Analyst-written, updated for 2026.
Public Ghost content for AI and LLM tooling. This file includes a bounded export of public pages first, then recent public posts.
Append `.md` to any post or page URL to get the content in Markdown (for example, `/example-post.md`).
## Pages
### Altcoin Review & Analysis
URL: https://altcoininvestor.com/altcoin-analysis/
Last updated: 2023-03-23T17:09:27.000Z
[AAB - AAX Token](https://altcoininvestor.com/aab/)
[ACAT - Alphacat](https://altcoininvestor.com/acat/)
[ALEX - Alex Lab](https://altcoininvestor.com/alex/)
[BAT - Basic Attention Token](https://altcoininvestor.com/bat)
[BDP - Big Data Protocol](https://altcoininvestor.com/bdp/)
[BIP - Minter](https://altcoininvestor.com/bip/)
[BNB - Binance](https://altcoininvestor.com/bnb/)
[CHRP - Chirpley](https://altcoininvestor.com/chrp/)
[CSP - Caspian](https://altcoininvestor.com/csp/)
[DAFI - DAFI Protocol](https://altcoininvestor.com/dafi/)
[DEXTF - Domaini Protocol](https://altcoininvestor.com/dextf/)
[DGB - DigiByte](https://altcoininvestor.com/dgb/)
[ECO - Ormeus Ecosystem](https://altcoininvestor.com/eco/)
[$GENE - GenomesDAO](https://altcoininvestor.com/gene/)
[FTM - Fantom](https://altcoininvestor.com/ftm)
[GNY - GNY](https://altcoininvestor.com/gny/)
[ITAM - ITAM Games](https://altcoininvestor.com/itam)
[MVL - Mass Vehicle Ledger](https://altcoininvestor.com/mvl)
[NANO - Nano](https://altcoininvestor.com/nano)
[NEWS - Publish](https://altcoininvestor.com/news)
[OSC - Oasis City](https://altcoininvestor.com/osc)
[PASS - BlockPass](https://altcoininvestor.com/pass)
[SMT - Smart Mesh](https://altcoininvestor.com/smt/)
[SNTFS - Seedify](https://altcoininvestor.com/snfts/)
[TON - Toncoin](https://altcoininvestor.com/toncoin/)
[UFI - PureFi](https://altcoininvestor.com/ufi/)
[UPX - uPlexa](https://altcoininvestor.com/upx/)
[UPXAU - Universal Gold](https://altcoininvestor.com/upxau/)
[XMR - Monero](https://altcoininvestor.com/xmr/)
[XTP - Tap](https://altcoininvestor.com/xtp/)
### Basic Attention Token (BAT)
URL: https://altcoininvestor.com/bat/
Last updated: 2023-10-03T16:43:50.000Z
*The BAT token offers an entirely new ecosystem and approach to online interaction - The attribution of value to one's "attention" online and the value that it represents.*

## How the Basic Attention Token (BAT) Works:
The Basic Attention Token is not simply another cryptocurrency, rather its a whole new paradigm shift in how website advertises, online visitors and publishers interact with the internet offering a more equitable and fair business model that rewards all parties involved.
The BAT token represents a whole new way of interacting online with a focus on fairness, privacy and security. The company is lead by the former creator of Java Script who is also the co-founder of Mozilla, Brendan Eich.
The idea behind the "Basic Attention Token" is to reward users for their "attention". Advertisers pay BAT to push their ads onto willing users in exchange for a share of the revenue. Additionally, the brave browser which the advertising is hosted on also provides privacy-centred browsing and integrates blockchain technology to reward publishers and participants accordingly.
Given the already rapid adoption of this browser, the increased awareness and need for internet privacy (and security) this coin and it's new approach to internet participation, will likely change the way the internet is interacted with entirely and offers excellent support for this token.
### How to Use the Basic Attention Token (BAT)
Basic Attention Token is this project's attempt to reward the internet user for inconvenience of advertising to them. The new, user based approach (which allows the user to participate and be rewarded for viewing advertising) lead by the create of Java Script and the co-founder of Mozilla, Brendan Eich.
The entire mechanism is handled behind the scenes and for the internet user it only requires them to change to the Brave Browser to start benefiting from this cryptocurrency.
## Investment Analysis:
The below section is our assessment of this token. This analysis is based on the fundamental principles of value based investing. Market price doesn't always reflect market value and within the world of cryptocurrencies it's difficult to distinguish between the two. We have developed a matrix to assess Altcoins the summary of our assessment is contained below.

### Market Price
Over the last 6-months the BAT token has steadily gained users, volume and token price. We anticipate continued price increases as the project, user-base and ecosystem develop out over the next few years.

### Market, Demand & Growth
In July 16th, 2017 this token was trading at 6.6 cents and an all time high of $0.98 on January 9, 2018\. Standing within the top 40 cryptocurrencies traded by market capitalisation, it's already performed exceptionally well in the last few years.
This browser and the ecosystem that is supports have the potential to completely change how the internet is interacted with. It's anticipated this token will continue along this consistent growth.
---
## Overall Investment Assessment
This is a very robust and strong coin with a massive community and user base supporting it. It's certain to grow as we live in a world demanding more security and privacy. It's likely we will see more browser supported cryptocurrencies in the near future, but BAT is a clear leader in this market. It is not foretasted for BAT to be a massive gainer, however is anticipated to make decent long-term gains. At the time of writing, this token still offers tremendous growth potential for the investor.
### Should I buy the Basic Attention Token (BAT)?
Investments are personal choices and at Altcoin investor we like to stress that investing is a personal choice and as part of that personal choice a framework and approach needs to be developed and then the coins you are considering should be determined whether they fit into your own personal investing philosophy and approach. For each person and their approach is different. Find out how this coin fits into our investment philosophy by subscribing to our weekly [Altcoin Report](https://altcoininvestor.com/tag/altcoin-report/).
---

## How to Buy Basic Attention Token (BAT)
BAT can be easily found on most major exchanges. This token can also be "earned" by using the Brave Browser to browse the internet.
### Wallets & Hardware Storage:
Both Trezor and Ledger support BAT and it is also offered by most (if not all) major software wallets.
---
## Read Our Latest Report
If you enjoyed this analysis and you can read our latest analysis in our [Altcoin Report](https://altcoininvestor.com/tag/altcoin-report/) published every Sunday. In these reports we cover our altcoin findings for the week.

---
### Disclaimer:
*The information in this report has been independently sourced and even though the best attempts to report accurately, we do not provide assurances on this information. This report is provided "as is" and it is up to the reader to do their own due diligence and research. Altcoin Investor is not associated or affiliated with any organisation and the opinions are strictly that of the author. This information should not be relied nor is it to be treated as financial advice.*
### Disclaimer
URL: https://altcoininvestor.com/disclaimer/
Last updated: 2024-02-13T19:26:01.000Z
### This is not Investment Advice
This website and its contents are for entertainment purposes and in no way to be construed as financial, trading, or other type of advice. We are not registered financial advisors with the SEC or any other organization or government body. We do not provide personalized investment advice. What we provide is merely our opinions based on our own research and due diligence. [Do Your Own Research (DYOR)](https://altcoininvestor.com/dyor/) and due diligence and consult your financial adviser before making any investment decisions. **Altcoin Investor does not provide investment advice.**
### Accuracy of Information
[This website](https://altcoininvestor.com/) makes no warranties or assurances for the information contained herein and will not hold any responsibility for missing, wrong, or omitted information. All information provided on this website is '*as is'* and available to you at your own risk.
#### **Third-Party Information Accuracy**:
AltcoinInvestor aims to provide accurate and current information; however, we do not guarantee the reliability, completeness, or timeliness of data from third-party sources referenced or linked on our platform. The information provided by external sites is subject to change and is beyond our control. We encourage users to verify any third-party information independently. AltcoinInvestor is not liable for any inaccuracies or errors in the content provided by these external sources.
### Data on this website is subject to change without notice
Although we take reasonable measures to provide accurate information, some or all of the information found on this website may become outdated, incomplete, or inaccurate. While we do our best to keep this website current, we are not obligated to update any outdated, incomplete, or inaccurate information.
### Privacy Policy & Terms of Service
Please read the complete [**Terms of Service**](https://altcoininvestor.com/terms/) and our [**Privacy Policy**](https://altcoininvestor.com/privacy/)
---
### Affiliate Disclosure
Some of the links on this blog may be affiliate links, which means that we may earn a commission if you click on the link or make a purchase using the link. By using our affiliate links, you are supporting the maintenance and development of this website. We only promote products or services that we have personally used or believe in.
### Guest & Sponsored Posts
At times we may also publish articles from third parties on our website. To learn more about [Guest and Sponsored posts, click here](https://altcoininvestor.com/guest-post/).
---
## Contact Us
For additional questions or questions, [**Contact us**](https://altcoininvestor.com/contact/)
---
### Contact Us:
URL: https://altcoininvestor.com/contact/
Last updated: 2024-12-27T06:21:49.000Z
We are delighted to hear from you and eager to assist you with any questions, comments, or concerns you may have.
## Get In Touch for Any Reason:
- **Inquiries & Support:** Have questions about cryptocurrency investment, our platform, or need assistance? Our dedicated team is here to help you navigate the world of digital currency investing with ease.
- **Feedback & Suggestions:** Your input is crucial in shaping Altcoin Investor. Share your thoughts on how we can improve, what content you'd like to see, or any features you think would enhance your experience.
- **Collaborations & Partnerships:** Interested in collaborating or partnering with us? We're always on the lookout for opportunities that align with our mission to provide top-notch crypto investment resources.
If you have a question or need assistance, please contact us via email:
## [hello@altcoininvestor.com](mailto:hello@altcoininvestor.com)
---
### Thank you for considering us for your needs.
We look forward to hearing from you!
---
## **Stay Updated:**
[Subscribe to our newsletter](https://altcoininvestor.com/newsletter/) for the latest updates, market insights, and exclusive content delivered straight to your inbox.
We're here to guide and support your journey in the ever-evolving world of cryptocurrency. Your voice matters to us at Altcoin Investor, and we can't wait to connect with you!
---
## Frequently Asked Questions:
#### Do you Guest Post?
Yes, more information about [Guest Posts can be found here](https://altcoininvestor.com/guest-post/).
#### What are your Terms of Service?
Our Terms of Service can be [found here](https://altcoininvestor.com/terms/).
#### What is your Privacy Policy?
Our Privacy policy can be [found here](https://altcoininvestor.com/privacy/).
#### **How quickly can I expect a response?**
We aim to respond to emails within the first 24 hours. For immediate updates and interactions, consider following us on our social media platforms.
#### ****How can I stay updated with the latest news and updates?**
The best way to stay informed is by [subscribing to our newsletter](https://altcoininvestor.com/newsletter/). You'll receive the latest market insights, updates, and exclusive content directly in your inbox.
#### ****Is there an opportunity for partnerships or collaborations?**
Yes, we are open to partnerships and collaborations that align with our mission. Please send a detailed proposal to hello@altcoininvestor.com for consideration.
### Artwork
URL: https://altcoininvestor.com/artwork/
Last updated: 2021-11-12T06:01:50.000Z
*The Altcoin Investor* is a fictional illustrated character based loosely on the personification of the pop comic art developed by the creative team at CoinTelegraph. This site is in no way affiliated with or associated with CoinTelegraph however, we do find inspiration from their cryptopop genre (props) as we develop out *The Altcoin Investor* illustrative narrative for our member's reading pleasure.
This illustrated character is a work of fiction. The character and references are either the product of the author’s imagination or used in a fictitious manner. Any resemblance to actual persons, living or dead, or to actual events is purely coincidental.
### The Sovereign CryptoTrust
URL: https://altcoininvestor.com/plan-b/
Last updated: 2023-10-04T20:27:44.000Z
**AKA: Plan-B:* an alternative plan of action for use if the original plan should fail*
*Plan B* means different things to different people. At [Altcoin Investor](https://altcoininvestor.com/), *Plan B* equates to personal sovereignty and freedom in your ability to store wealth and transact freely with any party - privately and anonymously.
In the past, Swiss Bank accounts were often associated with a Plan B, offering their clients privacy and anonymity. Today something exists that is far superior.
### Say Goodbye to the "Swiss bank account"
Within our [lexicon](https://altcoininvestor.com/lexicon/), a Swiss bank account is still synonymous with privacy, anonymity, and the offshore store of wealth. Although interest in Swiss Bank accounts has declined in recent years, they don't provide the high degree of privacy or secrecy most people believe they do even though they are still popularised by many movie and spy genres.
For example, clients of Swiss bank accounts need to provide identification when opening an account and need to verify their identity when making withdrawals.
Nonetheless, [blockchain technology](https://altcoininvestor.com/blockchain/) offers a much better solution.
## Hello 'Swiss Bank' in Your Pocket
The [hardware wallets](https://altcoininvestor.com/hardware-wallet/) that exist today are in many regards far superior to the Swiss bank account and rather more comparable to a *Swiss Bank*. These hardware wallets allow users the ability to buy, sell, hold, and trade potentially thousands of different cryptocurrencies.

All are contained within one palm-sized device that can be accessed from anywhere in the world; 24/7.
**Unlike a Bank, hardware wallets offer full custodial control over your funds.** Hardware wallets give the user the ability to transact with anyone, anywhere in the world almost instantaneously. These transactions can be completely anonymized (private coins) and there are no restrictions on who, when, or how much can be transacted.
**Unlike a Bank, hardware wallets don't have operating hours.** These devices are available and ready to use 24/7\. The only requirement is an internet connection. Unlike a Bank, there are no bank hours or lineups.
**Unlike a Bank, transactions are almost instantaneous.** It doesn't matter if you are sending money to your neighbor or across the world. Transactions happen almost instantaneously.
**Unlike a Bank, there are no barriers to entry and anyone can create their own wallet.** Everyone has access to a cryptocurrency wallet whether they have an ID or not.
This is because cryptocurrencies are secured mathematically, that is through the use of a cipher and a **Private Key**. A private key is the only identification required and it can be as simple as a sequence of 24 words that can be written down or easily memorized. It's for this same reason private keys need to remain private.

Private Key (24 words)
---
## The 'Sovereign CryptoTrust' (Plan B):
**The Sovereign CryptoTrust** is an idea borne out of ancient trust law. Trusts have been used since Roman times and hardware wallets offer a unique approach for the divesting of custody and control of a portfolio of assets stored within a hardware wallet. Hardware wallets currently offer the unique ability to store, buy, and sell thousands of cryptocurrencies on a single private key within the device.
As smart contracts and [AI trading](https://altcoininvestor.com/ai-trading-bots/) continue to evolve, it's very likely fully [AI managed portfolio trading](https://altcoininvestor.com/trading-bot-software/) will soon be available on these platforms including more complex "trust" administration managed through [smart contracts](https://altcoininvestor.com/smart-contract/).
### Why 'Sovereign'?
The origins of digital money can be traced back to the Cypherpunk movement in the 1990s. This libertarian and anti-capitalistic group believed that in the ideal society, government involvement and interaction should be left to a minimum. They held the belief that strong online privacy and strong cryptography led to an improvement in how people interact with each other.
We are now living in a time where cryptocurrency has the ability to reshape how we interact with the world and the people in it. It's the first time in history mankind has been given the power to create its own currency and it is redefining the definition of "money".
Within all this change, it's important to remember the roots of cryptocurrency are from the foundational beliefs in individualism, freedom of choice, voluntary association, and personal sovereignty.
### How much is Your 'Plan B' worth (in 5 years)?
Cryptocurrencies have the unique ability to grow exponentially large in a short period of time as recent history has shown us. And let us not forget, [Bitcoin](https://altcoininvestor.com/bitcoin/) is only 14 years old.
Bitcoin has gone from under a penny to over $20,000\. As we have watched the rise and fall and rise again of Bitcoin and the rest of the cryptocurrency market, what is very clear is this market is going to continue to grow and evolve.
Either way, cryptocurrency is here to say - Are you in?
---
### BlockPass (PASS)
URL: https://altcoininvestor.com/pass/
Last updated: 2020-08-04T23:03:33.000Z
*Blockpass offers "KYC-as-a-Service", a unique reusable Digital IDentity (DID) to solve user verification necessary in many regulatory, government and business environments.*

## How the Blockpass (PASS) Works:
Blockpass provides a streamline **Know Your Customer** (KYC) and Anti-Money Laundering (AML) verification to third parties. Blockpass offers identification verification for both individuals and businesses.
### How the Blockpass (PASS) Token is Used:
PASS tokens are used both as discount vouchers for merchants and rewards in Blockpass Proof of Verification Rewards protocol. These tokens are also available on select exchanges.
## Investment Analysis:
There are many ways to determine the valuation of cryptocurrency and most often it's marketing trading price is not an accurate reflection. For our investment analysis, we take a view of the long-term market demand these projects are involved in as we tend to take a long-term view of cryptocurrency investing.

### Token Demand
The Blockpass token is exchanges for Blockpass IDN. The role of Blockpass IDN is to sell the tokens to Official Distributors, who then resell PASS tokens to their customers. All distributions of PASS tokens occur from distributors to users. PASS tokens provide utility in two ways, as discount vouchers for merchants, and rewards in Blockpass’ Proof of Verification Rewards protocol. Using PASS as payment, merchants are eligible to receive up to a 50% discount on KYC Connect services.
## Market Price
At the time of writing this token is ranked #1,469 (market capitalization), trading price of $0.001, all-time high of $0.08 and all-time low of $0.005 and a 24 hour volume of only $2,400.

### Market, Demand & Growth
From September 2019, the price of this token has continually dropped to it's near lowest levels of $0.005\. With near all-time low and a clear increase in demand in the upcoming years for this type of service this looks to be highly undervalued (primarily due to the very low volume).
### Management, Team & Governance:
The project is lead by Adam Vaziri, supported by strong marketing team, development and advisory team. The project is partnered with many well known large organisations including BitFinex, Waves and IDEX.
### Technology & Offering
In this use-case the blockchain is used to store and verify personal identity with the transaction currency being a PASS token. Although this is not a revolutionary use of blockchain, this technology perfectly filfills this need.
---
## How to Buy The BlockPass Token (PASS)
At the time of writing, this token is only available on two exchanges, HitBTC and Bitfinex.
### Wallets & Hardware Storage:
This coin is not currently supported by any hardware wallets.

## Overall Investment Assessment
There is a clear need and demand for identity verification and this is easily seen with the adoption of such technology within the cryptocurrency space, especially exchanges. As we continue to move to a more global world, identification, KYC and verification will certainly be in demand. Blockpass has a solid team and already agreements with many major players in the market and continuing to grow their offering and customer base.
As the demand and need for personal identification and verification grows, there will be clear leaders in this industry, however it's still too soon to tell however Blockpass is certainly a contender.
### Should I buy the BlockPass Token (PASS)?
It's necessary to state we don't encourage nor discourage the purchase of any cryptocurrency and when making an investment choice its important for all individuals to do your own research. Cryptocurrencies are highly volatile, unregulated and have the potential to go to zero. As the cryptocurrency adage goes, *"don't invest what you can't afford to loose".*
---
## Read Our Latest Report
If you enjoyed this analysis you can read our weekly updates in our [Altcoin Report](https://altcoininvestor.com/tag/altcoin-report/), published every Sunday. In these reports we cover our altcoin findings for the week.

---
### Disclaimer:
*The information in this report has been independently sourced and even though the best attempts to report accurately, we do not provide assurances on this information. This report is provided "as is" and it is up to the reader to do their own due diligence and research. Altcoin Investor is not associated or affiliated with any organisation and the opinions are strictly that of the author. This information should not be relied nor is it to be treated as financial advice.*
### Minter (BIP)
URL: https://altcoininvestor.com/bip/
Last updated: 2020-08-09T17:18:23.000Z
*The Minter network offers reward and loyalty based cryptocurrencies to online user communities. The Minter Network offers online creators and online businesses an easy-to-use cryptocurrency and a new way of interacting with their customers as well as the ability for users to very quickly create their very own cryptocurrency.*

## Market Demand:
Loyalty programs have a long history dating back to the 1700's however it wasn't until the mid 1980's that loyalty programs got their footing. Today almost every brand has their own loyalty program and well known programs include Amazon Prime, Starbucks Rewards, Apple (Pay), Marriott's loyalty program, Target (REDcard) and many more.
User attention, interaction and loyalty is becoming monetised (see [BAT](https://altcoininvestor.com/bat/)) there is certainly a need for a loyalty based system online. We like this project because of it's ability to very quickly allow developers to create their very own cryptocurrency.
## Product Market Fit:
Loyalty programs of the past all suffered from the same issues that plagued digital currency; double spend and centralisation. There is a massive need in the market for this type of project. Their audience is worldwide and applicable to almost any person or business that has an online community or following.
There really is no limit to the use case or number of coins or market this can apply to. Currently minter has created fan coins, reward based coins, fan coins, game credit, loyalty points, etc. The number of uses is limited only by ones imagination. For developers and entrepreneurs, the Minter blockchain also supports multiple client-side apps including iOS/Android wallets, Chrome extension, web apps, etc.
---
## Minter Trading Price Analysis
At the time of writing this token is ranked **#246** (market capitalization), trading price of $0.007, all-time high of $0.048 and all-time low of $0.0027 and a 24 hour volume of only $509,208.

Until a few months ago, the Minter network was near it's lower end values and with the strong ecosystem and community we believe this coin is currently highly undervalued.

**Website:**
At the time of writing, this token is only available on a few exchanges including Bithumb Global, Hotbit and CITEX.

## Should I buy Minter (BIP)?
Investing is a personal choice and investors should consult with experts when making financial decisions. It's important to note cryptocurrencies are highly volatile, unregulated and have the potential to go to zero. If this doesn't discourage you and would like to know if Minter made it to our shortlist, check out our weekly **Altcoin Reports**.
---
## Read Our Latest Reports...
If you enjoyed this analysis you can read our weekly updates in our [Altcoin Report](https://altcoininvestor.com/tag/altcoin-report/), published every Sunday. In these reports we cover our altcoin findings for the week.

### Disclaimer:
*The information in this report has been independently sourced and even though we have made the best attempts to report accurately, we do not provide assurances on any of this information. This report is provided "as is" and it is up to the reader to do their own due diligence and research. Altcoin Investor is not associated or affiliated with any firm and the opinions are strictly that of the author. This information should not be relied nor is it to be treated as financial advice.*
### DigiByte (DGB)
URL: https://altcoininvestor.com/dgb/
Last updated: 2022-02-12T06:53:50.000Z
*DigiByte is a highly scalable peer-to-peer digital currency that enables industry-leading transaction speeds with negligible fees. DigiByte offers a highly robust means of making digital payments, supports a strong ecosystem and is the longest running cryptocurrency in the world .*
---
DGB is one of the few forward-thinking blockchains that is not merely limited to being used as just a digital currency (despite the fact that DigiByte truly excels in this area over and above every other Proof of Work blockchain), but rather as a multi-functional and highly purposed blockchain.
## Market Demand:
According to a survey by bitFLyer, because of the corona-virus crisis, Europeans trust more in the future of cryptocurrencies: 66% of those surveyed believe that this will be a feasible alternative in the next ten years.
By the year 2021, eCommerce is expected to generate $4.5 trillion in sales per year and make up 16% of total retail sales. By the year 2040, it’s estimated that 95% of all purchases will be through eCommerce.
As an option for the future, cryptocurrencies seem to be the perfect payment method in ecommerce as this is a digital transaction system.
Secure and battle-tested in the wild for 6 years, DigiByte has proven that its security as a blockchain is for real. Its most unique feature is the fact that the blockchain network uses five mining algorithms when most only use one. These five different mining algorithms are meant to prevent mining centralization and make the network more secure and decentralized.
In addition to having five mining algorithms, DigiByte also claims to have the “most advanced difficulty stability” of any current blockchain. The advanced difficulty adjustments are meant to protect the DigiByte blockchain from malicious attacks and further improve security.
A new DigiByte block is mined approximately every 15-18 seconds vs 10 minutes for Bitcoin. It’s 40 times faster than Bitcoin, and its five-year lifespan so far easily outpaced Bitcoin’s transactions in throughput alone. At 280 transactions per second, DigiByte hasn’t slowed in its old age, proving it’s a more scalable payment and mining option than Bitcoin.

## The Team
**Jared Tate** is the founder and creator of the DigiByte blockchain. Jared has been involved with Bitcoin since 2012\. In the fall of 2013, he decided to make several improvements to the Bitcoin core protocol which culminated in the launch of DigiByte in 2014\. DigiByte has pioneered many blockchain enhancements such as DigiShield, MultiShield and MultiAlgo which have all now been implemented by many other blockchains. DigiByte was also the first major blockchain to adopt SegWit.
Tate has been invited by MIT, Harvard and the US Capitol to speak on blockchain tech. He is also the co-author of the book Blockchain 2035 The Digital DNA of Internet 3.0, which is the first book written by a blockchain founder.
The development team behind the digibyte cryptocurrency project has received $250,000 in private investment via Crunchbase.
Everyone that is working on the DigiByte blockchain is an unpaid volunteer who devoted their time and skills to a project they believe in.

## Price Analysis for DigiByte (DGB)
DGB has **Rank #48** with Market Cap of **$330 Million**.
Digibyte has a circulating supply of 14 Billion coins and a max supply of 21 Billion coins. (1 BTC = 450M DGB). All-Time High was $0.135235 over 2 years ago and is down -82% compared to the current price of $0.02433264\. All-Time Low was $0.00003099 5 years ago and is up 75000% compared to the current price. 24-hour trading volume is $7,674,266.

Based on the 90-Day chart, the price is sitting on the support level at 0.024\. That indicates the price will go up to 0.030 levels soon, which is also the resistance level. If break out happens from there expect 0.037.

Based on the 1-year chart, we can notice that in the last couple of months there is a dramatic increase in the trading volume which correlates with the increasing price of DGB at the same time. Very bullish chart which indicate the price will explode.

Bittrex is the current most active market trading it.
You can find DGB also on Binance.
---
## Upcoming Events
- DigiByte plans to further replace one of the original mining algorithms with another GPU-specific mining algorithms, again increasing the participation from home-users and casual miners. In addition, this will further strengthen the distribution of the blockchain, encouraging users to mine using the DigiByteCore application.
- The biggest and most important upcoming plan for DigiByte will be growing DigiAssets. If all goes according to plan, an entire ecosystem of dapps and ICO will be an integral part of the network.

## Should I buy Binance (BNB)?
DigiByte, in 5 years from now, with its forward-thinking approach, viability, development, and application of its technology, sustainable growth of project, team and community, I don’t think we need that crystal ball to predict the future with reasonable accuracy.
It’s not the Belle of the Ball, but DigiByte checks a lot of the right notes in a cryptocurrency. Its proven to be scalable and capable of processing much faster in real-world usage than many popular choices. DGB is a darling in the crypto media, and it’s easy to see why
Should you buy into this coin? Investing is a personal choice and investors should consult with experts when making financial decisions. It's important to note cryptocurrencies are highly volatile, unregulated and have the potential to go to zero. If this doesn't discourage you and would like to know if this coin made it to our shortlist, check out our weekly ****Altcoin Reports**.
---
## Read Our Latest Reports...
If you enjoyed this analysis you can read our weekly updates in our [Altcoin Report](https://altcoininvestor.com/tag/altcoin-report/), published every Sunday. In these reports we cover our altcoin findings for the week.

### Disclaimer:
*The information in this review has been independently sourced and even though we have made the best attempts to report accurately, we do not provide assurances on any of this information. This analysis is provided "as is" and it is up to the reader to do their own due diligence and research. Altcoin Investor is not associated or affiliated with any firm and the opinions are strictly that of the author. This information should not be relied nor is it to be treated as financial advice.*
### uPlexa (UPX)
URL: https://altcoininvestor.com/upx/
Last updated: 2020-08-15T19:24:26.000Z
*uPlexa is a project that harnesses the computing power of the IoT device market and offers decentralized power and anonymous p2p payment system that supports the payment of IoT services and devices.*
---
## Market Demand:
The Internet of Things (IoT) market is expected to grow by double digits over the next few years. There were are over 9 Billion IoT devices in the world in 2018 and that number is expected to increase by 20+ Billion in 2020\. The goal for the project is to be able to provide a source of income that will help to off-set the electricity cost of the IoT devices. If the company is successfully achieve this and with a market of over 31 billion IoT devices, uPlexa has potential for spectacular growth.
This is possible because of uPlexa’s ability to use Internet of Things devices to mine blocks. This, in turn, powers the network as well as processes transactions. To achieve this goal, uPlexa relies on a modified CryptoNote algorithm that allows for profit with IoT mining. At the same time, it prevents centralized mining by preventing ASIC technology.
By mining using IoT devices, those devices could use a small percentage of the resources you do not currently use. That way, they could make enough money to pay for part of the electricity they use on a regular basis.
In addition to the goal of delivering fungible IoT mining, uPlexa aims to develop multiple platforms. Based on uPlexa, these platforms will complement its objectives, which are fungiblity, untraceable transactions, and privacy. The first platform focuses on the e-commerce industry, which is valued at over $22 trillion. uPlexa will build and integrate an e-commerce platform that is anonymous and based on uPlexa.
Another goal is to establish partnerships with various IT service providers as a way to ensure anonymous service payments on uPlexa. With anonymous service payments, service providers cannot sell specific client data to the government or other companies. This should improve security by reducing the potential impact of hackers or even government spy programs.
Overall, the (international) market demand and potential usage for this coin can easily exceed the number of people on the planet.
## The Team
**QuantumL3aper (Kyle Pierce)** is Co-Founder & Lead Developer. Also he is the the largest singular investor in uPlexa but he doesn't own uPlexa as an entity. Another Co-Founder is **meandertal** charged for public relations. **blk ( Blake Andersen )** is Lead Developer of eCommerce. **CryptoMiningKB**is Lead Support Specialist. Devs community are all people who contribute code to projects without the expectations of immediate payment from the “core team”, essentially, like-minded individuals.
uPlexa is funded by a 7% premine “in order to continuously fund its large amount of infrastructure, bounties, airdrop, and team efforts.” UPX has very stable Reddit, Twitter and Facebook community about 5000 members. They have two social media managers and a social community manager and posting across all of their networks at least once per day.
## Price Analysis for uPlexa (UPX)
It has Rank #986 according to market cap which is $514,540 . Numbers for circulating supply are 2,335,711,320 / 10,500,000,000

All-time high was $0.00103438 ($1.6M MC ) on Jun 22, 2019 and All-time low is $0.00004616 . Currently the price is down 78% from the all-time high but is in clear uptrend based on 30-day chart.

uPlexa coins can be purchased directly from STEX or Graviex with Bitcoin. However, if you do not already have Bitcoin, and would rather use your local fiat currency to make your purchase, your best option would be through STEX.
## Upcoming Events
**Q3 – 2020** eCommerce Platform Launches in BetadVPN Apps Launch for iOS & AndroidLaunch of PlexaPay
**Q4 – 2020** uBlitz Goes Live (Near-instant private transactions)Possible PoW upgrade/shiftPlexaNet API Release
**Q1 – 2021** Implementation of Post-Quantum Algorithm

## Should I buy uPlexa (UPX)?
uPlexa allows for p2p payments based on the Internet of Things. It also uses a unique blockchain and technology that can make mining using the Internet of Things profitable.
With the PlexaNetOrg VPN users are able to bypass such restrictions and it offers some of the least expensive VPN services in the world.
In the future, uPlexa will continue to expand, creating various platforms for utility, starting with e-commerce. The team is also working towards allowing anonymous service payments to prevent the use or sale of private data.
Investing is a personal choice and investors should consult with experts when making financial decisions. It's important to note cryptocurrencies are highly volatile, unregulated and have the potential to go to zero. If this doesn't discourage you and would like to know if uPlexa made it to our shortlist, check out our weekly **Altcoin Reports**.
---
## Read Our Latest Reports...
If you enjoyed this analysis you can read our weekly updates in our [Altcoin Report](https://altcoininvestor.com/tag/altcoin-report/), published every Sunday. In these reports we cover our altcoin findings for the week.

### Disclaimer:
*The information in this report has been independently sourced and even though we have made the best attempts to report accurately, we do not provide assurances on any of this information. This report is provided "as is" and it is up to the reader to do their own due diligence and research. Altcoin Investor is not associated or affiliated with any firm and the opinions are strictly that of the author. This information should not be relied nor is it to be treated as financial advice.*
### Investing Strategy
URL: https://altcoininvestor.com/strategy/
Last updated: 2020-09-19T20:41:56.000Z
Welcome to the fascinating world of blockchain technology and cryptocurrency investing. Whether you are a novice or expert investor make no mistake, the cryptocurrency market is like no other market out there.
In this virtual currency world, triple digit gains and losses can happen within a 24 hour period. There are investments that offer incredible ROI's (+9,000% ETH) and there are also those investments that fall to absolute zero. In this online virtual cryptocurrency world, almost anything is possible.
So it would be a prudent investor that placed knowledge and education ahead of profits when looking to enter this market. The best altcoin investing strategy starts with an education in cryptocurrency. This starts with learning the rules to the crypto game.
## It's a Different Animal
Cryptocurrencies and markets they operate in are completely different than what we are used too. Although common terminology is shared between cryptocurrency and the traditional stock markets, they are completely distinct animals and operate much differently.
The cryptocurrency market is unregulated, uncontrolled and to a large extent unmonitored; so almost anything can happen in this market. It can be said the cryptocurrency market is the closest to *a free market economy* that can exist with any free market, also susceptible to free market pressures.
Being free market they are subject to manipulation. Given that many translations are anonymous and there is no oversight or body, pretty much anything goes. Cryptocurrencies don't have any intrinsic value, other than a value which is prescribed to it by the market. And if the market decides it's not worth anything, so be it.
To compare cryptocurrency trading to stock market trading is a dangerous presupposition. Over the last decade the industry has borne witness to the cryptocurrencies unique, erratic, eccentric and belief defying feats that do not follow any standard patterns or trends.
The education in altcoin investing starts with learning that cryptocurrencies is its own animal and plays by it's own rules.

## The Autodidact Approach Altcoin Investing
An autodidact person who is a person who is self-taught. This skill is The autodidactic approach starts with education, then suiting the approach to your personality and then do, learn and repeat. To be successful, the investor needs to be willing to invest a lot of time into education.
### Self-Taught Investor:
Any courses or training material created in this industry is obsolete the moment it's published. This is a self-educated series. Investors are self-taught. Cryptos will take time as there is a lot to learn, regardless if you want to be a day trader or periodic investor, there is a tremendous amount to learn with cryptocurrencies and you have to be willing to invest the time into this education.
### Understand Your Investing Style & Comfort:
In addition to the time commitment, your personality will have a large say in the type of investor best suited for your personality. Some individuals are well suited as day traders while most individuals are well suited for periodic trading. It's important and necessary to have your investing style match your personality.
### Just do it!
For the beginners, there is no excuse not to start trading today. There are many ways to earn cryptocurrency ([by just by surfing the net](https://altcoininvestor/bat)) and since cryptocurrency is open to everyone, there is no excuse not to even have your own wallet. In this online world it's all about experience and knowledge.
---
### Looking for 'Diamonds in the Rough'?
*Diamonds in the rough* are those cryptocurrencies that have tremendous potential however it's not yet recognised by the market. These are projects that are rough around the edges and have the potential for greatness.
These gems are not found on the popular exchanges. Rather, they are most often found on smaller foreign exchanges. Sometimes these projects don't have a marketing team or their user interface isn't intuitive. In any case, all they need is a good polishing.

With over 10,000 cryptocurrencies and new ones added daily, there are not shortages of projects to choose from. Within this sea of new and obscure altcoins only a few gems exist and finding these *diamonds in the rough* takes a lot of time and patience. It can also be a very rewarding skill to master. However, if you don't have the time or patience to do your own research, we make our research and findings available to our members.
---
## Read the Latest Report...
If you enjoyed this article, read our market updates in the latest [Altcoin Report](https://altcoininvestor.com/tag/altcoin-report/), published every Sunday. In these reports we cover our Altcoin picks for the week.

### ITAM Games (ITAM)
URL: https://altcoininvestor.com/itam/
Last updated: 2020-08-25T06:02:37.000Z
*ITAM is the world's leading blockchain mobile gaming platform built on top of the EOS.IO protocol. EOS-based project offers the players to put their achievements, leaderboards and in-game assets on the blockchain platform and trade them.*
---
## Market Demand:
In 2019, the gaming industry generated $120 billion in revenue and experts predict it could reach $200 billion within two years - 100 million viewers tuned in to watch players compete in the World Championship of the game League of Legends, a larger haul than the telecast of the Super Bowl. And by 2021, it’s projected that 2.7 billion people — about one-third of the global population — will be gamers.
Among various types of games, the smartphone games market is expected to increase by $88.2 billion, or 49%, of the total market size the end of the year 2021\.
Itam Games has created an ecosystem, which includes a store and exchange, in which users can trade their in-game digital assets — or nonfungible tokens (NFT) — such as achievements, leaderboards, items and accounts.
Itam says it aims to attract mobile game developers by offering them a special console by which they can register any game and get access to blockchain technology within the company's ecosystem.
## The Team
**Asung Gill** is **CEO**. Asung is a developer and executive who has led many large-scale development projects (SIs) for 13 years and has been a CEO and CTO of several companies. **Ha-Seop Jeong** is **Executive Vice President**. Ha-Seop received his degree in Electrical Engineering(Master of Science) from Seoul National University in 1999\. Thereafter, he spent 11 years in the game industry such as Neowiz Games, Aina, and NexonKorea as a planning director and director of new game development division. **Byeong-Su Kim**is **Game Department Director.** He majored in computer science at the Air Force Academy in Korea. **Ho-Seok Yang** is **CSO**. Ho-Seok is a serial entrepreneur who founded three startups and ex-vice-president of Fenox Venture Capital Korea. **Dongjun Kwon** is **CTO**. Kwon is a development expert with 12 years of various development and career experiences under his belt.
Game developers are also an important part of the ecosystem that provides the main content of ITAM Games. The game developer will receive 80% of the content purchase revenue of the game users and will receive it through the ITAM Wallet for Developers. For games that have inter-user tradable ITAM NFTs, they can earn additional revenue equivalent to 30% of the trading fee.
## Price Analysis for ITAM Games (ITAM)
ITAM is traded on Upbit, a centralized cryptocurrency exchange located in South Korea. Also it is traded with ITAM DADEX (Digital Asset Decentralized Exchange), a decentralized service that allows user to trade their acquired ITAM NFTs. Blockchaintechnology ensures the reliability, transparency, and integrity of trading on ITAM NFTs. ITAM DADEX will provide user-friendly UI/UX services through filter functions that sort according to the game developer’s genre, price, rarity, etc.

Supply is 2.5 billion ITAM Tokens. All-Time High was 4 months ago $0.04354415 is -80.2% down compared to today’s price. All-Time Low was 20 days ago $0.00224901 and is 282.9% up compared to today’s price. Trading Volume is $711,908\. Price on trend line is in slight uptrend based on 30-Day Chart.

All-time high was $0.00103438 ($1.6M MC ) on Jun 22, 2019 and All-time low is $0.00004616 . Currently the price is down 78% from the all-time high but is in clear uptrend based on 30-day chart.
## Upcoming Events
The startup mentioned it has more than 50 traditional mobile games to be launched within this year. The team works on NFT FARM service, currently in beta version.

## Should I buy ITAM Games (ITAM)?
As ITAM ecosystem expands, the number of players from all around the world will increase. Any sort of global platform will inevitably receive proposals and offers from advertisers, and game related promotion collaborations. Advertisers wishing to advertise within the ITAM platform, or in-game advertisements, should procure ITAM Tokens to make advertisement and collaboration. ITAM Tokens from these parties and advertisers will be used to reward event participant users and game developers.
Investing is a personal choice and investors should consult with experts when making financial decisions. It's important to note cryptocurrencies are highly volatile, unregulated and have the potential to go to zero. If this doesn't discourage you and would like to know if ITAM Games made it to our shortlist, check out our weekly **Altcoin Reports**.
---
## Read Our Latest Reports...
If you enjoyed this analysis you can read our weekly updates in our [Altcoin Report](https://altcoininvestor.com/tag/altcoin-report/), published every Sunday. In these reports we cover our altcoin findings for the week.

### Disclaimer:
*The information in this report has been independently sourced and even though we have made the best attempts to report accurately, we do not provide assurances on any of this information. This report is provided "as is" and it is up to the reader to do their own due diligence and research. Altcoin Investor is not associated or affiliated with any firm and the opinions are strictly that of the author. This information should not be relied nor is it to be treated as financial advice.*
### Ormeus (ECO)
URL: https://altcoininvestor.com/eco/
Last updated: 2020-08-27T06:18:08.000Z
*This token is the underlying ‘gas’ that protects and powers the Ormeus Ecosystem. It runs a cross-chain, multi-factor data verification and encrypted whitelisting standard known as Blockchain Trust Rating, (BTR). ECO is the brain of the ecosystem and allows businesses and users to conduct commerce within the smart economy with full security and trust.*
---
## Market Demand:
With e-retail sales accounting for 14.1% of all retail sales worldwide, ecommerce continues to grow at a speedy rate despite global economic uncertainty. What’s more, forecasts say that these figures will keep growing and reach 22% in 2023\. Experts predict that retail ecommerce sales will reach $4.13 trillion in 2020.
ECO token provides businesses and users with the necessary resources and connections to enjoy a dependable digital life. ECO is the underlying ‘gas’ that protects and powers the Ormeus Ecosystem, processing compulsory services such as De-Identified Secure ID, Reusable Ecosystem KYC, Cross-Chain Relationship Authentication, Credit Rating, Instant Retail Passport and Captive Business Insurance.
Apart from running these type of services, ECO is also required to process ‘ground-rent’ and business fees, onboarding new corporations or users wishing to operate in the smart economy. And when bad actors such as ‘SilkRoad’ businesses attempt to gain access, ECO will block access, destroy and spread the word.
## The Team
John Barksdale is the lead investor. Last 5 years he works as Advisor and sales lead at iAM Marketing a "white-glove," private luxury, professional services, boutique marketing firm. Other team members are young and promising blockchain developers and programmers. It’s obvious the biggest advantage is marketing sector; they are most experienced in that segment.
The collaboration between Binance Chain and the Ecosystem supports significant interoperability to create what will become the biggest multi-business network in the world. Not only is Binance one of the largest centralized cryptocurrency exchanges, the newly released Binance DEX is also one of the most promising decentralized exchange solutions.
The team is funded by USD$250 Million cryptocurrency mining business which secures new digital money system Ormeus Coin, (Orme).
Community members are mainly on twitter and telegram with over 10.000 followers.
## Price Analysis for Ormeus (ECO)
Max supply is 200 billion ECO coins (1 BTC = around 3 million ECO). All-Time High was 1 year ago and it was $1.54\. All-Time Low was 3 months ago and it was $0.00009885 and is 3816.2% up compared to today’s price. Trading Volume is $938,552.

Ormeus Ecosystem is traded on three centralized cryptocurrency exchange which include BW.com Bilaxy and FinexBox. Bilaxy is the current most active market trading it.

Based on 30-Day Chart price is in clear uptrend. You can ride the wave but only short time investing. It is still very risky to invest long-term, you have to wait for the price consolidation first.
## Upcoming Events
- AI Algorithmic Decentralized Project - Q3 – 2020
- EcoCelium Phase 1 - Q3 – 2020
- DAO Completing Governance WhitePaper - Q3 – 2020
- DAO Market Place - Q4 - 2020
- ORV Version 3.0 - Q4 - 2020
- ECO listing on HitBTC - Q4 – 2020

## Should I buy Oremus Ecosystem (ECO)?
The Oremus Ecosystem focuses on the true meaning of connection via side chain technology to form a highly organized business economy. Each niche industry has its own dedicated multi-layered side chain to fulfil its business goals whilst engaging in cross-chain interactions and thus supporting network currencies.
Each chain can accurately store its own data and upload it to the larger parent chain to realize cross-chain query through data union. Entire network architecture will connect hardware, devices, terminals or services for connection with the Ormeus ‘Internet of Assets’.
The Ecosystem is partnering with Binance Chain in a move designed to exploit better performance, usability, and liquidity. All of this amounts to the co-integration of big data with people, services, money and businesses in a new blockchain era - a new digital life.
Investing is a personal choice and investors should consult with experts when making financial decisions. It's important to note cryptocurrencies are highly volatile, unregulated and have the potential to go to zero. If this doesn't discourage you and would like to know if Ormeus Ecosystem (ECO) made it to our shortlist, check out our weekly **Altcoin Reports**.
---
## Read Our Latest Reports...
If you enjoyed this analysis you can read our weekly updates in our [Altcoin Report](https://altcoininvestor.com/tag/altcoin-report/), published every Sunday. In these reports we cover our altcoin findings for the week.

### Disclaimer:
*The information in this report has been independently sourced and even though we have made the best attempts to report accurately, we do not provide assurances on any of this information. This report is provided "as is" and it is up to the reader to do their own due diligence and research. Altcoin Investor is not associated or affiliated with any firm and the opinions are strictly that of the author. This information should not be relied nor is it to be treated as financial advice.*
### Caspian (CSP)
URL: https://altcoininvestor.com/csp/
Last updated: 2020-08-29T00:30:25.000Z
*Caspian is a full-stack crypto asset management platform tying together the biggest crypto exchanges and OTC desks in a single interface. The platform offers compliance, trading, algorithms, portfolio and risk management, and reporting. Caspian is building an ecosystem that enables sophisticated traders to operate more efficiently and improve their performance.*
---
## Market Demand:
The last report published by the Cambridge Centre for Alternative Finance concluded that there were more crypto traders than ever, with more than 35 out of 139 million cryptocurrency accounts ID-verified users, which could be considered as regulated exchanges’ users (Coinbase,etc.), and therefore considered as active crypto traders. This figure doubled since 2017 and cryptocurrency gained 17 million verified users last year.
The Caspian token will be used to buy access to Caspian; users that pay in the token will get a discount over those that don’t.
Caspian launched in March 2018 with its first-of-a-kind cryptocurrency investment platform that covers the entire life cycle of a trade. Today, it provides a single interface into over 30 spot exchanges and seven derivatives exchanges from a single interface, a complete suite of sophisticated trading algorithms, real-time and historical PNL and exposure tracking and is known for its leading professional customer service.
## The Team
Caspian’s senior management team brings decades of combined experience in finance and technology. Members of the Caspian team have held senior roles at well-known investment firms and technology companies, and several were early adopters of blockchain technology. In their respective roles at TORA, they have proven their ability to work effectively together building financial and trading solutions that have achieved major success.
Robert Dykes is a CEO & Co-founder. He has served as Tora CEO for the past 14 years. Prior to that Robert spent 11 years in the enterprise software and high-tech industry in Europe, North America, and Asia at such companies as WebPartner and Audiosoft. Robert holds a B.A. in Economics from Princeton University.
The CSP rewards developers who offer their apps for free. Caspian will incentivize third-party development on the platform though grants, bounties, and a rewards engine. This will allow the (vetted) emergence of new features on the platform, complementing the base features with a richer and more attractive functionality.
Token distribution is: 40 percent are available for the token sale, with 32 percent available in the reserve for various future uses. The rest will be set aside for staff, advisors and the like.
Very reliable and trustworthy team, one of the better in the crypto world.
## Price Analysis for Caspain (CSP)
Max supply is 1 billion CSP tokens (1 BTC = 1.6 million CSP). All-Time High was $0.01733985 over a year ago and is down -59.9% compared to current price. All-Time Low was $0.00177457 and is up 291.8% compared to current price. Trading Volume is $205,645.

Based on 30-Day chart, after breaking out recently, the price is currently in consolidation mode. It is trying to break the resistance level which around the current price. If this happen if the price break out the 0,008 level you can catch the train because later will be FOMO.

KuCoin is the current most active market trading it. The Caspian coin is apired with both BTC and ETH. Other exchange, worth to mention, where you can trade CSP is MXC.
## Upcoming Events
Caspian is oriented on making as much partnerships as it can. Also there is plan for integration with other trading platforms. One of the key goals at Caspian is looking across the complicated, fragmented crypto markets and trying to make it easier for institutional investors to view and access the entire market.

## Should I buy Caspian (CSP)?
Caspian have WON 'Best Crypto Trading Platform' at the Fund Intelligence Tech & WSL Awards 2020!
Monthly trading volumes on Caspian’s full-stack crypto trading, portfolio and risk management platform have been consistently over $1billion for the last few months. A clear indication that previously trigger-shy institutional investors may now be looking more intently at opportunities to trade, casting aside memories of 2018’s “winter of crypto”.
Investing is a personal choice and investors should consult with experts when making financial decisions. It's important to note cryptocurrencies are highly volatile, unregulated and have the potential to go to zero. If this doesn't discourage you and would like to know if Caspian (CSP) made it to our shortlist, check out our weekly ****Altcoin Reports**.
---
## Read Our Latest Reports...
If you enjoyed this analysis you can read our weekly updates in our [Altcoin Report](https://altcoininvestor.com/tag/altcoin-report/), published every Sunday. In these reports we cover our altcoin findings for the week.

### Disclaimer:
*The information in this report has been independently sourced and even though we have made the best attempts to report accurately, we do not provide assurances on any of this information. This report is provided "as is" and it is up to the reader to do their own due diligence and research. Altcoin Investor is not associated or affiliated with any firm and the opinions are strictly that of the author. This information should not be relied nor is it to be treated as financial advice.*
### Smart Mesh (SMT)
URL: https://altcoininvestor.com/smt/
Last updated: 2020-09-04T20:18:00.000Z
*SmartMesh is a blockchain-based IoT underlying protocol that enables smartphones, onboard devices, and other devices to connect without the internet. It is the future direction of off-internet communication, off-internet payment, and off-internet gaming.*
---
## Market Demand:
Two years ago protests broke out across major cities in Iran after the country’s government began raising the gasoline prices. The government responded to these protests by staging an internet blackout, blocking protesters from communicating with one another, or with anyone outside of the country.
Much of the same is happening in countries like Russia, Ethiopia, North Korea, and Venezuela. Similarly, China built its national Internet with such controls implemented from the beginning.
There are 3.9 billion people in the world without regular access to the Internet. In the world's poorest 48 countries, 90% of the population has no access to the Internet. SmartMesh will change the situation for those people with the roll-out of SmartMesh App. People can connect to each other to form a local mesh network. Within one local mesh network, as long as that one of the mobile phones has internet connectivity, everyone on the Mesh will be able to connect to the world.
SMT is the absolute driving force of Spectrum, a distributed application platform. It is the main chain of the Spectrum in the SmartMesh ecosystem. SMT is used to incentivize SmartMesh Mesh node contributors and to purchase products and services in the SmartMesh Mesh ecosystem. When users connect their SmartMesh phone nodes to the SmartMesh mesh network, they are rewarded with the SMT tokens. The longer the user stays on the network, the more SMT that they amass on the SmartMesh Blockchain.
## The Team
**Henry Wang** is the founder CEO with the previous 10 years of experience working as CEO and chairman of Napp blockchain NextApp. **Maxim Prishchepo** is the Architect and has 15 years of experience in the FinTech area along with financial information system security and it helps greatly in blockchain projects.
The SmartMesh developer community wants to attract people from around the world who are interested in working on Dapps, AI, blockchain, network hardware and software and much more. There is a vast array of possibilities for developments that range from fintech, productivity, games, entertainment, security, science, culture and they are rewarded from 2000 to 5000 SMT tokens.

## Price Analysis for Smart Mesh (SMT)
It has Rank #435 with a market cap $5,702,453\. It has a circulating supply of 1.7 Billion coins and a max supply of 3.14 Billion coins (1 BTC = 2.3million SMT). All-Time High was $0.235215 two years ago and is down -98% compared to the current price. All-Time Low was $0.00187059 six months ago and is up 164% compared to the current price. 24 Hour Volume is $441,402.

Based on the 30-Day chart the price is horizontal but if we look at the 6-month chart we can notice the ascending triangle being formed which is a strong bullish continuation pattern. If the breakout happens we might see all-time high levels.

It is currently trading on 11 active markets. Gate.io is the current most active market trading it. Other notable exchanges are Huobi Global and HitBTC.
## Upcoming Events
- Photon optimisation related work.
- Continued to analyse the incentives for Photon to support IoT data delivery, discussed the suitability of third-party entrusted services in this scenario, and prepared for the subsequent communication-based micropayment ecological application.
- Discussed the upgrade of the Photon Token Network contract, considered further introducing a switch design to restrict access behaviour during the contract switching process, and prepared for the subsequent optimisation and upgrade of the Photon function.
- Analysed the related functions of submarine exchange, researched application scenarios, supporting services and security of lightning submerged exchange, and further expanded the optimisation direction for Photon.

## Should I buy SmartMesh (SMT)?
SmartMesh is a marketplace of nodes, like an Airbnb of smart phone nodes. Anyone with a smartphone can send text messages, photos, or voice to other nodes; and they are rewarded with tokens by helping transfer the data, and of course the data packets are encrypted.
To deal with daunting task like this, the biggest challenge is to transfer crypto tokens between mobile phones quickly so that people can share their nodes and get paid quickly, which was not possible on blockchain.
Investing is a personal choice and investors should consult with experts when making financial decisions. It's important to note cryptocurrencies are highly volatile, unregulated and have the potential to go to zero. If this doesn't discourage you and would like to know if Smart Mesh (SMT) made it to our shortlist, check out our weekly ****Altcoin Reports**.
---
## Read Our Latest Reports...
If you enjoyed this analysis you can read our weekly updates in our [Altcoin Report](https://altcoininvestor.com/tag/altcoin-report/), published every Sunday. In these reports we cover our altcoin findings for the week.

### Disclaimer:
*The information in this review has been independently sourced and even though we have made the best attempts to report accurately, we do not provide assurances on any of this information. This analysis is provided "as is" and it is up to the reader to do their own due diligence and research. Altcoin Investor is not associated or affiliated with any firm and the opinions are strictly that of the author. This information should not be relied nor is it to be treated as financial advice.*
### Universal Gold (UPXAU)
URL: https://altcoininvestor.com/upxau/
Last updated: 2020-09-08T23:53:34.000Z
*UPXAU is the only form of gold that is free to hold, government backed, spendable on a debit card and purpose-built to be accessible and affordable for virtually anyone, anywhere. Each Token represents 1 troy oz (31.10348 grams) of pure physical gold held at the Perth Mint in Western Australia.*
---
## Market Demand:
For the Gold, previous month was an all-time high with price crossing the magical $2,000 level. The trend continues to be positive for gold. The geopolitical tensions, and IMF (The International Monetary Fund) cutting global economic forecasts, will keep the prices in an uptrend. Many gold bulls have a target of between $2,100 and $2,300 for gold over the next few months.
The expectations of a bull run in gold extend beyond the near term. Over next 18-24 months gold prices might touch even $8000\. The underlying fundamentals have a lot to do with expanding central bank balance sheets, lower or negative interest rates in some cases, and lack of alternative asset space for returns. All this is helping push money into gold.
Since the inception of cryptocurrencies, there have been numerous attempts to produce a superior, digitized gold solution. But until now, no product has managed to combine all of the following properties in one offering:
- Zero storage and management fees
- Redeemable for physical gold
- Instant settlement
- State-backed guarantee on underlying assets
- No transfer fees
Leveraging transparent-value substantiation technology, the Universal Protocol Alliance has built a gold Token that opens up the largely opaque and OTC-dominated 20 trillion-dollar gold market to a far broader constituency. For the first time, virtually anyone, anywhere can easily invest in gold and spend their holdings as easily as cash.
---
## The Team
Co-Founder and Chairman is Dan Schatt. He is also member in other crypto project like Cred and Uphold. Behind this token is The Universal Protocol Alliance, group of like-minded blockchain companies with the goal of bringing +100 Million new users into cryptocurrency. Founding members are: Bittrex International, Uphold, Cred, Brave, Bitgo, Blockchain at Berekley, CertiK.
The UP Alliance has already successfully issued the Universal Dollar (UPUSD), Universal Bitcoin (UPBTC) and Universal Euro (UPEUR). All are wrapped tokens on the Ethereum Network and feature transparent value substantiation with a public record of the underlying collateral.
**The Perth Mint:** the trading name of the Gold Corporation, an entity wholly owned and guaranteed by the Government of Western Australia, with a long -term credit rating of AA+(S&P). It is the largest refiner of newly-minted gold in the world.

## Price Analysis for Universal Gold (UPXAU)
It has max supply of 3,812.56218 UPXAU.
1 UPXAU token = 1 GoldPass certificate = 1 ounce of physical gold from The Perth Mint.

As the price for UPXAU is fixated with the price of the Gold, we can look what is happening in the gold chart. Based on the 30-Day Gold Chart we can see that the resistance is at the all-time high $2069\. If gold can breakout this level we can discuss $10.000 in the next two years.
Universal Gold is available to buy and sell through Uphold and Bittrex.
Also during August, UP Alliance Member Cred began allowing users to stake UPXAU on CredEarn, so that they can earn interest on Universal Gold.
---
## Upcoming Events
- Gold is continuing its reign among not just precious metals, but alternative assets in terms of popularity. It seems that everyone wants a piece of gold as global uncertainty surrounding the pandemic should continue to keep prices afloat.
- Soon, users will be able to redeem UPXAU for physical bars of gold when staking the Universal Protocol Token (UPT), a utility token issued by the UP Alliance and available on Bittrex Global and Uphold.

## Should I buy Universal Gold (UPXAU)?
Instead of being limited in terms of what to do with the token, it can be spent like cash or other assets. Holders of the Uphold debit card can spend their UPXAU balance at any retailer accepting debit card payments, both online and in-store.
Users can verify the backing of every UPXAU token on a public blockchain. This process is made possible with the help of CertiK, a blockchain security firm. Offering this transparent verification makes UPXAU different from most other gold tokens.
This marks the first significant gold crypto token that has been backed by any government globally.
Investing is a personal choice and investors should consult with experts when making financial decisions. It's important to note cryptocurrencies are highly volatile, unregulated and have the potential to go to zero. If this doesn't discourage you and would like to know if Universal Gold made it to our shortlist, check out our weekly ****Altcoin Reports**.
---
## Read Our Latest Reports...
If you enjoyed this analysis you can read our weekly updates in our [Altcoin Report](https://altcoininvestor.com/tag/altcoin-report/), published every Sunday. In these reports we cover our altcoin findings for the week.

### Disclaimer:
*The information in this review has been independently sourced and even though we have made the best attempts to report accurately, we do not provide assurances on any of this information. This analysis is provided "as is" and it is up to the reader to do their own due diligence and research. Altcoin Investor is not associated or affiliated with any firm and the opinions are strictly that of the author. This information should not be relied nor is it to be treated as financial advice.*
### Monero (XMR): Project Review & Price Prediction
URL: https://altcoininvestor.com/xmr/
Last updated: 2023-10-25T20:35:58.000Z
## What is Monero (XMR)?
[Monero (XMR)](https://altcoininvestor.com/xmr/) stands as a testament to the original premise of cryptocurrencies, offering a decentralized and private digital currency that enables confidential financial transactions.
Launched in 2014, Monero has since ascended the ranks to become one of the most recognized privacy-focused cryptocurrencies in the market.
Unlike the [transparent nature](https://altcoininvestor.com/surveillance-coins/) of [Bitcoin's blockchain](https://altcoininvestor.com/bitcoin/), where transactions and wallet balances are publicly verifiable, Monero employs robust cryptographic techniques to conceal this information, ensuring the anonymity of its users.
Through the use of stealth addresses and Ring Confidential Transactions (RingCT), Monero effectively hides the identities of the sender and receiver, as well as the amount involved in a transaction.
The inherent privacy and anonymity features of Monero contribute to its characteristic of fungibility, which is the property that ensures each unit of the currency is interchangeable with any other unit.
In a world where financial privacy is becoming scarce, and where even Bitcoin can have its transactions traced and linked to individuals, Monero's proposition of privacy preservation holds a unique appeal.
This fungibility is a crucial aspect that shields Monero from the potential blacklisting of coins associated with previous illicit activities, a problem that other cryptocurrencies like Bitcoin face.
---

## Should you Invest in Monero (XMR)?
Crypto investors might consider adding Monero to their portfolio for several compelling reasons:
- Firstly, the **demand for private transaction methods is likely to grow** as individuals and businesses seek to protect their financial dealings from prying eyes.
- Secondly, Monero’s decentralized and open-source development community ensures a **transparent governance structure, promoting continuous innovation and improvement.**
The dynamic scalability of Monero's blockchain also positions it well for handling increased demand, with a block size that adjusts dynamically allowing for better on-chain scalability compared to other cryptocurrencies.
Also, Monero's mining and emission model is designed to incentivize a broad network of miners, ensuring network security and decentralization. The continuous, albeit small, block reward also promises a perpetual incentive for miners, contrasting with [Bitcoin's halving model](https://altcoininvestor.com/bitcoin-halving/).
However, it's essential for potential crypto investors to also be aware of the regulatory scrutiny surrounding privacy coins like Monero. The strong privacy features have led to delisting from some exchanges looking to comply with governmental regulations, which could impact liquidity and price discovery.
Despite these challenges, for those valuing financial privacy and looking to diversify their cryptocurrency holdings, Monero presents an intriguing investment proposition with a proven track record in its domain.
---
## Monero (XMR) Current Price:
The chart above provides the current trading price for this project and can be set to display various time frames, including the entire price history for the project:
---
## Should You Invest in Monero (XMR) Now?
The indicator below is provided by Trading View and is an algorithm that includes many commonly used technical indicators such as trendlines, moving averages, and momentum indicators, aggregated into an all-in-one "Buy or Sell" indicator for this project.
This is the current buy/sell sentiment based on technical indicators:
---
## Monero Project Links:
- **Website:** [https://nuco.cloud/](https://www.getmonero.org/)
- **Twitter:**
- **Reddit:**

## Before Investing in Any Crypto Project
It is important before making any decision to purchase any cryptocurrency, to research and analyze the project as well as [Do Your Own Research (DYOR)](https://altcoininvestor.com/dyor/). This can include performing both a technical and fundamental analysis of the project.
If you are a [crypto investor](https://altcoininvestor.com/what-is-a-crypto-investor/) considering this project, here are some initial factors to consider before making an investment.
### Initial factors to consider:
- **Historical performance:** How has project the performed? Examine both the short-term and long-term performance to better understand the stability or volatility within the price. Look at where the price is trending, both in the short-term and long-term.
- **Volume:** Analyze the trading volume of the cryptocurrency to see if there is sufficient liquidity and market demand to be able to sell when needed. This is especially important when dealing with low-capitalization altcoins.
- **Market cycles:** Be conscientious of market cycles and how they may impact the price of the cryptocurrency, this can include the overall market trend (bull/bear market) as well as the cycle for the specific project.
- **Market sentiment:** Observe the [market sentiment](https://altcoininvestor.com/market-sentiment/) of the market regarding the project as well as the crypto market as a whole (see: [Fear & Greed Index](https://altcoininvestor.com/fear-and-greed-index/)) and assess if it is positive or negative towards the future market price of the project.
- **Market events:** Search for any major current or near future events that may have an impact on the future price of this project. This can include upcoming new releases, public partnerships, or even regulatory developments.
It is important to note that past performance is not a guarantee of future performance. This is especially true for cryptocurrency projects as this is a highly volatile (and speculative) market.
If you have decided to move forward on the project, it is worth conducting both a technical and fundamental analysis of the project (especially if you are considering holding for the longer term).
If you are looking to make a quick return on your investment, it's possible to just look at the technical analysis to determine your buy-in and selling price. If however, you are looking to hold for the longer term, it's necessary to also take into consideration the fundamental analysis.
---
### Technical Analysis (When to Buy or Sell)
[Technical analysis](https://altcoininvestor.com/technical-analysis/) is a method used to evaluate the price movement and trends of a cryptocurrency by analyzing its historical price data, [chart patterns](https://altcoininvestor.com/crypto-chart-patterns-cheat-sheet/), and other [technical indicators](https://altcoininvestor.com/technical-indicators/) to determine the probable future price movement.
The aim of technical analysis is to identify **buying and selling opportunities** by analyzing market trends and making predictions about future price movements and is one of many tools used to determine probable future movement by analyzing data and statistics gathered from historical trading activity, such as price movement and volume.
Technical analysis is important because it can help [crypto investors](https://altcoininvestor.com/crypto-investor/) identify potential buying and selling points based on past price movements and market trends.
When conducting technical analysis for purchasing a cryptocurrency, the following factors should be taken into consideration:
- **Charts:** Analyze the price charts of the cryptocurrency to identify trends, support and resistance levels, and chart patterns
- **Indicators:** Use technical indicators, such as moving averages, volume, and oscillators, to gain insights into market sentiment and potential buying and selling points.
- **Trends:** Identify the long-term and short-term trends of the cryptocurrency, including bull and bear markets, and make predictions about future price movements.
- **Volatility:** Observe the volatility of the cryptocurrency and assess if it is suitable for your risk tolerance and investment strategy.
- **Market events:** Consider any market events that may impact the price of the cryptocurrency, such as news, partnerships, or regulatory developments.
[Top “Technical Indicators” for Crypto - MUST READ!Technical indicators are mathematical calculations based on the price, volume, or open interest of a financial asset.Altcoin InvestorRichard Knight](https://altcoininvestor.com/technical-indicators/)
---
### Fundamental Analysis
[Fundamental analysis](https://altcoininvestor.com/fundamental-analysis/) helps in determining the long-term success of a cryptocurrency project and this is especially important if you are looking to hold the cryptocurrency for a long period of time. If you are only interested in short-term gains, you may ignore this can go straight to the technical analysis.
Fundamental analysis is a method to evaluate the "intrinsic value" of the crypto project and the following factors should be taken into consideration:
- **Technology:** Evaluate the technology behind the cryptocurrency, including its security, scalability, and potential for future developments.
- **Adoption:** Assess the level of real-worldwide adoption and usage of the cryptocurrency, as well as its potential for future growth.
- **Competition:** Analyze the competition in the market and how it may impact the demand and value of the cryptocurrency.
- **Team and leadership:** Look at the team behind the cryptocurrency and their experience, track record, and plans for future development.
- **Partnerships:** Consider any partnerships or collaborations that the cryptocurrency has established, as they may impact its future growth and adoption.
- **Regulatory environment:** Analyze the regulatory environment and legal status of the cryptocurrency in your country, as it may affect its future value and adoption.
- **Financials:** Examine the financial health of the cryptocurrency, such as its revenue, expenses, and market capitalization.
[What is Fundamental Analysis?A method of evaluating crypto assets in an attempt to measure their intrinsic value.Altcoin InvestorRichard Knight](https://altcoininvestor.com/fundamental-analysis/)

## Conclusion:
Before investing in any cryptocurrency project, it's important to perform your own research and due diligence. In doing so, you will help to minimize your risk and maximize your gains on the investment.
If you would like to learn more about [investing in cryptocurrency](https://altcoininvestor.com/investing-in-cryptocurrency/), read our investors guide:
[The Beginner’s Guide to Investing in CryptocurrencyEverything you need to know about crypto (in one article)Altcoin InvestorRichard Knight](https://altcoininvestor.com/investing-in-cryptocurrency/)
---
### AAX Token (AAB)
URL: https://altcoininvestor.com/aab/
Last updated: 2020-09-14T16:49:30.000Z
*AAX is the first cryptocurrency exchange to be powered by London Stock Exchange Group’s technology provider LSEG Technology. It is also the first cryptocurrency exchange that joined London Stock Exchange Group’s Partner Platform, providing institutional clients ease of access to the crypto market.*
---
## Market Demand:
Crypto’s $800 billion dollar market cap at the end of 2017 was certainly impressive, but it’s nothing compared to what’s possible when we further connect crypto to traditional markets. Imagine what happens once we really start tapping into the $8 trillion dollar gold market or the world’s $80 trillion dollar stock markets.
In little over two weeks, AAX has increased its user base by 100%, and has now passed the 200k mark in user registrations.
AAX token allow crypto exchange to strengthen its business model, differentiate themselves, offer their customers exclusive benefits and, by doing so, build customer loyalty with a real sense of community.
Offering OTC, Spot, and Futures trading, quoting more than 50 cryptocurrency pairs and listing 5 perpetual futures contracts for Bitcoin, Ether, Litecoin, Ripple, and EOS, which can be traded with up to 100x leverage, AAX provides a secure, deeply liquid, ultra-low latency and fully compliant trading platform.
### The token offers:
**A multi-tiered discount scheme -** Settling trading fees with AAB is rewarded with a 20% discount, and a further discount is granted in proportion to how much AAB clients hold relative to their overall portfolio.
**Optimized wealth management -** AAB will be used in special promotions that make lending, borrowing, staking, and saving,even more attractive.
**Platform upgrades -** AAB can be used to unlock exclusive services and facilities, trading bots and trading signals,and other premium offerings.
**Pioneer program -** AAB will be the key token to gain access to AAX’s pioneering financial products and programs, including index derivatives, tokenized commodities, security tokens, and social trading schemes.
---
## The Team
**Thor Chan** is the CEO. Thor was among the first to join AAX and is the mastermind behind the company's product development strategy. His experience includes building global order management systems, global settlement systems, and low-latency trading platforms for professional traders. He was previously licensed in Hong Kong to manage equities and derivatives brokerage and trading operations. He's held various roles, including Deputy COO at FDT Group, and product management roles at AppAnnie, Microsoft, Publicis, and HSBC.
Lead Advisor is **Jamie Khurshid,** CEO at Match Financial Limited. Voted by Financial News as one of the top 40 under40 in trading and technology (2014) and ranked in the ‘Exchange invest’ Top 1000 most influential people in global financial markets 2017, Jamie worked between New York and London at investment firms GoldmanSachs, Credit Suisse and The Royal Bank of Scotland with responsibility for new business, regulation, product development and strategic investments.

## Price Analysis for AAX Token (AAB)
It has max supply of 50 Million coins (1 BTC = 20362.34 AAB). It is worth noting that the deflation mechanism peculiar to AAB entails the daily buyback and burning of tokens with the revenue generated from the exchange’s futures markets. As such, the surge in engagement and trade volumes translate to more revenue, which means more fund is available to sustain the price of AAB. AAX is conducting daily coin burns funded by 100% of the derivatives revenue. This process will continue until 50% of the total supply of AAB is destroyed.

All-Time High was $1.73 four months ago and is down -70.3% compared to the current price of $0.418954\. All-Time Low was $0.139807 two months ago and is up 266% compared to the current price. 24-hour trading volume is $8,834,859
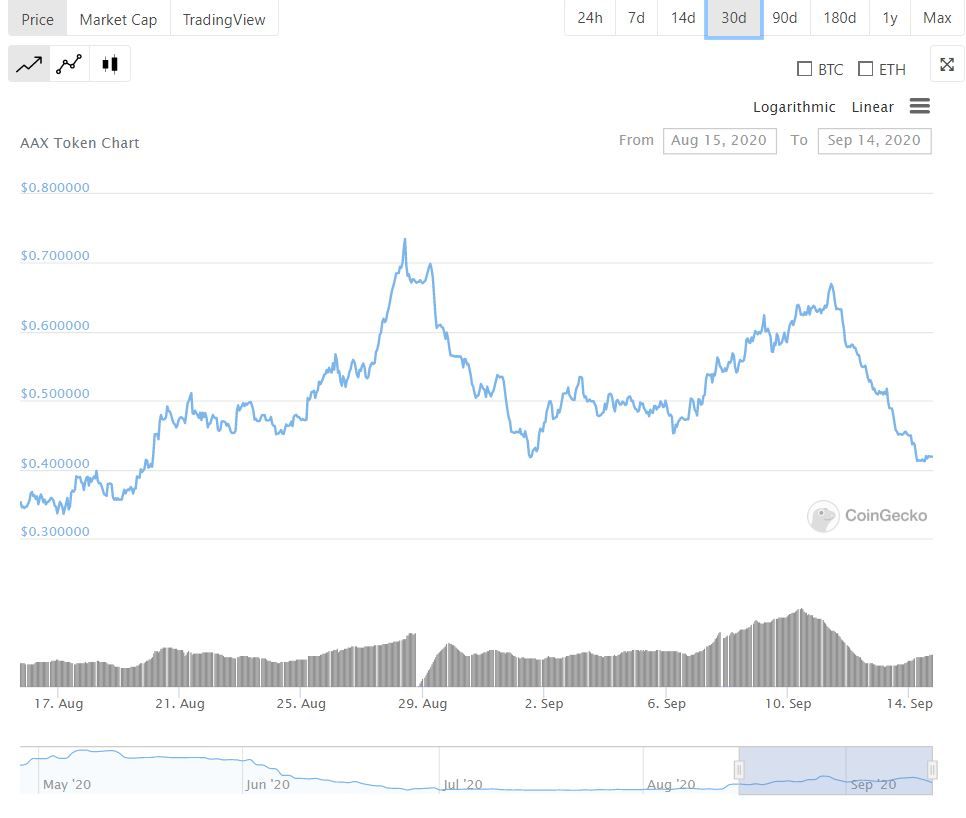
Based on the 30-Day chart, we can notice a cup and handle price pattern. The cup and handle is considered a bullish signal, with the right-hand side of the pattern typically experiencing lower trading volume. We can expect $0.73 level very soon.
AAX exchange is the current most active market trading it.
---
## Upcoming Events
- Wealth management, part 2:lending, staking
- Bitcoin dimensions contracts
- Additional indices
- Multi-asset as collateral for trading
- Quarterly futures
- Social trading and trading bot
- Margin trading
- Options
- AAB futures contracts

## Should I buy AAX Token (AAB)?
Token’s deflation mechanism, its strong ties with a budding crypto exchange, and its wide range of use cases shows that AAB is one of the most promising digital assets available today.
Should you buy into this token? Investing is a personal choice and investors should consult with experts when making financial decisions. It's important to note cryptocurrencies are highly volatile, unregulated and have the potential to go to zero. If this doesn't discourage you and would like to know if the AAX Token made it to our shortlist, check out our weekly ****Altcoin Reports**.
---
## Read Our Latest Reports...
If you enjoyed this analysis you can read our weekly updates in our [Altcoin Report](https://altcoininvestor.com/tag/altcoin-report/), published every Sunday. In these reports we cover our altcoin findings for the week.

### Disclaimer:
*The information in this review has been independently sourced and even though we have made the best attempts to report accurately, we do not provide assurances on any of this information. This analysis is provided "as is" and it is up to the reader to do their own due diligence and research. Altcoin Investor is not associated or affiliated with any firm and the opinions are strictly that of the author. This information should not be relied nor is it to be treated as financial advice.*
### Alphacat (ACAT)
URL: https://altcoininvestor.com/acat/
Last updated: 2020-09-18T17:08:56.000Z
*Alphacat is the world’s first robot adviser marketplace focused on cryptocurrencies. It is also the world’s first platform providing various AI trading robots for users to offer investment advisor services. The goal of Alphacat is to make investing for the average person as easy as buying a bottle of Coke and good investment performance to boot.*
---
## Market Demand:
We are, as a species, risk-averse, and have needed to be for survival. This extends to our vocabulary – higher risk also means the possibility of higher rewards, but you don’t hear anyone claim to be reward-averse. “Risk” will forever be associated with something bad, especially when it comes to investments. Investment advisors don’t warn about “upside risk.”
Conflating volatility with risk makes the former also something to be avoided, in the minds of most investors. Yet volatility is not the same as risk. Volatility is a metric, a number, a measurement. Risk is an ambiguous concept.
The relatively high volatility of crypto markets is a barrier for some but a magnet for others. Many professional traders have entered the crypto market because of the volatility. They bring with them liquidity which reduces spreads and further pushes market maturation forward. And as one asset’s volatility starts to settle down, another younger, more restive asset is but a couple of clicks away.
Alphacat is a marketplace for simple-to-use yet powerful robo-advisors focused on cryptocurrency investment. Alphacat’s predictive investment tools give its users a competitive edge by leveraging proven and patented trading algorithms, and combining them with advanced Artificial Intelligence and Big-data technologies. The goal of Alphacat is to make investing in cryptocurrencies easy and accessible for everyone regardless of their background or experience and to bring the advantages of financial technology into the world of digital assets!
So far, Alphacat claims that its AI robots have predicted the probability of Bitcoin price rises with an accuracy of 60%, and that no other prediction tool on the market so far can offer this level of accuracy.

## The Team
The token is developed by an all-star team mainly composed of Wall Street financial experts and former team members of Google’s Artificial Intelligence program. As much as this sounds wonderful, no specifics for the team are publicly available.
## Price Analysis for AAX Token (AAB)
ACAT has Rank #810 with Market Cap of $1,337,517
Alphacat has a circulating supply of 3.3 Billion coins and a max supply of 6.25 Billion coins (1 BTC = 27Million ACAT). All-Time High was $0.02048330 2 years ago is down -98% compared to the current price of $0.00040106\. All-Time Low was $0.00009494 six months ago and is up 324% compared to the current price. 24-hour trading volume is $116,048

Based on the 30-Day chart, we can notice very high trading volume which implicates that we can expect price volatility.

Based on the 6-month chart there is forming an ascending triangle pattern, which often leads for price breakouts. In that case expect $0.0007 level.

KuCoin is the current most active market trading it. You can find it paired with BTC and ETH.
---
## Upcoming Events
- Wealth management, part 2:lending, staking
- Bitcoin dimensions contracts
- Additional indices
- Multi-asset as collateral for trading
- Quarterly futures
- Social trading and trading bot
- Margin trading
- Options
- AAB futures contracts

## Should I buy AlphaCat (ACAT)?
Alphacat team provide advanced financial products and the tools used by professional financial institutions and making them available and accessible to ordinary investors. They aim to develop the next-generation of financial technology by taking down existing barriers and providing a platform with an accessible and powerful engine for financial experts and novices alike.
Should you buy into this coin? Investing is a personal choice and investors should consult with experts when making financial decisions. It's important to note cryptocurrencies are highly volatile, unregulated and have the potential to go to zero. If this doesn't discourage you and would like to know if the ACAT Token made it to our shortlist, check out our weekly ****Altcoin Reports**.
---
## Read Our Latest Reports...
If you enjoyed this analysis you can read our weekly updates in our [Altcoin Report](https://altcoininvestor.com/tag/altcoin-report/), published every Sunday. In these reports we cover our altcoin findings for the week.

### Disclaimer:
*The information in this review has been independently sourced and even though we have made the best attempts to report accurately, we do not provide assurances on any of this information. This analysis is provided "as is" and it is up to the reader to do their own due diligence and research. Altcoin Investor is not associated or affiliated with any firm and the opinions are strictly that of the author. This information should not be relied nor is it to be treated as financial advice.*
### Binance (BNB)
URL: https://altcoininvestor.com/bnb/
Last updated: 2023-10-18T00:36:28.000Z
*BNB powers the Binance Ecosystem. It is the native coin of Binance Chain. Binance Coin is the token issued by the world’s biggest cryptocurrency exchange. BNB token holders can access cheaper trades and other rewards within the Binance cryptocurrency exchange, so it works as an advanced loyalty program as well as a standalone cryptocurrency.*
---
## Market Demand:
Just getting listed on Binance can provide a cryptocurrency with a temporary boost of 80 percent in market value. And being delisted from Binance is a black mark felt throughout the industry. It’s one of the most trustworthy crypto exchanges, with over 150 coins listed and nearly $1.5 billion in crypto traded daily. Binance Chain economics relate to fees on the network, including trading fees associated with Binance [DEX](https://altcoininvestor.com/dex/), transaction fees (e.g., transfer asset fees), and other function calls (e.g., freezing, issuing calls).
According to the Binance fee schedule, the top tier of BNB token holders must today hold about $176,000 worth of the token and trade about $1.2 billion per month on the exchange. For users trading in these volumes, top-tier BNB holdings provide fee discounts that would save them about $720,000 each month, off the standard trading fees – more, if these traders pay the fees themselves in the Binance token.
Besides its on-chain functions, BNB has multiple additional use cases such as fee discounts on multiple exchanges (e.g., [Binance.com](https://www.binance.com/en)), payment assets on third-party services, and participation rights & transacting currency on Binance Launchpad.
BNB can be used on multiple platforms and services that are independently run by global companies. Its third-party set of use cases ranges from booking websites to financial services.

## The Team
**Changpeng Zhao** (aka CZ in the crypto community) is the CEO and who is now part of the crypto trading royalty. CZ is the founder and CEO of BijieTech, a company that provides cloud-based exchange systems to exchange operators. Since its founding in Sept 2015, BijieTech now powers 30+ exchanges in Asia. In the first 12 months since its founding, BijieTech closed 36.1 million RMB ($5.3MM USD) in revenue and will double that in its second year. BijieTech has never accepted any outside investments, being cash flow positive from day one. Prior to BijieTech, CZ was the co-founder and CTO of OKCoin.
**Roger Wang** is the CTO. Prior to BijieTech, Roger worked at Nomura Securities, the largest investment bank in Japan. He was responsible for a global credit booking, analytics, and marking system, which supported thousands of global traders and analysts.
Co-founder **Yi He** is a notable female entrepreneur in the [Blockchain industry](https://altcoininvestor.com/blockchain/). She previously worked as the branding and marketing head of the virtual currency exchange OKCoin and Yixia Tech.
An all-star management team leaves no room for something suspicious. They bring [Binance](https://en.wikipedia.org/wiki/Binance) literally from zero to hero.
The executive team decided that allocations of tokens should be divided up into [ICO](https://altcoininvestor.com/ico/) (50%), Angel Investors (10%), and Founding Team (40%) which use.

## Price Analysis for Binance (BNB)
BNB has **Rank #7** with a Market Cap of **$3.5 Billion**.
Worth mentioning that BNB supply was initially set at 200,000,000 coins. As mentioned in its whitepaper, BNB’s supply will be reduced to 100,000,000 units, a decrease of -50% of its original supply, owing to a burn mechanism. Every three months, Binance burns several BNBs based on its revenue. Owing to this burn mechanism, the supply of BNB is gradually decreased, increasing its scarcity.

Binance coin has a circulating supply of 150 Million coins and a max supply of 180 Million coins (1 BTC = 442.13 BNB). All-Time High was $39.68 over a year ago and is down -40% compared to the current price of $23.66\. The All-Time Low was $0.03981770 3 years ago and is up an unbelievable 60000% compared to the current price. 24-hour trading volume is $334,607,442.

Based on the 90-day chart, the current price sits on a resistance level of $23, retested several times the previous month. Volume has doubled since 30 days ago from $200,000 to up 400,000 Those are enough reasons to believe a breakout will occur with a short-time price target of $30.

Based on the 1-year chart we can see an even more bullish picture with an [ascending triangle pattern on the chart](https://altcoininvestor.com/crypto-chart-patterns/). If the price breaks the final resistance at $30 we can expect an all-time high for BNB at the end of the year around $40\.
Binance is the current most active market trading it.
---
## Upcoming Events
- Binance CEO Changpeng Zhao (CZ) has announced during the World of DeFi summit new plans to further support the DeFi ecosystem and solutions to bridge [DeFi](https://altcoininvestor.com/defi/) and CeFi ecosystems.
- The company plans to offer “DeFi Index Perpetual Contracts,” listed on Binance Futures. The contracts will be denominated in the dollar-linked stablecoin tether and offer traders leverage up to 50 times their money down.
- Users will benefit from CeFi (Margin, Futures, Savings, [DeFi Staking](https://altcoininvestor.com/liquid-staking/), and DeFi Pooling) and DeFi products on BSC (Lending, AMM, Liquidity Minging, [Yield Farming](https://altcoininvestor.com/yield-farming/)) on one platform.

## Should I buy Binance (BNB)?
Binance is one of the best cryptocurrency exchanges out there for trading between different cryptocurrencies. If you're looking to explore the world of cryptocurrency trading, it's a good idea to read a [Binance review](https://www.bitdegree.org/crypto/binance-review) to gain insight into this top cryptocurrency exchange
It offers a great, easy-to-use interface that caters to all types of traders. Not only that, but it’s a platform you can trust. Constant growth of the trading volume and BNB deflator nature guarantee us sure profit. This coin should be in every investing portfolio.
Should you buy into this coin? Investing is a personal choice and [crypto investors](https://altcoininvestor.com/crypto-investor/) should consult with experts when making financial decisions. It's important to note cryptocurrencies are highly volatile, unregulated, and have the potential to go to zero. If this doesn't discourage you and would like to know if the Binance coin made it to our shortlist, check out our weekly ****Altcoin Reports**.
---
## Read Our Latest Reports...
If you enjoyed this analysis you can read our weekly updates in our [Altcoin Report](https://altcoininvestor.com/tag/altcoin-report/), published every Friday. In these reports, we cover our [altcoin](https://altcoininvestor.com/) findings for the week.

### Disclaimer:
*The information in this review has been independently sourced and even though we have made the best attempts to report accurately, we do not provide assurances on any of this information. This analysis is provided "as is" and it is up to the reader to do their own due diligence and research. Altcoin Investor is not associated or affiliated with any firm and the opinions are strictly those of the author. This information should not be relied nor is it to be treated as financial advice.*
## Posts
### How To Calculate Maximum Exit Size For Low Cap Tokens
URL: https://altcoininvestor.com/how-to-check-if-i-can-sell-low-cap-token/
Last updated: 2026-10-22T02:04:10.000Z
## What You Will Accomplish
You will learn to calculate the maximum position size you can exit from a low-cap token before slippage exceeds 5%, 10%, and 20%. This is not about predicting price action. This is about determining whether the yield you earn on a position can actually be extracted without excessive slippage erasing your returns.
If you earned 15% APY on a token over six months but face 18% slippage on exit, you lost money. If the pool you are farming pays 40% but you cannot exit more than $2,000 without moving the price 12%, your effective position ceiling is $2,000 regardless of how much capital you deployed.
This methodology treats exit capacity as a risk parameter equal to yield rate. You will use on-chain liquidity pool depth, order book inspection for centralized exchange pairs, historical volume patterns, and position sizing formulas that model your exit as a percentage of daily volume. These are the same calculations that determine whether a 12% stablecoin yield in a Turkish DeFi protocol is real income or an illiquid trap.
**Prerequisites:** You need a wallet connected to a blockchain explorer (Etherscan, BscScan, Solscan, PolygonScan depending on chain), access to a DEX interface (Uniswap, PancakeSwap, Raydium), and basic familiarity with liquidity pools. If the token trades on a centralized exchange, you need access to the order book depth view on that platform.
## Step 1: Identify All Trading Venues and Their Liquidity

Most low-cap tokens trade on multiple venues. A token might have a Uniswap V3 pool on Ethereum, a PancakeSwap pool on BSC, and a listing on a smaller centralized exchange. Your exit capacity is the sum of liquidity across all venues, but only if you can move capital between them without prohibitive costs.
Start by listing every place the token trades. Use CoinGecko or CoinMarketCap to see all listed markets. For each venue, note the 24-hour volume. Ignore any venue with under $5,000 daily volume. These are not real exit options. They are display artifacts.
For decentralized exchanges, navigate to the specific pool. On Uniswap V3, multiple pools can exist for the same pair with different fee tiers (0.05%, 0.30%, 1%). The pool with the highest volume is usually your primary exit venue. Record the total value locked (TVL) in that pool. On Uniswap V2 or PancakeSwap V2, there is one pool per pair with a standard 0.30% fee. Record the TVL.
For centralized exchanges, open the trading pair and locate the order book. Most platforms allow you to view cumulative depth at various price levels. You want to see how much sell-side liquidity exists within 2%, 5%, and 10% of the current price.
If the token has no centralized exchange listing and trades only on a single DEX pool with under $50,000 TVL, your maximum exit size before heavy slippage is likely under $5,000\. This is the reality for most tokens under $10 million market cap. Proceed with that assumption until the data proves otherwise.
## Step 2: Calculate Slippage for Specific Trade Sizes
Slippage is the difference between the price you expect and the price you receive. The formula is:
**Slippage (%) = |Execution price - Expected price| / Expected price × 100**
For automated market makers like Uniswap, you can simulate this before executing. Most DEX interfaces show estimated slippage when you enter a trade size. Enter a hypothetical sell amount (for example, $1,000, $5,000, $10,000) and observe the quoted slippage percentage.
On Uniswap V3, slippage depends on how much concentrated liquidity exists in the price range your trade will traverse. If liquidity is concentrated tightly around the current price, a $5,000 trade might incur only 1-2% slippage. If liquidity is spread thin or clustered in ranges far from the current price, the same trade might incur 15% slippage because the pool runs out of depth quickly.
A useful heuristic from liquidity analysis: if your trade size is 50% or more of the pool's TVL, expect under 1% slippage only if the pool has extremely tight liquidity concentration. If your trade is 25-50% of TVL, expect 1-3%. If 10-25%, expect 3-8%. Below 10% of TVL, slippage often exceeds 10%.
For centralized exchanges, walk the order book manually. If the current bid is $0.50 and you want to sell $10,000 worth, calculate how many tokens that represents at current price. Then, starting from the top bid, sum the liquidity at each price level until you have absorbed your entire sell amount. The final price level you hit is your execution price. The difference between $0.50 and that final price is your slippage.
Most order books on small exchanges are thin. It is common to see $500 of buy-side liquidity at the best bid, $300 at the next level, $150 at the level below that. A $2,000 sell order in that environment will walk through five or six price levels and incur 8-12% slippage.
If you do not have an interface that shows estimated slippage, you can use third-party tools. The [Uniswap V3 liquidity depth model](https://github.com/adshao/publications/blob/master/uniswap/dive-into-uniswap-v3-whitepaper/README.md) offers one approach to estimating execution price based on tick-level liquidity distribution. For a faster approximation, divide your intended trade size by the pool's TVL. If the ratio exceeds 0.05 (5% of TVL), you are in high-slippage territory.
## Step 3: Model Your Exit as a Percentage of Daily Volume
Static liquidity numbers (TVL, order book depth) tell you what is available right now. Volume tells you how much flow the market can absorb over time without your trade dominating the tape.
A healthy benchmark: your exit should not exceed 1% of the token's 24-hour volume. If daily volume is $50,000, a $500 exit is reasonable. A $5,000 exit represents 10% of daily flow and will move the market.
This rule comes from the reality that in low-liquidity environments, your trade is not just interacting with resting liquidity (the TVL or order book depth). It is also interacting with sentiment. A large sell that represents 10-15% of daily volume signals to other participants that someone is exiting. In thin markets, that signal often triggers additional selling or causes liquidity providers to widen their ranges in anticipation of volatility. The result is that your trade incurs slippage not just from the liquidity you consumed, but from the liquidity that disappeared while you were consuming it.
For tokens with daily volume under $10,000, do not size any position you cannot exit in three separate transactions over three separate days. If you want to deploy $5,000 and volume is $8,000 per day, plan to exit in $1,500 increments. This assumes volume remains constant, which it will not. In adverse conditions (negative news, broader market sell-off, protocol exploit), volume on low-cap tokens often drops by 50-70%. Your $8,000 daily volume can become $2,500\. Suddenly your planned $1,500 exit is 60% of daily flow.
Position sizing for low-to-moderate liquidity assets must be based on liquidity available in adverse conditions, not current nominal liquidity. If a token currently has $100,000 daily volume, model your exit capacity assuming volume falls to $30,000-$50,000\. That is the stress-case scenario. If you cannot exit your full position in that environment without exceeding 10% slippage, your position is too large.
## Step 4: Inspect Liquidity Distribution and Concentration Risk
Not all liquidity is created equal. On Uniswap V3, liquidity providers specify the exact price range where they supply capital. This is called concentrated liquidity. It allows much greater capital efficiency than Uniswap V2, but it introduces concentration risk.
A pool might show $200,000 TVL, but if 80% of that liquidity is concentrated in a price range 5-10% above the current price, it does nothing for you when you are trying to sell. Your sell order walks down through price levels, and you only benefit from liquidity positioned below the current price.
To inspect this, you need a liquidity depth chart. Most advanced DEX analytics platforms (Uniswap's own analytics, DefiLlama, third-party tools like [liquidity depth analyzers](https://altcoininvestor.com/how-to-check-liquidity-low-cap-crypto/)) offer a view that shows how much liquidity is available at each price tick. Look for clusters. If liquidity is evenly distributed within ±2% of the current price, you have relatively stable exit conditions. If liquidity is sparse near the current price and clustered far away, expect slippage spikes as your trade moves through those gaps.
Order book depth on centralized exchanges works the same way. A token might have $50,000 of total buy-side liquidity in the order book, but if $40,000 of that is sitting 15% below the current price, it is not helping you exit at a reasonable price. What matters is density within the ±2% window.
For pools or books with large gaps, reduce your maximum exit size accordingly. If you calculated that you could exit $10,000 with 5% slippage based on aggregate TVL, but you discover that liquidity between the current price and -5% is only $30,000 with a $8,000 gap at -3%, treat that gap as a slippage event. Recalculate assuming your trade will incur an additional 3-5% slippage when it crosses that gap.
## Step 5: Test Your Assumptions with Small Trades
Theory fails in low-cap markets. Slippage estimates from interfaces are often wrong because they assume liquidity does not react to your trade. In practice, liquidity providers see large trades coming (especially if you are using a public mempool on Ethereum) and adjust their ranges or pull liquidity entirely. Sandwich bots detect your transaction and insert trades before and after yours to extract value. This is far more profitable in low-liquidity pools because the price impact of a single trade is larger.
Before you commit to a large exit, execute a small test trade. If you plan to exit $10,000, sell $500 first. Observe the actual slippage you incurred. Compare it to the estimate. If the estimate said 2% and you experienced 4%, double your slippage assumptions for the larger trade. If the estimate was accurate, proceed, but remain aware that a $10,000 trade is not simply twenty $500 trades. Non-linear price impact means the marginal slippage on each additional dollar sold increases as the trade size grows.
For positions above $20,000 in tokens with under $100,000 daily volume, test trades are not optional. They are the only way to validate that the liquidity you see on-chain is real and accessible. I have seen pools on BSC with $150,000 TVL where a $5,000 trade incurred 18% slippage because the liquidity was provided by a single address that pulled half of it the moment the trade was broadcast. The interface showed liquidity. The execution showed a trap.
## Step 6: Calculate Maximum Exit Size by Slippage Tolerance
Now you have the data: TVL, volume, liquidity distribution, and test trade results. You can calculate maximum exit size for three slippage thresholds: 5%, 10%, and 20%.
Work backwards from the slippage tolerance. If you will accept 5% slippage, find the trade size where your simulated or test slippage reached 5%. That is your ceiling for that tolerance band. Repeat for 10% and 20%.
For most low-cap tokens with $50,000-$200,000 daily volume and $100,000-$500,000 TVL, the numbers look like this:
- **5% slippage threshold:** $2,000-$5,000 exit
- **10% slippage threshold:** $5,000-$10,000 exit
- **20% slippage threshold:** $10,000-$25,000 exit
If you are farming yield on a position larger than your 10% slippage ceiling, you are holding illiquid inventory. The yield might look attractive, but your effective capital is constrained by exit capacity, not by what you deployed.
For tokens with under $20,000 daily volume, the ceilings collapse further. A 5% slippage exit might be $500\. A 10% slippage exit might be $1,500\. Anything above that is a gamble that liquidity will improve or that you will find a buyer off-market willing to take your position at a negotiated price. That happens. It is not a strategy.
## Step 7: Monitor Liquidity Changes Over Time
Liquidity is not static. Providers add and remove capital constantly. A pool that had $200,000 TVL last week might have $80,000 today because a large LP exited. A token that had $50,000 daily volume might see volume fall to $12,000 after a news event or after a competing protocol launches.
Set up monitoring. Check TVL and volume weekly for any position you hold in a low-cap token. If TVL drops by more than 30%, recalculate your exit capacity immediately. If volume drops below $10,000 per day, assume you are in a stressed environment and cut your planned exit size by 50%.
For positions where you are earning yield, the monitoring cadence should match the yield accrual period. If you are farming a 25% APY and compounding weekly, check liquidity weekly. If you are holding a token in a staking contract with a 30-day unlock, check liquidity at least twice during that 30-day window. You need to know before you unlock whether the exit environment has deteriorated.
Most liquidity collapses in low-cap tokens happen suddenly. A large holder exits. A protocol exploit is announced. A competing chain launches a migration incentive. When liquidity collapses, it does not come back quickly. Providers who pulled liquidity do not return the next day. They wait for clarity, which can take weeks. If you are holding a position during that period, your exit capacity has been cut by 60-80% regardless of what the token's price chart shows.
## Common Failure Modes
**Failure mode one:** assuming TVL equals exit liquidity. A Uniswap V3 pool with $500,000 TVL might have only $80,000 of liquidity positioned within ±5% of the current price. The rest is in ranges that will never be touched by your trade. Always inspect the distribution.
**Failure mode two:** ignoring the bid-ask spread. Before any price movement, you absorb a loss equal to the spread. On low-cap tokens, spreads of 1-3% are common. Add that to your slippage calculation. A trade with 4% price impact and a 2% spread is a 6% total cost.
**Failure mode three:** sizing based on current volume without stress-testing. Volume falls faster than price in a sell-off. If you sized a $10,000 position assuming $80,000 daily volume, and volume drops to $25,000, you are now trying to exit a position that represents 40% of daily flow. You will move the market, which will trigger more selling, which will reduce volume further. This is the liquidity death spiral that traps most low-cap yield farmers.
**Failure mode four:** not accounting for multiple fee tiers on Uniswap V3 and V4\. Fees are collected separately and must be manually redeemed. If you provided liquidity and earned $800 in fees, those fees are not automatically in your wallet. They sit in the contract until you claim them. Claiming requires a transaction, which costs gas. On Ethereum mainnet, gas can easily cost $15-$40 depending on network conditions. If your fees are $800 and gas is $30, you net $770\. If your fees are $100 and gas is $30, you net $70\. For small positions, fee redemption costs can erase 20-40% of yield. Factor this into your exit economics.
**Failure mode five:** treating order book depth as firm liquidity. On smaller centralized exchanges, order book depth is often fake. Wash trading and spoofed orders make the book look deeper than it is. When you try to sell into it, half the orders disappear. The exchange's matching engine shows "partial fill" and your order sits. You either cancel and re-submit at a lower price (incurring more slippage) or you wait, during which time the price can move against you. For exchanges outside the top 20 by volume, assume 30-50% of displayed order book depth is not real.
## What to Do Next
You now have a repeatable process. Before deploying capital into any low-cap yield opportunity, calculate your maximum exit size at 5%, 10%, and 20% slippage thresholds. If your intended position exceeds the 10% threshold, reduce position size or accept that you are holding illiquid capital and adjust your return expectations accordingly.
For tokens where you cannot exit more than $2,000-$3,000 without double-digit slippage, treat them as high-risk speculative positions regardless of the stated APY. A 40% yield on a $10,000 position is worth $4,000 annually. If you face 15% slippage on exit, you lose $1,500 of that gain immediately. Your effective yield is 25%, not 40%. If slippage is 25%, your effective yield is 15%. If slippage exceeds your annual yield, you are gambling on price appreciation, not earning income.
Compare your findings across similar tokens. If one protocol offers 18% APY with $120,000 daily volume and another offers 22% with $30,000 volume, the first is the better income opportunity even though the rate is lower. The rate you can extract is what matters.
This methodology applies equally to stablecoin yield in emerging market protocols, to governance token farming, and to liquidity provision on new DEX launches. In Turkey, there are DeFi protocols offering 12-15% on USDT deposits. The rate looks attractive relative to traditional Turkish lira savings accounts, which pay 8-10% on a currency losing value. But if the protocol's liquidity pool has $200,000 TVL and $15,000 daily volume, you cannot deploy $20,000 and expect to exit cleanly. Your ceiling is $3,000-$5,000 unless you are prepared to exit over multiple days and accept headline risk during that window. The same logic applies to Argentine peso-USDC on-ramps with thin order books, to Nigerian naira stablecoin pairs, to Vietnamese dong-USDT markets. Real income requires real exit liquidity.
## The Takeaway
You have a model now. It uses TVL, volume, liquidity distribution, and test trades to calculate how much capital you can exit before slippage destroys returns. The next time you see a 30% APY on a token with $40,000 daily volume, you will know to size your position at $2,000-$4,000, not $20,000\. The next time a yield aggregator shows you a 50% rate on a new pool, you will check whether the pool has $500,000 TVL or $50,000, because that difference determines whether the rate is real income or a mirage that evaporates when you try to collect.
Liquidity is not constant. Volume collapses in stress. Slippage is non-linear. Your position size ceiling is not the amount of capital you can deploy; it is the amount you can exit at a tolerable cost. Treat that ceiling as your true position limit, and you will avoid the single largest failure mode in low-cap yield farming, which is earning 20% while losing 25% to slippage on the way out. The rate you can extract is the only rate that matters.
## Frequently Asked Questions
### What is an acceptable slippage percentage when selling a low cap token?
For planned exits, 5% slippage or less is acceptable and indicates healthy liquidity. Between 5-10% is tolerable for smaller positions but signals thin markets. Above 10% slippage, you are paying a significant liquidity premium that often exceeds the yield you earned. Emergency exits may require accepting 15-20% slippage, but any position requiring routine slippage above 10% should be sized smaller or avoided entirely.
### How much of daily trading volume can I sell without moving the market?
A conservative rule is to keep any single exit under 1% of the token's 24-hour volume. Exits representing 5-10% of daily volume will likely move the market and trigger additional selling pressure in thin markets. For tokens with under $20,000 daily volume, plan to split exits across multiple days, with no single transaction exceeding $500-$1,000 depending on market conditions and liquidity depth.
### What is the difference between TVL and actual exit liquidity?
Total value locked (TVL) shows all capital in a liquidity pool, but on Uniswap V3 and similar concentrated liquidity platforms, much of that capital may be positioned in price ranges far from the current price. Your sell order only interacts with liquidity below the current price. A pool with $200,000 TVL might have only $50,000 of liquidity within 5% of current price. Always inspect liquidity distribution, not just aggregate TVL.
### How often should I check liquidity for a low cap token position?
Check TVL and volume weekly for any active yield-farming position. If TVL drops by more than 30% or volume falls below $10,000 per day, recalculate your exit capacity immediately. For staking positions with unlock periods, check liquidity at least twice during the lock window to ensure the exit environment has not deteriorated. Liquidity can collapse suddenly after exploits, large holder exits, or competing protocol launches.
### Should I use a centralized exchange or DEX to exit a low cap position?
Use whichever venue has the deepest liquidity within 2-5% of the current price and the highest daily volume. For most low-cap tokens, this will be a single primary DEX pool. Centralized exchanges often display deeper order books, but on smaller platforms 30-50% of displayed depth may be spoofed or wash-traded and disappears when you try to sell. Always verify with a small test trade before committing to a large exit on any venue.
The Weekly Yield Report
You just calculated exit capacity at three slippage thresholds using TVL, volume distribution, and order book depth. That liquidity profile will change next week, and the week after.
Every Thursday: where crypto yield actually is - stablecoins, liquid staking and DeFi lending, with the risk named next to the rate and what changed since last week.
[Get it free every Thursday](#/portal/signup)
Free. No trade calls, no allocations, no hype. Unsubscribe in one click.
### Top 10 Wallets For Multi-Chain Yield: Chain Coverage And Signing Speed Ranked
URL: https://altcoininvestor.com/top-10-crypto-wallets-multi-chain-yield/
Last updated: 2026-10-22T00:06:44.000Z
## The Deployment Friction You're Measuring
You're not storing Bitcoin for ten years. You're moving capital between Arbitrum lending pools, Base liquidity pairs, and Solana yield vaults. The wallet decision determines whether you catch yield windows or watch them close while your transaction confirms.
Most wallet comparisons rank security features or beginner simplicity. This one ranks wallets by the metrics that matter for active yield deployment: how many chains they support natively, how fast they sign transactions, and how deeply they integrate with the protocols you're actually deploying into.
Chain coverage determines whether you can access emerging yield opportunities. Signing speed determines whether you can move capital fast enough to catch rate changes before they arbitrage away. Protocol integration determines whether you're copying contract addresses from Etherscan or connecting with one click.
### What Actually Slows Deployment
A wallet that supports 250 networks but requires manual RPC configuration for half of them creates friction. A hardware wallet that adds 18 seconds to every transaction approval loses yield when you're rebalancing across six positions. A mobile wallet with native staking for 20 assets but zero DEX aggregation means you're opening a browser anyway.
The income mechanism here is deployment friction and missed opportunities. When [Rabby catches 34% more malicious transactions than MetaMask](https://altcoininvestor.com/best-defi-wallet/), that's security value. When Trust Wallet's hidden 0.5-1% swap spread costs you $500 on a $50,000 position, that's yield leakage.
## Wallet Rankings: Chain Support, Signing Speed, Protocol Depth

### 1\. MetaMask: The EVM Standard
MetaMask supports every EVM chain that matters. Ethereum, Base, Arbitrum, Optimism, Polygon, BNB Chain, Avalanche C-Chain. Add custom networks in 30 seconds with chain ID and RPC. Transaction signing is instant on desktop extension, sub-second on mobile. Protocol integration is universal. Every DEX, every lending platform, every yield aggregator builds MetaMask support first.
The limitation is non-EVM chains. MetaMask does not support Solana, NEAR, Tron, or other non-EVM ecosystems. If your yield strategy runs entirely on EVM chains, MetaMask remains the baseline. If you're deploying into Kamino on Solana or Aurora on NEAR, you need a second wallet.
Signing latency: under 1 second for standard approvals. Protocol coverage: near-universal across EVM DeFi.
### 2\. Rabby: MetaMask With Better Transaction Simulation
Rabby is a fork of MetaMask with pre-transaction simulation that shows you exactly what a signature will do before you approve it. Same EVM chain coverage. Same extension-based signing speed. Better protection against malicious approvals.
For yield deployers, the advantage is pre-approval clarity. When you're interacting with a new lending protocol or signing a complex vault deposit, Rabby shows token movements, approval grants, and balance changes before the transaction executes. MetaMask shows a hex string and waits for you to trust it.
The trade-off is smaller ecosystem integration. Some newer protocols test on MetaMask first and add Rabby support later. For most established DeFi platforms, Rabby works identically.
### 3\. Trust Wallet: Mobile-First Multi-Chain
Trust Wallet supports more than 250 networks, including Ethereum, Solana, Tron, BNB Chain, Polygon, and Avalanche. Mobile apps for iOS and Android are the primary interface. Native in-app staking for 20+ assets including Ethereum, Cosmos, Tezos, and Tron.
The hidden cost is swap spread. Trust Wallet's built-in swap feature charges 0.5-1% above market rate. On a $50,000 rebalance, that's $250-500 in friction. Signing speed on mobile is fast, but desktop workflow requires QR code scanning via WalletConnect, adding 8-12 seconds per transaction.
Trust Wallet user growth is up 40% year-over-year in 2025, making it one of the most widely adopted mobile options. For yield deployers who run their entire workflow from a phone, it's competitive. For desktop-first users, the WalletConnect dependency adds friction.
### 4\. Phantom: Solana Native, Now Multi-Chain
Phantom expanded to Ethereum and Polygon in 2025, positioning itself as a multi-chain wallet. Originally Solana-focused, it remains the dominant wallet for Kamino Finance, the leading Solana lending hub with over $3.6 billion in TVL.
Transaction signing on Solana is near-instant. Solana block time is under 1 second, but the network has a 20% transaction failure rate compared to Ethereum's 0.1%. When deploying into Solana yield, Phantom's transaction retry logic and RPC failover matter more than raw signing speed.
For users splitting capital between Solana DeFi and EVM DeFi, Phantom now covers both. EVM integration is newer and less battle-tested than MetaMask. Solana integration is best-in-class.
### 5\. Ledger Nano X: Hardware With 15,000+ Asset Support
Ledger hardware wallets support 15,000+ digital assets across 50+ networks. The Nano X model holds up to 100 coin apps simultaneously. Pricing ranges from $79 for the Nano S Plus to $399 for institutional models. Native integrations with Ledger Live app include staking for Ethereum, Polkadot, Tezos, Cosmos, and Algorand.
Every transaction requires physical confirmation on the device. That adds 6-10 seconds per signature compared to software wallets. For yield deployers executing 15-30 transactions per week across rebalancing, compounding, and position adjustments, that's 90-300 seconds of added latency.
The security trade-off is clear. [Hardware wallets secure your keys but slow your transaction flow](https://altcoininvestor.com/best-crypto-hardware-wallets/). For six-figure positions, the latency cost is justified. For sub-$10,000 portfolios with frequent rebalancing, the friction often outweighs the security gain.
### 6\. Trezor Safe 5: Open-Source Hardware Alternative
Trezor Safe 5 costs $169-219 depending on retailer. Native support for 1,000+ coins and tokens across 50+ blockchains. Third-party integrations extend coverage to 9,000+ tokens. Firmware is fully open-source, unlike Ledger's proprietary secure element.
Signing latency is comparable to Ledger: 6-10 seconds per transaction with physical confirmation. For yield deployers, the choice between Trezor and Ledger comes down to trust model. Trezor's open-source firmware allows independent security audits. Ledger's secure element uses closed-source code that cannot be externally verified.
Protocol integration is slightly narrower than Ledger. Trezor Suite supports fewer native staking options. Most DeFi interactions require connecting Trezor to MetaMask or Rabby as a signing device, which adds WalletConnect dependency and 4-6 seconds per transaction.
### 7\. Tangem Wallet: NFC Card Hardware
Tangem supports 90+ chains and 16,000+ assets. The wallet is a physical NFC card priced at $59.90\. No screen, no buttons. You tap the card to your phone to sign transactions. Optional seedless setup means no recovery phrase to secure.
The phone-trust dependency matters. [Tangem's NFC card model removes transaction screens](https://altcoininvestor.com/tangem-wallet-review/), creating trust in the phone's display to accurately show what you're signing. For malicious transaction attempts, you rely entirely on the phone app's simulation and display accuracy.
Signing speed is fast once the app is open: 2-4 seconds per tap. Multi-chain support is strong. Protocol integration is growing but narrower than MetaMask or Ledger Live.
### 8\. Bitget Wallet: 130+ Networks With Built-In Aggregation
Bitget Wallet supports 130+ networks including Ethereum, Solana, Tron, BNB Chain, Avalanche, Polygon, Arbitrum, and Optimism. Built-in DEX aggregator routes trades across multiple liquidity sources to minimize slippage. Mobile and browser extension versions maintain feature parity.
Signing speed is comparable to Trust Wallet and MetaMask: sub-second on most chains. The advantage over Trust Wallet is the integrated DEX aggregator, which sources better swap rates than Trust's single-provider model. The advantage over MetaMask is native multi-chain support without manual RPC configuration for non-EVM chains.
Protocol integration is strong for major platforms (Aave, Curve, Uniswap, PancakeSwap) but thinner for newer or niche protocols. If you're deploying into Morpho vaults or Fluid lending, you may encounter connection issues that MetaMask handles without friction.
### 9\. Coinomi: 125 Blockchains, 1,770+ Tokens
Coinomi supports more than 125 blockchains and over 1,770 token types. Mobile-first design with desktop versions available. Built-in exchange integration for swaps, though pricing is often 0.5-1.5% above spot.
Signing speed is fast. Protocol integration is weak. Coinomi positions itself as a storage and transfer wallet, not a DeFi interaction wallet. Connecting to Aave, Curve, or Morpho requires WalletConnect or manual workarounds. For yield deployers, this makes Coinomi better suited as a secondary wallet for holding positions after deployment rather than active interaction.
### 10\. Rainbow: Ethereum-Focused Mobile Wallet
Rainbow is Ethereum and L2-focused (Arbitrum, Optimism, Base, Polygon, Zora). Mobile-first with best-in-class transaction visualization. Pre-transaction simulation similar to Rabby but built for mobile UX. Native NFT gallery and ENS integration.
Signing speed is instant for Ethereum and supported L2s. Chain coverage is narrow: Ethereum ecosystem only. No Solana, no BNB Chain, no Avalanche, no Tron. For users deploying yield exclusively on Ethereum and its L2s, Rainbow offers better mobile UX than MetaMask. For multi-chain deployers, it's a secondary wallet at best.
## Confirmation Speed Across Chains: What Finality Actually Means

Wallets sign transactions. Chains confirm them. Understanding the difference between sequencer soft confirmation and hard finality prevents capital loss when bridging or rebalancing across chains.
### L2 Sequencer Confirmations vs. L1 Settlement
Arbitrum One runs a 250ms block time. Optimism confirms in roughly 2 seconds. Those are sequencer confirmations, meaning the L2 sequencer has accepted your transaction. Hard finality requires the rollup to post its batch to Ethereum L1, which takes 7 days for both chains.
For DeFi interactions, sequencer confirmation is sufficient. When you deposit into Aave on Arbitrum, the protocol recognizes your transaction after 250ms. When you bridge assets back to Ethereum L1 outside the canonical bridge, you wait for L1 batch posting, which can take minutes to hours.
If you're rebalancing between Arbitrum lending and Ethereum lending, the relevant latency is sequencer confirmation. If you're exiting L2 positions to move capital off-chain or to another ecosystem, the relevant latency is L1 settlement.
### Fastest Chains To Hard Finality
Avalanche C-Chain hits hard finality in approximately 2 seconds. NEAR confirms in 2.2 seconds. Tron confirms in roughly 3 seconds. Solana reaches finality in 12.8 seconds, though the 20% transaction failure rate means retries add latency.
For yield deployers moving capital between protocols, fast finality means faster rebalancing. When a Morpho vault on Ethereum offers 6.2% and a Kamino vault on Solana offers 8.4%, the 12.8-second Solana finality allows you to shift $50,000 between positions in under 15 seconds compared to Ethereum's 12.8-minute finality.
Polygon confirms in approximately 4 minutes. BNB Chain confirms in 7.5 seconds. Ethereum confirms in 12.8 minutes with full finality. Wallet choice doesn't change chain finality, but chain finality determines how fast your wallet-signed transactions actually execute.
## Protocol Integration Depth: What Connects Without Manual Setup
MetaMask connects to every major DeFi protocol without configuration. Aave, Morpho, Curve, Uniswap, Balancer, Yearn, Beefy. One-click connection. Rabby matches this. [Most wallet comparisons ignore what matters for yield capital: transaction simulation accuracy, RPC privacy leaks, and multi-L2 balance tracking](https://altcoininvestor.com/best-web3-wallets/).
Trust Wallet and Bitget Wallet support most major protocols but require WalletConnect for some newer platforms. Phantom integrates deeply with Solana DeFi (Kamino, Marginfi, Drift) but treats Ethereum protocols as secondary. Rainbow integrates well with Ethereum DeFi but offers no cross-chain support.
### Morpho and Kamino: The Current Yield Leaders
Morpho is a multichain EVM lending protocol supporting over 70 assets with LTVs up to 86%. Borrowers pay zero fees. Lenders earn passive yield through Morpho Vaults. MetaMask, Rabby, and Ledger (via MetaMask integration) all connect without friction. Trust Wallet and Bitget Wallet connect via WalletConnect.
Kamino Finance dominates Solana lending with over $3.6 billion in TVL. Phantom is the native wallet. Solflare is the alternative. MetaMask does not support Solana, so Ethereum-focused wallet users need a second wallet for Kamino access.
If your yield strategy includes both Morpho on Ethereum and Kamino on Solana, you need at minimum MetaMask (or Rabby) for EVM chains and Phantom (or Solflare) for Solana. No single wallet covers both ecosystems with full protocol depth.
### DEX Aggregators and Slippage Reduction
Wallets with built-in DEX aggregators route trades across multiple liquidity sources to minimize slippage. Bitget Wallet includes this. Trust Wallet does not. MetaMask does not, but integrates easily with external aggregators like 1inch and Paraswap.
For a $50,000 swap, slippage and routing differences can cost 0.2-0.8% ($100-400). Using a wallet with integrated aggregation or easily connecting to external aggregators reduces this friction. Using a wallet that forces single-source swaps (Trust Wallet's native swap) or requires manual DEX navigation adds cost.
## Hardware vs. Software: The Six-Figure Threshold
For positions under $10,000, software wallets (MetaMask, Rabby, Phantom) offer sufficient security with minimal friction. For positions above $100,000, hardware wallets (Ledger, Trezor) justify the signing latency through offline key storage.
The transition zone is $10,000-100,000\. At $25,000, the annual yield difference between 6% and 8% is $500\. The security cost of a hardware wallet is $79-219 one-time. The friction cost is 6-10 seconds per transaction, which multiplies across 15-30 weekly transactions for active deployers.
One operational model: use a hardware wallet for the primary position storage and a software wallet for active deployment. Move $80,000 into a Ledger-secured Aave position. Move $20,000 into a MetaMask wallet for active rebalancing across Morpho, Curve, and Yearn. Rebalance the hardware wallet monthly. Rebalance the software wallet daily.
This splits security and speed. The bulk of capital stays in slow, secure storage. The deployment capital moves fast with acceptable risk exposure relative to position size.
## Who Each Wallet Is Right For
MetaMask and Rabby are right for EVM-focused yield deployers who interact with 5-15 protocols weekly and prioritize signing speed over hardware security. If your entire workflow runs on Ethereum, Arbitrum, Base, and Polygon, these are the baseline.
Phantom is right for Solana-first deployers using Kamino, Marginfi, and Drift. The recent Ethereum integration makes it viable for users splitting capital 70/30 Solana/Ethereum, though MetaMask still holds deeper EVM protocol integration.
Trust Wallet and Bitget Wallet are right for mobile-first users deploying across 8+ chains who accept slightly higher swap costs in exchange for app-native multi-chain support without desktop dependency.
Ledger and Trezor are right for six-figure positions where signing latency is justified by offline key security. Also right for users holding 80%+ of capital in static positions and deploying only 10-20% actively.
Tangem is right for users who want hardware-level security without managing seed phrases and who trust their phone's transaction display accuracy. The $59.90 price point makes it accessible for mid-five-figure portfolios.
Rainbow is right for Ethereum-only deployers who prioritize mobile UX and transaction clarity over chain breadth.
Coinomi is right for users who need broad chain support for holding and transferring but interact with DeFi protocols infrequently enough that WalletConnect friction is acceptable.
## The Recommendation
Run two wallets minimum. One EVM, one Solana.
For EVM chains, use Rabby if you interact with new or unaudited protocols weekly. Use MetaMask if you stick to established platforms (Aave, Curve, Uniswap, Morpho). Both sign fast, integrate universally, and support every L2 that matters. Rabby's transaction simulation catches malicious approvals MetaMask misses, which justifies the occasional integration lag on brand-new protocols.
For Solana, use Phantom. It is the standard. Kamino, Marginfi, Drift, and every other Solana yield protocol build for Phantom first. Signing is instant. Transaction retry logic handles Solana's 20% failure rate better than alternatives.
If your portfolio exceeds $100,000, add Ledger Nano X for primary position storage. Move 70-80% of capital into Ledger-secured Aave, Morpho, or Curve positions that rebalance monthly. Keep 20-30% in Rabby or MetaMask for weekly rebalancing. This splits security and speed appropriately.
If your workflow is entirely mobile, use Bitget Wallet for EVM chains instead of MetaMask. The built-in DEX aggregator saves more on swap costs than Trust Wallet's single-provider model, and signing speed matches MetaMask's browser extension performance on mobile.
Do not use a single wallet for everything. No wallet covers EVM and Solana with equal protocol depth. Do not use hardware wallets for active deployment unless your position size justifies 6-10 seconds per signature. Do not use wallets with hidden swap spreads (Trust Wallet, Coinomi) when external aggregators or direct DEX interaction is available.
## The Takeaway
Chain count is a marketing number. What matters is whether the wallet signs fast enough to catch yield rate changes, integrates deeply enough to avoid manual contract interaction, and covers the specific ecosystems where your capital deploys. Ethereum and Solana yield require different wallets. Hardware security justifies signing latency above $100,000\. Below that threshold, software wallets with transaction simulation (Rabby) offer better risk-adjusted speed. If you're missing yield opportunities because your wallet doesn't support the chain or your transaction sat in confirmation for 90 seconds while rates moved, the friction cost is measurable. Pick wallets that match your deployment frequency, position size, and ecosystem focus. Everything else is secondary.
## Frequently Asked Questions
### What is the fastest wallet for multi-chain yield deployment?
MetaMask and Rabby offer sub-second signing on all EVM chains including Ethereum, Arbitrum, Base, and Polygon. Phantom provides near-instant signing on Solana. Hardware wallets (Ledger, Trezor) add 6-10 seconds per transaction due to physical confirmation requirements. For active deployers executing 15-30 transactions weekly, software wallets minimize friction. For positions above $100,000, hardware wallet latency is justified by offline key security.
### Which wallet supports the most blockchains for yield farming?
Trust Wallet supports 250+ networks including Ethereum, Solana, Tron, BNB Chain, Polygon, and Avalanche. Ledger hardware wallets support 15,000+ assets across 50+ networks. Bitget Wallet covers 130+ networks with built-in DEX aggregation. However, raw chain count matters less than protocol integration depth. MetaMask supports fewer chains but connects to every major DeFi protocol (Aave, Morpho, Curve) without configuration, making it more efficient for EVM-focused yield deployment despite narrower chain coverage.
### Do I need separate wallets for Ethereum and Solana yield protocols?
Yes. No single wallet offers equal protocol integration depth for both ecosystems. MetaMask and Rabby provide universal EVM protocol support (Aave, Morpho, Curve, Yearn) but do not support Solana. Phantom dominates Solana DeFi integration (Kamino, Marginfi, Drift) and recently added Ethereum support, but EVM protocol integration remains thinner than MetaMask. For optimal deployment speed and protocol access, run Rabby or MetaMask for EVM chains and Phantom for Solana.
### When does hardware wallet signing latency justify the security gain?
Hardware wallets (Ledger, Trezor) add 6-10 seconds per signature compared to software wallets. For positions above $100,000, offline key storage justifies this latency. For portfolios under $10,000, software wallets with transaction simulation (Rabby) offer better risk-adjusted speed. Between $10,000-100,000, split capital: move 70-80% into hardware-secured positions that rebalance monthly, keep 20-30% in software wallets for active weekly deployment. This balances security with operational speed for mid-six-figure portfolios.
### What is the cost of using Trust Wallet's built-in swap for yield rebalancing?
Trust Wallet's integrated swap charges 0.5-1% above market rate. On a $50,000 rebalancing transaction, this costs $250-500 in hidden spread. Bitget Wallet's DEX aggregator or direct protocol interaction through MetaMask eliminates this friction. For active deployers rebalancing 2-4 times monthly, Trust Wallet's swap spread costs $6,000-24,000 annually on a $100,000 portfolio compared to using external DEX aggregators or connecting MetaMask directly to Curve or Uniswap.
Tool mentioned above
Ledger
Ledger devices display the full transaction on their own screen before you approve it, which is what stops an approval exploit at the point it matters.
[See Ledger devices](https://shop.ledger.com/?r=90612ff43561)
We may earn a commission if you sign up through this link, at no cost to you. It does not change what gets recommended.
The Weekly Yield Report
You just compared ten wallets across chain coverage, signing speed, and protocol integration depth. Those latency numbers and supported networks will change as L2s launch and firmware updates roll out.
Every Thursday: where crypto yield actually is - stablecoins, liquid staking and DeFi lending, with the risk named next to the rate and what changed since last week.
[Get it free every Thursday](#/portal/signup)
Free. No trade calls, no allocations, no hype. Unsubscribe in one click.
### How To Calculate Airdrop Breakeven: Gas Costs vs Allocation
URL: https://altcoininvestor.com/airdrop-farming-gas-cost-calculator/
Last updated: 2026-10-21T23:03:47.000Z
## What You Will Accomplish

You will build a breakeven model that compares your cumulative gas costs against expected airdrop allocations based on historical distribution data. This model uses chain-specific transaction fees, activity-level tiers, and opportunity cost to determine whether a farming strategy nets positive before you spend a dollar.
Most [airdrop farming guides](https://altcoininvestor.com/how-to-earn-crypto-airdrops/) skip the cost accounting. They show you where to interact but not how to calculate whether the interaction is worth the gas. The blockchain shows exactly what you spent. It also shows what past airdrops paid at different activity levels. If you compare those two numbers honestly, most farming campaigns fail the breakeven test.
This framework requires a spreadsheet, access to gas trackers for your target chains, and historical allocation data from past airdrops. You will model total costs over a six-month farming cycle and compare that figure against conservative allocation estimates. If the expected value falls below 5% of your gas spend, the campaign does not pass the filter.
## Step 1: Establish Your Gas Cost Baseline By Chain
Gas costs vary by three orders of magnitude depending on which chain you farm. A swap on Ethereum mainnet costs $0.03 as of October 2026\. The same swap on Base costs $0.05 total per transaction. On Solana, approximately $0.001\. The chain you choose determines whether you spend $1 or $200 for the same activity count.
Start by recording current gas prices for the chains where your target protocols operate. Check Etherscan for Ethereum mainnet. Use L2Beat or native block explorers for Base, Arbitrum, and Optimism. For Solana, reference Solscan. Record the cost of a standard token swap, a liquidity pool deposit, and a smart contract interaction. These are the three most common farming actions.
Base currently charges $0.05 to $0.15 per transaction. Arbitrum runs $0.08 to $0.20\. Optimism sits at $0.15 to $0.30\. Solana remains under $0.01\. Layer 2 networks reduce costs by 10x to 100x compared with Ethereum mainnet. If your target protocol operates on multiple chains, you already know which one to farm.
Next, estimate your total interaction count over six months. Conservative farming requires at least 20 to 30 interactions to signal genuine usage. That includes swaps, LP deposits, bridge transactions, governance votes, and NFT mints. Multiply your interaction count by the per-transaction cost. On Base, 25 interactions cost $1.25 to $3.75\. On Ethereum mainnet during moderate congestion, the same activity runs $750.
Add bridge costs. Moving capital from Ethereum to a Layer 2 costs $1 to $5 depending on mainnet gas at the time. This is a one-time expense, but it belongs in your total cost basis. If you farm three protocols on three different chains, you pay bridge fees three times.
Your baseline is the sum of transaction gas, bridge fees, and any protocol-specific fees like swap routing costs. Record this number in your spreadsheet. It is the denominator in your breakeven calculation.
## Step 2: Model Expected Allocation Using Historical Precedents

Historical airdrop data provides allocation ranges at different activity levels. Uniswap in September 2020 gave 400 UNI tokens to 251,534 addresses. At launch, that allocation was worth $1,200\. Arbitrum in March 2023 distributed 625 to 10,250 ARB tokens to over 245,000 addresses. The median allocation was 1,250 ARB. Hyperliquid in November 2024 sent tokens to 94,000 users. The average allocation was 2,915 tokens, but the median was 64.53 tokens.
Notice the difference between average and median. Averages are inflated by whale allocations. The median tells you what a typical farmer actually received. If you are not a liquidity provider with seven-figure volume, model your expectation against the median, not the average.
Allocation formulas now use logarithmic scaling, not linear. $10,000 in transaction volume does not yield ten times the reward of $1,000 in volume. Projects like zkSync required interactions with at least 10 non-token smart contracts and trading at least 10 distinct ERC-20 tokens. Arbitrum required points across multiple categories including bridging, distinct monthly activity, and smart contract calls.
Your expected allocation depends on your activity tier. Define three tiers: minimum qualifying activity (10 to 15 interactions over three months), moderate activity (20 to 30 interactions over six months), and high activity (50+ interactions, liquidity provision, governance participation). Most retail farmers fall into the moderate tier.
Use historical medians to estimate allocation. For a moderate-tier farmer on a major protocol, assume allocation between $200 and $1,500 at token launch. For minimum-tier, assume $50 to $300\. For high-tier, assume $1,000 to $5,000\. These are conservative estimates based on Arbitrum, Optimism, and zkSync distributions.
Multiply your allocation estimate by 0.6 to account for token price volatility between snapshot and claim. Approximately 64% of airdrop recipients sell immediately at the token generation event, creating sell pressure. Even large allocations lose value fast if you do not claim within the first 48 hours.
Record your adjusted expected allocation in the spreadsheet. This is the numerator in your breakeven calculation.
## Step 3: Calculate Breakeven Threshold And ROI Filter
Your breakeven threshold is the point where expected allocation value exceeds total gas costs. If you spent $50 in gas and expect a $200 allocation, your breakeven ratio is 4:1\. If you spent $150 and expect $180, your ratio is 1.2:1\. The rule of thumb: interaction cost should fall under 5% of conservative allocation estimates. That yields a 20:1 return on gas spend, which accounts for uncertainty, token volatility, and opportunity cost.
Here is the formula:
**Breakeven Ratio = (Expected Allocation x 0.6) / (Total Gas Cost + Bridge Fees)**
If the ratio is below 5, the campaign fails the filter. You are spending too much gas relative to realistic expected value.
Apply this formula to a real example. You farm a protocol on Base for six months. You complete 25 transactions at $0.10 average cost. You paid $3 in bridge fees. Total cost: $5.50\. You estimate moderate-tier allocation at $400, discounted to $240 after volatility. Breakeven ratio: 240 / 5.50 = 43.6\. This campaign passes.
Now run the same activity on Ethereum mainnet during bull market gas conditions. Same 25 transactions, but at $15 average cost. Bridge fee: $5\. Total cost: $380\. Expected allocation remains $240\. Breakeven ratio: 240 / 380 = 0.63\. This campaign fails. You will lose money even if the allocation arrives exactly as modeled.
The difference is the chain. Most airdrop farming campaigns that fail the breakeven test fail because farmers chose the wrong execution layer. If a protocol operates on both Ethereum mainnet and a Layer 2, farming the Layer 2 increases your breakeven ratio by 50x to 100x.
Add a column to your spreadsheet for opportunity cost. If you lock $500 in a liquidity pool for six months to qualify for an airdrop, you are forgoing the yield that capital could earn elsewhere. At 5% stablecoin yield, you lose $12.50 in opportunity cost. Add this to your total cost basis. The breakeven ratio drops accordingly.
Finally, add a risk adjustment for snapshot timing. Protocols capture wallet eligibility at a specific block height but do not announce the date in advance. If you start farming two weeks before the snapshot, you pay full gas costs but may not accumulate enough activity to qualify. Multiply your expected allocation by 0.8 to account for timing risk if you enter a farming campaign less than four months before anticipated snapshot.
## Step 4: Model Activity Level Requirements And Sybil Filters
Activity level determines allocation tier, but raw transaction count no longer works. Projects analyze interaction frequency, action diversity, multi-chain activity, wallet age, and funding patterns. Modern Sybil detection filters out 48% to 85% of farming wallets. If your activity pattern looks mercenary, you receive nothing regardless of transaction count.
ZkSync disqualified wallets that interacted with fewer than 10 distinct smart contracts. Arbitrum awarded points for activity across distinct months, not just total volume. Hyperliquid favored early testers who used the platform before it gained traction. Duration over volume is now the standard.
Your model must account for Sybil risk. If you run multiple wallets from the same funding source, interact with protocols in identical sequences, or execute transactions within seconds of each other across wallets, clustering algorithms will flag you. [Sybil detection tools](https://altcoininvestor.com/how-airdrops-detect-sybil-wallets/) trace funding graphs, transaction timing, and behavioral sequences.
Add a Sybil risk discount to your expected allocation. If you farm with a single wallet using organic activity patterns, apply no discount. If you run 3 to 5 wallets with varied activity, apply a 20% discount. If you run 10+ wallets with automated or coordinated behavior, apply a 70% discount or assume disqualification.
The safest activity pattern: one wallet, six months of consistent use, interactions with 5+ protocols, participation in governance or testnets, and wallet age over one year. This pattern passes most filters and qualifies for moderate to high-tier allocations. The riskiest pattern: new wallet funded via Tornado Cash, identical transaction sequences across multiple addresses, and all activity concentrated in the final 30 days before anticipated snapshot.
Include Sybil risk in your breakeven model by adjusting expected allocation downward. A $400 allocation estimate with 70% Sybil risk becomes $120\. If your gas costs total $80, your breakeven ratio drops from 5:1 to 1.5:1\. The campaign no longer passes the filter.
## Common Failure Modes And How To Recognize Them Early
The most common failure mode is farming the wrong chain. If your gas costs exceed $50 for a single protocol and you are not providing liquidity above $10,000, you already failed the breakeven test. Switch to a Layer 2 or exit the campaign.
The second failure mode is overestimating allocation. Farmers see Hyperliquid's average allocation of 2,915 tokens and assume they will receive similar amounts. The median was 64.53 tokens. If you model against the average instead of the median, your breakeven ratio inflates by 45x. Use medians.
The third failure mode is ignoring opportunity cost. Locking $2,000 in a liquidity pool for six months costs $50 in foregone stablecoin yield at 5% APY. Add impermanent loss if the pool is volatile. Add exit gas costs to remove liquidity. Your total cost basis is gas plus opportunity cost plus impermanent loss plus exit fees. Most farmers only count gas.
The fourth failure mode is late entry. If a protocol has been live for 18 months and you start farming three months before anticipated snapshot, you compete against wallets with much longer activity histories. Allocation formulas reward duration. You will land in the minimum tier even if you execute 50 transactions in three months. Start early or do not start.
The fifth failure mode is snapshot timing risk. Protocols announce airdrops after the snapshot, not before. You might farm for six months, then discover the snapshot occurred in month four. All activity after that date is worthless. This is unquantifiable risk. The only mitigation is starting early and farming continuously.
Watch for these signals: gas costs above $100 for a single protocol, allocation estimates based on averages instead of medians, locked capital with no yield offset, activity duration under four months, and protocols that have not announced tokenomics or governance structures. Any one of these signals suggests the campaign will fail breakeven.
## What To Do Next: Build Your Model And Run Scenarios
Open a spreadsheet. Create columns for chain, transaction count, cost per transaction, bridge fees, total gas cost, opportunity cost, expected allocation, volatility adjustment, Sybil risk adjustment, and breakeven ratio. Input real gas costs from block explorers. Input realistic allocation estimates from historical medians.
Run three scenarios: conservative (minimum-tier allocation, high Sybil risk, unfavorable volatility), base case (moderate-tier allocation, low Sybil risk, median volatility), and optimistic (high-tier allocation, no Sybil risk, favorable volatility). Calculate breakeven ratio for each scenario. If the conservative scenario yields a ratio below 3, the campaign is too risky.
Compare multiple protocols. Rank them by breakeven ratio. Farm the top three. Ignore the rest. Your capital and time are finite. Farming 12 protocols spreads your activity too thin. You land in minimum tier across all of them. Farming three protocols with deep, consistent activity over six months puts you in moderate to high tier.
Update your model monthly. Gas costs change. Token launch expectations change. New historical data arrives when other protocols distribute airdrops. Adjust your allocation estimates based on the most recent comparable distribution. If the latest airdrop paid median allocations 40% lower than historical norms, discount your estimates accordingly.
Track your actual spending. Log every transaction hash, timestamp, and gas cost in a separate sheet. Compare actual gas spend against your model every 30 days. If actual costs exceed modeled costs by more than 20%, you are farming inefficiently. Reduce interaction frequency or switch to cheaper transaction types.
The model is not a prediction. It is a filter. Campaigns that pass the breakeven test under conservative assumptions are worth farming. Campaigns that fail are not. The blockchain will show you the exact cost. Historical distributions show you realistic allocations. The math is simple. Most farmers just do not run it.
## The Takeaway
You now have a breakeven framework that uses chain-specific gas costs and historical allocation medians to determine whether airdrop farming nets positive. The critical variables are transaction cost per chain, activity tier based on duration and diversity, Sybil risk, and opportunity cost. If your conservative scenario yields a breakeven ratio above 5, the campaign passes. If it yields below 3, you will burn more in gas than you recover.
Gas prices fluctuate. Allocation formulas evolve. Sybil filters tighten. Run this model monthly using current gas data and the most recent airdrop distributions. The protocols that passed the filter last quarter may fail it this quarter. The numbers you see today will be different next month.
## FAQ
## Frequently Asked Questions
### What is the minimum breakeven ratio that makes airdrop farming worth the gas cost?
A breakeven ratio of 5:1 or higher is the standard filter. This means your expected allocation after volatility adjustment should be at least five times your total gas and bridge costs. Ratios between 3:1 and 5:1 are marginal and depend on your risk tolerance. Ratios below 3:1 indicate you will likely spend more in gas than you recover from the airdrop, especially after accounting for Sybil risk and opportunity cost.
### How do I estimate expected allocation when a protocol has not distributed an airdrop yet?
Use historical medians from comparable protocols. Arbitrum's median allocation was 1,250 ARB. ZkSync required 10+ smart contract interactions for eligibility. Model your allocation against the median, not the average, and apply a tier based on your activity level: minimum tier $50-$300, moderate tier $200-$1,500, high tier $1,000-$5,000\. Discount by 40% for token volatility and another 20-70% based on your Sybil risk profile.
### Which blockchain has the lowest gas costs for airdrop farming in 2026?
Solana has the lowest transaction costs at approximately $0.001 per transaction. Among Ethereum Layer 2 networks, Base offers the best value at $0.05-$0.15 per transaction, followed by Arbitrum at $0.08-$0.20\. Ethereum mainnet costs $0.03 for token swaps but spikes during congestion. For systematic airdrop farming, Base and Solana offer the best cost efficiency with 50x-100x lower fees than Ethereum mainnet.
### How does Sybil detection affect my expected allocation and breakeven calculation?
Sybil filters now exclude 48-85% of farming wallets by analyzing funding patterns, transaction timing, and address clustering. If you run multiple wallets from the same funding source with identical activity sequences, apply a 70% discount to your expected allocation or assume disqualification. Single-wallet farmers with organic activity and wallet age over one year face minimal Sybil risk. Include this adjustment in your breakeven model by reducing expected allocation before calculating the ratio.
### Should I include opportunity cost in my airdrop farming breakeven model?
Yes. If you lock $500 in a liquidity pool for six months to qualify for an airdrop, you forgo yield that capital could earn elsewhere. At 5% stablecoin yield, the opportunity cost is $12.50 over six months. Add this to your total cost basis alongside gas and bridge fees. For volatile LP positions, also include estimated impermanent loss and exit gas costs. Most farmers only count gas and miss 30-50% of their true cost basis.
The Weekly Yield Report
You just compared gas costs across five chains and modeled allocation tiers using real Arbitrum and zkSync data. Those gas prices and allocation formulas will shift next quarter.
Every Thursday: where crypto yield actually is - stablecoins, liquid staking and DeFi lending, with the risk named next to the rate and what changed since last week.
[Get it free every Thursday](#/portal/signup)
Free. No trade calls, no allocations, no hype. Unsubscribe in one click.
### Cheap Crypto Mining Rig Payback: Used GPU vs ASIC Economics
URL: https://altcoininvestor.com/cheap-crypto-mining-rig-payback-analysis/
Last updated: 2026-10-21T22:04:03.000Z
## The $500-$2000 Range Forces Bad Choices
A cheap crypto mining rig sounds like an affordable entry point to earning mining income. The economics say otherwise. The $500-$2000 budget range forces you into one of two unfavorable positions: multiple used GPUs mining altcoins with thin margins and 1,500-day payback periods, or older ASICs with efficiency ratings that will be unprofitable within six to twelve months as difficulty rises. Neither setup breaks even before hardware obsolescence in most residential power environments.
I have analyzed mining operations from both the operator and the income side for five years. The current market presents the narrowest profitability window I have seen. GPU mining profitability collapsed in 2026\. ASIC mining remains viable only with industrial power rates below $0.06 per kilowatt-hour. Most residential electricity in the United States costs $0.16 per kWh. At that rate, even efficient hardware loses money daily.
This article compares actual payback periods for budget mining setups at current network difficulty and realistic power costs. It identifies the narrow exceptions where used equipment retains economic sense, and the point at which buying the coin directly outperforms running the hardware. If you are considering a cheap mining rig, the income math matters more than the upfront price.
## Used GPU Economics: Payback Periods and Profitable Coins
Used GPUs are widely available in the $150-$280 range. An RTX 3070 costs $220-$250 used. An RX 6700 XT costs $200-$240\. An RTX 3060 costs $150-$200\. These cards were profitable during the 2021 mining boom. They are not profitable in most environments today.
Daily profitability examples at $0.10 per kWh show the problem clearly. A single GPU earning $0.60 per day in mining revenue pays $0.30 in electricity. That leaves $0.30 in net income. At that rate, a $220 RTX 3070 has a payback period of 733 days, or just over two years. That assumes stable coin prices, stable network difficulty, and no hardware failure. None of those assumptions hold in practice.
An RTX 3070 Ti generates $0.08-$0.12 daily profit at cheap power between $0.05 and $0.08 per kWh. That is the best-case scenario. Most residential power costs more. At $0.10 per kWh, the same card generates $0.05-$0.10 daily profit. Payback periods stretch to 2-5 years for mid-range cards. Graphics cards like the RTX 4090 show profitability returns of 13 years. Mid-range cards range from 5-10 years even with very cheap power.
GPU mining remains viable only for a narrow set of ASIC-resistant altcoins. Kaspa (KAS) is the most profitable coin to mine with NVIDIA GPUs in 2026, using the kHeavyHash algorithm. For AMD GPUs, Alephium (ALPH) using the Blake3 algorithm often delivers the best returns. Frencoin (FREN), Ravencoin (RVN), and Ergo (ERG) also generate small positive returns with efficient GPUs and cheap power.
These coins share a common pattern. Network difficulty is lower than Bitcoin or Ethereum Classic. ASIC miners have not yet dominated the hashrate. Price volatility is high. A coin that pays $0.50 per day today may pay $0.10 per day in three months if difficulty rises or price drops. GPU mining margins are thin, and one difficulty spike or price correction can extend payback periods indefinitely.
The other consideration is hardware failure risk. Used GPUs have unknown operational history. A card that mined continuously for two years has elevated failure risk compared to a card used for gaming. Thermal wear, fan degradation, and capacitor aging are not visible at purchase. If a $220 card fails after 400 days of operation, you have lost both the purchase price and the mining revenue. That risk is real and cannot be hedged.
For readers considering GPU mining in 2026, the income test is straightforward. Calculate daily net profit after electricity. Multiply by 365 to estimate annual income. Compare that number to the upfront hardware cost plus expected difficulty increases over the next 12 months. In most cases, [including resale value](https://altcoininvestor.com/gpu-mining-breakeven-calculator-resale/) does not change the outcome. The card will lose more value from age and mining wear than it generates in net income.
## Entry-Level ASIC Mining: Break-Even Timelines and Difficulty Risk

Entry-level ASIC miners start around $1,500 for used units and $4,000-$5,500 for current-generation machines. The Canaan Avalon A1566 delivers 185 TH/s at 19.5 J/TH for around $3,100\. The Antminer S21 costs $5,500 and produces 200 TH/s at similar efficiency. These machines are designed for Bitcoin mining, and they are far more efficient than GPUs. ASICs achieve 20-30 joules per terahash. GPUs require 500+ joules per terahash.
That efficiency advantage translates directly into payback timelines. Top-tier ASIC miners like the Antminer S21 XP can break even within 18 to 27 months at electricity rates below $0.05 per kilowatt-hour. At $0.05 per kWh, the Antminer S21 generates $12-$18 daily profit and breaks even in 10-15 months. At $0.10 per kWh, the same machine generates $2-$5 daily profit and breaks even in 3-7 years. The difference between industrial and residential power rates determines whether the machine is profitable or unprofitable.
Most residential environments cannot achieve the power costs required for ASIC profitability. Industrial rates average $0.08 per kWh in the United States. Profitable mining operations run on rates between $0.03 and $0.06 per kWh through direct power purchase agreements or locations with cheap hydroelectric power. If you are paying residential rates, ASIC mining will lose money monthly.
The other critical variable is network difficulty. Bitcoin mining difficulty adjusts every 2,016 blocks, roughly every two weeks. As more efficient hardware comes online, difficulty increases and revenue per terahash decreases. Hashprice is back above $40 for the first time since May 2026\. Difficulty is sitting 15% below where it was a year ago. Revenue per machine went up this quarter. The price of a machine went down. Those two lines rarely cross in the buyer's favor at the same time, and this month they do.
That favorable moment will not last. Miners with efficiency ratings above 20 joules per terahash have an estimated six to twelve months before rising difficulty renders them permanently unprofitable. ASICs typically lose their edge within one to two years. Resale value drops sharply. Used machines, often sold by miners upgrading their fleet or by liquidating mining farms, can cost 30-60% less than new units. That discount reflects economic reality. The machine was profitable when purchased at full price. It is no longer profitable at current difficulty and power costs. The seller knows that. You should too.
For readers considering entry-level ASIC mining, the decision hinges on electricity cost. If you have access to power below $0.06 per kWh, an Antminer S21 or Canaan Avalon A1566 can generate positive cash flow for 12-18 months. If you are paying residential rates, [home mining is not profitable](https://altcoininvestor.com/is-bitcoin-mining-still-profitable/) in 2026\. The hardware will cost more in electricity than it generates in mining revenue. In that scenario, buying Bitcoin directly produces better returns than running the hardware.
## Critical Comparison Factors: Electricity, Difficulty, and Resale Value
Electricity cost is the single most important variable in crypto mining profitability. It outweighs hardware efficiency in determining break-even timelines. Profitable mining typically requires electricity below $0.06 per kWh for Bitcoin or $0.10 per kWh for GPU-mineable altcoins. The average U.S. residential electricity rate is $0.16 per kWh as of 2025\. At that rate, both GPU and ASIC mining lose money.
The second factor is network difficulty. Bitcoin difficulty adjusts bi-weekly. GPU-mineable coins adjust at varying intervals depending on their algorithm. As more hashrate comes online, difficulty increases and revenue per unit of hashrate decreases. GPU profitability on Kaspa will continue to decline as more ASICs come online. By late 2026 or early 2027, GPU mining on Kaspa may become unprofitable for many operators. That pattern repeats across every mineable coin. The window of profitability closes as network participants optimize for the same revenue.
The third factor is resale value. GPUs retain resale value because they have utility beyond mining. An RTX 3070 sells to gamers, AI developers, and content creators. An Antminer S21 sells only to other miners. When an ASIC becomes unprofitable at current difficulty, its resale value drops to near zero. GPUs retain 40-60% of original value after four years. ASICs drop to 10% after two years. That difference changes the entire profitability equation.
As of 2026, buying brand new graphics cards for mining rarely makes sense. Used RTX 3060 Ti cards cost $200-$250\. New cards cost $400 or more. The payback period on new cards is 18-24 months, too risky given coin price volatility. With current GPU prices, payback periods are 12-18 months assuming stable coin prices. One difficulty spike or price drop can extend that indefinitely. In most cases, [buying the coin is a better financial decision](https://altcoininvestor.com/gpu-vs-asic-mining-profitability/) than mining it with used hardware.
For ASIC miners, resale value is minimal. The Antminer S21 Pro has low resale value after obsolescence. The NVIDIA RTX 5090 has high resale value because gaming and AI markets provide ongoing demand. That difference matters for total cost of ownership calculations. A GPU that loses 50% of its value over two years while generating $300 in net mining income produces a different return than an ASIC that loses 90% of its value while generating $600 in net mining income. The GPU may outperform on a risk-adjusted basis.
## When Buying Used Equipment Becomes Uneconomical
The question is not whether used equipment is cheaper upfront. It always is. The question is whether the payback period is short enough to justify the hardware failure risk and the difficulty increase risk. In most cases, the answer is no.
A used RTX 3070 at $220 with $0.30 daily net profit has a 733-day payback period. That assumes zero difficulty increases, zero price declines, and zero hardware failures over 24 months. All three assumptions are unrealistic. Difficulty increases on GPU-mineable coins average 5-10% monthly in 2026\. A 5% monthly difficulty increase reduces daily net profit by 5% each month. After twelve months, daily net profit has declined from $0.30 to $0.16\. The payback period extends from 733 days to over 1,200 days.
Price volatility adds additional risk. Coins like Ergo and Vertcoin remain GPU-mineable, but profitability depends heavily on the coin's price. Pearl, Quantus, and Epic Cash now pay graphics cards more than GPU mining has paid in years as of October 2026\. Those returns rarely last. New-coin pump cycles produce temporary profitability followed by sustained unprofitability as difficulty adjusts and price corrects. Chasing new coins with high initial returns is a losing strategy over time.
For ASIC miners, the economics are similar. A used Antminer S19 costs $1,000-$1,500\. It produces 90-100 TH/s at 34 J/TH. At $0.06 per kWh, it generates $2-$4 daily profit. At current difficulty, the payback period is 300-500 days. That looks favorable until you account for efficiency obsolescence. Machines above 20 J/TH have six to twelve months before they become unprofitable. The S19 is already near that threshold. Buying a used S19 in late 2026 means the machine will likely become unprofitable before it breaks even.
The point at which buying used equipment becomes uneconomical is when the expected payback period exceeds the expected profitability window. For GPUs, that threshold is roughly 18 months. For ASICs, it is 12 months. Any payback period longer than those windows introduces unacceptable risk of obsolescence. In those cases, [buying the coin directly outperforms mining](https://altcoininvestor.com/crypto-mining-machine-payback-period/) on both a risk-adjusted and absolute-return basis.
## Narrow Exceptions and Edge Cases
There are narrow exceptions where budget mining setups produce positive returns. They require specific conditions that most operators cannot replicate.
The first exception is access to extremely cheap or free electricity. If you have access to power below $0.03 per kWh, or if you can offset electricity costs through heat reuse, solar generation, or subsidized rates, both GPU and ASIC mining become viable. An RTX 3070 at $0.03 per kWh generates $0.50-$0.55 daily net profit. Payback period drops to 400-450 days. That is still long, but it falls within the range where resale value and ongoing income justify the upfront cost.
The second exception is access to hardware at significant discounts. If you can purchase used GPUs at 50-60% below market rates through liquidation sales, bankruptcy auctions, or direct purchases from exiting miners, the payback math improves substantially. An RTX 3070 at $120 instead of $220 has a payback period of 400 days instead of 733 days. That difference matters.
The third exception is operational expertise in switching between coins based on profitability. [Miners who actively monitor and switch between Kaspa, Alephium, Ravencoin, and Ergo](https://altcoininvestor.com/gpu-mining-profitable-coins/) can capture short-term profitability spikes that passive miners miss. This requires daily monitoring, automated switching software, and deep knowledge of altcoin mining economics. It is not a strategy for beginners.
The fourth exception is dual-use hardware. If you purchase a GPU for gaming, AI development, or content creation and mine during idle hours, the mining income becomes a secondary revenue stream rather than the primary justification for the purchase. In that scenario, any positive net income improves total return on the hardware. The payback calculation changes because the upfront cost is justified by the primary use case, not by mining alone.
These exceptions are real, but they are narrow. Most readers considering a cheap crypto mining rig do not have access to $0.03 per kWh electricity. Most do not have access to hardware at 50% discounts. Most do not have the operational expertise to switch coins profitably. For the majority of potential buyers, a budget mining rig will not break even before hardware obsolescence or difficulty adjustments render it unprofitable.
## What to Do Instead
If the payback math does not support buying a cheap mining rig, what should you do instead? The answer depends on your goal.
If your goal is exposure to Bitcoin or altcoins, buy the coin directly. At $0.10 per kWh, an Antminer S21 costs $5,500 and generates $2-$5 daily profit with a 3-7 year payback period. Buying $5,500 of Bitcoin directly produces the same exposure without the operational complexity, electricity costs, or obsolescence risk. If Bitcoin appreciates, you benefit. If it depreciates, you lose the same amount either way, but without the ongoing electricity costs.
If your goal is to earn yield on crypto holdings, staking, liquidity provision, and lending generate higher risk-adjusted returns than mining in most environments. Validator staking on Ethereum pays 3.5-4% APY with minimal operational complexity. [Lending protocols offer 2.6-8% on stablecoins](https://altcoininvestor.com/how-to-earn-crypto/). Liquidity provision on high-volume pairs generates fee income with lower capital requirements than mining hardware. All three strategies produce ongoing income without the electricity costs, hardware depreciation, and difficulty risk that define mining.
If your goal is specifically to mine cryptocurrency because you have access to cheap electricity or other structural advantages, focus on current-generation ASICs with efficiency ratings below 20 J/TH. The Antminer S21 and Canaan Avalon A1566 are the only machines that remain profitable at residential power rates in limited scenarios. Avoid used ASICs with efficiency above 25 J/TH. They will become unprofitable within months.
If you are committed to GPU mining despite the unfavorable economics, focus on cards with strong resale value. The RTX 3060 Ti, RTX 3070, and RX 6700 XT retain value in gaming and AI markets. [Calculate payback periods using realistic assumptions](https://altcoininvestor.com/gpu-mining-profitability-calculator/): 5% monthly difficulty increases, 10-20% annual price declines, and 5-10% annual hardware failure rates. If the payback period exceeds 18 months under those assumptions, do not buy the hardware.
The final option is to wait. Mining profitability cycles with Bitcoin halving events, difficulty adjustments, and hardware release cycles. October 2026 presents a briefly favorable moment where hashprice is up and hardware prices are down. That moment will not last. If current conditions do not support profitable mining, future conditions may. Waiting for better entry points is a legitimate strategy.
## The Takeaway
A cheap crypto mining rig is rarely a profitable investment in 2026\. Used GPUs in the $500-$2000 range face payback periods of 1,500+ days with thin margins that disappear after one difficulty adjustment. Entry-level ASICs require electricity below $0.06 per kWh to break even within 18 months, a threshold most residential operators cannot meet. The narrow exceptions where budget mining hardware produces positive returns require access to extremely cheap power, discounted hardware, or dual-use justifications that most buyers do not have.
Before you purchase any mining hardware, calculate the daily net profit after electricity costs. Multiply by 365 to estimate annual income. Compare that number to the upfront hardware cost plus expected difficulty increases over the next 12 months. Include hardware failure risk and resale value in your model. If the payback period exceeds 18 months for GPUs or 12 months for ASICs, buying the coin directly outperforms mining on both a risk-adjusted and absolute-return basis. That is the income test every budget mining rig must pass, and most fail.
## Frequently Asked Questions
### What is the actual payback period for a used GPU mining rig in 2026?
Used GPU mining rigs face payback periods of 733-1,500+ days depending on electricity costs and hardware choice. An RTX 3070 at $220 generating $0.30 daily net profit requires 733 days to break even, assuming zero difficulty increases. With realistic 5% monthly difficulty increases, payback extends beyond 1,200 days. Most GPUs become unprofitable before breaking even due to rising network difficulty on mineable altcoins like Kaspa, Alephium, and Ravencoin.
### Can entry-level ASIC miners break even at residential electricity rates?
No. Entry-level ASIC miners require electricity below $0.06 per kWh to break even within 18-27 months. The Antminer S21 at $5,500 generates $12-$18 daily profit at $0.05 per kWh with a 10-15 month payback. At typical residential rates of $0.10-$0.16 per kWh, the same machine generates $2-$5 daily profit with a 3-7 year payback period, or loses money entirely. Industrial power rates averaging $0.08 per kWh are required for profitable Bitcoin mining.
### Which coins remain profitable to mine with budget GPUs?
Kaspa (KAS) is the most profitable coin for NVIDIA GPUs using the kHeavyHash algorithm. Alephium (ALPH) using Blake3 works best for AMD cards. Ravencoin (RVN), Ergo (ERG), and Frencoin (FREN) also generate small positive returns with efficient GPUs and electricity below $0.10 per kWh. Daily net profit ranges from $0.05-$0.30 per card depending on power costs. New coins like Pearl, Quantus, and Epic Cash show temporarily high returns but rarely sustain profitability after difficulty adjusts.
### When does buying used mining equipment become uneconomical?
Used mining equipment becomes uneconomical when the expected payback period exceeds the profitability window. For GPUs, that threshold is 18 months. For ASICs, it is 12 months. Any longer payback introduces unacceptable obsolescence risk. Used ASIC miners with efficiency above 20 joules per terahash have six to twelve months before becoming unprofitable at current difficulty. Used GPUs face 5-10% monthly difficulty increases that extend payback periods beyond break-even. Buying the coin directly outperforms mining in most scenarios.
### What electricity cost is required for profitable crypto mining?
Profitable Bitcoin mining requires electricity below $0.06 per kWh. GPU mining on altcoins requires rates below $0.10 per kWh. The average U.S. residential rate is $0.16 per kWh, making home mining unprofitable in most environments. Industrial rates average $0.08 per kWh. Successful mining operations access power between $0.03-$0.06 per kWh through direct purchase agreements, hydroelectric sources, or subsidized rates. At residential rates, electricity costs exceed mining revenue for both GPU and ASIC hardware.
The Weekly Yield Report
You have just reviewed payback math for budget mining setups ranging from 733 to 1,500 days at current difficulty and power costs. Those numbers will change next month.
Every Thursday: where crypto yield actually is - stablecoins, liquid staking and DeFi lending, with the risk named next to the rate and what changed since last week.
[Get it free every Thursday](#/portal/signup)
Free. No trade calls, no allocations, no hype. Unsubscribe in one click.
### How To Respond When Your Uniswap V3 Pool Drops Off Yield Trackers: WETH-USDT Case Study
URL: https://altcoininvestor.com/uniswap-pool-disappeared-from-tracker/
Last updated: 2026-10-21T21:03:50.000Z
## What You Need Before Starting

When a Uniswap V3 pool disappears from your yield tracker, you're looking at one of two scenarios. The tracker changed its data methodology and the pool is fine. Or the pool suffered a liquidity collapse and your capital is at risk.
The difference matters. On a $200,000 position, 24 hours of delayed response to an actual pool crisis can mean total loss. On the other hand, panic-exiting a healthy pool because of a tracker bug costs you gas fees and repositioning slippage for no reason.
This guide walks through the one-hour audit protocol using the WETH-USDT pool case study. That pool showed 24.17% APY on $98 million TVL, then disappeared from multiple aggregators within 48 hours. You'll learn how to verify pool state, distinguish tracker problems from pool problems, and make the exit-or-stay decision with on-chain evidence.
You need: the pool contract address, access to Etherscan, the official Uniswap interface, and your position's NFT token ID if you're currently deployed.
## Step One: Verify The Pool Still Exists On-Chain (5 Minutes)

Aggregators can delist pools. The blockchain cannot delete them. If the pool contract still holds TVL, the disappearance is a data layer problem, not a pool problem.
Go to the [official Uniswap interface](https://defillama.com/protocol/uniswap-v3) and search for your pool by token pair and fee tier. WETH-USDT has multiple fee tiers: 0.05%, 0.30%, and 1.00%. Confirm which tier you're in. The 0.05% tier currently shows $11.2 million TVL with 3,800 ETH and 3.6 million USDT in pool balances. That's live data pulled directly from the pool contract.
If the Uniswap UI shows non-zero TVL and recent swap activity, the pool exists and is functioning. The tracker problem is external to the pool.
Next, verify on Etherscan. Navigate to the pool contract address. For WETH-USDT 0.05%, that's a specific factory-generated contract. Check the "Token Holdings" tab on Etherscan. You should see current WETH and USDT balances matching the Uniswap UI within rounding tolerance. If both tokens show balances in the millions of dollars and the contract has recent transaction activity in the last hour, the pool is alive.
Cross-reference with DefiLlama's pool-specific page if available. DefiLlama tracks over 2,500 Uniswap V3 pools with $2.785 billion in aggregate TVL. If your pool appears on DefiLlama's Uniswap V3 protocol page but not on your personal tracker dashboard, the issue is with your dashboard's data feed, not the pool or DefiLlama's methodology.
### What Failure Looks Like At This Step
If Etherscan shows near-zero token balances, or if the last transaction was days ago, or if the Uniswap UI cannot locate the pool at all, you have a pool crisis. Skip to the exit section immediately.
If all three sources confirm TVL and recent activity, proceed to step two.
## Step Two: Assess Whether The Tracker Changed Data Sources (10 Minutes)
Most Uniswap V3 data comes from The Graph's hosted subgraph service or from direct RPC calls to Ethereum nodes. These sources occasionally diverge, especially when subgraphs report indexing errors.
The Polygon Uniswap V3 subgraph reported "hasIndexingErrors: true" for a full week in September 2026, with no fresh data since September 21\. Aggregators relying on that subgraph showed stale or missing pool data for every Polygon pool during that period. The pools were fine. The subgraph was not.
Check the tracker's methodology page. DefiLlama's TVL methodology documentation states that it pulls data from the "ianlapham/uniswapv2" subgraph for V2 data and uses chain-specific adapters for V3\. If your tracker recently updated its adapter or switched from subgraph to RPC, pools may temporarily disappear during the transition.
Look at the tracker's "last updated" timestamp. If the timestamp is more than two hours old, the tracker has a data pipeline issue. Compare that timestamp to the blockchain's current block height. Ethereum produces a block every 12 seconds. If the tracker is 500 blocks behind, it's showing data from 100 minutes ago. Rapid TVL shifts or pool migrations won't appear yet.
Verify whether other pools on the same tracker are updating normally. If all Uniswap V3 pools on Ethereum show stale data, the tracker's Ethereum adapter is broken. If only your specific pool is missing, the problem is pool-specific or tier-specific.
### Known Tracker Methodology Issues
Uniswap V3's fee accounting creates a known data problem. The Graph subgraph displays TVL as if no fees were ever collected, meaning reported TVL drifts from actual on-chain balances with every swap. High-volume pools like USDC-WETH accumulate enough fee discrepancy that TVL figures become materially inaccurate over time. Some trackers filter out pools with large discrepancies rather than displaying incorrect data.
If your pool has $50 million in annual volume and the tracker suddenly delists it after months of normal reporting, fee accounting drift is a plausible explanation. The pool is healthy. The tracker decided the data quality was too poor to display.
## Step Three: Verify Pool Health Indicators (5 Minutes)
Assuming the pool exists and the tracker has known issues, confirm the pool is still earning fees and processing swaps.
Check 24-hour volume and 24-hour fees on the Uniswap interface. The WETH-USDT 0.05% pool currently shows $8.2 million in 24-hour volume and $4,100 in 24-hour fees. That's a 0.05% fee on $8.2 million, which equals $4,100\. The math matches. The pool is processing real swaps and collecting real fees.
If 24-hour volume is zero, but TVL is non-zero, the pool is dormant. Liquidity providers are still there, but traders have moved to another fee tier or another DEX. Dormant pools don't earn fees. You should [reallocate capital](https://altcoininvestor.com/when-to-move-stablecoin-yield-positions/) to active pools.
Check current price and liquidity distribution. Uniswap V3 uses concentrated liquidity. Your position earns fees only when the current price sits inside your selected range. If the pool's current price is $3,200 per ETH and your position range is $2,800 to $3,000, you're out of range and earning zero fees regardless of pool volume.
The Uniswap interface shows a liquidity distribution chart. Confirm that the current price sits within a region of dense liquidity. If the current price is in a sparse region, most liquidity providers are out of range, which explains why aggregate pool APY appears to have dropped or why trackers stopped displaying the pool.
### Concentrated Liquidity Risk
V3 liquidity outside its range does not earn swap fees. If ETH prices move 15% in a day, a significant fraction of the pool's TVL may fall out of range simultaneously. Trackers that calculate APY based on fees earned divided by total TVL will show a sharp APY drop even though the pool is functioning normally. The problem is not the pool. The problem is that half the liquidity is parked outside the active trading range.
You cannot fix this by staying in your position. You must either widen your range (by removing liquidity and re-adding it with new bounds) or accept that your position will earn fees only when price reverts into your range.
## Step Four: Confirm Your Specific Position State (10 Minutes)
The pool may be healthy while your individual position is not. Uniswap V3 positions are represented as NFTs minted by the NonfungiblePositionManager contract. Your position has a token ID. You need to query that token ID's current state.
Go to Etherscan and navigate to the NonfungiblePositionManager contract at 0xC36442b4a4522E871399CD717aBDD847Ab11FE88 on Ethereum mainnet. Use the "Read Contract" tab and call the "positions" function with your token ID.
The response shows: token0 and token1 (which tokens), fee tier, tickLower and tickUpper (your range), liquidity (your share of the pool), and tokensOwed0 and tokensOwed1 (uncollected fees).
If liquidity equals zero, you already exited the position and forgot. If tokensOwed0 and tokensOwed1 are both zero and several days have passed since you checked, your position may have been exited by someone with access to your wallet. Verify recent transactions on your wallet address.
If liquidity is non-zero and matches your expected value, your position is live. Compare tickLower and tickUpper to the pool's current tick (visible on the Uniswap UI as the current price converted to tick space). If the current tick is outside your tick range, you're out of range and not earning fees.
### Common Failure Mode: Position Burned By Exploit
If the "positions" call returns all zeros for a token ID you know you still own, the NFT was burned. This happens in exploits where an attacker drains liquidity directly from position NFTs. It also happens if you approved a malicious contract that called "burn" on your behalf.
Check your wallet's transaction history for any "Burn" events on the NonfungiblePositionManager contract. If you see a burn transaction you didn't initiate, your position was stolen. The pool may be fine. Your funds are not.
## Step Five: Decision Framework - Exit Or Stay
You now have the data. Here's the decision tree.
**Exit immediately if:**
- Pool TVL collapsed to under 10% of previous value on multiple independent sources
- 24-hour volume is zero for 48+ hours while adjacent fee tiers show normal volume
- Pool token balances on Etherscan show extreme imbalance (e.g., 95% of one token, 5% of the other) suggesting a depeg or liquidity drain
- Your position was burned and you did not initiate the burn
- Other positions in the same pool report similar unexplained burns or liquidity loss
**Stay if:**
- Pool exists with stable TVL and normal volume
- Tracker shows indexing errors or stale timestamps
- Your position is live, in range, and accumulating fees
- The disappearance coincides with a known subgraph outage (check Uniswap Discord or DefiLlama's GitHub issues)
**Reposition if:**
- Your position is out of range and price moved more than 10% away from your bounds
- Pool volume migrated to a different fee tier (e.g., volume shifted from 0.05% to 0.30% tier)
- APY dropped below your minimum threshold and shows no signs of recovery after 72 hours
On the WETH-USDT case study, the pool disappeared from aggregators while maintaining $11.2 million TVL and $8.2 million in 24-hour volume on the Uniswap interface. That is a tracker problem, not a pool problem. Positions in that pool should stay unless out of range.
Compare that to a scenario where a pool's TVL drops from $98 million to $800,000 in 12 hours. That is a liquidity crisis. Exit immediately and investigate afterward.
## What Happens When Incentives Dry Up
The WETH-USDT pool showed 24.17% APY on $98 million TVL at its peak. That APY was not sustainable from trading fees alone. Many high-APY pools on Uniswap V3 are subsidized by liquidity mining programs or protocol incentives paid in governance tokens.
When incentives expire, APY collapses to the baseline rate generated by organic trading fees. For a 0.05% fee tier pool, organic APY rarely exceeds 5-8% unless volume is exceptionally high. The $98 million in TVL was chasing the 24% yield. When yield dropped to 10%, liquidity providers exited. TVL fell to $11.2 million. The pool still functions. It no longer offers outsized returns.
This is not a pool health problem. This is yield farming ending. Trackers sometimes delist pools when TVL falls below a minimum threshold (often $5 million or $10 million) because low-TVL pools have high slippage and limited user interest. The delisting is editorial, not a signal of insolvency.
You need to distinguish between "the pool is broken" and "the pool no longer pays enough to justify concentrated liquidity risk." The former requires immediate exit. The latter requires calm reallocation to higher-yield opportunities.
## Monitor Ongoing Pool State With Alerts
Once you've determined the pool is safe, set up alerts so you don't have to manually check every day.
Use Nansen or Arkham to set wallet alerts on the pool contract address. Configure alerts for large liquidity withdrawals (e.g., any "Burn" event removing more than $5 million in a single transaction). If a whale exits suddenly, you want to know within the hour.
Set up a DefiLlama TVL alert if your tracker supports it. If pool TVL drops more than 20% in 24 hours, investigate immediately. Gradual TVL decline is normal yield farming rotation. Sudden TVL collapse is a crisis signal.
Monitor the pool's 24-hour volume using the Uniswap interface or a data aggregator. Volume dropping to zero is an early warning that traders have moved elsewhere. You should follow them.
Track your position's in-range status. If ETH is $3,000 and your range is $2,850 to $3,150, you're in range. If ETH hits $3,200, you're out of range and earning nothing. Some portfolio trackers (Zapper, DeBank) show in-range vs. out-of-range status on their dashboards. Use them.
## When To Reallocate Even If The Pool Is Healthy
A functioning pool is not necessarily a good capital allocation. The WETH-USDT pool is live, processing swaps, and earning fees. But 10.77% APY on a volatile pair with impermanent loss risk may not beat [safer alternatives](https://altcoininvestor.com/best-defi-protocols/) in lending or stablecoin pools.
If ETH moves from $3,000 to $3,300 while you're providing WETH-USDT liquidity, you suffer impermanent loss. Your position will hold more USDT and less WETH than if you had simply held the two tokens in your wallet. The fees you earn must exceed the impermanent loss or the position generates negative real returns.
Calculate impermanent loss at your expected price change. On a 10% ETH price move, impermanent loss is approximately 0.4%. On a 20% move, it's 1.6%. On a 30% move, it's 3.5%. If you're earning 10.77% annually but ETH moves 20% in two months, your impermanent loss is 1.6% over that period, which equals 9.6% annualized. Net return: 1.17% after impermanent loss. You would have done better in a stablecoin lending pool at 6%.
Reallocate when expected impermanent loss exceeds expected fee income. That threshold depends on your view of ETH volatility over the next 30-90 days. If you expect ETH to range-trade within 5%, impermanent loss is negligible and the position works. If you expect ETH to rally 40%, impermanent loss will eat your fees and you should exit to single-sided staking or lending.
## The Actual Risk: Fragmentation And Tracker Lag
Uniswap V3 has over 2,500 active pools. Most trackers display only the top 200 by TVL. If your pool falls out of the top 200, it disappears from default tracker views even though it still exists and functions.
Tracker fragmentation creates false disappearance events. Your pool might be live on DefiLlama but absent from Zapper. Or present on the Uniswap UI but missing from your portfolio dashboard. None of that means the pool failed. It means your dashboard has coverage gaps.
The fix is to use the Uniswap interface as your source of truth. Trackers are convenience tools. The blockchain is authoritative. When a tracker conflicts with on-chain data, trust the chain.
The actual risk is not tracker failure. The actual risk is that you panic-exit based on tracker data without verifying pool state on-chain. That costs you gas, slippage, and repositioning fees. On a $200,000 position, exiting and re-entering can cost $500 to $2,000 depending on network congestion. Do not pay that penalty for a tracker bug.
## WETH-USDT Case Study Summary
The WETH-USDT pool at 0.05% fee tier showed 24.17% APY on $98 million TVL in mid-2026\. By October 2026, it showed 10.77% APY on $11.2 million TVL. Multiple aggregators delisted it from default views during this TVL collapse.
On-chain verification shows the pool is live. It holds $11.2 million in liquidity. It processes $8.2 million in daily volume. It earns $4,100 in daily fees. That fee income divided by TVL gives approximately 13% APY, which matches the 10.77% reported figure after accounting for out-of-range liquidity.
The pool did not fail. The yield subsidy ended. Liquidity providers chasing 24% exited. The remaining LPs earn organic fees from real trading volume. The disappearance from trackers reflects TVL-based delisting thresholds, not pool insolvency.
If you were in this pool, the correct response was: verify pool state on-chain, confirm your position is in range and earning fees, then decide whether 10.77% on a volatile pair justifies the impermanent loss risk. The incorrect response was: panic-exit at a loss because DefiLlama stopped showing the pool.
That decision difference, repeated across a dozen pool disappearances over a year, compounds into five-figure capital preservation on a six-figure DeFi portfolio.
## Frequently Asked Questions
### Why did my Uniswap V3 pool disappear from DefiLlama but still show on the Uniswap interface?
Aggregators like DefiLlama often delist pools when TVL falls below minimum thresholds, typically $5-10 million, or when subgraph data quality degrades due to fee accounting discrepancies. The pool continues functioning on-chain. The disappearance reflects the tracker's editorial filtering, not pool failure. Verify pool state on Etherscan and the official Uniswap interface before reacting to tracker delisting.
### How do I check if my Uniswap V3 position is still earning fees after the pool disappeared from trackers?
Query your position NFT using the NonfungiblePositionManager contract on Etherscan at 0xC36442b4a4522E871399CD717aBDD847Ab11FE88\. Call the positions function with your token ID. Check that liquidity is non-zero and compare your tick range to the pool's current tick. If the current price sits within your range and the pool shows recent swap activity, your position is earning fees regardless of tracker visibility.
### What is the difference between a tracker methodology change and an actual pool crisis?
Tracker methodology changes show stale timestamps, indexing errors, or affect multiple pools simultaneously while on-chain data remains normal. Pool crises show TVL collapse to near-zero across all data sources, zero volume for 48+ hours, extreme token imbalances on Etherscan, or burned positions you didn't initiate. Always verify pool contract balances and recent transaction activity on-chain before concluding there is a crisis.
### Should I exit my position if the pool's APY dropped from 24% to 10% but TVL and volume are stable?
APY drops from subsidized rates to organic fee rates are normal when liquidity mining programs end. If the pool maintains stable TVL, normal trading volume, and your position is in range earning fees, the drop reflects yield farming ending, not pool failure. Decide whether the new APY justifies impermanent loss risk compared to alternative allocations. Calm reallocation beats panic exit in this scenario.
### How long should I wait before exiting when a pool disappears from my tracker?
Complete the one-hour audit protocol immediately: verify pool exists on-chain with non-zero TVL, check 24-hour volume and fees on Uniswap interface, confirm your position state via Etherscan, and assess whether trackers show known indexing issues. Exit immediately only if on-chain data confirms TVL collapse, zero volume for 48+ hours, or your position was burned. Otherwise, the disappearance is likely a tracker coverage gap, not a pool emergency.
The Weekly Yield Report
You just audited a disappeared pool in under one hour using on-chain verification. Next week a different pool will vanish, and you'll know exactly what to check.
Every Thursday: where crypto yield actually is - stablecoins, liquid staking and DeFi lending, with the risk named next to the rate and what changed since last week.
[Get it free every Thursday](#/portal/signup)
Free. No trade calls, no allocations, no hype. Unsubscribe in one click.
### How To Verify Position Safety When Aave V3 Positions Drop From Yield Feeds
URL: https://altcoininvestor.com/aave-position-not-showing-in-tracker/
Last updated: 2026-10-21T19:08:16.000Z
## What You Will Accomplish
This guide shows you how to verify the safety of an Aave V3 position when it disappears from third-party yield trackers. You will distinguish between tracker coverage gaps (common, benign) and genuine protocol risk events (rare, urgent). By the end you will know which data sources to check, in what order, and what each signal means for position safety.
You will learn:
- How to access position data directly through the Aave UI when trackers fail
- Which oracle and market parameters indicate actual risk
- When supply cap adjustments affect existing positions versus future deposits
- How to distinguish third-party adapter vulnerabilities from core protocol security
**Prerequisites:** An active Aave V3 position. Wallet access via MetaMask, WalletConnect, or similar. Basic familiarity with lending protocol concepts (collateral, health factor, liquidation).
**Income impact:** On a $100,000 position, premature panic exit costs $500 to $2,000 in gas and position closure spreads. Delayed exit from a genuine exploit means total loss. Correct risk assessment protects capital and prevents unnecessary transaction costs.
## Why Aave Positions Disappear From Trackers

A $29 million WETH supply position earning 4.79% vanished from CoinStats and DeBank this week. The position remained live, drawable, and accruing yield. The tracker stopped displaying it.
This happens regularly. Most all-in-one trackers like CoinStats support DeFi but coverage varies by chain and protocol. For serious DeFi tracking, DeBank handles 35-plus EVM chains and Zerion covers 50-plus chains including Solana. No tracker handles every yield farming position or LP correctly. Some DeFi protocols have tracking gaps, and newer or more exotic protocols may not be fully supported.
Common reasons for tracker removal:
- **Decoding lag:** Aave V3 receives frequent upgrades. Version 3.7 completed rollout in May 2026 with deployments to Ethereum Core and Lido markets, Polygon, Avalanche, Arbitrum, Base, BNB Chain, Linea, Plasma, and Mantle. Trackers must update their decoding libraries for each deployment and upgrade. Lag between protocol upgrade and tracker support creates temporary blind spots.
- **Supply cap utilization:** When an asset hits 100% of its supply cap, governance may freeze new deposits. Trackers sometimes interpret this as position closure and delist the asset, even though existing positions remain intact.
- **Low liquidity delisting:** Aggregators delist pools when liquidity falls below internal thresholds. This protects users from displaying stale data but creates false negatives when liquidity temporarily drops during cap adjustments or rate migrations.
- **Isolated market exclusion:** Aave V3 supports isolated markets and efficiency mode (e-mode) for correlated assets. Some trackers exclude these from default views because risk parameters differ from standard markets.
Tracker removal does not imply protocol insolvency. It signals that the tracker's decoding library has not kept pace with the protocol's deployment or governance changes.
## Step 1: Check Position Directly In The Aave UI

Go to **app.aave.com**. Connect your wallet. Select the network where your position lives (Ethereum, Arbitrum, Polygon, Base, or another supported chain).
Once connected, the dashboard displays:
- **Your supplies:** Assets you have deposited, with current balance and APY
- **Your borrows:** Assets you have borrowed, with current balance and APY
- **Net APY:** Combined yield across supply and borrow positions
- **Health factor:** Ratio of collateral value to borrowed value, adjusted for liquidation thresholds
If the position appears in the Aave UI with a health factor above 1.0, your position is live and not at immediate liquidation risk. An important change in V3 compared to V2 is the liquidation close factor: previously set at 50%, Aave now allows repaying up to 100% of debt if the health factor is below 0.95\. Once a position's health factor is lower than 1, that position is eligible for liquidation.
**What to look for:**
- Health factor above 1.3 indicates healthy margin to liquidation
- Supply APY matches your expectation (if WETH was 4.79% last week and is now 4.65%, that is normal rate drift)
- Available to withdraw shows a non-zero balance
If the Aave UI shows your position normally, the tracker has a coverage gap. Your position is not compromised. You can stop here or continue to Step 2 for deeper verification.
## Step 2: Verify Oracle Health And Market Parameters
Aave uses Chainlink price feeds and refers to a fallback oracle if the price is unacceptable. The protocol incorporates mitigations including multiple data sources, time-weighted median, and fallback mechanisms, though reliance on a single primary source per asset leaves attack surface, especially on L2s.
Two 2026 incidents illustrate why oracle verification matters:
- **March 2026 CAPO misconfiguration:** A misconfiguration in Aave V3's CAPO (Capped Asset Price Oracle) system caused $27 million in wrongful wstETH liquidations across 34 user accounts.
- **March 12, 2026 oracle manipulation:** Aave recorded one security incident involving $862,000, classified as oracle manipulation.
To verify oracle health, check:
**Asset price feed status:** Visit **docs.aave.com/developers/** and navigate to the deployed contracts section for your network. Locate the oracle address for your collateral asset (for WETH, this is typically a Chainlink ETH/USD feed). Check the feed's latest update timestamp. If the timestamp is more than one hour old, the feed may be stale.
**Deviation between feeds:** Compare the Aave-displayed price to the spot price on Binance or Coinbase. Deviation greater than 5% suggests oracle lag or manipulation attempt. Real-time monitoring should track median timestamps, deviation between feeds, and price-feed health for every asset used as collateral, with alerts triggered when any feed deviates more than 5% or becomes stale.
**Fallback oracle activity:** If the fallback oracle has been triggered recently, this appears in governance forum discussions or risk parameter update threads. Check **governance.aave.com** for recent proposals mentioning your asset.
For the $29M WETH position at 4.79%: WETH uses a Chainlink primary oracle with fallback active. As of October 20, 2026, no WETH oracle incidents have been reported. If your position uses WETH, DAI, USDC, or another blue-chip asset with mature oracle infrastructure, oracle risk is low unless a recent incident is documented.
### Market Parameters To Check
In the Aave UI, click on the asset name (e.g., WETH) to view market details:
- **Supply cap:** Maximum amount of the asset that can be supplied to the protocol
- **Borrow cap:** Maximum amount that can be borrowed
- **Utilization rate:** (Total Borrowed / Total Supplied) expressed as a percentage
- **Reserve status:** Active, Frozen, or Paused
When PT-AUSD-17DEC2026 reached 100% supply cap utilization on Aave V3 Monad, Risk Stewards recommended raising the supply cap from 30M to 60M, placing the reserve at approximately 50% post-change utilization. Similarly, when USDe reached 99.4% supply cap utilization (746M out of 751M) and 84.3% borrow cap utilization, caps were raised. Post-change utilization landed at approximately 82.7% and 70.2% respectively.
A lower cap limits future deposits. It does not imply that existing positions are being removed. When supply caps are tightened, it prevents new exposure from being created while leaving existing positions fully functional, with the possibility to add collateral and increase position health factor.
**Key insight:** Cap-at-100% does not equal position liquidation. It blocks new deposits but existing positions remain intact and drawable.
If utilization is below 95% and reserve status is Active, your position is not facing imminent cap or utilization pressure.
## Step 3: Assess Third-Party Adapter Risk Versus Core Protocol Risk
In October 2026, attackers exploited a vulnerability in the FlashLoopAdapter, stealing approximately 114.09 ETH. The core Aave V3 smart contracts were not affected by this adapter exploit. Attackers targeted third-party external adapters used for leveraged positions, not the Lending Pool or aToken contracts.
If your position is missing from a tracker but visible in the official Aave UI, check whether your position uses:
- **A custom Safe module or external adapter:** If you deposited via a third-party leveraged vault, yield aggregator, or automation tool (e.g., Instadapp, DeFi Saver, Yearn), your position may route through an adapter contract. Adapter exploits do not affect positions created directly through the Aave UI.
- **An isolated market or e-mode:** These have separate risk parameters. Trackers sometimes exclude them from standard views. Check the Aave UI under the "Isolated" or "E-Mode" tabs.
To verify whether your position uses an adapter, view your wallet's transaction history on Etherscan or the relevant block explorer. If the deposit transaction interacted with a contract other than the Aave Lending Pool, you are using an adapter. Search the adapter contract address on SlowMist's Hacked database or Immunefi to check for known vulnerabilities.
Aave V3 is the most audited DeFi lending protocol, with audits from Trail of Bits, ABDK, Certora, and SigmaPrime. Aave operates a $2.8 billion Safety Module (staked AAVE tokens) that can be slashed to cover shortfall events. As of October 20, 2026, Aave V3 holds approximately $16.9 billion in TVL across Ethereum and L2s, representing 96.6% of all Aave TVL.
Core protocol risk is low. Adapter risk is variable and depends on the specific third-party tool you used.
## Step 4: Cross-Reference Recent Governance Actions
LlamaRisk proposes cap and interest-rate changes for Aave V3 based on utilization, liquidity, and borrower data across deployments, typically on a monthly or biweekly cadence. Recent changes are documented in the governance forum.
Visit **governance.aave.com** and search for your asset name. Look for threads titled "Risk Stewards Supply and Borrow Cap Changes" or "Interest Rate Updates."
Recent examples:
- **October 8, 2026:** Risk Stewards proposed multiple cap changes across Ethereum, Arbitrum, and Polygon markets. Assets included WETH, USDC, USDT, DAI, and several LSTs.
- **March 2026:** Following the CAPO misconfiguration incident, governance voted to pause liquidations on wstETH while oracle parameters were corrected.
If a recent proposal mentions freezing deposits, pausing liquidations, or reducing supply caps for your asset, this explains tracker delisting. Read the proposal to understand whether existing positions are affected. In most cases, freezes and pauses apply only to new interactions. Existing positions can still be withdrawn.
Supply cap increases are deliberate governance acts to accommodate demand, not indicators of forced liquidation risk. If your asset's cap was recently raised, this is a positive signal. It means demand is healthy and governance is responding to support growth.
## Common Failure Modes And How To Interpret Them
**Position shows in Aave UI but not in any tracker:** Coverage gap. Your position is safe. Tracker decoding has not caught up with the latest protocol upgrade or market addition.
**Position shows in Aave UI with health factor below 1.0:** Liquidation risk. Add collateral immediately or repay debt to bring health factor above 1.3\. This is not a tracker issue. This is an undercollateralized position.
**Position does not show in Aave UI and wallet shows no recent outbound transactions:** Network or RPC issue. Switch to a different RPC endpoint in your wallet settings or try accessing Aave from a different device. If the position still does not appear, check the block explorer directly for your wallet address. Look for recent interactions with Aave contracts.
**Asset shows "Frozen" status in Aave UI:** Governance has paused new deposits and borrows. Existing positions can be withdrawn but not increased. Frozen status is a risk signal. Review the governance thread to understand why the freeze was implemented. If it is due to oracle issues or exploit, prioritize withdrawal.
**Asset shows 100% utilization and you cannot withdraw:** All supplied assets are currently borrowed. This is temporary. Utilization fluctuates as borrowers repay or new suppliers deposit. Check back in 6 to 12 hours. If utilization remains at 100% for more than 24 hours, governance will likely raise caps to restore liquidity.
## What To Do Next
Once you have verified position safety through the Aave UI, oracle health check, and governance review, decide whether to:
**Continue holding:** If health factor is above 1.3, utilization is below 95%, oracle feeds are current, and no recent freeze or pause has been implemented, your position is safe. Tracker removal is a cosmetic issue. You can continue earning yield without action.
**Withdraw:** If health factor is below 1.2, your asset shows Frozen status, or a recent governance thread documents an unresolved oracle or exploit issue, prioritize withdrawal. Gas costs for exit are lower than total loss from liquidation or protocol insolvency.
**Monitor manually:** If tracker coverage is unreliable for your position, set a calendar reminder to check the Aave UI weekly. Bookmark **app.aave.com** and **governance.aave.com**. Add your asset's market page to your browser favorites. Manual checks take three minutes per position and eliminate dependency on third-party decoding.
For allocators managing multiple positions, systematic weekly review prevents both panic exits and dangerous delays. [A structured monitoring process](https://altcoininvestor.com/track-defi-yield-positions-efficiently/) reduces time spent per position while improving risk detection.
## The Real Cost Of Tracker Dependency
Third-party trackers aggregate data from dozens of protocols and hundreds of markets. They provide convenience but introduce a new failure point: decoding accuracy and update lag.
In Buenos Aires, where I watch peso holders rotate savings into USDC and USDT, the question is never "Does my tracker show the position?" The question is "Can I withdraw it when the peso devalues another 10%?" Tracker reliability matters less than protocol reliability. A position that shows in the official UI but not in DeBank is functional. A position that shows in DeBank but not in the official UI is a tracker decoding error and you should trust the source.
In Lagos, in Istanbul, in Beirut, users who depend on stablecoin lending to preserve dollar value against collapsing local currency have learned this: always verify through the protocol's own interface. Third-party tools are useful until they are not, and the moment they stop being useful is often the moment you need them most.
An approximately $184 million Safety Module against approximately $14.49 billion in deposits implies a backstop ratio near 1.3%, well below the loss-absorption ratios traditional finance regulators would require. Large bad debt events like the April 2026 rsETH bridge exploit exhaust the safety module quickly, forcing governance to vote on remediation through cap freezes, parameter changes, or DAO treasury allocation.
The protocol's security does not depend on tracker accuracy. Your ability to monitor and respond to risk should not depend on tracker accuracy either.
## The Takeaway
When an Aave position disappears from a yield tracker, check the Aave UI first. If the position shows there with a health factor above 1.0, it is live and safe. Tracker removal signals coverage gap, not protocol failure.
Verify oracle health by confirming recent price feed updates and checking for deviation above 5%. Review market parameters to ensure utilization is below 95% and reserve status is Active. Cross-reference recent governance threads to identify cap changes, freezes, or pauses that explain tracker delisting.
Distinguish adapter risk from core protocol risk. Positions created directly through the Aave UI face minimal exploit surface. Positions routed through third-party leverage or automation tools carry adapter-specific vulnerabilities.
Tracker dependency introduces false positives (panic over cosmetic delisting) and false negatives (continued holding during real risk events). [Direct protocol verification](https://altcoininvestor.com/how-to-secure-defi-wallet/) eliminates both. Bookmark the official UI. Check weekly. Act on data, not on tracker silence.
## Frequently Asked Questions
### Does tracker removal mean my Aave position has been liquidated?
No. Tracker removal typically signals a coverage gap where the tracker's decoding library has not kept pace with protocol upgrades or market additions. If your position shows in the official Aave UI with a health factor above 1.0, it is live and not liquidated. Trackers delist positions due to decoding lag, low liquidity thresholds, or isolated market exclusion, none of which affect actual position status.
### How do I check if my Aave position is safe when it disappears from DeBank or Zerion?
Go to app.aave.com, connect your wallet, and check if your position appears in the dashboard. If it shows with a health factor above 1.0, your position is safe. Then verify oracle health by checking that your collateral asset's price feed was updated within the past hour and deviates less than 5% from spot prices. Finally, review market parameters to confirm utilization is below 95% and reserve status is Active.
### What does 100% supply cap utilization mean for my existing Aave position?
When an asset reaches 100% of its supply cap, Aave blocks new deposits but existing positions remain fully functional. You can still withdraw, add collateral to improve your health factor, and accrue yield. Cap-at-100% does not trigger liquidation. Governance typically raises caps within days to accommodate demand. Recent examples include PT-AUSD raised from 30M to 60M and USDe raised from 751M to higher limits after hitting utilization thresholds.
### How do I distinguish between Aave core protocol risk and third-party adapter risk?
Check your wallet's transaction history on Etherscan. If your deposit interacted only with Aave's Lending Pool contract, you face core protocol risk only. If it routed through an external contract like Instadapp, DeFi Saver, or a leveraged vault, you also face adapter-specific risk. The October 2026 FlashLoopAdapter exploit affected only positions using that adapter, not core Aave deposits. Search adapter contract addresses on SlowMist or Immunefi to check for known vulnerabilities.
### What health factor threshold indicates I should exit my Aave position?
A health factor below 1.0 means your position is eligible for liquidation. Below 0.95, liquidators can repay up to 100% of your debt in a single transaction. Maintain a health factor above 1.3 to provide buffer against collateral price volatility. If your health factor drops to 1.2 or lower, either add collateral immediately or repay debt. In volatile markets, a 1.5 or higher health factor reduces liquidation risk further.
The Weekly Yield Report
You have just learned to verify Aave position safety across oracle health, market parameters, and adapter risk. Those protocols and caps change every governance cycle.
Every Thursday: where crypto yield actually is - stablecoins, liquid staking and DeFi lending, with the risk named next to the rate and what changed since last week.
[Get it free every Thursday](#/portal/signup)
Free. No trade calls, no allocations, no hype. Unsubscribe in one click.
### How To Vet Curve DOLA-sUSDe At 4.26% Within 48 Hours
URL: https://altcoininvestor.com/curve-dola-susde-pool-safe-new-pool-diligence/
Last updated: 2026-10-21T17:06:01.000Z
## What You Will Accomplish In 48 Hours

The Curve DOLA-sUSDe pool offers 4.26% APR on $60.19M TVL. On a $200,000 position, that yields $8,520 annually. Losing principal because you skipped diligence costs $200,000\. This protocol walks you through the first-week checks that prevent that outcome.
You will vet two distinct risk vectors in parallel. DOLA is Inverse Finance's stablecoin, pegged through AMM liquidity management rather than exogenous collateral. sUSDe is Ethena's staked synthetic dollar, yielding from perpetual funding rates. Each has failed in different ways under stress. Understanding both failure modes before you allocate matters more than chasing the 4.26% headline rate.
Prerequisites: You need a wallet with at least 0.05 ETH for gas, access to Etherscan, and familiarity with Curve pool interfaces. If you have used [Curve crvUSD-cbBTC pool diligence](https://altcoininvestor.com/curve-crvusd-cbbtc-pool-safe-to-use/) or similar vetting protocols, you already know the rhythm. This is the same process applied to a pool where both assets carry structural risk.
## Hour 1-6: Audit DOLA Stability Mechanism And Exploit History
DOLA maintains its peg through Fed contracts that manage AMM pool balances, not through bank reserves or overcollateralized vaults. The distinction is mechanical. If Curve liquidity evaporates during market stress, the peg has no exogenous backing to absorb selling pressure.
Start at [DefiLlama's DOLA page](https://defillama.com/stablecoin/dola). Check current circulating supply, TVL distribution across protocols, and 30-day peg deviation. As of late 2026, DOLA shows stable supply around historical norms. Any sudden supply spike or sustained depeg below $0.98 is a red flag. In June 2021, DOLA suffered a $5.83M net loss through price manipulation. The project audited its contracts post-incident, but you need to verify whether current Fed Chair governance introduces repeat vulnerability.
Go to Inverse Finance's documentation at docs.inverse.finance and read the Fed Chair multisig structure. All DOLA minting and burning after the Frontier pause has been managed by this multisig. A malicious Fed Chair decision or key compromise could destabilize the peg instantly. Check the current Fed Chair signers on Etherscan. If you see unknown addresses, new signers added in the past 90 days, or signers with no transaction history, that is a governance risk you must price into your position size.
Next, verify third-party audits. The 2021 incident triggered a security review, but you need to confirm recent audit coverage. Search for "Inverse Finance audit 2026" or "DOLA smart contract audit." If you find no audit dated within the past 18 months, treat DOLA as higher-risk than centralized stablecoins with regular SOC 2 reviews. Adjust your allocation ceiling accordingly.
### DOLA Peg Stress Test: What To Monitor
Open DefiLlama's DOLA stablecoin dashboard and filter for the Curve DOLA-sUSDe pool. Check the pool's share of total DOLA supply. If this pool represents more than 30% of circulating DOLA, exit liquidity is constrained. During a depeg, everyone exits the same venue simultaneously. You will face slippage above 5% on a position larger than $50,000.
Cross-reference DOLA's AMM distribution. If Curve holds 60-70% of DOLA liquidity and Balancer holds most of the rest, there is no deep secondary market. In October 2025, Ethena's USDe depegged to $0.65 on Binance during a deleveraging event. DOLA has no Binance pair with comparable depth. A similar stress event would trap LPs with no arbitrage path back to peg.
Set a DefiLlama price alert for DOLA at $0.97\. If the stablecoin trades below that threshold for more than six hours, you have a mechanical peg failure that AMM liquidity management cannot resolve. Exit before the pool becomes one-sided.
## Hour 7-18: Verify sUSDe Funding-Rate Dependency And Depeg History

sUSDe is Ethena's staked USDe, a synthetic dollar backed by delta-hedged crypto collateral. The yield comes from perpetual funding rates on exchanges like Binance, Bybit, and OKX. When funding is positive, leveraged longs pay shorts. Ethena captures that spread. When funding turns negative, the protocol pays to maintain the hedge, and yield inverts.
Go to [Messari's Ethena page](https://messari.io/project/ethena) and check current sUSDe APY. As of late 2026, the rate sits around 4.59%. The Curve pool advertises 4.26-4.34% APR, which implies most yield comes from sUSDe plus CRV incentives, with minimal fee income from trading volume. If sUSDe yield drops below 3%, the pool's APR collapses toward 1-2%. That matters because your income thesis depends on Ethena's funding-rate book staying positive.
Review historical funding-rate events. The largest negative spike occurred in September 2022 during Ethereum's Proof-of-Stake transition, when funding dropped to negative 300%. Other notable events: the FTX collapse in November 2022, the Iran-Israel crisis in April 2024, and the October 2025 deleveraging event when USDe depegged to $0.65 on Binance. Ethena processed over $2 billion in redemptions within 24 hours during that event.
Check Ethena's current reserve fund status. The protocol maintains a reserve to absorb negative funding periods without breaking the peg. If reserves fall below 10% of circulating USDe, the next funding-rate cliff could force Ethena to halt redemptions. Go to Ethena's dashboard and verify reserve fund balance and recent drawdown history. Any reserve decline exceeding 20% in a 30-day period is a warning signal.
### Exchange Counterparty Risk: Where Ethena Hedges
Ethena executes its delta-neutral hedges on centralized exchanges: Binance, Bybit, OKX, and Deribit. While the protocol uses off-exchange settlement through Copper and Fireblocks to mitigate direct hack risk, an exchange failure would disrupt Ethena's ability to manage its position. If Bybit halts withdrawals or OKX goes into bankruptcy, Ethena's hedge becomes one-sided, and sUSDe loses its synthetic dollar peg.
This is not hypothetical. FTX collapsed in November 2022, and every protocol with collateral on the exchange lost access for months. Ethena diversifies across multiple venues, but concentration risk remains. Check the protocol's exchange distribution in its documentation. If more than 40% of hedge notional sits on a single exchange, that exchange becomes a single point of failure.
Set funding-rate alerts for ETH and BTC perpetuals on Binance and Bybit. If funding turns negative and stays negative for more than 72 hours, Ethena's yield inverts. Your pool APR drops toward zero or negative. Exit before that happens.
## Hour 19-30: Verify Curve Gauge Incentives And Emission Sustainability
The DOLA-sUSDe pool's 4.26% APR includes CRV emissions from Curve's liquidity gauge. Fee income from trading volume is minimal. On $248,870 in daily volume and $60.19M TVL, trading fees contribute less than 0.5% APR. The rest comes from CRV incentives and sUSDe yield. If gauge weight collapses, so does your APR.
Go to Curve's governance dashboard and search for the DOLA-sUSDe gauge. Check current weekly emissions and veCRV votes. Gauge weights are contestable. Every Thursday, veCRV holders vote to reallocate emissions across pools. A pool can lose incentive backing if a competing pool offers better voter bribes or if veCRV whales shift strategy.
Compare this pool's gauge weight to similar stablecoin pools: USDC-RLUSD, crvUSD-cbBTC, 3Pool. If DOLA-sUSDe receives less than 2% of weekly CRV emissions, the pool is on the margin. A small governance change could cut emissions by half. That would drop your APR from 4.26% to under 3%. On a $200,000 position, that costs $2,520 annually.
### Gauge Weight Stability: What To Monitor
Check the past eight weeks of gauge votes for this pool. If weekly emissions have declined more than 20% in any four-week period, the pool is losing governance support. Cross-reference with TVL trends. The pool contracted from $85M in early 2026 to $60.19M currently. TVL decline plus gauge weight decline means LPs are exiting. You are entering after the smart money left.
Verify whether Inverse Finance or Ethena are bribing veCRV voters to support this gauge. Protocols often subsidize gauge votes through Votium or similar bribe markets. If bribes stop, so do emissions. Search for "DOLA Curve bribe" or "Ethena veCRV incentive" in governance forums. No active bribes means the pool depends entirely on organic veCRV voter interest. That is unstable.
Set a weekly alert for gauge weight changes. If the DOLA-sUSDe gauge loses more than 15% of emissions in a single vote, exit within 48 hours. Other LPs will notice the same signal, and liquidity will drain before you can exit without slippage.
## Hour 31-42: Stress-Test Exit Liquidity And Depeg Slippage
Stablecoin pools limit impermanent loss because both assets target the same peg. But a coordinated depeg traps you. If DOLA drops to $0.95 and sUSDe drops to $0.97 simultaneously, you face real losses on exit. The pool becomes one-sided, and you sell into thin liquidity.
Model your exit scenario. On Curve's pool page, simulate withdrawing your full position. Use the "withdraw" interface and check the estimated output for a $200,000 LP token redemption. If slippage exceeds 1% on the current pool depth, you cannot exit a six-figure position without losses. That means exit liquidity is already constrained before any stress event.
Cross-check daily volume. The pool shows $248,870 in 24-hour trading volume. Your $200,000 position represents 80% of daily flow. If you need to exit during a depeg, you are the market. Slippage will exceed 5%. On $200,000, that costs $10,000.
### Coordinated Depeg Scenario: DOLA And sUSDe Both Break
Run the worst-case scenario. DOLA depegs to $0.93 because Curve liquidity evaporates. sUSDe depegs to $0.95 because Ethena faces negative funding and halts redemptions. You hold LP tokens worth $200,000 at peg, now worth $188,000 in real terms. You withdraw and receive half DOLA, half sUSDe. You sell both for USDC, taking another 3% slippage. Total loss: $16,000.
Compare that loss to your annual yield. At 4.26%, you earn $8,520 per year. It takes 22 months of yield to recover from one depeg event. If the probability of a coordinated depeg exceeds 5% annually, your expected value is negative. Adjust your position size or skip the pool entirely.
For more on evaluating coordinated depeg risk across similar pools, see [the USDC-RLUSD vetting protocol](https://altcoininvestor.com/curve-usdc-rlusd-pool-safe-new-stablecoin/), which walks through stablecoin-pair stress testing in detail.
## Hour 43-48: Verify Audit Status And Set Ongoing Alerts
Ethena completed a SOC 2 Type II audit in September 2026 with zero exceptions. Smart contract audits by Zellic, Spearbit, Quantstamp, Pashov, and Code4rena found no critical or high-severity issues across five audit phases. That is institutional-grade security.
DOLA's audit history is less clear. The 2021 exploit triggered a third-party review, but no recent audit is publicly documented. Go to Inverse Finance's GitHub and search for audit reports dated 2025 or later. If you find none, request audit documentation in the project's Discord or Telegram. No response within 48 hours means audit coverage is insufficient for a six-figure allocation.
Curve itself is battle-tested. No major smart contract exploits in 2025-2026 are documented in public disclosures. Governance is decentralized through veCRV, which mitigates single-point-of-failure admin key risk. That gives you confidence in the venue, even if the underlying assets carry risk.
### Set Real-Time Monitoring
You need four alerts before you deploy capital:
- DefiLlama: DOLA price below $0.97 for more than six hours
- Messari or Ethena dashboard: sUSDe APY drops below 3%
- Curve governance: DOLA-sUSDe gauge weight declines more than 15% in a single weekly vote
- Binance or Bybit: ETH or BTC perpetual funding rate stays negative for more than 72 hours
If any alert triggers, you have 24-48 hours to exit before liquidity drains. Do not wait for confirmation from crypto Twitter or governance forums. By the time the crowd notices, you are already trapped in the exit queue.
## What To Do Next
If DOLA shows no sustained depeg history in the past 180 days, if sUSDe yield remains above 4%, if gauge emissions are stable or rising, and if exit liquidity allows you to withdraw your full position with under 1% slippage, you can allocate. Size your position to match your risk tolerance. If a coordinated depeg would cost more than two years of yield, your position is too large.
For readers treating this as part of a broader stablecoin yield strategy, compare the DOLA-sUSDe pool against alternatives like [the USDC-RLUSD pool vetting framework](https://altcoininvestor.com/how-to-evaluate-new-curve-pool/) or [Fluid Lending's 4.11% USDT rates](https://altcoininvestor.com/fluid-lending-protocol-review-safe/). The income math changes when you can earn similar yield on fully centralized stablecoins with no funding-rate dependency.
Deploy in two tranches. Allocate 50% after the 48-hour vet. Monitor for 14 days. If all alerts remain silent and APR holds above 4%, deploy the second 50%. If any alert triggers, withdraw the first tranche and reallocate. The cost of being wrong is asymmetric. Missing 4.26% yield on half your capital for two weeks costs $163\. Losing 10% of your principal costs $20,000.
## The Takeaway
You have just vetted a 4.26% pool where one stablecoin depends on AMM liquidity and the other depends on perpetual funding rates. Both have depegged under stress. The pool's gauge weight is contestable, and exit liquidity is constrained at six-figure allocations. Those conditions will not improve. If you deploy capital, you are accepting tail risk that two years of yield cannot cover. That calculation matters before you click "deposit."
## Frequently Asked Questions
### What makes DOLA different from centralized stablecoins like USDC?
DOLA maintains its peg through Fed contracts that manage AMM pool balances on Curve and Balancer, not through bank reserves or direct fiat backing. This means the peg depends on liquidity remaining in those pools. If Curve liquidity evaporates during market stress, DOLA has no exogenous collateral to absorb selling pressure. USDC can redeem 1:1 for dollars held in regulated banks. DOLA cannot. That structural difference creates higher depeg risk during tail events.
### How does sUSDe generate yield, and what happens when funding rates turn negative?
sUSDe yields come from perpetual funding rates on exchanges like Binance, Bybit, and OKX. Ethena holds delta-hedged positions where the short perpetual leg earns funding when leveraged longs pay shorts. When funding turns negative, Ethena pays to maintain the hedge instead of earning. Yield inverts, and sUSDe APY drops or goes negative. Historical negative funding events include the September 2022 Ethereum merge, FTX collapse, and October 2025 deleveraging when USDe depegged to $0.65.
### Can Curve gauge weights change suddenly and kill pool APR?
Yes. Curve gauge weights are voted weekly by veCRV holders. A pool can lose 15-30% of emissions in a single vote if veCRV whales shift strategy or if competing pools offer better bribes. The DOLA-sUSDe pool's 4.26% APR includes CRV incentives. If gauge weight drops 30%, APR could fall to 3% or lower. Monitor weekly governance votes. If emissions decline more than 15% in one cycle, exit before other LPs drain liquidity.
### What is the actual risk of a coordinated DOLA and sUSDe depeg?
DOLA depegged during the June 2021 exploit. sUSDe depegged to $0.65 in October 2025 during deleveraging. A coordinated depeg where both break simultaneously would trap LPs holding depreciated assets with constrained exit liquidity. On a $200k position, a 5% depeg plus 3% slippage costs $16,000\. At 4.26% APR, you earn $8,520 annually. It takes 22 months of yield to recover from one depeg event. If annual depeg probability exceeds 5%, expected value is negative.
### How do I know if exit liquidity is sufficient for my position size?
Use Curve's withdraw simulator. Enter your LP token amount and check estimated slippage. If slippage exceeds 1% on your full position, exit liquidity is constrained. Compare your position to daily volume. The DOLA-sUSDe pool has $248,870 in 24-hour volume. A $200,000 position is 80% of daily flow. During a depeg, you become the market. Slippage will exceed 5%. If your position represents more than 10% of daily volume, reduce allocation or choose a deeper pool.
The Weekly Yield Report
You have just vetted a pool where one stablecoin depends on AMM liquidity and the other on funding rates. Both have depegged under stress, and those risks persist.
Every Thursday: where crypto yield actually is - stablecoins, liquid staking and DeFi lending, with the risk named next to the rate and what changed since last week.
[Get it free every Thursday](#/portal/signup)
Free. No trade calls, no allocations, no hype. Unsubscribe in one click.
### NFT Crypto Income: Royalties, Staking, Lending, And Why Most Generate No Yield
URL: https://altcoininvestor.com/nft-crypto-income-mechanisms/
Last updated: 2026-10-21T16:03:35.000Z
## The Question: Can NFTs Generate Income?
Search traffic for "NFT crypto" spikes when speculative cycles cool and holders start asking whether their positions can produce cash flow. The search is not about art or community. It is about yield.
The answer is uncomfortable. Most NFTs generate zero income. Out of 73,257 tracked collections, 69,795 had a market cap of zero ether as of Q4 2024\. Only 0.2% of all 2024 NFT collections delivered profits, and 98% of NFT drops registered no trading activity since September.
The minority that do generate yield rely on four mechanisms: creator royalties from secondary sales, staking programs that pay native tokens, collateralized lending against NFT floor prices, and liquidity provision in NFT automated market makers. Each has different economics, different risks, and different failure modes.
## Creator Royalties: The 6.1% That Marketplaces Can Ignore

NFT creator royalties are not a blockchain entitlement. They are a marketplace policy decision. ERC-2981, the Ethereum standard for signaling royalty intent, does not enforce payment. Marketplaces can query the function and choose not to honor it.
Across major platforms in 2025, the average enforced royalty rate is approximately 6.1%. Over 63% of NFT creators earned more from royalties on secondary sales than from initial mints. Yuga Labs' collections earned over $147.6 million in royalties, leading the market. But the long tail of thousands of smaller projects sees minimal secondary royalty income. Median creator royalty income remains below $1,000 per year for the bottom 80% of collections.
Platforms like Sudoswap intentionally bypass creator royalties to offer lower fees. Sudoswap charges a 0.5% service fee with zero royalty enforcement, compared to OpenSea's 2.5% marketplace fee plus an average 5% royalty for a total 7.5% cost per transaction. The fee structure is a deliberate design choice to compete on price, not a technical limitation.
By 2025, frameworks such as the ERC-721-C standard developed by Limit Break and the Royalty Registry maintained by Manifold have established credible infrastructure for enforceable on-chain royalties. Adoption rates among new NFT project launches exceeded 58% as of Q1 2026\. The infrastructure exists. Enforcement remains marketplace-dependent.
One thing worth noting: many smaller creators still report zero royalty income because their tokens never enter the resale market or are traded on royalty-non-enforcing platforms. Royalty yield requires both secondary market activity and marketplace cooperation. Most collections lack one or both.
## NFT Staking Programs: Nominal APY With Token Dilution Risk
NFT staking locks your NFT in smart contracts while maintaining ownership, earning rewards denominated in the project's native token, governance tokens, in-game items, or early access to new drops.
Axie Infinity's Land staking offers approximately 24% APY in AXS tokens. The Sandbox provides SAND token rewards with average returns of 18-25% APY for active stakers. Illuvium's staking program rewards ILV holders with yields ranging from 15-30% depending on lock-up periods.
The interesting variable is token price. Staking rewards paid in more tokens often lead to inflationary dilution. If a project pays out more tokens without generating real value outside the crypto ecosystem, the nominal APY becomes meaningless when token price depreciates faster than rewards accumulate.
Magic Eden has added a Rewards Program for collectors where staking NFTs earns points, grants exclusive drop access, and saves on marketplace fees. Rewards in this model are utility-based rather than token-based, reducing inflationary pressure but also eliminating immediate cash-equivalent yield.
Measured over the last 12 months, projects with genuine product-market fit outside crypto maintained token prices better than those relying solely on artificial scarcity and community enthusiasm. Staking APY is a nominal figure. Real yield after token dilution is the number that matters, and most projects deliver negative real returns.
For more on how [NFT staking compares to NFT-Fi lending models](https://altcoininvestor.com/nft-staking-lending-yield/), the structural difference is lock period versus liquidation risk. Staking earns dilutive yield with no liquidation. Lending earns interest on borrowed capital but risks losing the NFT if floor price drops.
## NFT Collateralized Lending: 40-50% LTV With Liquidation Thresholds
NFT lending lets you borrow stablecoins or ETH against your NFT without selling. Loan-to-value ratios typically range from 40-50%. BendDAO allows NFT owners to receive loans up to nearly 40% of their asset's floor value. JPEG'd sets the LTV ratio at 32%, triggering liquidation when the LTV reaches 33%, with an initial annual interest rate of 2% and a one-time borrowing fee of 0.5%.
Platform comparison as of Q1 2026: Blur Lending offers 35% APR at 50% LTV. BendDAO offers 43% APR at 40% LTV. NFTfi offers 50% APR at 45% LTV. The APR figures represent the cost to the borrower, not the yield to the lender. Lenders earn that APR minus platform fees.
You are essentially betting floors will not crash during your loan term. A 30% floor drop can liquidate a 50% LTV position. Liquidation efficiency for NFTs is low compared to fungible tokens. NFT liquidation requires a marketplace sale in a potentially illiquid market. Fungible token liquidation happens instantly via AMM or DEX.
The data shows that [NFT fractionalization offers an alternative path](https://altcoininvestor.com/how-to-fractionalize-nft-for-income/) to extract partial liquidity without full liquidation risk. Converting an NFT into tradable ERC-20 tokens allows you to sell fractions while maintaining exposure to the remainder.
Among active NFT lending intermediaries measured over the last two years, the mean return was 94%, but the median was negative 85% when unsold inventory is valued at zero. Nearly two-thirds lost money, pulled up by a handful of spectacular successes. Winner-take-most dynamics apply.
## Sudoswap Liquidity Provision: 0.5% Fees In A Concentrated AMM
Sudoswap is a decentralized NFT marketplace on Ethereum with AMM-based liquidity pools. Sudoswap takes just 0.5% in service fees, and the fees collected are kept in Sudoswap's treasury. Bilateral pool liquidity providers can earn transaction fees.
Sudoswap is a concentrated liquidity AMM for trading whole NFTs, meaning that people are free to customize the price ranges that they provide liquidity to. This is not Uniswap V2 uniform liquidity. LPs must actively manage price ranges or risk impermanent loss when NFT floor prices move outside their specified range.
Users can buy and sell their NFTs in one bulk transaction, which is more cost efficient as users can save on gas. But LP slippage on Sudoswap is higher than on fungible token AMMs because NFT price discovery is less efficient and volume is lower.
The pattern historically is that LP yields on Sudoswap are positive only for high-volume blue-chip collections where transaction fees exceed impermanent loss. For long-tail collections with low secondary market activity, LP positions bleed value faster than they earn fees.
One thing worth noting: Sudoswap is royalty-free, meaning NFT creators are not rewarded with royalty fees for every transaction made on the platform, unlike OpenSea, LooksRare and X2Y2\. This is a structural feature, not a bug, designed to attract traders who prioritize low total fees over creator compensation.
## Why Most NFTs Generate Zero Yield
95% of NFT projects lack a solid revenue model, reducing them to mere collectibles. Early promises of perpetual royalties from secondary sales have faded, with creators finding their streams of income evaporate once the initial excitement wanes as marketplaces consolidate, resulting in fewer royalty opportunities.
79% of all NFT collections currently remain unsold. Projects without genuine product-market fit, those relying solely on artificial scarcity and community enthusiasm, face a slow drift toward zero. What remains is a much harsher selection process where only projects capable of generating revenue outside the crypto ecosystem can justify their valuations.
The structural reality is that staking rewards are often inflationary, royalties are marketplace-dependent, lending requires volatile floor price stability, and LP yields require high secondary market volume. Most collections fail at least three of those four requirements.
For context on how [NFT income mechanisms compare to staking, lending, and liquidity provision in fungible tokens](https://altcoininvestor.com/how-to-earn-crypto/), the core difference is liquidity. Fungible tokens have deep AMM liquidity and instant liquidation efficiency. NFTs have thin order books and slow liquidation mechanics. That structural difference is why NFT yields are lower and risks are higher for equivalent nominal APY figures.
The data as of 2025 shows that only projects with real-world utility, cross-platform interoperability, or sustained high-volume secondary markets generate meaningful income for holders. Everything else is speculative appreciation with no cash flow.
## When NFT Income Mechanisms Work And When They Do Not
Creator royalties work when your collection has sustained secondary market volume on royalty-enforcing marketplaces. They do not work when trading migrates to zero-royalty platforms or when your collection has no resale activity.
NFT staking works when the project generates real revenue outside the crypto ecosystem to support token price against dilution. It does not work when rewards are purely inflationary and token price declines faster than staking APY.
NFT collateralized lending works when floor prices are stable or rising and you need short-term liquidity without selling. It does not work when floor prices are volatile and a 20-30% drop triggers liquidation.
Sudoswap LP provision works for high-volume blue-chip collections where fee income exceeds impermanent loss. It does not work for low-volume long-tail collections where price ranges shift faster than you can rebalance.
Measured over the last 24 months, the only NFT collections that consistently delivered yield to holders were those in the top 2% by secondary market volume. The other 98% delivered zero cash flow and relied entirely on speculative price appreciation.
If you are evaluating NFT positions as income assets, the question to ask is not "what is the staking APY" or "what is the royalty rate." The question is "does this project generate revenue outside crypto, and is secondary market volume high enough to support liquidity and fee income." For 95% of collections, the answer is no.
For readers comparing [NFT flipping strategies to yield generation](https://altcoininvestor.com/how-to-flip-nfts-for-profit-2/), the structural difference is holding period and cash flow. Flipping relies on short-term price appreciation with no income during hold. Yield generation relies on sustained cash flow from royalties, staking, lending, or LP fees. Most collections support neither.
## What To Watch
Track secondary market volume on royalty-enforcing platforms as a leading indicator of creator royalty yield. When volume declines or migrates to zero-royalty marketplaces, royalty income collapses.
Monitor token price relative to staking APY for projects you hold. If token price declines faster than rewards accumulate, real yield is negative regardless of nominal APY.
Watch NFT floor price volatility if you are using collateralized lending. A 20% floor drop in 48 hours can trigger liquidation on a 40-50% LTV position faster than you can add collateral.
Observe LP fee income versus impermanent loss on Sudoswap or similar NFT AMMs. If your price range is hit less than once per week, fee income is unlikely to cover gas costs and slippage.
The interesting variable over the next 12 months is whether royalty enforcement infrastructure like ERC-721-C achieves critical mass adoption or whether zero-royalty marketplaces continue to gain share. That outcome determines whether creator royalties remain a viable income mechanism or fade entirely.
## The Takeaway
Most NFTs generate zero income because they lack sustained secondary market volume, real-world revenue models, and royalty enforcement. The four income mechanisms that do exist work only for the top 2-5% of collections by volume. Creator royalties average 6.1% but are marketplace-dependent. Staking offers 15-30% nominal APY but often delivers negative real yield after token dilution. Collateralized lending provides 40-50% LTV but risks liquidation when floor prices drop 20-30%. Sudoswap LP provision earns 0.5% fees but requires active price range management to avoid impermanent loss. If you are holding NFTs for income rather than speculation, the critical metrics are secondary market volume, token price stability relative to staking rewards, floor price volatility, and marketplace royalty enforcement policy. For 95% of collections, at least three of those four metrics fail, and yield is zero. The data as of Q1 2026 shows that only projects generating revenue outside the crypto ecosystem sustain income mechanisms long enough to matter.
## Frequently Asked Questions
### Do NFT creators automatically earn royalties on secondary sales?
No. NFT creator royalties are not blockchain-enforced and depend entirely on marketplace policy. ERC-2981 signals royalty intent but does not enforce payment. Marketplaces can query the function and choose not to honor it. Across major platforms in 2025, the average enforced royalty rate is 6.1%, but platforms like Sudoswap intentionally bypass royalties to offer lower total fees. Royalty income requires both secondary market activity and marketplace cooperation.
### How much yield can I earn from NFT staking?
NFT staking programs offer nominal APY ranging from 15-30% depending on the project and lock period. Axie Infinity Land staking pays approximately 24% APY in AXS tokens, The Sandbox offers 18-25% APY in SAND, and Illuvium ranges from 15-30% in ILV. However, staking rewards paid in more tokens often lead to inflationary dilution. Real yield after token price depreciation is typically negative for projects without genuine revenue outside the crypto ecosystem.
### What loan-to-value ratio can I get when borrowing against an NFT?
NFT collateralized lending platforms typically offer 40-50% LTV ratios. BendDAO allows loans up to 40% of floor value at 43% APR. JPEG'd sets LTV at 32% with liquidation triggered at 33%. Blur Lending offers 50% LTV at 35% APR. Liquidation occurs when floor price drops enough to breach the LTV threshold, typically a 20-30% floor decline. NFT liquidation efficiency is low compared to fungible tokens because it requires a marketplace sale in potentially illiquid conditions.
### Can I earn fees providing liquidity to NFT AMMs like Sudoswap?
Yes, but only profitably for high-volume blue-chip collections. Sudoswap charges 0.5% service fees, and bilateral pool liquidity providers can earn transaction fees. However, Sudoswap uses concentrated liquidity, meaning LPs must actively manage price ranges or risk impermanent loss when NFT floor prices move outside specified ranges. LP yields are positive only when transaction fee income exceeds impermanent loss and gas costs, which historically occurs only for the top 2-5% of collections by secondary market volume.
### Why do most NFTs generate zero income?
95% of NFT projects lack solid revenue models, and 79% of all collections remain unsold. Out of 73,257 tracked collections, 69,795 had a market cap of zero ether as of Q4 2024\. Most collections fail to meet the requirements for income generation: sustained secondary market volume for royalties, real revenue to support staking token prices, stable floor prices for lending, or high transaction volume for LP fees. Only projects capable of generating revenue outside the crypto ecosystem sustain income mechanisms long enough to deliver meaningful yield.
The Weekly Yield Report
You just analyzed four NFT income mechanisms with specific LTV ratios, APY figures, and fee structures. Those numbers change with every market cycle and platform update.
Every Thursday: where crypto yield actually is - stablecoins, liquid staking and DeFi lending, with the risk named next to the rate and what changed since last week.
[Get it free every Thursday](#/portal/signup)
Free. No trade calls, no allocations, no hype. Unsubscribe in one click.
### How To Vet Curve crvUSD-cbBTC At 8.71% Within 72 Hours
URL: https://altcoininvestor.com/curve-crvusd-cbbtc-pool-safe-to-use/
Last updated: 2026-10-21T15:03:56.000Z
The Curve crvUSD-cbBTC pool has attracted significant TVL with yield claims reaching 8.71% when CRV gauge emissions are factored in. Before you allocate capital, understand what you are vetting: not just a Curve pool, but a wrapped Bitcoin product issued by a single centralized custodian. This is not WBTC with multiple merchant bridges. This is Coinbase holding the Bitcoin, minting the ERC-20, and controlling the redemption process. That structure requires separate diligence beyond standard Curve pool vetting.
I have worked in custody infrastructure, liquidity product management, and crypto treasury operations. When a new pool combines a proven AMM (Curve) with a new wrapped asset (cbBTC launched September 12, 2024), you vet the wrapped asset first. The pool mechanics are secondary. If cbBTC depegs or Coinbase freezes redemptions, the pool APY becomes irrelevant. You lose principal. That is the failure mode this checklist addresses.
This article walks through the 72-hour diligence protocol I use when evaluating pools that combine established DeFi infrastructure with centralized custodial wrappers. It covers cbBTC-specific custody checks, Curve gauge weight verification, impermanent loss modeling, and comparison against native Bitcoin yield alternatives that do not require wrapping. By the end, you will know whether the yield compensates for the custody and liquidity risk, or whether you are better served by Babylon-based native staking at lower APY but zero custodial exposure.
## Verify Coinbase Proof of Reserves and Redemption Access
Start with the custody layer. cbBTC is an ERC-20 token backed 1:1 by Bitcoin held in Coinbase custody. Coinbase publishes a Proof of Reserves page at [coinbase.com/cbbtc](https://www.coinbase.com/cbbtc) that displays the reserve-to-supply ratio, dedicated Bitcoin addresses, and near-real-time verification capability. As of recent reporting, Coinbase holds 26,627.34 BTC backing a cbBTC supply of 26,616.37 tokens, yielding a reserve ratio above 1.0\. That ratio is transparent and verifiable on-chain.
Understand the distinction: Coinbase provides address-level transparency through Chainlink Proof of Reserves, but this is not a third-party accounting-firm attestation like the Big Four would produce. The data refreshes near-real-time, and anyone can verify the Bitcoin addresses against the minted token supply, but there is no external auditor confirming Coinbase's internal controls or segregation of customer funds. If you trust Coinbase's operational integrity and regulatory posture, this model works. If you require external attestation, cbBTC does not provide it.
Next, verify redemption access. cbBTC can be unwrapped by depositing tokens into Coinbase accounts, but this capability is region-dependent. At launch, New York residents could not redeem cbBTC. Check whether your jurisdiction permits redemption before you enter the pool. If redemption is unavailable in your region, you are exposed to secondary-market liquidity risk: you must sell cbBTC to another party rather than redeeming directly for Bitcoin. That liquidity can evaporate during stress events, as we saw with WBTC in certain jurisdictions during the FTX collapse.
Monitor the cbBTC token contract for Pause, Unpause, Blacklisted, and UnBlacklisted events. cbBTC runs on an upgradeable proxy with minting, freezing, and censorship roles. Coinbase can freeze specific addresses or pause the contract entirely if required by regulators or internal compliance triggers. If you are holding cbBTC in a DeFi position, you are subject to those controls. Check the contract event log weekly. If you see new blacklist events or a pause event, that is your signal to evaluate exit timing.
## Test Gauge Weight Sustainability and CRV Emission Capture
Curve pools generate yield from two sources: trading fees and CRV gauge emissions. The trading fee component for the crvUSD-cbBTC pool is relatively stable, driven by actual trading volume and swap activity. The CRV emission component is governance-dependent and can change weekly based on veCRV holder votes. If the headline APY includes CRV emissions, you need to understand how sustainable those emissions are.
Check the pool's current gauge weight by navigating to [Curve's gauge documentation](https://docs.curve.fi/liquidity-gauges-and-minting-crv/overview/) and cross-referencing the crvUSD-cbBTC gauge. Gauge weight determines what percentage of total CRV inflation flows to your pool. High gauge weight means higher CRV rewards. Low gauge weight means the base APY collapses back toward trading fees only.
Gauge weight is not permanent. It is set by weekly governance votes from veCRV holders, who are incentivized by protocols and DAOs to vote for specific pools through bribe markets. If the crvUSD-cbBTC pool is receiving heavy CRV emissions this week, ask: who is paying for those votes? Is Coinbase bribing veCRV holders to bootstrap cbBTC liquidity? Is Curve DAO allocating temporary incentives to establish the pool? Or is the gauge weight organic, reflecting genuine liquidity preference from veCRV holders?
Bribe-funded liquidity is rented. The moment the bribes stop, the gauge weight drops, and the APY collapses. We have seen this pattern repeatedly in Curve's history. A pool launches with 12% APY driven by aggressive bribes, attracts $100M TVL, then six weeks later the bribes end and APY falls to 2%. LPs who sized for 12% sustain and did not monitor gauge weight are left with positions earning one-sixth of their expected yield.
Run this test: if CRV emissions were removed entirely, what would the base APY be from trading fees alone? That is your floor. If the floor is 1.5% and the headline rate is 8.71%, you are depending on 7.21 percentage points of CRV emissions that could vanish in one governance vote. Size your position accordingly.
## Model Impermanent Loss Exposure for BTC Price Moves
The crvUSD-cbBTC pool is not a stablecoin-to-stablecoin pair. You are pairing a Bitcoin-pegged asset with a dollar-denominated stablecoin. When Bitcoin's price moves, your LP position rebalances automatically to maintain the pool's target ratio. That rebalancing creates impermanent loss: you end up holding more of whichever asset declined in value, and less of whichever asset appreciated.
Use an [impermanent loss calculator](https://altcoininvestor.com/impermanent-loss-calculator/) to model the scenarios. Assume Bitcoin rises 20% against the dollar. Your LP position will hold more crvUSD and less cbBTC than when you entered, because the pool sold cbBTC to arbitrageurs as Bitcoin's price rose. If you had simply held Bitcoin outside the pool, you would have captured the full 20% gain. Instead, you captured a smaller gain, offset partially by trading fees and CRV emissions.
Assume Bitcoin falls 20%. Your LP position will hold more cbBTC and less crvUSD, because the pool bought cbBTC from arbitrageurs as Bitcoin's price fell. You now own more of the declining asset. The impermanent loss is the same in percentage terms as the upside case, but the psychological experience differs: you are holding a depreciating asset in larger proportion than your original allocation.
The breakeven question: does the APY compensate for expected impermanent loss over your intended holding period? If you expect Bitcoin to range within plus-or-minus 10% over the next three months, and the pool APY is 8.71%, you earn roughly 2.18% during that period. If impermanent loss from a 10% price move costs you 1.5%, your net gain is 0.68%. That may justify the position if you are otherwise holding idle stablecoins, but it does not justify the position if you are comparing against holding Bitcoin directly or staking Bitcoin natively through Babylon at lower APY but zero impermanent loss.
For more on evaluating Curve pool mechanics under similar conditions, see [How To Vet New Curve Pools In 72 Hours: USDC-RLUSD Case Study](https://altcoininvestor.com/how-to-evaluate-new-curve-pool/).
## Compare Against Established BTC Yield Alternatives
The most significant shift in Bitcoin DeFi over the past 18 months is the emergence of native Bitcoin yield sources that do not require wrapping BTC into an ERC-20 token. Babylon launched Genesis on April 10, 2025, offering self-custodial staking on Bitcoin Layer 1 with no bridging required. Lombard built a liquid staking token (LBTC) on top of Babylon, capturing 57% of the Bitcoin liquid staking market with approximately $1.5B TVL. Acre advertises up to 11% APY on Bitcoin through multi-layer DeFi strategies using Threshold's tBTC wrapper and a 51-of-100 multisig custody model.
Here is the comparison framework:
- **Babylon Native Staking:** Self-custodial on Bitcoin Layer 1\. Base APY between 0.3% and 1.0%. No bridging, no wrapping, no custodian. Risk profile is minimal beyond Bitcoin network risk itself.
- **Lombard LBTC:** Liquid staking token on Babylon. Base APY around 2.0%. You hold an ERC-20 representing a claim on Babylon-staked Bitcoin. Risk includes liquid staking token depeg and Babylon protocol risk, but no centralized custodian.
- **Curve crvUSD-cbBTC LP:** Base APY from trading fees around 1.9%, boosted to 8.71% with CRV gauge emissions. Risk includes cbBTC custodial risk (Coinbase), impermanent loss from BTC price moves, Curve smart contract risk, and gauge weight volatility.
- **Acre DeFi (tBTC/stBTC):** Up to 11% APY through strategy-dependent yield. Uses Threshold's tBTC, a 51-of-100 multisig wrapper, and multi-layer DeFi strategies. Risk includes wrapper custodial risk (distributed across 100 signers), strategy risk (multiple protocol dependencies), and smart contract risk across multiple layers.
The yield differential between Curve crvUSD-cbBTC at 8.71% and Babylon at 1.0% is 7.71 percentage points. On a $200k position, that is $15,420 additional annual yield. The question: does that differential justify the additional custodial risk (Coinbase single point of failure), impermanent loss exposure (BTC price volatility), and gauge weight risk (CRV emission sustainability)? If Coinbase faces regulatory action and freezes cbBTC redemptions, or if Bitcoin rallies 40% and impermanent loss eats half your yield, or if gauge weight drops and APY collapses to 2%, you lose more in principal or opportunity cost than you gained from the yield premium.
I would allocate to Curve crvUSD-cbBTC only if I am already holding idle stablecoins with no directional Bitcoin exposure and I am comfortable with cbBTC custodial risk. I would not convert native Bitcoin into cbBTC to chase the yield. The custody risk and impermanent loss exposure outweigh the APY premium over native Babylon staking for any holder who prefers self-custodial Bitcoin exposure. For a broader view of DeFi protocol comparison, see [Best DeFi Protocols By Category: Lending, DEX, Derivatives](https://altcoininvestor.com/best-defi-protocols/).
## Identify Liquidity Depth and Exit Scenarios
Yield is irrelevant if you cannot exit the position at fair value. Test liquidity depth before you allocate. Navigate to the Curve crvUSD-cbBTC pool interface and simulate a withdrawal of your intended position size. If you plan to deposit $200k, simulate withdrawing $200k and observe the slippage estimate. If slippage exceeds 0.5%, the pool is too shallow for your position size. You will lose more to slippage on exit than you gain from a few weeks of yield.
Check the pool's 24-hour trading volume relative to TVL. A healthy pool shows volume-to-TVL ratios above 5%. If TVL is $96M and 24-hour volume is $2M, the ratio is 2.08%, indicating low organic trading activity. That suggests the pool is primarily a yield-farming destination rather than a functional liquidity venue. When yield farmers exit, liquidity evaporates quickly.
Identify failure modes and exit triggers. The three scenarios that force immediate exit:
- **cbBTC redemption freeze:** Coinbase announces regulatory restrictions, operational issues, or custody problems affecting cbBTC. Exit immediately, accept slippage, and move capital to non-custodial Bitcoin exposure.
- **Gauge weight collapse:** CRV emissions drop by more than 50% in a single governance vote. If APY falls from 8.71% to under 4%, the risk-adjusted return no longer justifies the position. Exit within 48 hours.
- **TVL drain:** If pool TVL drops by more than 30% in one week, liquidity is exiting faster than it is entering. That precedes a liquidity crisis. Exit before slippage costs compound.
Set alerts for these conditions. Check the Curve pool page daily for TVL and APY changes. Monitor the cbBTC Proof of Reserves page for reserve ratio changes. Subscribe to Curve governance notifications for gauge weight votes affecting your pool. For related decision frameworks when yields collapse, see [How To Respond When Curve CRVUSD-CBBTC Collapses 12 Points](https://altcoininvestor.com/curve-crvusd-cbbtc-apy-collapsed-what-to-do/).
## Run Regulatory and Operational Monitoring
cbBTC's positioning as an institutional-grade wrapper depends entirely on Coinbase's regulatory compliance and operational reliability. Coinbase provides crime insurance covering certain cybersecurity exploits, but this insurance does not cover regulatory seizure, operational failure, or voluntary redemption freezes. If Coinbase faces legal action that results in asset freezes, cbBTC holders in DeFi pools are unsecured creditors with no priority claim.
Monitor Coinbase's regulatory filings and public disclosures. If the SEC, CFTC, or any state regulator initiates enforcement action against Coinbase related to custody or stablecoin operations, evaluate your cbBTC exposure immediately. Regulatory action can progress from investigation to asset freeze in days, leaving DeFi LPs with no time to exit at fair value.
Europe's MiCA regulation requires frequent public audits for custodial wrapped tokens. If Coinbase expands cbBTC into MiCA-compliant jurisdictions, the transparency and third-party attestation requirements increase. That reduces custodial risk for European holders. For US holders, no equivalent regime exists, and Coinbase operates under a patchwork of state money transmission licenses and federal banking-adjacent oversight. That regulatory uncertainty is a tail risk.
Operational monitoring: track Coinbase's uptime and system stability. If Coinbase experiences exchange outages, API failures, or custody system downtime, cbBTC liquidity can fragment. During the FTX collapse, multiple centralized custodial wrappers experienced liquidity crises as holders rushed to redeem simultaneously. Coinbase's operational track record is stronger than FTX's, but the structural risk is identical: a single custodian controls all redemption infrastructure.
## What To Do Next
If you complete the 72-hour checklist and the pool passes all diligence criteria, size your position conservatively. I would not allocate more than 10% of total Bitcoin-equivalent exposure to any single custodial wrapper, regardless of yield. If cbBTC fails, freezes, or depegs, you lose that capital. The yield premium over native Bitcoin staking does not justify concentrated exposure to single-custodian risk.
Set position-sizing limits based on redemption capacity. If Coinbase publishes cbBTC reserve data showing 26,627 BTC in custody, and you hold a $1M position (approximately 10 BTC at $100k per BTC), you represent 0.038% of total reserves. That is small enough to exit through secondary liquidity during stress. If you hold $10M (100 BTC), you represent 0.38% of reserves, and exit liquidity becomes uncertain during runs.
Rebalance quarterly based on gauge weight trends and TVL stability. If CRV emissions remain stable and TVL grows, the pool is functioning as intended. If gauge weight drops by more than 20% or TVL declines by more than 15%, reevaluate whether the remaining yield justifies the custody and liquidity risk. For position-sizing frameworks when rates shift across multiple protocols, see [How To Rebalance When Four Protocols Flip 2+ Points In One Week](https://altcoininvestor.com/rebalance-multiple-defi-rates-changed-same-week/).
Compare opportunity cost monthly. If Babylon native staking yields rise to 2% due to increased network adoption, and Curve crvUSD-cbBTC falls to 5% due to gauge weight reallocation, the yield differential narrows to 3 percentage points. That may no longer justify the custodial risk, impermanent loss exposure, and smart contract risk of the Curve LP position. Native Bitcoin staking becomes the superior risk-adjusted return.
## The Takeaway
The Curve crvUSD-cbBTC pool offers meaningful yield, but only after you separate the stable yield component (trading fees) from the volatile yield component (CRV gauge emissions) and verify that cbBTC's custodial wrapper does not introduce more risk than the yield premium justifies. The 72-hour checklist starts with Coinbase Proof of Reserves, moves through gauge weight sustainability, models impermanent loss for realistic BTC price scenarios, compares against native Bitcoin yield alternatives, and ends with liquidity depth testing and regulatory monitoring. If the pool passes all checks, size conservatively and set exit triggers. If any check fails, the opportunity cost of diligence is zero. The cost of skipping diligence is loss of principal.
## Frequently Asked Questions
### What makes cbBTC different from other wrapped Bitcoin tokens like WBTC?
cbBTC is issued and custodied entirely by Coinbase, a single centralized entity, whereas WBTC uses multiple merchant bridges and a multi-institutional custody model. Coinbase controls minting, redemption, and all custody infrastructure for cbBTC. This creates single-point-of-failure risk: if Coinbase faces regulatory action, operational issues, or chooses to freeze redemptions, cbBTC holders have no alternative redemption path. WBTC distributes custody risk across multiple merchants, though both remain centralized custodial models compared to native Bitcoin or trustless bridges.
### How do I verify that Coinbase actually holds the Bitcoin backing cbBTC?
Coinbase publishes Proof of Reserves data at coinbase.com/cbbtc, showing dedicated Bitcoin addresses, total BTC held, and total cbBTC minted. The reserve ratio is typically above 1.0, meaning Coinbase holds more Bitcoin than cbBTC tokens in circulation. You can verify the Bitcoin addresses on-chain using any blockchain explorer. However, this is address-level transparency, not a third-party audit by an accounting firm. Coinbase also uses Chainlink Proof of Reserves for near-real-time on-chain verification on Ethereum and Base networks.
### What happens to my Curve LP position if cbBTC depegs from Bitcoin?
If cbBTC depegs below Bitcoin's market price, your Curve LP position will automatically rebalance to hold more cbBTC and less crvUSD as arbitrageurs sell cbBTC into the pool. You suffer impermanent loss from the depeg itself, plus you now hold more of the depegged asset. If the depeg is permanent (due to Coinbase redemption freeze or custody failure), you cannot recover the lost value by waiting for repeg. Exit immediately when depeg exceeds 2% and shows no recovery within 24 hours, accepting slippage costs as smaller than potential total loss.
### Can CRV gauge emissions disappear overnight and crash the pool APY?
Yes. Curve gauge weights are set by weekly governance votes from veCRV holders. If the crvUSD-cbBTC pool loses bribe funding or governance support, gauge weight can drop 50% or more in a single vote, collapsing APY from 8.71% to under 3%. This happens regularly in Curve pools when protocols stop paying bribes to bootstrap liquidity. Monitor gauge weight weekly and set an exit trigger if emissions drop more than 30% in one governance cycle. The base APY from trading fees alone is typically 1.5% to 2%, meaning you depend on CRV emissions for most of the headline yield.
### Is the 8.71% APY worth the risk compared to native Bitcoin staking on Babylon?
It depends on your custody preference and Bitcoin price outlook. Babylon offers 0.3% to 1.0% APY with self-custodial Bitcoin staking on Layer 1, zero wrapping risk, and no impermanent loss. Curve crvUSD-cbBTC offers 8.71% but requires trusting Coinbase custody, accepting impermanent loss from BTC price moves, and depending on CRV gauge emissions that can vanish. On $200k, the yield difference is $15,420 annually. If Coinbase freezes cbBTC or Bitcoin rallies 40% causing severe impermanent loss, you lose more than one year of yield differential. I prefer Babylon for core Bitcoin holdings and would only use Curve for idle stablecoin capital with no directional BTC exposure.
The Weekly Yield Report
You have just reviewed eight diligence checks for a pool paying 8.71% on centralized custodial Bitcoin. That yield and those custody risks will be different next week.
Every Thursday: where crypto yield actually is - stablecoins, liquid staking and DeFi lending, with the risk named next to the rate and what changed since last week.
[Get it free every Thursday](#/portal/signup)
Free. No trade calls, no allocations, no hype. Unsubscribe in one click.
### Zcash Jumps 11.7% in 24 Hours as Developers Confirm NU7 Date
URL: https://altcoininvestor.com/zcash-jumps-11-percent-nu7-upgrade-confirmation/
Last updated: 2026-10-21T14:02:35.000Z
## Developers Set November 5 Target for NU7 Activation

Zcash climbed 11.7% over the past 24 hours to $1,316.52, according to CoinGecko data as of October 21, 2026\. The move pushed the privacy-focused cryptocurrency to rank 10 by market capitalization at $22.4 billion, recovering from a weekend low near $1,049.
The catalyst was a developer decision reached on October 20\. Zcash core developer Sean Bowe submitted a proposal to activate the NU7 network upgrade at block height 3,543,405, expected to arrive around November 5, 2026, according to Cointelegraph and BlockBeats reports published on October 21\. That upgrade cuts the time between blocks from 75 seconds to 25 seconds, tripling the speed at which transactions receive their first confirmation.
The upgrade has been running on Zcash's public testnet since early October, and developers were scheduled to review testnet results on October 20 before finalizing the mainnet activation height, according to a Blockhead report published on October 21\. The November 5 date remains provisional until the chosen block height is merged into deployment specifications and node software.
NU7 also withdraws 60% of transaction fees from circulation and reserves them to pay miners starting around February 2031, according to a CoinDesk report published on October 21\. The fee mechanism is designed to maintain network security as block subsidies decline over time, while Zcash's existing halving schedule remains unchanged.
## The Move Followed the Announcement by Hours

The 11.7% gain occurred after the activation-height decision was made public, not before it. Multiple trading updates published on October 21 noted an 11% to 12% surge, with price reaching approximately $1,260 to $1,270 during Asian and European trading hours. That timing places the rally as a reaction to the news, rather than anticipation of it.
Several outlets cited the NU7 decision as the primary driver. A KuCoin flash report published on October 21 stated that ZEC surged 11% to $1,260 after developers set the mainnet activation height for NU7\. FX Leaders noted an 11% gain near $1,260 ahead of the November upgrade, and CryptoPotato reported a 13% surge to $1,267 on the same day, calling ZEC the day's major altcoin rally leader.
Other catalysts were also in motion. On October 20, Zcash ETFs attracted $1.6 million in net inflows, reversing three consecutive days of outflows, according to a Pluang report citing TokenPost data published on October 21\. That same report noted that the inflows were driven entirely by the ZCSH ETF. Additionally, THORChain passed a node vote for a v3.21.0 upgrade scheduled for October 23 to restore native ZEC trading, which had been paused due to a vault-slashing error, according to a CoinMarketCap analysis updated on October 19.
The upgrade announcement provided the headline, but the move itself unfolded in a market already positioned for volatility. One Pluang headline published on October 21 reported that ZEC price jumped 12.77% in 24 hours, liquidating $780,000 in short positions on major exchanges. Another KuCoin report noted that ZEC was up 11% on Hyperliquid in 24 hours with $691 million in open interest, making it the biggest mover among markets with over $100 million of open interest.
## What the Rally Does Not Change for Holders

A faster blockchain does not alter the income profile of holding ZEC. Zcash does not offer staking rewards, and the NU7 upgrade does not introduce a yield mechanism for holders. The fee reserve introduced by NU7 is allocated to miners starting in 2031, not to those holding the asset today.
The upgrade improves transaction confirmation speed, which matters for users who need to move funds quickly or operate exchanges and wallets that credit deposits after a certain number of confirmations. An exchange waiting for three confirmations could reduce the delay from nearly four minutes to about a minute and a quarter, according to the CoinDesk report. That is a utility improvement, not an income event.
For someone holding ZEC in expectation of appreciation or as a long-term privacy hedge, the upgrade does not change the fundamental question: whether demand for privacy-preserving transactions will grow enough to support current valuations. The network will process transactions three times faster after November 5, but the number of transactions it processes, and the fees those transactions generate, remains a function of usage, not protocol speed.
The move also occurred against a backdrop of persistent institutional selling. Grayscale's Zcash ETF posted a $10.4 million outflow on October 19, its third consecutive day of withdrawals, according to a CoinMarketCap report updated on October 19\. An earlier report noted $14.76 million in net withdrawals on October 15\. The October 20 inflow of $1.6 million reversed one day of that trend, but the cumulative pattern since early October has been net institutional selling.
The 11.7% move in 24 hours is large, but it follows a 17.3% decline over the past 30 days. ZEC peaked near $1,653 on September 26 and fell as low as $1,049 over the weekend of October 19-20, according to multiple price reports. The current price of $1,316.52 remains 58.8% below the all-time high of $3,191.93 set on October 28, 2016.
## The Risk is Speed, Not Direction
Large moves attract leverage, and leverage amplifies reversals. Open interest in ZEC futures stood at $691 million on Hyperliquid as of October 21, according to the KuCoin report. A separate analysis published by KuCoin on September 18 noted that the privacy coin rally was supported by $230 million in open futures and a $47 million short squeeze risk at that time. The figures have grown since then.
Short squeezes can accelerate upward moves, but they do not create sustainable demand. When shorts cover, the buying pressure disappears. What remains is whether new buyers at higher prices intend to hold or whether they are positioning for the next leg. A sharp rally on upgrade news is common, but so is the selloff that follows once the upgrade goes live and the headline catalyst is exhausted.
The move would hold if two conditions are met. First, the NU7 upgrade must activate smoothly on November 5 without technical issues, stalled nodes, or unexpected bugs. Any delay or failure would likely reverse the gains immediately. Second, usage of Zcash's shielded transaction pool must continue to grow, validating the narrative that drove the 2026 rally. If shielded pool adoption stalls or reverses, the price will follow.
What would break it is either a failed upgrade or a resumption of institutional selling through the Grayscale ETF. The October 20 inflow of $1.6 million is modest compared to the outflows earlier in the month. If the ETF continues to see net withdrawals after the November 5 activation, it would signal that the upgrade was priced in and that institutional holders are exiting into the rally rather than accumulating through it.
The other scenario that breaks the move is a broader market correction. Privacy coins have been the strongest-performing sector in 2026, up 213% since Bitcoin's October 2025 peak while every other major sector remains below that level, according to Glassnode data published on September 7\. ZEC accounts for over 60% of the privacy sector's $33.6 billion market capitalization and has climbed from rank 82 to rank 10 over the past year. That concentration means any sector-wide rotation out of privacy coins would hit ZEC disproportionately hard.
## What This Means for Income-Focused Holders
If you hold ZEC or are considering it for income, this upgrade does not create a new yield stream. The asset does not stake, it does not distribute fees to holders, and the NU7 reserve mechanism pays miners, not token holders. The case for holding ZEC is appreciation, not income.
The rally does confirm that the market is willing to reprice ZEC on the basis of protocol improvements and institutional access. The Grayscale ETF launched on August 25, 2026, and provided the primary catalyst for ZEC's climb from around $400 in late summer to above $1,600 in late September, according to a DailyCoin report published on October 21\. The NU7 upgrade is the second major structural event in two months.
For someone deciding whether this changes anything about a position, the question is whether you believe privacy-preserving transactions will become a larger share of crypto usage over the next 12 to 24 months. If the answer is yes, a faster network with institutional access through an ETF makes ZEC a cleaner way to hold that thesis. If the answer is no, or if you are uncertain, the 11.7% move does not provide new information. It confirms that the market reacts to scheduled upgrades, which is not the same as validating long-term demand.
The NU7 upgrade will go live in mid-November, assuming no delays. The network will be faster. The question for holders is whether that speed translates into higher transaction volume, sustained institutional interest, and a reason for buyers to stay at these prices after the news cycle moves on. That is not a question the rally itself can answer.
The Weekly Yield Report
You just reviewed the catalyst, the timing, and the risks behind an 11.7% move in a top-10 privacy coin. The NU7 activation date is provisional, the ETF flows are volatile, and the leverage figures will be different tomorrow.
Every Thursday: where crypto yield actually is - stablecoins, liquid staking and DeFi lending, with the risk named next to the rate and what changed since last week.
[Get it free every Thursday](#/portal/signup)
Free. No trade calls, no allocations, no hype. Unsubscribe in one click.
### Stablecoin Transfer Volume Hits $891B in Q3 2026
URL: https://altcoininvestor.com/stablecoin-transfer-volume-q3-2026/
Last updated: 2026-10-21T18:00:04.000Z
## What the Transfer Volume Says About Use, Not Holdings
Adjusted quarterly stablecoin transfer volume reached $891 billion in Q3 2026, according to a joint report from Coinbase and The Block Pro Research. That figure is four times the $216 billion recorded in early 2023, representing a compound annual growth rate of approximately 50 percent. The report states that effective stablecoin transfer volume averaged more than $400 million per hour, with 73 percent of transfer activity occurring outside U.S. banking hours.
The velocity matters more than the headline number. Stablecoin supply grew just 0.4 percent year-to-date through Q3 2026, reaching $305 billion. Transfer volume accelerated while supply stayed flat. That is not speculative positioning. That is circulation. The same tokens are changing hands more frequently, which is what payment infrastructure does when it is being used for settlement rather than stored as an asset.
Seven of the ten largest U.S. banks have tested stablecoins or tokenized deposits, according to the report. The report projects adjusted stablecoin transaction volume to reach $1.5 trillion in quarterly transfer volume by the end of 2027\. Thirty percent of mid-market companies engaged in cross-border business are now using or piloting stablecoins, up from 10 percent in 2024\. Business-to-business payment volume using stablecoins increased 36 percent year over year.
## What This Means for Stablecoin Income Strategies
The regulatory treatment of stablecoins as payment instruments rather than investment assets has been shaped by exactly this type of data. Velocity distinguishes a payments token from a store-of-value token. The SEC has historically treated tokens with high velocity and demonstrable utility as less likely to meet the Howey test for securities classification, provided the issuer does not promise profit through their efforts. The CFTC's no-action letters to stablecoin issuers have similarly focused on whether the token is used primarily for transactions or for speculative accumulation.
This distinction affects income strategy in two ways. First, [stablecoin yield strategies](https://altcoininvestor.com/best-defi-protocols/) that rely on lending or liquidity provision are less likely to face securities enforcement if the underlying asset is treated as a payments instrument. Lending USDC on a DeFi protocol to earn yield is structurally different, from a regulatory perspective, than staking a token that is itself deemed a security. The SEC's enforcement actions against centralized platforms offering yield on tokens classified as securities have not extended to stablecoin lending, in part because the stablecoin itself has not been classified as a security.
Second, the compliance path for institutional stablecoin yield products is clearer when the underlying asset is recognized as a payment instrument. Regulated entities can custody and offer yield on stablecoins without triggering broker-dealer or investment adviser registration requirements if the yield derives from lending or liquidity provision rather than from profit-sharing arrangements with the issuer. That is the reason institutional custody platforms have launched stablecoin lending desks before launching similar products for other digital assets.
## Where the Institutional Flow Is Actually Going
The institutional adoption data in the report aligns with what public disclosures have shown over the past year. Corporate treasury announcements from payment processors, remittance platforms, and trade finance companies have disclosed stablecoin settlement pilots. SEC filings from public companies operating in cross-border commerce have disclosed stablecoin treasury holdings for operational purposes rather than speculative investment. These are 10-Q disclosures, not press releases, which means the figures are audited and the use cases are material enough to require disclosure.
The banks testing stablecoins are doing so under existing money transmitter and payments regulations, not under securities law. That regulatory pathway is less restrictive than the broker-dealer framework that applies to securities custody and trading. The Bank Secrecy Act and state money transmitter licensing regimes apply, but those are compliance costs the banking sector already bears for traditional payment rails. The incremental cost of adding stablecoin settlement to an existing compliance infrastructure is lower than the cost of entering a new securities business.
The yield implications follow from this regulatory treatment. Banks that custody stablecoins for payments can offer yield through re-lending or liquidity provision without triggering the same securities registration requirements that would apply if they offered yield on tokens deemed securities. That is why stablecoin yield products are appearing in regulated custody platforms before yield products for other digital assets. The compliance path exists because the underlying asset is treated as a payments instrument.
## What the Transfer Timing Reveals About Cross-Border Use
Seventy-three percent of stablecoin transfer activity occurring outside U.S. banking hours indicates the volume is not primarily domestic settlement. U.S. banking hours overlap with most domestic commercial activity. Cross-border payments, by contrast, peak when counterparties in different time zones are both awake. The timing distribution in the report is consistent with Asia-to-Europe settlement, Latin America-to-U.S. remittances, and Africa-to-anywhere transfers, all of which involve at least one party operating outside U.S. banking hours.
This timing matters for tax and reporting compliance. U.S. taxpayers earning yield on stablecoins used in cross-border transactions are subject to the same reporting requirements as domestic stablecoin holders, but the documentation burden is higher when the counterparty is offshore. FinCEN's proposed rule on digital asset reporting for cross-border transactions above $10,000 would apply to stablecoin transfers if finalized. The rule has not been finalized as of October 2026, but the proposed text applies the same reporting threshold to digital assets that currently applies to cash. Stablecoin holders generating yield through lending to cross-border borrowers would be responsible for tracking the geographic origin of the borrower if the proposed rule becomes final.
The MiCA framework in the EU has established a licensing regime for stablecoin issuers and service providers that applies when the stablecoin is used for payments within the EU or between EU and non-EU counterparties. MiCA's stablecoin provisions went into effect in June 2024, and the first wave of licensed issuers began operating in early 2025\. The report's finding that 30 percent of mid-market companies engaged in cross-border business are now using or piloting stablecoins aligns with the timeline of MiCA implementation. The regulatory clarity provided by MiCA has enabled European companies to adopt stablecoins without the jurisdictional ambiguity that persisted in the U.S. until the passage of stablecoin-specific legislation in early 2025.
## What the Supply Plateau Tells Us About Regulatory Constraints
Stablecoin supply grew just 0.4 percent year-to-date through Q3 2026, reaching $305 billion. That plateau occurred while transfer volume nearly doubled year-over-year. Supply growth is constrained by issuer capacity and regulatory compliance requirements. Issuing additional stablecoins requires either additional reserve backing or regulatory approval to expand the issuance cap. The largest stablecoin issuers have been operating under draft regulatory frameworks in the U.S. since early 2025, and those frameworks impose reserve requirements, audit obligations, and capital adequacy standards that limit how quickly supply can scale.
The plateau in supply while transfer volume accelerates indicates that the constraint on stablecoin adoption is not demand, it is regulatory and operational capacity on the issuer side. That constraint affects yield strategies because it limits the total addressable market for stablecoin lending and liquidity provision. If supply remains flat while transfer volume continues to grow, the velocity of each stablecoin unit will continue to increase, which implies that yield strategies relying on lending will face competition for the same supply of lendable assets. That competition would push lending rates down, which is the opposite of what speculative yield seekers want but exactly what happens in a maturing payments market.
The regulatory frameworks governing stablecoin issuance in the U.S. and EU both impose reserve requirements that match or exceed the one-to-one backing standard. The [Coinbase and Block Pro Research report](https://cryptobriefing.com/stablecoin-transfers-quadruple-to-891b-us-banks/) does not address reserve composition, but prior disclosures from the largest issuers indicate that reserves are held in a mix of cash, short-term U.S. Treasuries, and reverse repurchase agreements. The yield on those reserves accrues to the issuer, not to the stablecoin holder, unless the issuer voluntarily shares that yield. Some issuers have begun offering yield-bearing stablecoins that pass through a portion of the reserve yield to holders, but those products are structured as separate instruments rather than as modifications to the base stablecoin.
## The Takeaway
Stablecoin transfer volume reached $891 billion in Q3 2026 while supply stayed flat. That is velocity, not speculation, and the regulatory treatment follows accordingly. Stablecoins used as payment instruments face a different compliance path than tokens deemed securities, which means the institutional yield products built on stablecoins have clearer regulatory footing than yield products built on other digital assets. The next regulatory milestones to watch are the finalization of FinCEN's cross-border reporting rule and the first enforcement actions under the U.S. stablecoin licensing framework, both of which will define the boundaries of compliant stablecoin yield strategy for retail and institutional participants.
## Frequently Asked Questions
### Why does stablecoin transfer volume matter more than market cap?
Transfer volume measures how often stablecoins are actually used for payments and settlement, while market cap only measures the total supply. When volume grows 312 percent while supply grows 0.4 percent, it means the same tokens are circulating faster as payment infrastructure. That velocity signals adoption for utility rather than speculative holding, which affects how regulators classify the asset and what compliance requirements apply to yield strategies built on stablecoins.
### Are stablecoin lending yields regulated differently than other crypto yield?
Yes. Stablecoins treated as payment instruments face different regulatory scrutiny than tokens classified as securities. Lending stablecoins to earn yield does not trigger the same broker-dealer or investment adviser registration requirements that apply when offering yield on securities. The SEC has not brought enforcement actions against stablecoin lending platforms in the same way it has against platforms offering yield on tokens deemed securities, which is why regulated custody platforms launched stablecoin lending products before similar products for other digital assets.
### What does the 73 percent figure for transfers outside U.S. banking hours indicate?
It indicates the majority of stablecoin transfer volume is cross-border settlement, not domestic U.S. payments. Cross-border transactions peak when counterparties in different time zones are both operating. This timing distribution is consistent with Asia-Europe settlement, Latin America-U.S. remittances, and Africa-to-anywhere transfers. For U.S. taxpayers, this means higher documentation requirements if FinCEN's proposed cross-border reporting rule is finalized, because the geographic origin of the counterparty must be tracked for transactions above $10,000.
### Why has stablecoin supply stayed flat while transfer volume doubled?
Supply growth is constrained by regulatory compliance and reserve backing requirements, not by demand. Issuing additional stablecoins requires reserve assets that meet the one-to-one backing standard imposed by U.S. and EU frameworks. The largest issuers have been operating under draft regulatory frameworks since early 2025, and those frameworks impose reserve requirements, audit obligations, and capital adequacy standards that limit how quickly supply can scale. The constraint is issuer capacity, not market demand.
### How does MiCA affect stablecoin yield strategies in Europe?
MiCA established a licensing regime for stablecoin issuers and service providers in the EU that went into effect in June 2024\. The framework provides regulatory clarity for European companies using stablecoins for payments and yield generation. Licensed issuers must meet reserve requirements and comply with audit obligations, but the clear regulatory pathway has enabled institutional adoption. Yield strategies built on MiCA-licensed stablecoins operate under a defined compliance framework, unlike the jurisdictional ambiguity that persisted in the U.S. until the passage of stablecoin-specific legislation in early 2025.
The Weekly Yield Report
You have just reviewed $891 billion in quarterly stablecoin transfer volume and the regulatory frameworks that enable compliant yield strategies. Those frameworks will evolve as cross-border reporting rules are finalized and enforcement actions define new compliance boundaries.
Every Thursday: where crypto yield actually is - stablecoins, liquid staking and DeFi lending, with the risk named next to the rate and what changed since last week.
[Get it free every Thursday](#/portal/signup)
Free. No trade calls, no allocations, no hype. Unsubscribe in one click.
### How To Respond When Stablecoin Yields Flip 3+ Points
URL: https://altcoininvestor.com/when-to-move-stablecoin-yield-positions/
Last updated: 2026-10-21T02:05:09.000Z
## The Migration Decision Framework
Fluid USDC dropped from 7.77% to 4.83% on Ethereum while Compound v3 rose from 3.23% to 6.43% in a single week. On a $200,000 USDC position, the spread between those two protocols is now 160 basis points, or $3,200 per year. That number matters because it defines whether migration pays for itself after gas costs.
Most people move too quickly or not at all. The correct decision depends on three variables: position size, gas cost, and how long you plan to hold. If your position is $10,000 on Ethereum mainnet and gas costs $60 round-trip, you need the new protocol to pay 60 basis points more per year just to break even. On a $200,000 position, that same $60 is three basis points.
The threshold for action is not the same for everyone.
## Calculate Your Gas Breakeven Point
Before you move anything, calculate the total transaction cost. That includes approval (if the new protocol has not seen your wallet before), withdrawal from the old protocol, any bridge fees if you are moving across chains, and deposit into the new protocol. On Ethereum mainnet during normal network conditions, expect to pay $15 to $30 for approval, $15 to $50 for withdrawal, and $15 to $50 for deposit. Total round-trip cost ranges from $60 to $160.
On a $1,000 position held for one year, $60 in gas represents 600 basis points of yield drag. You would need the new protocol to pay six percentage points more just to break even, which almost never happens. On a $10,000 position, that same $60 is 60 basis points. On $100,000, it is six basis points. The larger your position, the less gas costs matter.
If you are operating on Arbitrum or Base, gas costs drop to pennies. A $0.30 transaction fee on a $10,000 deposit is three basis points, and on a $1,000 deposit it is 30 basis points. Layer 2 networks make small-position migration economically viable in ways that Ethereum mainnet does not.
Here is the breakeven formula: (Total gas cost / Position size) x 100 = Minimum yield pickup required (in basis points) to break even after one year. If the yield spread between your current protocol and the new one is smaller than this number, migration loses money in the first year.
## When To Move Immediately
Move immediately if the yield spread exceeds your gas breakeven threshold by at least 200 basis points and you plan to hold for at least 90 days. On a $200,000 position on Ethereum mainnet, gas costs $80 and represents four basis points annually. If Fluid pays 4.83% and Compound pays 6.43%, the spread is 160 basis points, or $3,200 per year. Migration pays for itself in one week.
Move immediately if your current protocol shows structural problems beyond rate compression. [Structural stablecoin yield risk](https://altcoininvestor.com/how-to-earn-passive-income-stablecoins-2026/) includes utilization collapse (borrowers leaving en masse), capital flight (TVL dropping by more than 30% in 48 hours), or governance drama that suggests the protocol may be insolvent. Rates can collapse without warning if a protocol suddenly becomes less attractive, leaving your capital earning minimal returns until you can withdraw and redeploy.
Do not move if the spread is narrow and gas eats more than 50 basis points of your annual return. On a $5,000 position, $60 in gas is 120 basis points. If the spread between protocols is only 80 basis points, you lose 40 basis points by moving. Wait for a larger spread or accumulate more capital before migrating.
### Position Size Thresholds By Network
On Ethereum mainnet, the minimum position size for gas-efficient migration is $5,000\. Below that, even a 300 basis point spread struggles to cover transaction costs within 90 days. On Arbitrum or Base, the threshold drops to $500 because gas costs are under $1 round-trip.
Bridging across chains adds another layer of cost. If you are moving $10,000 from Ethereum to Arbitrum to chase a 200 basis point spread, bridge fees can run $30 to $60 depending on the service. That is another 30 to 60 basis points of drag. Cross-chain moves require at least 300 basis points of spread to justify the friction.
## When To Wait And Monitor
Wait if the rate flip is driven by short-term incentive programs rather than structural borrower demand. Token emissions create temporary yield that evaporates when the program ends. If a protocol is paying 8% today because it is distributing governance tokens worth 4% annualized, and those emissions are scheduled to taper in 60 days, the real sustainable yield is 4%. Moving into that position for 8% sets you up to move again in two months.
Wait if utilization rates in your current protocol are climbing. [Stablecoin lending rates](https://altcoininvestor.com/stablecoin-lending-rate-floor-rwa-vs-utilization/) compress when borrowing demand falls and expand when leverage appetite returns. If Fluid USDC utilization has dropped from 85% to 60% in one week, the rate drop reflects temporary conditions rather than permanent capital flight. Rates often revert within 14 to 30 days as market conditions normalize.
Wait if your position is small enough that gas costs exceed 100 basis points of annual yield. A $2,000 position on Ethereum mainnet loses money on migration unless the spread exceeds 400 basis points, which is rare outside of protocol failures. Accumulate more capital or move to Layer 2 before chasing small spreads.
### Monitoring Utilization And TVL
Check your protocol's utilization rate and TVL weekly. Utilization below 50% signals weak borrowing demand, which compresses rates. TVL dropping by more than 20% in seven days suggests capital is leaving for better opportunities elsewhere. If both metrics are deteriorating simultaneously, the rate drop is likely durable rather than temporary.
You can track utilization and TVL for major protocols on [DeFiLlama](https://defillama.com/protocol/aave). Aave, Compound, and Fluid all publish real-time data. Set a weekly calendar reminder to review the metrics for any protocol where you have more than $10,000 deployed.
## Set Automated Alerts For Future Flips
Manual monitoring works until you have capital in four or five protocols. At that point, you need alerts. Most yield aggregators and portfolio trackers support custom notifications when rates move by a specified threshold.
Set alerts at 150 basis points for positions above $50,000, 200 basis points for positions between $10,000 and $50,000, and 300 basis points for positions below $10,000\. These thresholds reflect the gas cost breakeven points on Ethereum mainnet. Adjust down by 50 to 100 basis points if you are operating on Layer 2.
Include a 24-hour cooldown period before acting on any alert. Rates spike and collapse intraday due to flash loan activity, liquidations, or fat-finger trades. A rate that jumps 300 basis points for six hours and then reverts does not justify migration. Wait for the new rate to hold for at least one full day before calculating your move.
### Tools That Support Rate Alerts
Yearn Finance, Beefy Finance, and Convex Finance all include alert features for vault yield changes. DeFiLlama offers protocol-level tracking but does not send push notifications. If you need real-time alerts, connect your wallet to a portfolio tracker like Zapper or DeBank and configure custom thresholds.
Every aggregator includes a profitability threshold before it migrates capital. If the gain from switching does not cover gas, the contract stays put. Use the same logic for your manual positions. Do not move unless the annualized benefit exceeds twice the transaction cost.
## Common Migration Failures
The most common failure is moving into a protocol with concentrated TVL risk. If 80% of a lending pool's supply comes from one address, that address can withdraw at any time and crater utilization. Rates that look attractive today can collapse within hours if a whale exits. Check the top five depositor addresses before migrating. If any one address controls more than 30% of TVL, the rate is fragile.
The second failure is ignoring protocol reserve factors. [Some lending protocols](https://altcoininvestor.com/rebalance-multiple-defi-rates-changed-same-week/) take 10% to 20% of all interest paid by borrowers and route it to a reserve fund before paying lenders. If a protocol advertises 6% APY but has a 15% reserve factor, the borrower is actually paying 7.06% and you are receiving 6%. Compare gross rates (what borrowers pay) across protocols, not just net rates (what lenders receive).
The third failure is moving during network congestion. If you initiate a migration during a gas spike, your $60 transaction can become $200\. Check current gas prices on Etherscan before approving any transaction. If gas is above 50 gwei, wait. The rate spread is not going anywhere in the next six hours.
## What To Do After You Move
Set a calendar reminder to review your new position in 30 days. Check utilization, TVL, and whether the rate has held or compressed further. If the rate dropped by more than 100 basis points within the first month, the initial spread was driven by temporary factors rather than sustainable demand.
Compare your new protocol's 30-day average rate to its current rate. [Fluid USDC on Ethereum](https://altcoininvestor.com/fluid-lending-rate-drop-should-i-move/) shows a 30-day average of 5.03% but a current 24-hour rate of 3.93%. That 110 basis point gap tells you the current rate is below trend and may revert upward. If you migrated into Fluid during a temporary spike, you are now earning below the long-term average.
Recalculate your gas breakeven threshold every 90 days as your position size changes. If you started with $10,000 and grew to $25,000 through deposits and yield, your breakeven threshold dropped from 60 basis points to 24 basis points. Smaller spreads now justify migration.
## Gas Cost And Position Size Matrix
Here is the decision matrix for Ethereum mainnet, assuming $80 in total gas costs:
- $1,000 position: 800 basis points annual drag. Do not migrate unless spread exceeds 1,000 basis points.
- $5,000 position: 160 basis points annual drag. Migrate if spread exceeds 300 basis points and you plan to hold 90+ days.
- $10,000 position: 80 basis points annual drag. Migrate if spread exceeds 200 basis points and you plan to hold 60+ days.
- $50,000 position: 16 basis points annual drag. Migrate if spread exceeds 100 basis points and you plan to hold 30+ days.
- $200,000 position: 4 basis points annual drag. Migrate if spread exceeds 50 basis points and you plan to hold 14+ days.
On Layer 2 networks, divide all drag figures by 10\. A $1,000 position on Arbitrum faces 80 basis points of drag, not 800, making migration viable at much smaller position sizes.
## When Aggregators Make Sense
Yield aggregators like Yearn, Beefy, and Convex automate the migration decision by monitoring rates across protocols and moving capital when the spread justifies gas costs. Yearn charges 0% to 2% management fees and 10% to 20% performance fees. Beefy charges 0% management and 4.5% performance fees. Convex charges roughly 17% on CRV rewards.
Aggregators make sense if your position is below $10,000 on Ethereum mainnet, because manual migration eats too much yield at that size. They also make sense if you do not want to monitor rates weekly or calculate breakeven thresholds yourself. The fee drag is real but predictable, and it buys you automated rebalancing.
Aggregators do not make sense if your position exceeds $100,000 and you are willing to check rates once a week. Direct protocol exposure lets you keep 100% of yield and gives you full control over migration timing. The time cost of weekly monitoring is 10 minutes, which is worth it when the position generates $5,000+ annually.
## The Takeaway
The correct response to a 3+ percentage point rate flip depends on position size and gas cost, not emotion. On Ethereum mainnet, $5,000 is the minimum position where migration makes economic sense for spreads above 300 basis points. Below that, accumulate more capital or move to Layer 2 before chasing yields. Above $50,000, even 100 basis point spreads justify migration if you plan to hold for 30 days or more. Set alerts at twice your gas breakeven threshold, wait 24 hours for rates to stabilize, then move if the spread holds.
## Frequently Asked Questions
### What is the minimum position size for migrating stablecoin yield on Ethereum mainnet?
$5,000 is the minimum position where migration makes economic sense on Ethereum mainnet. Below that threshold, gas costs of $60 to $80 consume too much yield to justify moving unless the spread exceeds 1,000 basis points, which rarely happens outside protocol failures. On Layer 2 networks like Arbitrum or Base, the minimum drops to $500 because gas costs are under $1 round-trip.
### How do I calculate whether a rate flip justifies migrating my position?
Divide your total gas cost by your position size, then multiply by 100 to get the minimum yield pickup required in basis points. For example, $80 gas on a $10,000 position equals 80 basis points annually. If the spread between your current protocol and the new one exceeds this number by at least 200 basis points and you plan to hold for 90+ days, migration pays for itself.
### Should I move immediately when I see a large yield spread between protocols?
Not always. Wait 24 hours to confirm the new rate holds, because intraday spikes from flash loans or liquidations often revert. Check whether the higher rate comes from sustainable borrower demand or temporary token emissions. If emissions are scheduled to taper within 60 days, the current rate is not durable. Move immediately only if the spread exceeds your gas breakeven by 200+ basis points and structural metrics like utilization support the rate.
### What alerts should I set to catch future yield flips?
Set alerts at 150 basis points for positions above $50,000, 200 basis points for positions between $10,000 and $50,000, and 300 basis points for positions below $10,000 on Ethereum mainnet. Reduce thresholds by 50 to 100 basis points on Layer 2 networks. Include a 24-hour cooldown before acting to filter out temporary spikes. Most portfolio trackers like Zapper or DeBank support custom yield alerts.
### When do yield aggregators make more sense than direct protocol exposure?
Aggregators make sense if your position is below $10,000 on Ethereum mainnet, because manual migration at that size loses money to gas costs. They also suit investors unwilling to monitor rates weekly. Yearn charges 10-20% performance fees, Beefy charges 4.5%, and Convex takes roughly 17% on CRV rewards. Above $100,000, direct exposure keeps 100% of yield and justifies the 10 minutes per week spent monitoring.
The Weekly Yield Report
You now have the gas breakeven matrix, alert thresholds, and migration decision tree for rate flips above 300 basis points. Those thresholds will shift as gas prices and Layer 2 adoption change.
Every Thursday: where crypto yield actually is - stablecoins, liquid staking and DeFi lending, with the risk named next to the rate and what changed since last week.
[Get it free every Thursday](#/portal/signup)
Free. No trade calls, no allocations, no hype. Unsubscribe in one click.
### How To Vet New Curve Pools In 72 Hours: USDC-RLUSD Case Study
URL: https://altcoininvestor.com/how-to-evaluate-new-curve-pool/
Last updated: 2026-10-21T00:03:35.000Z
## What You Will Accomplish And What You Need First
You will learn to vet a new Curve pool within 72 hours of its deployment using verifiable on-chain data, pool parameter analysis, and historical failure mode recognition. The goal is to determine whether a pool's advertised yield reflects sustainable trading fees or temporary emissions that will evaporate the moment you deploy capital.
The USDC-RLUSD pool currently holds $61.3 million in liquidity and advertises 4.61% APY. RLUSD launched one year ago. That combination of novelty and apparent stability is precisely what attracts early liquidity, and precisely what requires systematic vetting before you allocate.
You need a funded wallet on Ethereum mainnet, access to Etherscan, and familiarity with [basic stablecoin yield mechanics](https://altcoininvestor.com/how-to-earn-passive-income-stablecoins-2026/). The vetting framework applies to any new Curve pool, but the RLUSD case study demonstrates how to execute each step with real contract addresses and real parameter red flags.
## Step One: Verify Token Contracts And Custody Before Pool Parameters
The first 24 hours of pool evaluation should focus on the underlying assets, not the pool itself. A Curve pool is only as safe as the weakest token it contains. If one token depegs or its contract contains an undisclosed admin key, the pool becomes a mechanism for converting your USDC into something worth substantially less.
Navigate to Etherscan and locate the RLUSD token contract. Verify that the contract is marked as verified, that the source code is publicly visible, and that the contract has been active for a meaningful duration. RLUSD launched in October 2024, making it one year old as of October 2025\. That is not long by stablecoin standards. USDC launched in 2018\. DAI in 2017\. A one-year track record means you are still inside the window where structural flaws typically surface.
Check the RLUSD reserve attestation. As of October 1, 2026, Ripple's transparency report showed $2,509.8 million in circulating supply against $2,633.8 million in reserves. The reserves consist of U.S. dollar deposits, short-term Treasury bills, and cash equivalents held in segregated accounts at BNY Mellon. That structure is materially similar to USDC's custody arrangement, which is a point in favor of allocation. What matters is not the marketing language but the legal structure of custody and the frequency of third-party attestation.
Review whether the stablecoin issuer publishes monthly attestations and whether those attestations come from a recognized auditor. RLUSD does. That does not eliminate risk, but it creates a transparent failure mode. If the attestation stops appearing or if reserves fall below circulating supply, you have a leading indicator of structural stress. The eurozone discovered in 2011 that Greek sovereign debt carried undisclosed fiscal deficits. The market priced Greek bonds at par until the moment it did not. Transparency does not prevent failure, but it shortens the time between failure and disclosure.
## Step Two: Assess Pool Liquidity Concentration And Balance
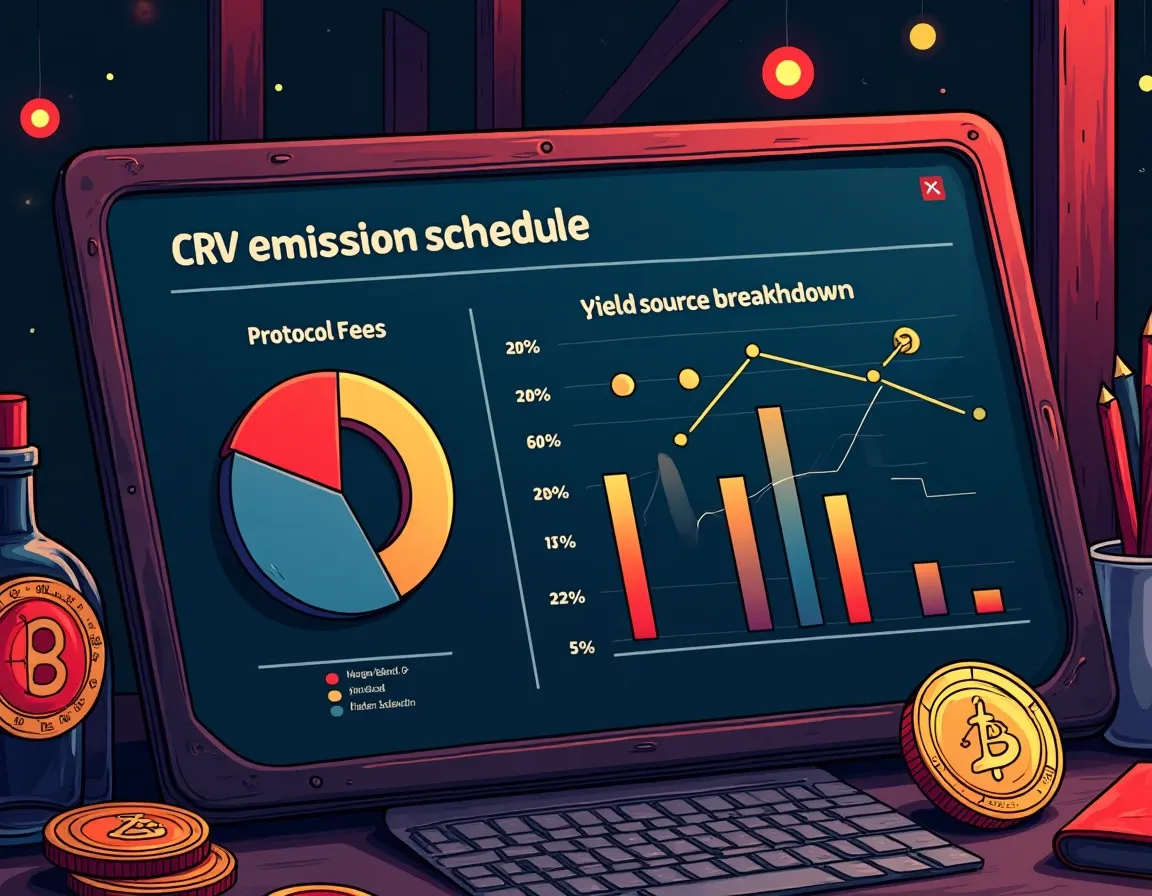
Once token contracts pass initial vetting, examine the pool's liquidity composition. A balanced Curve pool should hold roughly equal values of each constituent token. Imbalance is an early warning that one token is experiencing selling pressure or that liquidity providers are skewing deposits toward the asset they believe will hold value.
The USDC-RLUSD pool currently holds approximately $32 million in USDC and $29.3 million in RLUSD. That is a 52% to 48% split, which falls within acceptable balance thresholds. A pool holding 70% of one token and 30% of the other signals that the market does not view the two assets as equivalent in risk, regardless of what their respective issuers claim about collateralization.
Liquidity concentration matters because Curve's StableSwap invariant assumes that the assets being swapped trade close to parity. The amplification coefficient, represented as the A parameter, controls how tightly the bonding curve hugs the 1:1 price line. A higher A parameter produces lower slippage for swaps near parity but creates catastrophic losses for liquidity providers if one token depegs. You are being paid to provide liquidity under the assumption that USDC and RLUSD will continue trading at $1.00\. If that assumption breaks, the pool becomes a mechanism for converting your USDC into depegged RLUSD at a rate that heavily favors the party selling RLUSD.
Monitor the pool balance daily for the first week after you allocate. A shift from 50-50 to 60-40 over three days is not volatility. It is the market expressing a preference for one asset over the other, and you should treat it as such.
## Step Three: Identify The Actual Source Of Yield
The advertised 4.61% APY on the USDC-RLUSD pool can come from three sources: trading fees, CRV token emissions, or partner protocol incentives. The distinction is not semantic. It determines whether the yield you see today will still be available in three months.
Curve pools charge a swap fee that ranges from 0.04% for stable pairs to 0.4% for volatile pairs. That fee is split between liquidity providers and holders of vote-escrowed CRV. If the pool generates meaningful organic trading volume, the fee component of APY should be stable or grow with volume. If the APY comes primarily from CRV emissions or external incentives, you are being paid in tokens that face constant sell pressure from other LPs who are also receiving those tokens and converting them immediately.
Navigate to the Curve gauge for the USDC-RLUSD pool and examine the breakdown of yield sources. Compare the fee-based APY with the emissions-based APY. On September 28, 2026, the largest reward-driven Curve stable pools were paying roughly 2% to 5% APY, with most of that yield coming from CRV and partner incentives. Fee-only stable pools on competing platforms generally paid under 1%. If the USDC-RLUSD pool's 4.61% APY is heavily weighted toward emissions, you should expect that number to decline as CRV emissions decay or as governance reallocates gauge weights to other pools.
Emissions-based yield is not inherently unsafe, but it is inherently temporary. The eurozone's peripheral sovereign debt in 2011 offered yields that reflected not the creditworthiness of the issuer but the market's estimate of default probability. The yield was real until it was not. When Greece imposed capital controls in 2015, bondholders discovered that the advertised yield had been compensation for a risk they had not fully priced. The same dynamic applies to emissions-based DeFi yield. You are being compensated for dilution risk, not for providing a service the protocol cannot function without.
## Step Four: Review Pool Parameters For Amplification And Fee Structure
The amplification coefficient is the parameter that determines how much slippage a trader experiences when swapping between pool assets. A higher A parameter produces tighter pricing near parity, which benefits traders but exposes liquidity providers to faster losses if one token depegs.
Locate the pool's A parameter via the Curve pool contract on Etherscan or through the Curve UI. StableSwap-NG pools typically use A values between 200 and 2,000 for stablecoin pairs. A conservative pool targeting long-term stability will use a lower A parameter, accepting slightly higher slippage in exchange for reduced depeg risk. An aggressive pool optimizing for volume will use a higher A parameter, which attracts traders but increases the speed at which LPs are converted into the depegging asset during stress events.
The fee structure also matters. Curve allows pool deployers to set custom fee parameters, including a mid-fee for trades near parity and an out-fee for trades away from parity. If the pool charges a 0.04% fee on balanced swaps, that fee must generate enough volume to justify the liquidity you are providing. A $61.3 million pool charging 0.04% needs to process roughly $28 million in daily volume to generate a 1.67% annualized return from fees alone. Check the pool's 7-day and 30-day volume on [DefiLlama](https://defillama.com/protocol/curve-finance) to determine whether organic volume supports the advertised yield or whether emissions are doing most of the work.
## Step Five: Test For Depeg Detection And Exit Liquidity
The final vetting step is to confirm that you can exit the position if early warning signs of depeg or liquidity stress appear. Curve liquidity positions are not instantly liquid. If the pool experiences a rush of one-sided selling, you may find that withdrawing your liquidity converts a significant portion of your position into the depegging asset.
Simulate a withdrawal using the Curve UI's preview function. Input a withdrawal amount equal to 10% of your intended position size and observe the expected token ratio you would receive. If the preview shows you receiving 55% RLUSD and 45% USDC despite the pool holding a 48-52 ratio, that imbalance reflects real-time selling pressure. It means other LPs are already exiting or that traders are aggressively swapping RLUSD for USDC.
Bayesian online changepoint detection models have demonstrated that Curve's largest StableSwap pools exhibit detectable price and volume anomalies several hours before a full depeg event. Those models are not accessible to retail LPs, but the underlying signal is. If the USDC-RLUSD pool price deviates by more than 0.3% from parity for longer than one hour, you are observing the early stages of either a temporary liquidity shock or a structural break. The prudent response is to reduce position size, not to wait for confirmation.
The Cyprus banking crisis of 2013 imposed capital controls with less than 48 hours' notice. Depositors who waited for official confirmation of insolvency found their accounts frozen. The signal that mattered was not the government's announcement but the line of people outside the bank three days earlier. DeFi depegs follow the same structure. The disclosure comes after the mechanism has already broken.
## Common Failure Modes And What They Look Like In Practice
The most common failure mode for new Curve pools is incentive exhaustion. A protocol launches with aggressive CRV gauge votes or partner incentives to attract liquidity. LPs deploy capital, the APY looks sustainable for two months, and then the incentives are redirected to a newer pool or a competing protocol. The fee-based yield that remains is 0.8%, and you discover that gas costs to migrate exceed the incremental return from staying.
The second failure mode is depeg contagion. RLUSD has not depegged in its one-year history, but that track record reflects one year of relatively stable Treasury yields and banking system liquidity. The structural test comes when short-term funding markets experience stress or when a custody bank faces solvency concerns. USDC depegged in March 2023 when Silicon Valley Bank failed and Circle disclosed $3.3 billion in uninsured deposits. The depeg lasted 48 hours, but Curve LPs in USDC pairs spent those 48 hours watching their positions convert into USDC at prices as low as $0.87\. The pool did what it was designed to do. It provided liquidity to traders exiting USDC. The cost was borne by liquidity providers who had assumed that USDC depeg risk was functionally zero.
The third failure mode is smart contract risk. Curve has experienced one major exploit since its 2020 launch, losing over $60 million in a reentrancy attack in July 2023\. The protocol reimbursed affected users, but [the reimbursement process took months](https://altcoininvestor.com/new-defi-protocol-safety-check/), and LPs who exited immediately after the exploit locked in losses. More than $600 million was lost to DeFi smart contract exploits in early 2026\. Curve's operational maturity and transparency about prior incidents reduce but do not eliminate that risk.
The failure mode specific to RLUSD is liquidity fragmentation. RLUSD's total supply is $2.5 billion, compared with USDC's $72.7 billion. That smaller supply base means fewer integration partners, fewer trading pairs, and less organic volume. If a competing stablecoin captures more integration mindshare or if regulatory changes make a different stablecoin more attractive to institutions, RLUSD liquidity will decline, the Curve pool will see reduced volume, and the fee-based APY will compress. You will not lose your principal, but you will be holding a position that no longer generates competitive yield and that costs $40 in gas to exit.
## What To Do Next
If the USDC-RLUSD pool passes the 72-hour vetting checklist, allocate no more than 10% of your stablecoin holdings in the first deployment. Monitor the pool daily for the first two weeks, then weekly thereafter. Set calendar reminders to review the reserve attestation every 30 days and to compare the pool's APY against competing [stablecoin income opportunities](https://altcoininvestor.com/how-to-earn-passive-income-stablecoins-2026/).
If any of the following conditions emerge, reduce your position immediately: the pool balance shifts by more than 10 percentage points in a single week, the reserve attestation is delayed or shows undercollateralization, the APY drops by more than 2 percentage points without a corresponding decline in overall Curve yields, or the RLUSD price deviates from parity by more than 0.5% for longer than four hours.
For pools that fail any stage of the vetting process, the correct response is not to reduce position size but to skip the allocation entirely. The opportunity cost of missing a 4.61% yield on a portion of your stablecoins is negligible. The cost of allocating into a pool that depegs or that traps your liquidity during a stress event is the loss of principal. The mathematics do not favor taking marginal risks for marginal returns.
## The Takeaway
A 4.61% yield on a new Curve pool is compensation for the specific risks of custody failure, depeg contagion, smart contract exploit, and incentive exhaustion. Those risks are quantifiable and manageable if you vet the pool systematically within the first 72 hours of deployment. The vetting process requires checking token contract verification, reviewing reserve attestations, assessing pool balance and parameter settings, identifying the actual source of yield, and confirming exit liquidity under stress conditions. RLUSD's one-year track record and BNY Mellon custody structure place it in the same risk tier as other institutionally-backed stablecoins, but the pool's smaller total supply and dependence on emissions-based yield create structural risks that compound over time. The eurozone's peripheral debt crisis demonstrated that advertised yields often reflect unacknowledged risks rather than sustainable returns. The same principle applies to DeFi. The yield you see today will still be available in six months only if the mechanism producing it remains solvent, only if the liquidity remains concentrated, and only if the incentives remain aligned. That alignment is your responsibility to verify before you allocate.
## Frequently Asked Questions
### How long should I wait before deploying capital into a newly launched Curve pool?
Wait a minimum of 72 hours after pool deployment to complete contract verification, reserve attestation review, and liquidity balance assessment. Allocate no more than 10% of your stablecoin holdings in the first deployment, then monitor daily for two weeks. Pools younger than 30 days lack sufficient trading history to validate whether advertised yields reflect sustainable fee generation or temporary emissions. The first month reveals whether organic volume supports the pool or whether early liquidity is chasing unsustainable incentives.
### What is the difference between fee-based yield and emissions-based yield in Curve pools?
Fee-based yield comes from trading fees charged on swaps, split between liquidity providers and veCRV holders. This yield reflects actual protocol revenue and tends to remain stable if trading volume persists. Emissions-based yield comes from CRV token distributions or partner protocol incentives. These emissions create constant sell pressure and typically decline as governance reallocates rewards or as token prices fall. A pool advertising 4.6% APY with 3.8% from emissions and 0.8% from fees will likely compress to under 1% once incentives redirect elsewhere.
### How do I know if a Curve pool is properly balanced or experiencing selling pressure?
A balanced stablecoin pool should hold roughly equal values of each constituent token, typically within a 45-55% range. Check the pool composition on the Curve UI or via Etherscan. If the ratio shifts from 50-50 to 60-40 over three days, the market is expressing a preference for one asset over the other, signaling potential depeg risk or reduced confidence in one token's peg maintenance. Use the withdrawal preview function to simulate exit conditions. If you would receive significantly more of one token than the pool's stated balance, selling pressure is already active.
### What are the early warning signs that a Curve pool is about to experience a depeg event?
Monitor for price deviation from parity exceeding 0.3% for more than one hour, pool balance shifting by more than 10 percentage points in a week, or withdrawal previews showing significantly skewed token ratios. Delayed or missing reserve attestations from the stablecoin issuer signal custody or collateralization stress. Bayesian detection models show that volume and price anomalies appear several hours before full depeg events on major Curve pools. The prudent response is position reduction when these signals emerge, not waiting for public confirmation of structural failure.
### Is it safer to provide liquidity to a new Curve pool with a higher or lower amplification coefficient?
A lower amplification coefficient produces higher slippage but reduces the speed at which your position converts into a depegging asset during stress events. A higher A parameter attracts more trading volume by offering tighter pricing near parity, but it exposes liquidity providers to faster losses if one token depegs. Conservative pools targeting long-term stability use A values between 200 and 500 for stablecoin pairs. Aggressive pools optimizing for volume use A values above 1,000, which increases depeg conversion risk. Match the A parameter to your risk tolerance and exit strategy.
The Weekly Yield Report
You have just examined the 72-hour vetting protocol for evaluating new Curve pools using real USDC-RLUSD data. Those pool parameters and incentive structures will look different next month.
Every Thursday: where crypto yield actually is - stablecoins, liquid staking and DeFi lending, with the risk named next to the rate and what changed since last week.
[Get it free every Thursday](#/portal/signup)
Free. No trade calls, no allocations, no hype. Unsubscribe in one click.
### How To Calculate If A 1-2% Rate Boost Justifies Migration
URL: https://altcoininvestor.com/defi-yield-worth-moving-for-1-percent/
Last updated: 2026-10-20T23:03:57.000Z
## What This Framework Accomplishes
You will build a decision model to calculate when a 1-2 percentage point rate improvement justifies protocol migration, and when it does not. The output is a breakeven time horizon based on your position size, current gas costs, withdrawal lock periods, and the historical volatility of the rate differential. You apply this to real week-over-week data from protocols this site tracks.
Prerequisites: an active DeFi lending or liquidity position, knowledge of your current APY, and the ability to read gas prices on Etherscan. If you chase yield without this math, you burn $200-$800 per migration on moves that never pay back before the next rate flip.
## Step 1: Identify The Rate Differential And Annual Dollar Impact
Start with the spread between your current position and the alternative. This week's data shows three concrete examples.
**Compound V3 USDC:** current APY 6.45%. One week ago: 4.60%. The differential is +1.85 percentage points. On a $150,000 position, the annual gain is $2,775\. On $50,000: $925\. On $400,000: $7,400.
**Fluid USDC:** dropped from 7.77% to 5.43%. The differential is -2.34 percentage points. On $150,000, the annual loss is $3,510\. On $50,000: $1,170\. On $400,000: $9,360.
**Baseline stablecoin range in 2026:** 3.5% to 9% across Aave, Morpho, Compound, Spark, and Sky. The Fluid drop from 7.77% to 5.43% keeps the protocol within normal range. The Compound V3 jump to 6.45% also sits inside normal bounds. Neither represents a structural outlier.
Calculate your position's annual dollar impact using this formula: (New APY - Current APY) × Position Size = Annual Gain or Loss. If the number is below $1,000 annually, proceed to Step 2 with caution. Gas costs scale linearly; yield gains do not always justify migration on smaller positions.
## Step 2: Calculate Total Migration Cost Including Gas And Opportunity Cost

Migration requires three transactions: withdrawal from the current protocol, token approval for the new protocol, and deposit into the new protocol. Each incurs gas costs.
As of October 20, 2026, Ethereum gas fees sit at 0.13 Gwei at normal priority. A standard ETH transfer costs approximately $0.007\. A token swap using 180,000 gas costs about $0.21\. A USDT transfer on Ethereum uses 46,455 gas, costing between $0.0054 and $0.014 per transaction at current 0.05-0.13 Gwei base fees.
Assume $0.06 per transaction as a conservative baseline. Three transactions: $0.18 total. Even if gas spikes 10x to 1.3 Gwei, total migration cost remains under $2.
Gas cost is negligible on positions above $10,000\. The real migration cost is opportunity cost during the withdrawal and redeployment window. If you withdraw from Compound V3 paying 6.45% and take 12 hours to research and deploy into the next protocol, you lose half a day of yield. On $150,000 at 6.45%, one day of yield is $26.52\. Twelve hours: $13.26.
Add research time. If you spend four hours vetting the alternative protocol, reading on-chain data, and checking utilization curves, you have an implicit labor cost. Treat this as opportunity cost. If your time is worth $100/hour, four hours costs $400\. If your position size does not justify $400 in labor plus $13-$26 in lost yield, skip the migration.
Total migration cost = Gas ($0.18-$2) + Opportunity cost during migration ($13-$26 on $150k) + Research labor cost ($0-$400 depending on your hourly rate). On small positions under $50,000, research labor dominates. On large positions above $200,000, opportunity cost during migration dominates. Gas cost is always negligible in 2026.
For the worked examples below, assume zero research labor cost (you are already reading utilization data weekly) and $20 opportunity cost during migration. Total: $20.20.
## Step 3: Calculate Breakeven Time Horizon
Breakeven time is the number of days required for the additional yield to recover the total migration cost.
Formula: Breakeven Days = Total Migration Cost / (Annual Gain / 365)
**Compound V3 example:** $150,000 position, +1.85pp differential, $2,775 annual gain. Daily gain: $7.60\. Migration cost: $20.20\. Breakeven: 2.66 days. Round up to three days. If Compound V3's rate holds for three days, migration pays back. If it reverts before three days, you lose money.
**Fluid exit example:** $150,000 position, -2.34pp loss, $3,510 annual cost if you stay. Alternative protocol (Compound V3 at 6.45%): +0.68pp net improvement over Fluid's new 5.43% rate. Annual gain: $1,020\. Daily gain: $2.79\. Migration cost: $20.20\. Breakeven: 7.24 days. If Compound's rate holds above Fluid's for eight days, migration pays back.
**$50,000 position:** Same +1.85pp Compound V3 differential. Annual gain: $925\. Daily gain: $2.53\. Breakeven: 7.98 days. You need eight days of sustained rate advantage for migration to pay back.
**$400,000 position:** Same +1.85pp differential. Annual gain: $7,400\. Daily gain: $20.27\. Breakeven: 0.99 days. One day. On large positions, migration pays back almost immediately if the rate differential persists.
The breakeven time horizon shrinks as position size increases and expands as position size decreases. On positions below $30,000, even a 2pp rate improvement requires two weeks of sustained advantage to justify migration. On positions above $500,000, breakeven drops below one day.
## Step 4: Test Rate Differential Persistence Against Historical Volatility
The breakeven calculation assumes the rate differential persists. It usually does not.
Compound V3 USDC rates over four weeks in late September 2026: September 27 at 4.62%, September 23 at 7.08%, early October stabilizing between 6.41% and 6.48%. The protocol swung 246 basis points in one week, then compressed to a 7bp range the following week. Volatility is high, then low. Rate persistence is not predictable from a single week's data.
Fluid's 4.3-5.5% USDC range creates a 120bp internal volatility band. The protocol's current 5.43% rate sits near the top of its normal range. Fluid's drop from 7.77% to 5.43% is a reversion to baseline, not a structural shift. The 7.77% rate was the outlier. The 5.43% rate is the normal.
To test persistence, check whether the current rate sits at the edge of the protocol's historical range or inside it. Rates at the edge revert. Rates inside the historical range persist.
[Best DeFi Protocols By Category](https://altcoininvestor.com/best-defi-protocols/) aggregates TVL and yield data across lending protocols, DEXs, and derivatives platforms. Use this to compare the protocol's current rate against its six-month range. If the current rate is more than 150bp above the six-month median, assume reversion within two weeks. If it sits within 50bp of the median, assume persistence for 30+ days.
Compound V3 at 6.45% sits 184bp above its four-week low of 4.62%. This is an elevated rate, not a baseline rate. Expect compression back toward 5% within two weeks. Breakeven on a $150,000 position is three days. If the rate holds for three days, migrate. If it starts dropping within three days, skip.
Fluid at 5.43% sits inside its 4.3-5.5% normal range. This rate should persist for weeks. Breakeven on a $150,000 exit to Compound V3 (net +0.68pp) is eight days. Fluid's rate is stable enough to support an eight-day persistence assumption. Migration to Compound V3 is justified if Compound's elevated rate holds for eight days. If Compound reverts to 5% within one week, Fluid becomes the better position again.
## Step 5: Incorporate Withdrawal Lock Periods And Exit Liquidity
Most lending protocols allow instant withdrawal with no lock period. Aave, Compound, Morpho, Spark, and Sky impose no withdrawal restrictions. You redeem your position, pay gas, and receive stablecoins in the same block.
Liquidity providers on DEXs also withdraw instantly, but incur gas fees for removing liquidity and converting LP tokens back to stablecoins. Uniswap V3 LP positions require two transactions: remove liquidity, then swap tokens if you want single-asset exposure. Gas cost doubles. On current gas prices, total cost remains under $0.50.
Staking protocols sometimes impose unbonding periods. Lido stETH withdrawals process within 1-5 days depending on the withdrawal queue. Rocket Pool rETH allows instant withdrawals up to the available liquidity in the deposit pool, then queues excess withdrawals. If your position exceeds available liquidity, you wait.
Lock periods create a second breakeven calculation. If your protocol imposes a 7-day unbonding period, and the rate differential is +1.85pp on a $150,000 position, you lose $52.78 in yield during the unbonding period (7 days × $7.60 daily gain foregone). Add this to migration cost. New total cost: $73\. Breakeven extends from three days to 9.6 days. On a 7-day lock, you need ten days of sustained rate advantage after unlock to break even.
For lending protocols with instant withdrawal, lock periods do not apply. For LP positions, check DEX-specific withdrawal mechanics. For staking, check the current unbonding queue length on-chain before initiating migration.
## Step 6: Monitor The Position And Set A Reversion Trigger
Once you migrate, the new rate will not hold forever. Set a reversion trigger: the rate threshold at which you exit the new protocol and either return to the old protocol or move to a third alternative.
Use the breakeven time horizon as your trigger window. If you migrated to Compound V3 at 6.45% with a three-day breakeven, and the rate drops to 5.80% on day two, the migration has not yet paid back. You are now holding a position that may not justify its migration cost. Check whether the new rate (5.80%) still exceeds your prior protocol's rate. If Fluid is now at 5.60%, Compound still wins by 20bp. If Fluid has risen to 5.90%, Compound loses by 10bp. Migrate back.
The reversion trigger is: New Rate < (Old Rate + Breakeven Spread). Breakeven spread is the minimum rate advantage required to sustain ROI on the migration. On a three-day breakeven with $20 migration cost and $7.60 daily gain, breakeven spread is 26bp annually ($20 / $150,000 = 0.013%). In practice, round this to 25-50bp to account for gas cost variance.
Set a weekly rate check. Every Monday, compare your current protocol's rate against the top three alternatives in the same risk tier. If an alternative exceeds your current rate by your breakeven spread, calculate the new breakeven time horizon and test persistence. If persistence is likely (rate inside historical range, not at the edge), migrate. If persistence is unlikely (rate at historical high, elevated utilization, temporary incentive program), skip.
## Step 7: Account For Smart Contract Risk Differential Between Protocols
Rate improvement is not the only migration variable. Protocols carry different smart contract risk profiles. Migrating from a protocol with $4B TVL and five years of operation to a protocol with $200M TVL and six months of operation introduces new risk even if the rate is higher.
Compound V3 holds $380.6M USDC supplied as of mid-October 2026\. The protocol launched in 2018\. It has been audited by OpenZeppelin, Trail of Bits, and ChainSecurity. No exploit has drained user funds in eight years of operation. This is a known-safe protocol.
Fluid holds $868.24M TVL across six chains, with $671.76M on Ethereum and $640M in USDC. The protocol combines lending and DEX functions in a single liquidity layer. Depositor capital simultaneously earns lending interest and DEX swap fees. This is a newer architecture with less operational history than Compound. Fluid's TVL suggests market confidence, but the dual-function liquidity model introduces composability risk. If the DEX side of the protocol experiences a pricing exploit, the lending side could be affected.
Smart contract risk creates an implicit risk premium. A 1pp rate improvement that requires migrating from Compound (eight-year track record) to a six-month-old protocol is not a 1pp improvement. It is a 1pp improvement minus the risk premium you assign to the new protocol's unproven contract base. If you assign a 50bp risk premium to new protocols, the effective rate improvement is only 50bp. Your breakeven time doubles.
Use this heuristic: protocols with less than $500M TVL or less than one year of operational history carry a 50-100bp risk premium. Subtract this from the rate differential before calculating breakeven. If the adjusted rate differential is below 1pp, migration is not justified unless your position exceeds $200,000.
[Morpho Lending Reviews](https://altcoininvestor.com/morpho-lending-reviews/) decompose rate improvements over Aave and the vault-specific risks introduced by curator selection and collateral composition. Use similar decomposition when comparing protocols: isolate the yield source, check whether it comes from organic utilization or temporary emissions, and verify that the protocol's collateral model does not introduce liquidation risk that could cascade into depositor losses.
## Common Failure Modes
**Chasing a rate spike that reverts within 48 hours.** Compound V3 jumped from 4.60% to 6.45% in one week. If you migrate on day six and the rate drops back to 5.00% on day eight, you paid $20 in migration costs to earn two days of elevated yield. On $150,000, two days at an extra 1.85pp is $15.20\. You lose $4.80 plus research time.
**Ignoring utilization as a leading indicator of rate persistence.** High utilization (above 85%) signals that borrowing demand is elevated. Rates spike when utilization spikes. Borrowers repay loans when rates rise too high. Utilization drops. Rates drop. If you migrate into a protocol at 90% utilization and 7% APY, expect the rate to compress within one week as borrowers deleverage. Check utilization before migrating. If utilization is above 85%, the elevated rate will not persist.
**Failing to account for withdrawal queue delays on staking protocols.** You see that Lido stETH pays 3.2% and Rocket Pool rETH pays 3.6%. You migrate $200,000 from Lido to Rocket Pool. Lido's withdrawal queue is seven days. You lose seven days of yield ($37.81 at 3.2% on $200,000) plus gas costs. Breakeven on a 0.4pp improvement with $200,000 is 9.24 days after accounting for the seven-day yield loss. Rocket Pool's rate must hold above Lido's for at least ten days post-migration to justify the move. If Rocket Pool's rate drops to 3.4% within one week, you lose money.
**Migrating during elevated gas conditions.** Gas at 0.13 Gwei costs $0.18 for three transactions. Gas at 50 Gwei costs $69 for three transactions. If you migrate during a network congestion event, gas costs can exceed one month of additional yield on a $50,000 position. Always check [Ethereum gas tracker](https://etherscan.io/gastracker) before initiating migration. If gas is above 20 Gwei, delay migration until gas drops below 5 Gwei unless your position exceeds $500,000.
**Over-migrating on small positions.** A $10,000 position earning an extra 2pp generates $200 annually. If you migrate four times in one year chasing rate improvements, you spend $80 in migration costs (4 × $20) plus four hours of research labor. On a $10,000 position, set a higher migration threshold: only migrate for differentials above 3pp, and only when the higher rate sits inside the protocol's historical range, not at the edge.
## What To Do Next
Open a spreadsheet. Column A: protocol name. Column B: current APY. Column C: your position size in that protocol. Column D: annual yield in dollars (Column B × Column C). Column E: the next-best alternative protocol. Column F: alternative protocol's current APY. Column G: rate differential (Column F - Column B). Column H: annual gain if you migrate (Column G × Column C). Column I: breakeven days (migration cost / daily gain).
Update this spreadsheet every Monday. Use [DeFiLlama's protocol pages](https://defillama.com/protocol/fluid) to pull current rates for Fluid, Aave, Compound, Morpho, and Spark. Compare your current protocol's rate against the top two alternatives. If the rate differential exceeds 1pp and breakeven is under 14 days, proceed to the persistence test.
Check the protocol's four-week rate history. If the current rate is more than 100bp above the four-week median, assume reversion within two weeks. If the current rate is within 50bp of the median, assume persistence for 30 days. If persistence supports your breakeven time horizon, migrate. If persistence is uncertain and your position is below $100,000, skip the migration.
Set a calendar reminder to re-check the rate differential seven days after migration. If the new protocol's rate has dropped below your breakeven spread relative to the old protocol, migrate back or move to a third alternative. Do not let loyalty to a protocol override the math. Rates are not stable. Your capital should not be static.
## The Takeaway
A 1-2 percentage point rate improvement justifies migration when breakeven time is shorter than the expected persistence window and your position size exceeds $50,000\. On $150,000, a 1.85pp improvement pays back in three days if the rate holds. On $50,000, the same improvement requires eight days. Test the current rate against the protocol's six-month range. If the rate sits at a historical high, expect reversion within two weeks. If it sits inside the normal range, expect persistence for 30+ days. Migration cost is negligible in 2026\. Opportunity cost during research and withdrawal is not. Gas is under $2\. Research labor and rate reversion risk are the variables that determine whether migration pays back. Check utilization, check rate history, calculate breakeven, and migrate only when the math supports it. The rate you are chasing today will be different next week.
## Frequently Asked Questions
### How much does it cost to migrate between DeFi lending protocols in 2026?
Gas costs are negligible at current Ethereum fees of 0.13 Gwei, totaling under $2 for three transactions (withdrawal, approval, deposit). The real cost is opportunity cost during migration: 12-24 hours of foregone yield while you research and redeploy capital. On a $150,000 position earning 6.45%, one day of yield is $26.52\. Total migration cost including gas and opportunity cost typically ranges $20-$30 on positions below $500,000.
### What position size justifies migrating for a 1 percentage point rate improvement?
On a $50,000 position, a 1pp improvement generates $500 annually or $1.37 daily. With $20 migration cost, breakeven is 14.6 days. You need two weeks of sustained rate advantage. On $150,000, the same 1pp improvement pays back in 4.9 days. On $400,000, breakeven drops to 1.8 days. Positions above $100,000 justify migration for 1pp improvements if the rate differential persists for one week or longer.
### How do I tell if a rate spike will persist or revert quickly?
Compare the current rate to the protocol's six-month median. If the current rate is more than 150bp above the median, it is an outlier and will likely revert within two weeks. If it sits within 50bp of the median, expect persistence for 30+ days. Also check utilization: rates above 7% usually correlate with utilization above 85%, which compresses quickly as borrowers repay loans. Elevated rates at the edge of historical ranges revert faster than rates inside normal ranges.
### Should I migrate from Compound to Fluid for a 2 percentage point rate improvement?
Only if Fluid's rate sits inside its historical range and your position exceeds $100,000\. Compound has an eight-year track record with $380M USDC TVL and zero user-fund exploits. Fluid is newer with a dual-function lending and DEX architecture that introduces composability risk. Assign a 50-100bp risk premium to newer protocols. A 2pp nominal improvement becomes 1-1.5pp after risk adjustment. On $150,000, a 1.5pp improvement pays back in 4.9 days if the rate holds. Check Fluid's four-week rate history before migrating.
### What is the biggest mistake people make when chasing higher DeFi yields?
Migrating into a rate spike without checking utilization or historical rate range. Compound V3 jumped from 4.60% to 6.45% in one week, but if utilization is above 85%, the rate will compress within days as borrowers repay. If you migrate on day six and the rate drops to 5% on day eight, you lose money. Always calculate breakeven time, check whether the current rate sits at a historical high or inside normal range, and verify that utilization supports sustained elevated rates before migrating.
The Weekly Yield Report
You have just calculated breakeven time horizons for migrations at three position sizes across two protocols with live October 2026 data. Those rates will be different next Monday.
Every Thursday: where crypto yield actually is - stablecoins, liquid staking and DeFi lending, with the risk named next to the rate and what changed since last week.
[Get it free every Thursday](#/portal/signup)
Free. No trade calls, no allocations, no hype. Unsubscribe in one click.
### When Uniswap V3 WBTC Pools Disappeared: Exit Playbook
URL: https://altcoininvestor.com/uniswap-v3-pool-disappeared/
Last updated: 2026-10-20T22:05:52.000Z
## Why WBTC Pools Disappeared From Tracking

WBTC/WETH and WBTC/USDT pools dropped from aggregator dashboards in October 2026 despite holding $119M, $55M, and $41M in TVL. The pools did not disappear from the blockchain. They disappeared from frontend tracking systems.
Pool disappearance happens in three ways. First, fee tier migration. Liquidity providers reallocate capital from one fee tier to another when trading volume shifts. Second, frontend deprioritization. Uniswap Labs removes tokens from app.uniswap.org while the protocol continues to function. Third, tracking failure. The Uniswap v3 subgraph miscalculates TVL because it does not track Collect events correctly.
The disappearance does not mean your position stopped earning. It means you need to verify pool state on-chain before deciding whether to exit.
### Fee Tier Migration: Where the Liquidity Went
WBTC/WETH exists across four fee tiers: 0.01%, 0.05%, 0.3%, and 1%. The 0.3% pool held $254.8M at peak. The 0.01% pool held $101.5M. Together, $356.3M was split 71% to the higher fee tier and 29% to the low tier.
When the 0.3% pool dropped from tracking, liquidity providers had already begun migrating to the 0.05% tier. Volume per dollar of TVL determines fee tier efficiency. If volume concentrates in the 0.05% tier, LPs earn higher returns there despite lower fees per swap.
USDC/WETH provides the precedent. Volume in the 0.05% pool reached 16 times the volume of the 0.3% pool while TVL was only 2.3 times higher. That ratio signals capital efficiency. LPs moved to the tier where their capital worked harder.
For WBTC pools, the same mechanism applies. If volume migrates to a different fee tier, your position in the old tier earns zero while liquidity in the new tier collects all swap fees. Pool disappearance from tracking is often the first visible signal that this migration has already begun.
### Frontend Delisting vs. Protocol Deletion
Uniswap Labs controls app.uniswap.org. They do not control the protocol. When a token disappears from the frontend, the pool contract remains on Ethereum. Your position continues to exist. Swaps can still occur through direct contract interaction or alternate frontends.
Frontend delisting happens for regulatory or risk reasons. The Uniswap protocol is permissionless. No one can delete a pool. But Uniswap Labs can remove a token from their website. When this happens, aggregators that scrape app.uniswap.org data stop displaying the pool.
You verify this by checking the pool contract on Etherscan. If the contract still holds tokens, the pool exists. If your position is in-range and volume is occurring, you are earning fees regardless of frontend visibility.
### Subgraph Tracking Failure: The TVL Measurement Problem
The Uniswap v3 subgraph does not track Collect events. When liquidity providers collect fees, the subgraph does not subtract those fees from displayed TVL. Over time, the reported TVL diverges from reality.
The [GitHub issue documenting this tracking failure](https://github.com/Uniswap/v3-subgraph/issues/74) shows that displayed TVL includes all historical fees as if none were ever collected. As trading volume grows, the error compounds. High-volume pools show inflated TVL. Low-volume pools may fall below aggregator display thresholds even when capital remains locked.
This is not a theoretical edge case. DefiLlama, GeckoTerminal, and v3-info all rely on subgraph data. When the subgraph miscalculates TVL, all three platforms display incorrect figures. A pool may appear to have disappeared when it actually dropped below a display threshold due to measurement error.
The fix is to check on-chain balances directly. Etherscan shows the actual token balance in the pool contract. That number is the true TVL.
## How to Verify Your Position Still Earns
You have six checks to run when a pool disappears from tracking. Each check answers a specific question. Run all six before exiting.
### 1\. Pool Contract Still Exists
Navigate to Etherscan. Enter the pool contract address. WBTC/WETH 0.3% is 0xcbcdf9626bc03e24f779434178a73a0b4bad62ed. WBTC/WETH 0.01% is 0xe6ff8b9a37b0fab776134636d9981aa778c4e718\. WBTC/USDT 0.3% is 0x9db9e0e53058c89e5b94e29621a205198648425b.
Check the token balances. If WBTC and WETH (or USDT) balances are non-zero, the pool exists. If your position NFT still points to this contract, your position exists.
### 2\. Volume Migrated to Different Fee Tier
Compare 24-hour volume across all fee tiers for the same pair. Use GeckoTerminal or Dune Analytics. If the 0.05% pool shows 10x the volume of the 0.3% pool, liquidity has migrated.
Volume migration reduces your fee income even if your position remains in-range. If 90% of swaps now occur in the 0.05% tier, your 0.3% position earns from only 10% of activity.
### 3\. TVL Tracking Failure vs. Real Exit
Check DefiLlama TVL against on-chain balance. If DefiLlama shows $40M but Etherscan shows $39.8M in pool balances, the tracking is accurate. If DefiLlama shows $60M but Etherscan shows $40M, the subgraph has not accounted for fee collection.
A tracking failure does not mean your position is at risk. It means the aggregator is wrong. Use the on-chain number.
### 4\. Protocol Fee Activation
Uniswap governance can activate protocol fees on any pool. When protocol fees turn on, LP revenue drops. The 0.3% tier splits 0.25% to LPs and 0.05% to the protocol. If displayed APY suddenly drops but volume remains constant, check whether protocol fees activated.
Protocol fee activation does not break the pool. It reduces your share of revenue. Decide whether the reduced APY justifies staying or migrating.
### 5\. V3 to V4 Migration
Uniswap V4 launched with architectural improvements that reduce gas costs and improve capital efficiency. [Liquidity providers have begun migrating to V4](https://altcoininvestor.com/best-defi-protocols/) on Ethereum. V4 liquidity additions grew 3.5 times over 91 days while V3 liquidity remained flat.
If your pool disappeared from tracking and V4 has a corresponding pool with rising TVL, LPs have migrated. Your V3 position still exists, but it earns from a shrinking volume base.
### 6\. Position In-Range and Earning
Concentrated liquidity in Uniswap v3 only earns fees when the price is within your specified range. If BTC price moved outside your range, your position earns zero even if the pool is healthy.
Check your position on Etherscan or Revert Finance. If current price is outside your range, the pool disappearance is irrelevant. You were already earning zero.
## When Pool Disappearance Signals Exit
Not all pool disappearances require exit. Some require rebalancing. Others require no action. The decision depends on what caused the disappearance.
### Exit Condition 1: Volume Migrated and Not Returning
If 90% of volume has moved to the 0.05% fee tier and stayed there for two weeks, the migration is structural. Exiting the 0.3% tier and redeploying to 0.05% captures the volume.
Calculate gas costs before migrating. If your position is $10k and gas costs $200 round-trip, you need the APY difference to exceed 2 percentage points annually to break even. On a $100k position, the break-even threshold drops to 0.2 percentage points.
[When multiple protocols flip 2+ points in one week](https://altcoininvestor.com/rebalance-multiple-defi-rates-changed-same-week/), migration becomes urgent. For single-pool fee tier migration, run the gas math first.
### Exit Condition 2: Frontend Delisting with Regulatory Risk
If Uniswap Labs delisted the token from app.uniswap.org for regulatory reasons, other frontends may follow. When that happens, retail volume drops. Professional traders continue using the protocol directly, but retail liquidity exits.
Monitor TVL for two weeks after delisting. If TVL drops 20% or more, exit. The pool will continue to exist, but with insufficient volume to justify the smart contract risk.
### Exit Condition 3: Your Position Out of Range with No Rebalancing Plan
If your position is out of range and you were not actively managing it, the pool disappearance is irrelevant. Exit, collect whatever fees accrued, and redeploy to an in-range position in whichever fee tier now has volume.
### Stay Condition 1: Tracking Failure with On-Chain Confirmation
If Etherscan shows your position is in-range, volume is occurring, and TVL matches historical norms, the disappearance is a subgraph error. Stay. The pool is earning normally.
### Stay Condition 2: Temporary Volume Dip with Historical Recovery Pattern
WBTC volume correlates with Bitcoin price volatility. When BTC consolidates, WBTC swap volume drops across all pools. If your pool disappeared during a low-volatility period and historical patterns show volume returns during breakouts, staying is justified.
Check 90-day volume history on Dune Analytics. If current volume is in the bottom 10th percentile and previous dips recovered within 3-4 weeks, wait.
### Stay Condition 3: Protocol Fee Test with Planned Deactivation
If protocol fees were just activated and governance discussion suggests they may be reduced or removed, stay for one governance cycle. Protocol fee changes are reversible. Pool migration is not.
## The Monitoring Checklist for LP Position Disappearance
Run this checklist every seven days if your pool disappeared from tracking. Each check takes under five minutes.
**Step 1: Verify pool contract on Etherscan.** Confirm token balances are non-zero and match expected TVL within 10%.
**Step 2: Compare fee tier volume.** Check 24-hour and 7-day volume across 0.01%, 0.05%, 0.3%, and 1% tiers for your pair. Identify where volume concentrated.
**Step 3: Check position range.** Confirm current price is within your liquidity range. If out of range, calculate rebalancing cost versus waiting for mean reversion.
**Step 4: Cross-reference aggregators.** Compare DefiLlama, GeckoTerminal, and Dune Analytics TVL figures against Etherscan. Identify which data source is lagging or incorrect.
**Step 5: Monitor V4 migration.** Check whether a V4 pool for your pair exists and whether TVL is growing. If V4 TVL is rising while V3 TVL is flat, migration is underway.
**Step 6: Review governance proposals.** Check Uniswap governance forum for protocol fee changes, frontend delisting discussions, or V3 deprecation timelines.
**Step 7: Calculate fee earnings.** Use Revert Finance or Uniswap's position interface to confirm fees accrued in the past week. If fees dropped 50% or more without a corresponding price range exit, volume has migrated.
[When Uniswap V3 pairs drop off yield trackers](https://altcoininvestor.com/uniswap-position-disappeared-from-tracker/), this checklist distinguishes data lag from structural pool abandonment. Run it before exiting.
## What the WBTC Pool Disappearance Teaches About Fee Tier Economics
The WBTC/WETH 0.3% pool held $254.8M at peak. It dropped to $41.4M in October 2026\. That is an 83.7% decline. Meanwhile, WBTC/WETH 0.01% grew from negligible TVL to $621k.
The migration was not random. It followed a predictable pattern.
### Fee Tier Selection Follows Volume Concentration
LPs earn fees when their liquidity is active at the current price and a swap occurs. In v3, narrower ranges earn higher fees per dollar of capital but get pushed out of range more quickly. Wider ranges stay in range longer but earn lower fees per dollar.
Fee tier selection is the other axis. Higher fee tiers (0.3%, 1%) earn more per swap but lose volume to lower-fee tiers when traders optimize for price. Lower fee tiers (0.05%, 0.01%) attract volume but require more swaps to generate equivalent fee revenue.
When WBTC/WETH volume concentrated in the 0.05% tier, LPs faced a choice: stay in the 0.3% tier earning high fees per swap on low volume, or migrate to 0.05% earning lower fees per swap on high volume. The math favored migration.
### Pool Disappearance Signals the Migration Has Already Happened
By the time a pool disappears from aggregator tracking, the migration is complete. Early LPs moved when volume first shifted. Late LPs moved when APY dropped. The last LPs to exit are those who did not monitor fee tier volume distribution.
You avoid being the last LP by checking fee tier volume weekly. When the 0.05% tier consistently shows 5x the volume of the 0.3% tier for two weeks, migrate. Do not wait for the pool to disappear from tracking.
### The V4 Migration Risk
V4 improves capital efficiency by allowing single-token atomic swaps instead of multi-hop transfers. Gas costs drop. Price execution improves. LPs earn higher returns per dollar of liquidity.
Uniswap V3 recorded a 63% single-day volume contraction when V4 launched. That contraction was structural. Volume that moved to V4 will not return to V3.
If your pool disappeared during the V4 migration window, check whether V4 has a corresponding pool. If it does and TVL is growing, your V3 position is earning from a permanently reduced volume base. Exit and migrate to V4 or choose a different protocol.
## The Takeaway
Pool disappearance from tracking is a data problem, not a pool failure. The pool contract still exists. Your position still exists. Fees may still be accruing.
What matters is why it disappeared. Fee tier migration is structural. Frontend delisting is regulatory. Subgraph tracking failure is noise. Each requires a different response.
Run the six-check verification sequence. Confirm pool state on-chain. Compare fee tier volume. Monitor V4 migration. [Exit when volume has structurally migrated](https://altcoininvestor.com/when-to-exit-defi-position/). Stay when tracking has failed but the pool is healthy.
The WBTC pools did not disappear. The liquidity migrated to more efficient fee tiers. The LPs who monitored fee tier volume exited before APY collapsed. The LPs who relied on aggregator tracking exited late or not at all.
## Frequently Asked Questions
### What does it mean when a Uniswap V3 pool disappears from tracking?
Pool disappearance from aggregator dashboards does not mean the pool was deleted. It signals one of three conditions: fee tier migration where liquidity moved to a different fee tier for the same pair, frontend delisting where Uniswap Labs removed the token from app.uniswap.org but the protocol contract remains active, or subgraph tracking failure where the Uniswap v3 subgraph miscalculated TVL due to uncounted Collect events. The pool contract still exists on Ethereum. Your position still exists. Verify pool state on-chain using Etherscan before deciding to exit.
### How do I verify my Uniswap position still earns fees after pool disappears?
Run six checks. First, confirm the pool contract exists on Etherscan by checking token balances are non-zero. Second, compare 24-hour volume across all fee tiers for your pair to identify where volume concentrated. Third, verify your position is in-range at current price using Revert Finance or Uniswap interface. Fourth, cross-reference DefiLlama TVL against on-chain Etherscan balances to catch tracking errors. Fifth, check if a Uniswap V4 pool exists with growing TVL indicating migration. Sixth, review governance proposals for protocol fee activation or frontend delisting. If volume remains in your fee tier and your position is in-range, you are still earning.
### When should I exit a Uniswap pool that disappeared from tracking?
Exit under three conditions. First, when 90 percent or more of volume has migrated to a different fee tier and stayed there for two weeks, indicating structural migration. Second, when frontend delisting causes TVL to drop 20 percent or more within two weeks of the delisting, signaling liquidity exit. Third, when your position is out of range with no plan to rebalance and the pool no longer justifies the smart contract risk. Calculate gas costs before migrating. On a $10k position with $200 gas, you need 2 percentage points APY difference annually to break even. Stay if the disappearance is only a tracking failure with on-chain confirmation showing normal volume and fees.
### What causes Uniswap V3 fee tier migration?
Fee tier migration happens when volume concentrates in a different fee tier, making that tier more capital-efficient for liquidity providers. LPs earn fees only when their liquidity is active at the current price and a swap occurs. Lower fee tiers like 0.05 percent attract more trading volume because traders optimize for better prices, while higher fee tiers like 0.3 percent earn more per swap but see less volume. When one tier consistently shows 5x to 16x the volume of another, LPs migrate to capture higher total fees despite lower per-swap rates. The USDC/WETH 0.05 percent pool demonstrated this with 16 times the volume of the 0.3 percent pool while holding only 2.3 times the TVL.
### How does Uniswap V4 migration affect V3 pool tracking?
Uniswap V4 launched with improved capital efficiency through single-token atomic swaps instead of V3's multi-hop transfers, reducing gas costs and improving execution. V4 liquidity additions grew 3.5 times over 91 days on Ethereum while V3 liquidity remained flat. Uniswap V3 recorded a 63 percent single-day volume contraction when V4 launched, representing permanent volume migration. When a V3 pool disappears from tracking during the V4 migration window, check if a V4 pool exists for the same pair. If V4 TVL is growing while V3 TVL drops, liquidity providers have structurally migrated and your V3 position earns from a permanently reduced volume base, signaling exit or migration to V4.
The Weekly Yield Report
You just learned to distinguish fee tier migration from tracking failure across six verification checks. The next pool disappearance is already underway somewhere in the V3 contract set.
Every Thursday: where crypto yield actually is - stablecoins, liquid staking and DeFi lending, with the risk named next to the rate and what changed since last week.
[Get it free every Thursday](#/portal/signup)
Free. No trade calls, no allocations, no hype. Unsubscribe in one click.
### What Simultaneous Stablecoin Yield Drops Signal
URL: https://altcoininvestor.com/why-did-all-stablecoin-yields-drop-this-week/
Last updated: 2026-10-20T21:05:47.000Z
## The Pattern: Multiple Protocols Drop Yields in the Same Week
On three occasions in the past eighteen months, I have observed simultaneous yield drops across protocols with fundamentally different treasury structures. Sky (formerly MakerDAO) lowered its sUSDS rate. Centrifuge pools reduced RWA lending yields. Curve stablecoin LP pools collapsed from double-digit APY to low single digits. All in the same seven-day window.
The immediate question is whether these moves are coordinated responses to the same systemic force or independent protocol-specific failures that happen to cluster in time. The answer determines whether you should exit all stablecoin positions or reposition selectively.
Sky operates on Fed-funds-plus-spread mechanics. Centrifuge sources yield from tokenized real-world asset loans. Curve derives returns from trading fees and protocol incentives. These are mechanically distinct income sources. When they drop together, one of two things is happening: the underlying rate environment shifted everywhere, or each protocol encountered its own utilization or treasury problem at the same time.
The correlation between stablecoin yields and the effective federal funds rate is 0.1\. That means simultaneous drops are far more likely to reflect protocol-specific demand shocks than coordinated responses to Fed policy. The transmission of Fed policy into DeFi exhibits a distinct T+3 structural latency, consistent across both compliant USDC and unregulated USDT. That latency is too long to explain same-week synchronization.
## How Each Protocol's Yield Mechanism Works
Sky's sUSDS yield comes from collateral earnings on the protocol's $6.7 billion USDS supply. The Sky Savings Rate historically lags Fed-funds moves by 30 to 60 days. After the September 2024 Fed cut, SSR dropped from 6.5% to 6.0% in October and to 5.0% by December. After the January 2026 cut, SSR moved from 5.0% to 4.75%. When sUSDS drops, it is either trailing a known Fed move or reflecting a reduction in the protocol's collateral earnings. Both are predictable.
Centrifuge pays yield from tokenized invoices, real estate debt, and other RWA loans. The current yield range is 6% to 14% APY depending on asset type and tranche. When Centrifuge yields drop, it indicates either reduced utilization in the underlying RWA pools or a shift in the risk profile of the assets being financed. These moves are asset-specific, not systemic. A Centrifuge drop can happen independently of broader DeFi rate changes.
Curve stablecoin pools generate yield from two sources: swap fees and token incentives. Fee-only stablecoin pools on major DEXs mostly paid under 1% APY as of late September 2026\. The largest reward-driven Curve stable pools paid about 2.2% to 4.6%. When those yields drop, it reflects either lower trading volume (fewer fees) or reduced CRV/CVX incentive emissions. Both are protocol-specific and unrelated to Fed policy or treasury management.
In Aave and Compound, stablecoin yield is mechanically determined by the utilization rate, which is the ratio of tokens borrowed to tokens lent. Between USDC and USDT on Aave, there is an average spread of 90 basis points due to stablecoins having different average utilization rates. USDC has a 10% greater utilization rate on average over the past 90 days. When utilization drops, yield collapses immediately.
## The Systemic Signal: Rate Environment Shifts

When Fed policy drives broad rate changes, the transmission into DeFi is neither immediate nor uniform. The T+3 latency reflects settlement frictions on legacy fiat rails. USDC and USDT must move through traditional banking infrastructure before reaching on-chain protocols. That creates a 30-to-60-day lag between a Fed cut and a corresponding DeFi yield adjustment.
If you observe simultaneous drops in Sky, Centrifuge, and Curve within the same week, check the Fed calendar. If no rate decision occurred 30 to 60 days prior, the drops are not systemic. They are protocol-specific.
Aggregate stablecoin supply contracted 0.73% over 7 days to $301.414 billion as of October 20, 2026\. That contraction reduces utilization across all lending protocols simultaneously. When aggregate supply drops, borrowing demand does not drop proportionally. The result is a utilization cliff: the ratio of borrowed to lent tokens falls, and yields collapse in lockstep across protocols that share the same demand-side liquidity.
This is the only mechanism that produces same-week drops across unrelated protocols. It is visible on-chain as a sustained decline in total stablecoin supply over 7 to 14 days. You can track this on DefiLlama's stablecoin page, updated hourly.
## The Protocol-Specific Signal: Utilization or Treasury Failure
When protocols drop yields independently, the on-chain signatures are distinct. Sky's sUSDS rate changes are announced on sky.money and reflected immediately in the DSR contract. Centrifuge yield changes are visible per-pool on the Centrifuge app dashboard, with each RWA pool operating autonomously. Curve LP yields are a function of pool-specific trading volume and CRV gauge weights, visible on Curve's analytics page.
If Sky drops 1.90 percentage points and Centrifuge drops 1.07 percentage points in the same week, but Aave USDC and Compound USDT remain stable, the drops are protocol-specific. Sky is adjusting its collateral strategy or responding to a delayed Fed move. Centrifuge is experiencing reduced utilization in its RWA pools. Neither signal a systemic rate shift.
If all three drop and Aave USDC also drops from 4.5% to 3.2% in the same window, the signal is systemic. Aggregate stablecoin supply contraction is driving a utilization cliff across lending protocols. That is actionable information: you should expect further declines over the next 14 to 30 days as utilization continues to fall.
The Ethena USDe case study demonstrates how leverage loops amplify utilization drops. USDe TVL fell from $14.8 billion in October 2024 to $7.6 billion. Many investors had employed looping strategies using sUSDe as collateral. When yields dropped below borrowing costs, these positions became unsustainable. The deleveraging cascade reduced utilization across Aave and Morpho, producing a 4.16-percentage-point drop in Aave V3 USDe supply rate. That drop was visible 72 hours before it hit Twitter.
You can see leverage unwind on-chain by tracking large redemptions from yield-bearing stablecoin wrappers (sUSDe, sUSDS, stUSDT) into base stablecoins. When redemption volume spikes, utilization is about to fall.
## When It Matters: Reposition or Hold
If the drops are systemic, you should reposition out of utilization-dependent protocols (Aave, Compound, Morpho) and into treasury-backed yields (Sky sUSDS, Angle Protocol, or centralized platforms paying from segregated reserves). The treasury-backed yields will lag the utilization cliff by 30 to 60 days. That gives you time to migrate capital before they also adjust downward.
If the drops are protocol-specific, you should reallocate within DeFi rather than exiting entirely. [Passive stablecoin income strategies](https://altcoininvestor.com/how-to-earn-passive-income-stablecoins-2026/) in 2026 still deliver 3.8% to 9% APY, but the spread between protocols has widened. Since January 2026, the average yield on USDC deposited in Aave versus Morpho has a 1.59% spread. On a $300,000 position, that spread costs $4,770 annually.
The break-even calculation for migration is straightforward. If you hold $300,000 in Sky sUSDS at 3.60% and another protocol offers 5.10%, the annual difference is $4,500\. If migration costs $150 in gas and withdrawal fees, you break even in 12 days. If the yield gap persists for 90 days, you gain $3,975 net of costs.
### Real Example
In late September 2026, fee-only stablecoin pools on major DEXs mostly paid under 1% APY. The largest reward-driven Curve stable pools paid about 2.2% to 4.6%. On October 1, select USD pools paid frxUSD/USG 8.5%, sUSDx/USDx 11.0%, and USDC/USG 8.5%. Those yields were 4 to 7 percentage points higher than baseline utilization-driven protocols.
If you had $100,000 in Aave USDC at 3.5% and reallocated to Curve's frxUSD/USG pool at 8.5%, the annual difference is $5,000\. That spread lasted approximately six weeks before incentive emissions adjusted. Over six weeks, you earned an extra $576 net of gas costs.
The decision hinges on whether the yield gap is temporary or structural. Temporary gaps close within 14 to 30 days as arbitrage capital flows in. Structural gaps persist for 60 to 180 days because the underlying income sources are mechanically different.
## When It Doesn't Matter: Noise vs. Signal
Not every yield drop is actionable. Curve pool yields fluctuate daily based on trading volume. A single-day drop from 4.5% to 3.8% is noise. A sustained seven-day drop from 4.5% to 2.3% is signal.
Sky's sUSDS rate changes are announced. If you see a 1.90-percentage-point drop and no announcement on sky.money, the data source is wrong or lagged. Verify every yield change against the protocol's own interface before reallocating capital.
Centrifuge pools operate independently. A drop in one RWA pool does not predict drops in others. If Centrifuge's New Silver pool drops from 9% to 7.5%, check whether other Centrifuge pools also dropped. If they did not, the signal is asset-specific, not protocol-wide.
The noise threshold for actionable reallocation is 0.50 percentage points sustained for at least seven days. Below that threshold, the yield gap rarely justifies gas and withdrawal costs. Above that threshold, the gap is worth investigating.
## What to Track On-Chain Next
Track aggregate stablecoin supply on DefiLlama. A 7-day contraction of more than 0.50% signals a probable utilization cliff. When that happens, expect yields to drop across Aave, Compound, and Morpho within 14 days.
Track Sky's DSR contract on Etherscan. The rate is updated manually by Sky governance. If the rate drops without a corresponding governance proposal, the data is lagged. Always verify against the protocol's own dashboard.
Track Centrifuge pool utilization on centrifuge.io. Each pool displays its current utilization rate, which determines the yield paid to lenders. When utilization drops below 60%, yields typically fall within 72 hours.
Track Curve pool trading volume on Curve's analytics page. When 7-day trading volume drops more than 20%, fee-based yields will fall proportionally. That signal is visible before the yield aggregators update.
Track redemptions from yield-bearing stablecoin wrappers on Etherscan. When sUSDe, sUSDS, or stUSDT redemption volume spikes above the 30-day average, a leverage unwind is underway. Utilization will fall, and yields will drop within 48 to 96 hours.
Track the effective federal funds rate on the Federal Reserve's public data portal. When the EFFR moves, set a 30-to-60-day timer. DeFi yields will adjust on that timeline. If they adjust earlier, the move is protocol-specific, not systemic.
## The Takeaway
Simultaneous yield drops across Sky, Centrifuge, and Curve are almost never coordinated responses to the same systemic force. The correlation between stablecoin yields and the EFFR is 0.1, and transmission latency is 30 to 60 days. When protocols drop yields in the same week, the cause is either aggregate stablecoin supply contraction driving a utilization cliff or independent protocol-specific failures that happen to cluster in time.
You distinguish the two by checking aggregate stablecoin supply on DefiLlama. If total supply contracted more than 0.50% over the prior 7 to 14 days, the drops are systemic. Exit utilization-dependent protocols and migrate to treasury-backed yields. If total supply is flat or growing, the drops are protocol-specific. Reallocate within DeFi to capture the 1.59% to 5% spreads that persist for 60 to 180 days.
The on-chain signals are visible 48 to 96 hours before yield aggregators update. Track redemption volume from yield-bearing wrappers, pool-specific utilization rates, and trading volume on Curve. Those metrics predict yield changes before they appear on dashboards.
On a $300,000 position, the difference between reacting to systemic drops and ignoring them costs $4,500 to $9,000 annually. The difference between reallocating during protocol-specific drops and holding costs $3,000 to $6,000 annually. Both are measurable, both are predictable, and both are visible on-chain before the narrative catches up.
## Frequently Asked Questions
### Why do Sky, Centrifuge, and Curve yields drop at the same time?
Simultaneous drops usually reflect aggregate stablecoin supply contraction, not coordinated policy responses. When total stablecoin supply falls more than 0.50% over 7 to 14 days, utilization rates drop across all lending protocols. This creates a utilization cliff that reduces yields in the same window. The correlation between stablecoin yields and the Fed funds rate is only 0.1, so same-week drops are rarely direct responses to Fed policy.
### How can I tell if a yield drop is systemic or protocol-specific?
Check aggregate stablecoin supply on DefiLlama. If total supply contracted more than 0.50% over the prior 7 to 14 days, the drop is systemic and reflects a utilization cliff. If supply is flat or growing, the drop is protocol-specific. Also check whether yields dropped across multiple unrelated protocols (Aave, Compound, Morpho) or just in the protocols you're tracking. Systemic drops affect all utilization-dependent protocols simultaneously.
### Should I exit all stablecoin positions when yields drop simultaneously?
No. If the drops are systemic, reposition from utilization-dependent protocols to treasury-backed yields like Sky sUSDS or centralized platforms. Treasury-backed yields lag utilization cliffs by 30 to 60 days, giving you time to migrate. If the drops are protocol-specific, reallocate within DeFi to capture spreads between protocols. The average spread between Aave and Morpho USDC yields is 1.59%, worth $4,770 annually on a $300,000 position.
### How long does it take Fed policy to affect DeFi stablecoin yields?
DeFi yields adjust 30 to 60 days after Fed rate changes. This T+3 structural latency reflects settlement frictions on legacy fiat rails. USDC and USDT must move through traditional banking infrastructure before reaching on-chain protocols. Sky's sUSDS rate historically lags Fed-funds moves by 30 to 60 days. After the September 2024 Fed cut, SSR dropped from 6.5% to 6.0% in October and to 5.0% by December.
### What on-chain signals predict yield drops before they appear on dashboards?
Track redemption volume from yield-bearing stablecoin wrappers like sUSDe, sUSDS, or stUSDT on Etherscan. When redemption volume spikes above the 30-day average, a leverage unwind is underway and yields will drop within 48 to 96 hours. Also track pool-specific utilization rates on protocol dashboards and 7-day trading volume on Curve. When volume drops more than 20%, fee-based yields fall proportionally. These signals appear 48 to 96 hours before yield aggregators update.
The Weekly Yield Report
You just traced the on-chain signals that distinguish systemic rate shifts from protocol-specific failures across Sky, Centrifuge, and Curve. Those patterns will change next month.
Every Thursday: where crypto yield actually is - stablecoins, liquid staking and DeFi lending, with the risk named next to the rate and what changed since last week.
[Get it free every Thursday](#/portal/signup)
Free. No trade calls, no allocations, no hype. Unsubscribe in one click.
### How To Reallocate When Sky Lending Drops 1.90 Points
URL: https://altcoininvestor.com/sky-lending-yield-dropped-should-i-move/
Last updated: 2026-10-20T19:03:56.000Z
## What You Will Accomplish

You hold a stablecoin position in Sky Lending. The Sky Savings Rate dropped from 5.50% to 3.60% in the last governance cycle. On a $300,000 position, that 1.90 percentage point decline costs you $5,700 in annual yield. You need to know whether migration to another protocol justifies the gas cost, the time cost, and the risk of moving capital during a period when you cannot predict whether the rate will recover.
This article walks through the decision framework for large stablecoin positions when a major protocol experiences a significant rate drop. You will calculate migration break-even including gas and opportunity cost, compare current alternatives with realistic APY figures, model rate stabilization scenarios based on Sky's governance history, and determine whether your position size relative to protocol TVL creates additional risk that overrides the pure yield calculation.
Prerequisites: You already have a stablecoin position in Sky Lending, you understand basic DeFi lending mechanics, and you can estimate gas costs on Ethereum mainnet or the L2 you are using.
## Why A 1.90 Point Drop On $5.867B TVL Is Different From Small-Pool Volatility
Sky Lending currently holds $5.867 billion in total value locked. The Sky Savings Rate stood at 3.60% APY as of the most recent governance vote. The protocol's yield is governance-set, not market-determined. Sky token holders vote on the SSR through executive votes. This creates a fundamentally different rate environment than utilization-driven protocols like Aave or Compound, where your APY fluctuates daily based on borrowing demand.
When a $5.867B protocol drops its rate by 1.90 percentage points, that represents $111 million in annualized yield removed from the ecosystem. That scale signals a deliberate governance decision, not a temporary market fluctuation. Sky's SSR historically tracks the Federal Reserve funds rate with a lag of 30 to 60 days. After the January 2026 Fed cut, Sky moved from 5.0% to 4.75%. The current 3.60% rate reflects subsequent Fed policy adjustments and governance votes to maintain protocol sustainability while Treasury yields declined.
Small lending pools experience volatility because utilization swings wildly when one or two large positions enter or exit. Sky's rate changes happen because governance votes to change them. This distinction matters for your migration decision. A utilization-driven rate might revert in 48 hours when a large borrower exits. A governance-set rate will not revert unless Sky token holders vote to raise it again, which depends on external yield conditions, protocol revenue, and governance priorities that you do not control.
Galaxy Digital allocated $100 million of sUSDS to its treasury and approved it as collateral for institutional lending operations. That institutional adoption signal indicates confidence in the protocol's stability, but it does not guarantee rate recovery. Institutions care about liquidity depth and counterparty risk more than they care about an extra 100 basis points. You, as a yield-focused allocator, care more about that 100 basis points because it represents $3,000 annually on a $300,000 position.
## Calculate Migration Break-Even Including Gas And Opportunity Cost
Start with the annual cost of the rate drop. Take your position size, multiply by the percentage point decline, and annualize it. On $300,000, a 1.90 point drop costs $5,700 per year, or $475 per month, or $15.62 per day.
Gas cost to migrate on Ethereum mainnet typically runs $30 to $80 for a withdraw-and-deposit sequence, depending on network congestion. Assume $50 as a baseline. If you are using an L2, gas drops to $2 to $5\. On mainnet, your gas break-even is 3.2 days of lost yield. On an L2, it is 0.32 days. Gas is not the constraint here.
Opportunity cost during migration is more significant. Withdrawing from Sky, bridging if necessary, and depositing into a new protocol takes between 15 minutes and two hours depending on confirmation times and whether you are moving between chains. During that window, your capital earns zero. Two hours of lost yield on a $300,000 position earning 4% APY costs $2.74\. Still negligible.
The real cost is information asymmetry and timing risk. If Sky governance announces a rate increase vote one day after you migrate, you have locked yourself into a new protocol with its own withdrawal queue, its own rate volatility, and its own risk profile. You cannot costlessly reverse the decision. The migration break-even calculation is not just gas plus time. It is gas plus time plus the option value of waiting for more information.
Here is the framework: if you believe the rate will stay at 3.60% or decline further, and if you have identified an alternative protocol offering at least 4.80% APY with comparable or lower risk, migration is justified immediately. The 1.20 point spread earns you $3,600 annually on $300,000, covering gas in hours and paying for itself within the first week.
If you believe the rate might recover to 4.75% or higher within the next 90 days, waiting costs you at most $1,425 in forgone yield during that period (assuming you could have earned 5.50% elsewhere). If the rate does recover, you avoid the migration cost and the risk of moving into a less stable protocol. The decision hinges on your governance outlook, not on gas.
For [stablecoin yield allocation strategies](https://altcoininvestor.com/how-to-earn-passive-income-stablecoins-2026/), position size relative to protocol TVL creates an additional constraint. If your $300,000 represents more than 2% of a protocol's TVL, you face increased slippage risk on exit. Sky's $5.867B TVL means a $300,000 position is 0.005% of total deposits. You do not face exit risk here. But if you migrate to a smaller protocol offering higher yield, check whether your position size creates liquidity constraints that override the rate advantage.
## Compare Current Alternatives With Realistic APY Figures
As of October 2026, competing stablecoin lending venues offer the following rates on deposits comparable to Sky's size and risk profile:
- Aave V3: 4.51% APY on USDC, $2.38B in USDC deposits, $16.871B total TVL
- Maple syrupUSDC: 5.2% APY, $2.92B in deposits
- Ethena sUSDe: 5.0% APY, $1.24B in deposits
- Higher-risk alternatives: savUSD at 7.6%, sUSDai at 7.0%, siUSD at 6.9%
Aave V3 offers 0.91 percentage points more than Sky's current 3.60% rate. On $300,000, that is $2,730 annually. Aave's yield is utilization-driven, meaning it fluctuates based on borrowing demand. USDC supply APY on Aave ranged between 3.8% and 5.2% over the past six months. The current 4.51% sits near the middle of that range, suggesting neither peak demand nor trough conditions. Aave's TVL at $16.871B is nearly three times Sky's, and its USDC pool alone is comparable to Sky's entire TVL. Liquidity risk is lower. Smart contract risk is comparable, as both protocols have operated for multiple years with significant third-party audits and live capital.
Maple syrupUSDC offers 5.2% APY, a 1.60 point premium over Sky. On $300,000, that is $4,800 annually. Maple's yield comes from real-world asset lending, primarily to institutional borrowers in the credit markets. This introduces credit risk that Sky does not carry in the same form. Sky's yield derives from protocol stability fees on USDS vaults, Treasury bill interest on USDC-backed reserves, and RWA allocations managed by the protocol. Maple's yield depends on borrower repayment. Default risk exists. Maple's $2.92B in deposits is half Sky's TVL, which increases your relative position size but does not yet create liquidity risk on a $300,000 allocation.
Ethena sUSDe offers 5.0% APY, a 1.40 point premium. Ethena's yield comes from basis trading: the protocol holds spot ETH and shorts ETH perpetual futures, capturing the funding rate spread. This introduces directional risk if the funding rate turns negative (which happens during bear markets) and operational risk tied to Ethena's hedging strategy. The 5.0% rate is not guaranteed. It fluctuates with crypto derivatives market conditions. Ethena's $1.24B TVL is smaller than Sky's, but still sufficient to absorb a $300,000 position without exit constraints.
The higher-yield alternatives above 6% APY (savUSD, sUSDai, siUSD) come with higher risk. Smaller TVLs, less institutional adoption, shorter operational histories, and less transparent yield sources. The extra 200 to 400 basis points might be worth it if you have vetted the protocols and sized your position accordingly, but they do not represent comparable alternatives to Sky. [Vetting new lending protocols](https://altcoininvestor.com/new-defi-protocol-safety-check/) requires 48 hours of diligence minimum, and that diligence timeline does not help you decide whether to migrate today.
For comparable risk, Aave V3 at 4.51% is the baseline alternative. That 0.91 point spread earns $2,730 annually on $300,000\. Migration cost is under $100 in gas and time. Break-even happens in 13 days. If you have no expectation of Sky rate recovery within two weeks, Aave is the rational move.
## Model Rate Stabilization Scenarios Based On Governance History
Sky's rate changes follow a predictable pattern tied to Federal Reserve policy and protocol revenue. Historical precedent shows Sky governance adjusts the SSR in response to macro yield conditions, not in response to competitor rates. In October 2024, Sky dropped from 6.5% to 6.0%, a 50 basis point cut following a Fed rate adjustment. In January 2026, Sky moved from 5.0% to 4.75%, another 25 basis point adjustment tracking the Fed's policy shift.
The current 3.60% rate reflects a cumulative decline of 115 basis points from the January 2026 level. That decline correlates with the Fed's policy trajectory over the same period. Treasury bill yields, which back a portion of Sky's reserve structure, have declined in parallel. Unless the Fed reverses course or Sky governance decides to subsidize the SSR from protocol reserves, the 3.60% rate is likely to hold or decline further, not recover.
Sky's governance forum discussions and vote history show that rate increases happen only when external yield conditions improve or when governance believes a higher SSR is necessary to attract deposits and maintain TVL competitiveness. TVL at Sky increased 7.9% over the past 30 days despite the rate decline. That suggests depositors are not exiting en masse, which reduces governance urgency to raise the rate.
Model three scenarios for the next 90 days:
- Scenario A: Rate holds at 3.60%. You earn 3.60% annualized, or $2,700 on $300,000 over 90 days.
- Scenario B: Rate declines to 3.00% after another governance vote. You earn an average of 3.30% over the period, or $2,475 on $300,000.
- Scenario C: Rate recovers to 4.50% after Fed policy shift or governance decision to subsidize SSR. You earn an average of 4.05% over the period, or $3,037 on $300,000.
Assign probabilities based on your read of Fed policy and Sky governance behavior. If you believe Scenario A or B is more likely than Scenario C, migration to Aave at 4.51% earns you at least $3,382 over the same 90 days, a gain of $682 to $907 relative to staying in Sky. If you believe Scenario C is likely, staying in Sky avoids migration cost and captures the rate recovery.
The key signal to watch is Sky governance forum activity around SSR proposals and Fed policy announcements. If a rate increase proposal appears on the governance forum, you have 48 to 72 hours before the executive vote executes. That window allows you to delay migration and wait for the outcome. If no proposal appears and Fed policy remains accommodative, the 3.60% rate is the floor, not a temporary dip.
## Determine Whether Position Size Creates Additional Migration Pressure
At $300,000 on a $5.867B TVL, your position represents 0.005% of Sky's total deposits. You do not face exit risk, slippage risk, or governance attention. You are not large enough to move the market. This simplifies the decision because you can migrate or stay based purely on yield and risk considerations, not on liquidity constraints.
If your position were $30 million instead of $300,000, representing 0.5% of Sky's TVL, the calculus changes. Exiting a 0.5% position requires more care around timing and slippage, and migration to a smaller protocol might introduce liquidity risk that overrides the yield advantage. [Position size relative to protocol TVL](https://altcoininvestor.com/position-size-too-large-for-protocol-tvl/) becomes the dominant constraint above 1% to 2% of total deposits, depending on the protocol's liquidity depth and withdrawal queue mechanics.
For positions between $100,000 and $1 million on protocols the size of Sky or Aave, liquidity is not the constraint. Yield and risk are. The migration decision simplifies to: does the rate differential justify the migration cost and the risk of moving to a different counterparty?
On a $300,000 position, the answer depends on whether you believe Sky's 3.60% rate is stable or declining, and whether you are comfortable with Aave's utilization-driven rate volatility in exchange for a current 0.91 point premium. If you want stability and are willing to accept 3.60% as the cost of staying with a governance-set rate backed by institutional adoption signals, stay in Sky. If you want higher yield and are comfortable with rate volatility, migrate to Aave. If you want higher yield and are comfortable with credit risk, migrate to Maple. If you want higher yield and are comfortable with derivatives risk, migrate to Ethena.
The decision tree is not purely mathematical. It includes your risk tolerance, your view on governance behavior, your operational capacity to monitor rates across protocols, and your willingness to migrate again if conditions change in 60 to 90 days. [Rebalancing across multiple protocols](https://altcoininvestor.com/rebalance-multiple-defi-rates-changed-same-week/) when several rates shift simultaneously is a different problem with higher operational overhead. If you migrate now, you are committing to active rate monitoring going forward because one migration does not lock in yield permanently.
## Common Failure Modes And How To Avoid Them
The most common failure mode is migrating based on a 0.5% to 1% rate differential without accounting for the volatility of the alternative protocol. You move from Sky's 3.60% to a competitor offering 4.60%, then watch that competitor's rate drop to 3.20% two weeks later because utilization crashed or governance cut rates. You have now paid gas twice and ended up worse off than if you had stayed in Sky. Avoid this by checking the rate history of the alternative protocol over the past three to six months. If the current rate sits at the high end of the historical range, it is more likely to mean-revert downward. If it sits in the middle of the range, it is more stable.
The second failure mode is migrating without checking withdrawal queue times and liquidity constraints on the target protocol. Some lending protocols implement withdrawal queues during periods of high utilization. If you migrate into a protocol and then need to exit quickly, you might face a 7-day to 14-day withdrawal delay. Sky does not have a withdrawal queue for sUSDS. Check whether your target protocol does before migrating.
The third failure mode is migrating into a higher-yield protocol without understanding the risk premium embedded in that yield. Maple's 5.2% includes credit risk. Ethena's 5.0% includes derivatives market risk. Sky's 3.60% is backed by Treasury bills, stablecoin reserves, and protocol revenue. The extra 1.60 points you earn at Maple is not free alpha. It is compensation for taking credit exposure to institutional borrowers. If you do not understand the risk, you are not making an informed migration decision. You are chasing yield without understanding what you are being paid to bear.
The fourth failure mode is failing to model the opportunity cost of waiting. If Sky's rate is going to recover in 30 days, and you migrate today, you pay migration costs twice and miss the rate recovery. If Sky's rate is going to stay flat or decline, and you wait 30 days, you lose $475 in yield during that month. The correct decision depends on your expectation of governance behavior, which you can inform by reading Sky's governance forum, tracking Fed policy, and monitoring Sky's TVL trends. If TVL is growing despite the rate cut, governance has less pressure to raise rates. If TVL is declining, governance might act faster.
## What To Do Next
Check Sky's governance forum for any active proposals to adjust the SSR. If a proposal is live or in discussion, wait for the vote outcome before migrating. If no proposal exists and TVL continues to grow, the 3.60% rate is likely stable for at least the next 30 to 60 days.
Calculate your personal yield threshold. At what APY differential do you consider migration worth the operational overhead? For some allocators, 0.5 percentage points is enough. For others, the threshold is 1.5 points. On a $300,000 position, 0.5 points is $1,500 annually. If that amount justifies two hours of migration work and ongoing rate monitoring, set your threshold at 0.5 points. If not, set it higher.
Identify two alternative protocols with TVL above $1 billion, operational history longer than 18 months, and rates currently above your threshold. Check their rate history over six months to confirm stability. Bookmark their rate pages and check them weekly. When Sky's rate disadvantage exceeds your threshold and you have confirmed the alternative protocol's rate is stable, migrate.
If you migrate, set a calendar reminder for 60 days to re-evaluate. Rates change. Sky might raise its SSR. Your new protocol might cut rates. The decision you make today is not permanent. Active yield allocation requires ongoing monitoring. If you are not willing to monitor rates monthly and migrate when conditions change, accept Sky's current rate as the cost of passive allocation and stay put.
For positions larger than $500,000, consider splitting across two protocols to reduce single-protocol risk. A $300,000 position in Sky and a $200,000 position in Aave gives you weighted average yield between the two rates while reducing your exposure to governance risk at either protocol. [Diversification across protocols](https://altcoininvestor.com/hedge-against-defi-rate-collapse/) reduces the impact of any single rate cut and reduces the urgency of migration decisions because you are already allocated across multiple venues.
## The Takeaway
Sky's 1.90 percentage point drop from 5.50% to 3.60% is a governance decision tied to macro yield conditions, not a temporary market fluctuation. On $300,000, the decline costs $5,700 annually. Migration to Aave at 4.51% recovers $2,730 of that cost. Break-even happens in under two weeks. The decision to migrate depends on whether you believe Sky's rate will hold or decline further, and whether you are willing to accept utilization-driven rate volatility in exchange for higher current yield.
Gas cost and migration time are negligible. The real cost is information asymmetry and the operational overhead of ongoing rate monitoring. If you migrate, you commit to active allocation. If you stay, you accept 3.60% as the cost of stability and governance-set predictability. Neither decision is wrong. The wrong decision is failing to calculate the cost, failing to model the alternatives, and failing to set a clear threshold for when migration becomes worth the operational effort.
Sky's institutional adoption and $5.867B TVL indicate protocol stability. The rate cut does not signal risk. It signals that governance prioritizes sustainability over yield competitiveness in the current macro environment. Whether that aligns with your allocation goals depends on whether you optimize for yield or for stability, and whether you are willing to do the work of active rate monitoring going forward.
## Frequently Asked Questions
### How long does it take to break even on gas costs when migrating from Sky Lending?
On a $300,000 position losing $5,700 annually from a 1.90 point rate drop, gas costs of $50 on Ethereum mainnet break even in 3.2 days. The real cost is opportunity cost during the migration window and the option value of waiting for potential rate recovery. If you migrate to a protocol offering 0.91 points more (like Aave at 4.51%), the yield differential of $2,730 annually means break-even occurs in 13 days including gas and time costs.
### Why did Sky Lending drop its rate by 1.90 percentage points?
Sky's rate is governance-set, not market-determined. The Sky Savings Rate follows Federal Reserve policy with a 30 to 60 day lag. The drop from 5.50% to 3.60% reflects cumulative Fed rate cuts and declining Treasury bill yields that back Sky's reserve structure. Sky governance adjusts the SSR based on macro yield conditions and protocol sustainability, not competitor rates. TVL grew 7.9% over the past 30 days despite the rate cut, reducing governance urgency to raise rates.
### Is Aave safer than Sky Lending for large stablecoin positions?
Both protocols carry comparable smart contract risk after years of operation and extensive audits. Aave's $16.871B TVL is nearly three times Sky's $5.867B, providing deeper liquidity. Aave's yield is utilization-driven and fluctuates between 3.8% and 5.2% based on borrowing demand. Sky's yield is governance-set and more predictable but less responsive to market conditions. For a $300,000 position, neither protocol presents exit liquidity risk. The choice depends on whether you prefer rate stability or current yield advantage.
### Should I wait for Sky governance to raise rates before migrating?
Check Sky's governance forum for active SSR proposals. If none exist and TVL continues growing, the 3.60% rate is likely stable for 30 to 60 days. Waiting costs $475 per month on a $300,000 position if alternative protocols offer 1.9 points more. If a rate increase proposal appears, you have 48 to 72 hours before execution, allowing you to delay migration. The decision depends on your Fed policy outlook and willingness to monitor governance activity weekly.
### What is the minimum rate differential that justifies migrating stablecoin positions?
On a $300,000 position, a 0.5 percentage point differential equals $1,500 annually. If that justifies two hours of migration work and ongoing monthly rate monitoring, set your threshold at 0.5 points. For allocators who prefer passive management, a 1.5 point threshold ($4,500 annually) reduces migration frequency. The threshold is personal and depends on your operational capacity. Active yield allocation requires monitoring rates monthly and migrating when your threshold is exceeded, making this an ongoing commitment rather than a one-time decision.
The Weekly Yield Report
You just calculated break-even for a 1.90 point drop on $300k at 3.60% versus 4.51%. Those numbers will shift again when Sky governance votes next month.
Every Thursday: where crypto yield actually is - stablecoins, liquid staking and DeFi lending, with the risk named next to the rate and what changed since last week.
[Get it free every Thursday](#/portal/signup)
Free. No trade calls, no allocations, no hype. Unsubscribe in one click.
### How To Respond When Uniswap V3 USDC-WETH Drops 3 Points
URL: https://altcoininvestor.com/uniswap-v3-usdc-eth-yield-dropped-exit/
Last updated: 2026-10-20T17:05:51.000Z
## What You Will Accomplish And What You Need Before You Start

You hold a Uniswap V3 USDC-WETH position earning 8.59% APY on $136M TVL. This week the APY dropped 3 percentage points to 5.5%. On a $200,000 position, that represents $6,000 in lost annual income. You need to decide whether to exit now and absorb impermanent loss, or stay deployed and accept the reduced rate.
This article walks through the evaluation protocol for large Uniswap V3 pools after material APY compression. You will distinguish fee tier compression from temporary volume decline, calculate your actual impermanent loss exposure, compare your current net yield against single-sided lending alternatives, and determine whether the income math justifies staying or exiting.
Before you start, you need three numbers: your original deposit ratio (USDC vs WETH), your current position value in both assets, and the date you opened the position. You also need access to your wallet to check whether your position is currently in-range or out-of-range. If you are out-of-range, you are earning zero fees and the decision tree changes completely.
## Step One: Identify Whether The Drop Is Structural Or Temporary

Large pools do not compress 3 percentage points on noise.
The USDC-WETH 0.05% fee tier holds $99.17M in TVL with 24-hour volume of $28.83M. When APY drops from 8.59% to 5.5%, the first question is whether trading volume declined or whether fee capture per dollar of liquidity declined. These are different failure modes with different persistence.
Check 7-day and 30-day volume trends on the specific fee tier you are deployed in. [DefiLlama tracks historical APY and volume for the 0.05% USDC-WETH pool](https://defillama.com/yields/pool/665dc8bc-c79d-4800-97f7-304bf368e547). If 24-hour volume dropped from $40M to $28M, that explains most of the APY compression and may revert when volatility returns. If volume stayed flat or rose while APY dropped, you are experiencing fee tier cannibalization.
Fee tier cannibalization happens when liquidity migrates from higher-fee tiers to lower-fee tiers. Uniswap V3 offers four fee tiers per pair: 0.01%, 0.05%, 0.3%, and 1%. The ETH-USDC 0.3% tier holds $144M TVL while the 0.05% tier holds $34M and the 0.01% tier holds $8M. When capital concentrates in lower-fee tiers, high-fee LPs earn less per trade because traders route through the cheaper pool.
Recent data shows increasing liquidity concentration in high-fee tiers alongside rising fee-tier cannibalization in lower tiers. If you are in the 0.05% tier and the 0.01% tier is capturing more volume, your APY will compress regardless of overall market activity. That is a structural signal, not a temporary one.
## Step Two: Check Whether Your Position Is In-Range Or Earning Nothing
Uniswap V3 concentrated liquidity only earns fees when price stays inside your selected range.
If WETH price has moved outside your range, your position is earning 0% APY right now regardless of what the pool-level APY displays. [Concentrated liquidity delivers up to 4000x capital efficiency versus V2](https://docs.uniswap.org/concepts/concepts/concentrated-liquidity), but only when price stays in-range. Out-of-range positions contribute zero liquidity to the pool and collect zero fees.
Log into your position and check the current WETH price against your upper and lower ticks. If you set a tight range to maximize fee capture and WETH rallied 8%, you are likely out-of-range. If you set a wide range to reduce rebalancing frequency, you may still be earning fees but at lower efficiency than tighter positions.
If you are out-of-range, the decision is simple: rebalance or exit. Rebalancing costs gas. On Ethereum mainnet, rebalancing a $200k position costs $50 to $150 depending on network congestion. If WETH volatility is high, you may need to rebalance weekly or more, which compounds gas drag on net yield. Concentrated liquidity requires frequent rebalancing or use of manager services like Gamma Strategies, which charge performance fees that further erode your net APY.
If you are in-range but operating at the edge of your range, calculate how many days of fee income you need to recover the next rebalancing cost. On a 5.5% net APY, a $200k position earns $30 per day. A $100 rebalancing cost requires 3.3 days of fee income just to break even on the gas. If you expect to rebalance twice per month, you are spending $200 monthly or $2,400 annually, which reduces your effective APY from 5.5% to 4.3%.
## Step Three: Calculate Your Current Impermanent Loss Exposure
Impermanent loss is the opportunity cost of holding a 50-50 pool position versus holding the original assets separately.
The standard formula is IL = 2 \* sqrt(r) / (1 + r) - 1, where r is the price ratio of the new price divided by the original price. If you deposited when WETH was $2,200 and WETH is now $2,410, your price ratio is 1.095\. That produces an impermanent loss of approximately 0.22%. On a $200k position, you have lost $440 in principal relative to simply holding the original 50-50 allocation.
Concentrated liquidity amplifies impermanent loss compared to full-range V2 positions because your position is more sensitive to price movement within your chosen range. If you set a narrow range to boost fee income, a 10% WETH move can generate 2% to 3% IL instead of the 0.5% you would experience in a full-range pool.
LPing is profitable when fee yield plus any reward yield exceeds impermanent loss over your holding period. If you have been deployed for 60 days at an average APY of 7% (before the recent drop), you earned approximately $2,300 in fees. Your current IL is $440\. Your net gain is $1,860, or an effective APY of 5.6% after accounting for IL drag.
That calculation changes when APY drops to 5.5% going forward. If WETH continues to drift higher and you experience another 5% appreciation over the next 60 days, you will earn $1,800 in fees but incur an additional $600 in IL. Your net gain drops to $1,200, or 3.6% effective APY. At that level, you are no longer outperforming single-sided USDC lending.
Use [the IL calculator](https://altcoininvestor.com/impermanent-loss-calculator/) to model different price scenarios and calculate the fee income required to compensate. A pool needs to generate at least 24.58% APY in fees to compensate for a -2.02% IL on a 50% token appreciation. If your current APY is 5.5% and you expect WETH to appreciate another 20%, the math does not work.
## Step Four: Compare Net Yield Against Single-Sided Lending Alternatives
When Uniswap V3 APY compresses below 6%, single-sided USDC lending becomes competitive or superior depending on your volatility expectations.
Fluid USDC lending pays 5.19% on Ethereum with $154M TVL as of September 2026\. [Aave v3 USDC pays 4.60% on Ethereum](https://altcoininvestor.com/best-defi-protocols/) with $128M supplied. These are single-sided yields with zero impermanent loss exposure. If you exit your Uniswap position and deploy the full balance into Fluid, you earn 5.19% on the entire position with no rebalancing costs, no gas drag, and no IL risk.
The comparison is not 5.5% Uniswap APY versus 5.19% Fluid APY. It is 5.5% minus IL drag minus gas costs versus 5.19% with no drag. On the numbers above, your effective Uniswap yield after IL and rebalancing is closer to 3.6% to 4.3%. Fluid pays more and does so with lower operational overhead.
The breakeven depends on your WETH volatility forecast. If you expect WETH to trade sideways in a 5% range for the next 90 days, IL will be minimal and Uniswap's 5.5% will outperform Fluid's 5.19%. If you expect continued appreciation or a sharp correction, IL will erode most or all of the fee advantage and Fluid becomes the better deployment.
There is a second consideration: position size relative to protocol TVL. [Your position becomes an exit risk when it exceeds 2% to 5% of protocol TVL](https://altcoininvestor.com/position-size-too-large-for-protocol-tvl/). A $200k position represents 0.15% of the $136M USDC-WETH pool, well below any liquidity threshold. The same position represents 0.13% of Fluid's $154M USDC TVL. Both are safe from a liquidity perspective, so position size does not constrain your exit decision.
## Step Five: Calculate The Exit Cost And Compare Against Ongoing Opportunity Cost
Exiting a Uniswap V3 position locks in your current impermanent loss and incurs gas costs.
If your current IL is $440 and gas to withdraw and redeploy into Fluid costs $80, your total exit cost is $520\. Your ongoing opportunity cost is the difference between what you would earn staying in Uniswap versus moving to Fluid. At 3.6% effective Uniswap yield versus 5.19% Fluid yield, you are losing 1.59 percentage points annually by staying deployed. On $200k, that is $3,180 per year or $265 per month.
Your exit cost of $520 is recovered in two months of higher Fluid yield. After that, you are ahead. If APY compression is structural and you expect the 5.5% Uniswap rate to persist or decline further, the exit math is clear: absorb the $520 cost now and earn an additional $2,660 over the next twelve months.
If APY compression is temporary and you expect a reversion to 8% within 30 days, the calculus inverts. Staying deployed at 5.5% for one month costs you $133 in opportunity cost relative to Fluid. If APY reverts to 8%, you then earn 2.81 percentage points above Fluid, or $468 monthly. Exiting now would forfeit that upside and cost you the $520 exit fee unnecessarily.
The decision hinges on your structural versus temporary assessment from Step One. If volume declined but fee tier dynamics remain stable, wait. If fee tier cannibalization is accelerating or if L2 volume is siphoning activity from Ethereum mainnet, exit.
## Step Six: Consider Layer 2 Migration As A Third Option
Ethereum mainnet gas costs are depressing your ROI. Layer 2 solutions offer the same Uniswap V3 product with materially lower rebalancing costs.
Arbitrum, Optimism, and Base all host Uniswap V3 with comparable liquidity on major pairs. The USDC-WETH pool on Arbitrum often pays similar or higher APY than Ethereum mainnet because liquidity is more fragmented and fee capture per dollar is higher. Rebalancing costs on L2 are $2 to $8 instead of $50 to $150, which eliminates most of the gas drag that reduces your effective yield on mainnet.
Migrating from Ethereum to Arbitrum requires bridging your assets, which costs $30 to $60 depending on network conditions. On a $200k position, that is a one-time cost of 0.015% to 0.03%. If L2 saves you $150 per month in rebalancing costs, the bridge cost is recovered in two weeks.
Before you migrate, verify that the target L2 pool has sufficient liquidity to support your position size and that historical APY is stable. A pool with $15M TVL paying 9% APY may be subsidized by short-term incentives rather than organic fee flow. [Uniswap V3 yields come entirely from trading fees with no token incentives](https://altcoininvestor.com/why-uniswap-v3-apy-drop/), so L2 APY should track volume and liquidity depth, not emissions schedules.
## Common Failure Modes And How To Avoid Them
The most common mistake is treating pool-level APY as your personal yield.
Pool-level APY is calculated on in-range liquidity only. If 40% of the pool is out-of-range, the displayed APY reflects the income earned by the 60% that is in-range. Your position may be in the 40% earning nothing. Always check your position-specific APY, not the pool average.
The second mistake is ignoring IL until exit. IL accrues continuously as price moves. If you wait until you want to exit to calculate IL, you may discover that six months of fee income was entirely consumed by IL and your net position is negative. Run the IL calculation monthly and compare cumulative fees earned against cumulative IL incurred. If IL is outpacing fees, you are losing money in real time.
The third mistake is chasing APY back up by moving into higher-fee tiers. The 0.3% and 1% fee tiers pay higher APY because they capture fewer trades. Volume concentrates in the lowest-fee tier that offers acceptable liquidity. Moving from the 0.05% tier to the 0.3% tier may show a higher displayed APY, but your actual fee income will likely decline because trade routing avoids the more expensive pool.
The fourth mistake is over-rebalancing. Every rebalancing event costs gas and locks in your current IL. If you rebalance every time WETH moves 3%, you will spend more on gas than you gain in incremental fee capture. Set rebalancing thresholds based on the trade-off between gas cost and expected fee income gain. On Ethereum mainnet with $100 rebalancing costs, a threshold of 8% to 10% price movement is more sustainable than 3% to 5%.
## What To Do Next
Run the six-step protocol above within 48 hours of the APY drop.
If the drop is structural, if you are spending more than $150 monthly on rebalancing, and if IL is eroding more than 1 percentage point of yield, exit to single-sided USDC lending. If the drop is temporary, if you are in-range with low rebalancing frequency, and if IL is contained below 0.5%, stay deployed and reassess in 14 days.
If you decide to stay, set a calendar reminder to re-run this protocol in two weeks. If APY has not reverted or if it has compressed further, the exit case strengthens. [When multiple protocols move 2+ points in one week](https://altcoininvestor.com/rebalance-multiple-defi-rates-changed-same-week/), portfolio-level rebalancing becomes necessary even if individual position math is marginal.
If you decide to exit, withdraw your position, calculate final IL, and redeploy into the highest single-sided USDC rate available at your position size. Document the exit date, final APY, cumulative fees earned, and total IL incurred. That data informs your next LP decision and prevents you from repeating the same deployment mistakes.
## The Takeaway
A 3-percentage-point drop on $136M TVL is a structural signal, not market noise. Large pools compress when fee tiers cannibalize each other or when volume migrates to L2\. Your exit decision depends on whether fee income minus IL minus gas exceeds the best single-sided alternative. On current numbers, Fluid USDC at 5.19% outperforms Uniswap V3 at 5.5% once you account for IL drag and rebalancing costs. If you are out-of-range or rebalancing more than twice monthly, the exit case is clear. If you are in-range with minimal gas drag, you have two weeks to see whether the compression reverts before the opportunity cost becomes material.
Run the calculation every time APY moves more than 2 percentage points. The math changes faster than the dashboard updates.
## Frequently Asked Questions
### How do I know if my Uniswap V3 position is in-range or out-of-range?
Log into your wallet and open your Uniswap V3 position. The interface displays your upper and lower price ticks alongside the current market price. If the current WETH price falls between your upper and lower ticks, you are in-range and earning fees. If the current price is above your upper tick or below your lower tick, you are out-of-range and earning zero fees. Out-of-range positions contribute no liquidity to the pool and collect no trading fees until price moves back into your selected range.
### When does fee tier cannibalization make Uniswap V3 positions unprofitable?
Fee tier cannibalization occurs when liquidity migrates from higher-fee tiers to lower-fee tiers, reducing fee capture per trade for LPs in the higher tier. If you are in the 0.05% tier and the 0.01% tier is capturing increasing volume, your APY will compress even if overall trading volume remains stable. Check 30-day volume trends across all four fee tiers for your pair. If lower tiers are gaining volume share while your tier is losing share, that is a structural signal indicating long-term APY compression rather than temporary volatility.
### How much impermanent loss should I accept before exiting a Uniswap V3 position?
Impermanent loss is acceptable as long as cumulative fee income exceeds cumulative IL over your holding period. Calculate your position-specific IL monthly using the formula IL = 2 \* sqrt(r) / (1 + r) - 1, where r is the current price divided by your entry price. Compare cumulative IL against cumulative fees earned. If IL is consuming more than 50% of your fee income, your effective yield is too low to justify continued exposure. If IL exceeds total fees earned, you are losing money in real time and should exit immediately.
### Is Fluid USDC lending safer than Uniswap V3 liquidity providing?
Fluid USDC lending at 5.19% carries smart contract risk and protocol solvency risk, but eliminates impermanent loss, rebalancing costs, and gas drag. Uniswap V3 LP positions carry the same smart contract risk plus additional IL risk and ongoing rebalancing costs. On a risk-adjusted basis, single-sided lending is simpler and more predictable. Uniswap V3 becomes attractive only when fee APY exceeds lending APY by at least 2 to 3 percentage points to compensate for IL and gas costs. At current rates, Fluid offers better risk-adjusted returns for most position sizes.
### Should I migrate my Uniswap V3 position from Ethereum to Arbitrum or Base?
Layer 2 migration makes sense when rebalancing costs on Ethereum mainnet exceed $100 monthly. Arbitrum and Base offer the same Uniswap V3 product with rebalancing costs of $2 to $8 instead of $50 to $150\. Bridging from Ethereum to L2 costs $30 to $60 one-time. If you rebalance twice monthly on mainnet, you spend $200 to $300 monthly on gas. Migrating to L2 saves you $190 to $290 monthly and recovers the bridge cost in one week. Verify that the target L2 pool has sufficient TVL and stable APY before migrating.
The Weekly Yield Report
You just worked through the six-step exit protocol for Uniswap V3 APY compression on $136M TVL. Those pool dynamics and fee tier structures will shift again next month.
Every Thursday: where crypto yield actually is - stablecoins, liquid staking and DeFi lending, with the risk named next to the rate and what changed since last week.
[Get it free every Thursday](#/portal/signup)
Free. No trade calls, no allocations, no hype. Unsubscribe in one click.
### Tokenized Stocks Face a Corporate Actions Test That Blockchain Alone Cannot Solve
URL: https://altcoininvestor.com/tokenized-stocks-corporate-actions-test/
Last updated: 2026-10-20T17:00:49.000Z
A stock split is a routine event in traditional equity markets. For tokenized shares, it can become a test of whether blockchain infrastructure is capable of supporting the obligations that come with securities ownership.
The challenge extends beyond updating token balances. Dividends must reach eligible investors, voting rights must be assigned correctly, and corporate actions must remain consistent with the official shareholder records. When securities move between custodians, trading platforms and blockchain networks, coordinating these processes becomes more complicated.
As tokenization advances in U.S. equity markets, these operational requirements could prove just as important as faster settlement or extended trading hours.
## Corporate Actions Expose the Limits of Tokenization
Traditional securities infrastructure supports a broad range of corporate events, including stock splits, mergers, dividend distributions, tender offers and shareholder votes.
Each event requires financial intermediaries to establish which investors are entitled to participate and how their holdings should be adjusted.
Blockchain technology can automate some of these processes through smart contracts. A tokenized security could, for example, distribute payments to eligible wallets or adjust token balances following a stock split.
However, automation depends on accurate information about the underlying security and its beneficial owners.
A blockchain may record that a wallet holds 100 tokens, but that record does not necessarily establish who owns the underlying shares, whether those tokens carry voting rights or which intermediary is responsible for delivering corporate benefits.
The Securities and Exchange Commission addressed this complexity in its[ January 2026 statement on tokenized securities](https://www.sec.gov/newsroom/speeches-statements/corp-fin-statement-tokenized-securities-012826-statement-tokenized-securities), explaining that tokenization arrangements can differ significantly in their legal structures and the rights afforded to holders.
Some arrangements represent securities issued directly by a company. Others involve third parties creating instruments linked to existing shares.
For corporate actions, those differences can determine whether a process is automated directly through the security's ownership records or requires coordination with another entity.
## The Shareholder Register Remains Critical
A central question for tokenized equities is which record has legal authority when different systems report ownership.
Consider a company whose shares are represented by tokens held across several custodial arrangements. An investor might transfer tokens between wallets shortly before a dividend record date.
The blockchain could record the transfer immediately. Yet the investor's entitlement to the dividend would still depend on the applicable legal structure, record-date rules and the relationship between the token and the official ownership register.
If the systems are not synchronized, the issuer and its intermediaries may need reconciliation procedures to establish the correct recipient.
The problem becomes more significant when tokenized securities circulate across multiple networks or trading environments.
As[ Wanja Njoroge](https://thechainobserver.com/tokenized-stocks-could-import-cryptos-liquidity-problems-into-equities/) noted in a recent article, tokenized equities can face liquidity fragmentation when trading activity is distributed across different venues, blockchain networks and legal structures. These same divisions may also complicate the administration of shareholder rights, requiring separate procedures for dividend distributions, ownership changes and corporate actions.
Interoperability therefore involves more than moving tokens between networks. It also requires preserving the rights and obligations attached to the securities they represent.
## SEC Rules Put Shareholder Rights at the Center
The SEC's September 17, 2026 innovation exemption provides an important indication of how regulators are approaching these issues.
The temporary framework allows qualifying Tokenized Securities Venues to facilitate trading in certain tokenized National Market System stocks through permissioned automated market makers and liquidity pools.
The exemption is conditional and scheduled to expire five years after publication.
The broader regulatory debate also extends to the [CLARITY Act](https://bravenewcoin.com/insights/clarity-act-stalls-but-sec-gives-crypto-a-boost-with-new-tokenized-securities-rules), which seeks to establish clearer boundaries between SEC and CFTC oversight of digital assets. However, its market-structure provisions do not replace the securities-law requirements governing tokenized equities. Regardless of how the legislation progresses, tokenized shares must still address shareholder rights, ownership records and corporate actions under the applicable securities framework.
The legislation failed to advance in the Senate in September 2026, leaving regulators to work within their existing statutory authority. This makes the SEC's recent tokenized securities exemption particularly significant, although the operational challenges surrounding dividends, voting rights and shareholder records remain unresolved.
One requirement is particularly relevant to corporate actions: eligible tokenized stocks must provide holders with the same rights and privileges as equivalent traditional securities.
These include dividend entitlements and voting rights.
The requirement narrows the gap between a token that merely tracks a stock's economic performance and one that represents the rights associated with ownership of the security.
It also creates practical responsibilities for trading venues and supporting infrastructure.
For example, a tokenized stock that provides voting rights needs a reliable mechanism for determining eligible holders and enabling those rights to be exercised. A dividend-bearing token must similarly support accurate entitlement calculations and payment processing.
The SEC's conditions establish expectations for these rights, but they do not eliminate the technical and operational work needed to deliver them.
## Why Faster Settlement Is Not Enough
Much of the appeal of tokenized securities comes from the possibility of reducing settlement delays and simplifying transfers between market participants.
In conventional U.S. equity markets, the standard settlement cycle moved from two business days to one in May 2024.
Blockchain-based systems could potentially shorten parts of that process further, particularly where payment and securities transfers can be coordinated within the same infrastructure.
But settlement speed and corporate action processing solve different problems.
A trade can settle successfully without guaranteeing that subsequent dividend payments, shareholder communications or merger consideration will be handled correctly.
For institutional investors, these post-trade obligations are essential components of securities ownership.
Asset managers and custodians need dependable records to reconcile positions, manage client entitlements and demonstrate compliance with applicable rules.
A system that transfers securities efficiently but requires extensive manual intervention for corporate events may deliver fewer operational benefits than its settlement technology suggests.
There is also a distinction between technical finality and legal certainty. A blockchain transaction may be irreversible at the network level while questions about beneficial ownership or corporate entitlements still require resolution under securities law.
## Transfer Agents Could Become More Important
The growing importance of ownership records places transfer agents in a potentially influential position.
Transfer agents maintain securities ownership records and perform functions connected with transfers, distributions and shareholder administration.
In September 2026, the SEC proposed amendments to its transfer agent rules, reflecting the agency's broader effort to modernize securities infrastructure.
The development raises a practical question about whether blockchain-based ownership systems will replace traditional recordkeeping functions or become integrated into them.
A distributed ledger could serve as part of an authoritative ownership record, provided the arrangement satisfies relevant legal and operational requirements.
Alternatively, blockchain transactions could operate alongside conventional registers, with intermediaries responsible for ensuring consistency.
The latter approach may preserve familiar legal processes but also introduce reconciliation costs that reduce some of tokenization's efficiency gains.
The outcome will depend on how issuers, transfer agents, custodians and trading venues divide responsibilities.
## The Real Test Comes After the Trade
Tokenized equities are increasingly being evaluated as financial infrastructure rather than experimental blockchain products.
That shift changes the criteria for success.
Trading availability, transaction costs and settlement efficiency remain important, but investors also need confidence that their ownership rights survive transfers between platforms and changes in corporate structure.
A tokenized share should not become operationally difficult to administer simply because its owner moves it to another supported wallet or trading venue.
Nor should a merger, stock split or dividend distribution create uncertainty about the relationship between the token and the underlying security.
The strongest tokenization models may ultimately be those that make corporate actions almost invisible to investors, preserving familiar shareholder protections while reducing the operational burden on intermediaries.
For equity markets, the decisive achievement will not be proving that shares can move on a blockchain. It will be demonstrating that everything attached to those shares can move with them.
### How To Respond When Curve CRVUSD-CBBTC Collapses 12 Points
URL: https://altcoininvestor.com/curve-crvusd-cbbtc-apy-collapsed-what-to-do/
Last updated: 2026-10-20T15:04:35.000Z
## What This Protocol Accomplishes And What You Need

You are holding a position in the Curve CRVUSD-CBBTC pool. The APY collapsed from 14.48% to 2.23% in one week. That is an 84.6% yield reduction. On a $100,000 position, you just lost $12,250 in annualized income. The question is simple: do you exit now, or do you wait for a reversion?
This protocol walks you through the decision tree. You will calculate your migration cost, identify the yield threshold where exit makes economic sense, compare replacement pools at similar risk profiles, and determine whether the collapse signals permanent gauge reallocation or temporary utilization shock. By the end, you will have a specific action: exit immediately, wait 7 days and reassess, or reduce position size by a calculated percentage.
You need three inputs before you start. First, your exact position size in USD. Second, your cost basis for both CRVUSD and cbBTC so you can calculate impermanent loss to date. Third, current Ethereum gas prices because migration cost is the hinge variable in this decision. If you deposited via Convex or Yearn rather than directly into Curve, add 15 to 20 seconds to look up your actual wrapper contract because exit mechanics differ.
## Calculate Migration Cost And Yield Breakeven
Start with the cost to exit your current position. Curve charges a 0.04% fee on volatile pools like CRVUSD-CBBTC. On a $100,000 position, that is $40\. Add Ethereum gas for the withdrawal transaction. At current network conditions, a Curve LP withdrawal costs approximately $35 to $55 depending on time of day. Use $45 as your baseline. Your exit cost is $85 before you account for slippage.
Slippage depends on pool depth and your position size relative to total liquidity. The CRVUSD-CBBTC pool held $96.77 million TVL in early September 2026\. If that figure is still accurate and your position is $100,000, you represent 0.103% of the pool. On a Curve StableSwap implementation with this depth, expect 0.05% to 0.15% slippage on exit. Use 0.10% as your midpoint estimate, adding another $100\. Your total exit cost is now $185.
Entry into a replacement pool costs the same. Another $45 in gas, another 0.04% in fees if you move to a similar Curve pool, another $100 in slippage if the replacement pool has comparable TVL. Total round-trip migration cost: $370.
Now calculate breakeven. If you migrate from 2.23% APY to a replacement pool paying 6.00% APY, you gain 3.77 percentage points. On $100,000, that is $3,770 per year, or $10.33 per day. Your $370 migration cost breaks even in 35.8 days. If you expect to hold the replacement position for more than 36 days, migration is profitable. If you expect rate reversion in the current pool within 30 days, staying is cheaper.
The math shifts dramatically with position size. A $10,000 position pays the same $370 migration cost but earns only $377 per year from the 3.77-point gain. Breakeven is 358 days. Migration is not rational unless the replacement pool pays 8.00% or higher, extending the yield gain to 5.77 points and cutting breakeven to 175 days. For positions under $25,000, rate collapses below 4.00% APY almost never justify migration on Ethereum mainnet. You either accept the lower yield or you move to Layer 2 where gas costs are 95% lower.
## Determine Whether The Collapse Is Structural Or Temporary
Rate collapses in Curve pools happen for three reasons. First, gauge weight reallocation. CRV emissions are directed by veCRV holders who vote weekly on how to distribute rewards across pools. If a large holder redirects votes away from CRVUSD-CBBTC, the CRV incentive drops and the APY falls with it. This is structural. It does not revert unless voting patterns change or the pool's strategic importance increases.
Second, collateral migration. If borrowers using cbBTC as collateral on platforms like Aave or Morpho repay loans and withdraw their capital, utilization in the broader cbBTC ecosystem drops. That reduces demand for cbBTC liquidity, which reduces fee volume in Curve pools that include cbBTC. Lower fees mean lower base yield. This can be temporary if macro conditions or leverage demand shifts back, or it can be structural if cbBTC loses market share to native Bitcoin or other wrapped Bitcoin products.
Third, liquidity provider inflows. If $20 million in new capital enters the CRVUSD-CBBTC pool, total fees are divided among more LPs. The APY per dollar deposited falls even though the pool is earning the same absolute dollar amount in fees. This is typically temporary because high-volume LPs are yield-sensitive and will exit when returns drop below their hurdle rate, rebalancing the pool.
You identify the cause by checking three data points. Go to the [Curve protocol page on DefiLlama](https://defillama.com/protocol/curve-finance) and compare current TVL for CRVUSD-CBBTC against the figure from 7 days ago. If TVL rose 15% or more in the last week, LP dilution is the primary cause. Next, check the Curve governance forum or the gauge weight page to see if CRVUSD-CBBTC lost voting power. If gauge weight dropped 20% or more, CRV emission cuts are the driver. Finally, review cbBTC utilization on Aave V3 and Morpho Blue. If borrow rates for cbBTC fell 2 percentage points or more in the same period, collateral migration is the third factor.
If the collapse is LP dilution driven, expect partial reversion within 10 to 20 days as yield-sensitive capital exits. If it is gauge weight driven, expect permanence unless governance priorities shift. If it is collateral migration driven, watch macro leverage demand. Bitcoin price rallies typically increase cbBTC borrowing within 7 to 14 days as traders lever up for volatility. The CRVUSD-CBBTC APY would follow.
## Compare Replacement Pools At Similar Risk Profiles
If you decide to migrate, your replacement pool must match the risk profile of CRVUSD-CBBTC or you are not making an equivalent comparison. The CRVUSD-CBBTC pool exposes you to three risks: impermanent loss from Bitcoin price movement relative to the US dollar, smart contract risk on both the Curve protocol and the cbBTC wrapper, and depeg risk on CRVUSD, which is Curve's native stablecoin.
Impermanent loss in a pool pairing a stablecoin with a volatile asset like cbBTC can reach 5% to 15% during sharp Bitcoin moves. If Bitcoin rises 30% over two weeks, your position will be rebalanced toward more CRVUSD and less cbBTC. You capture fees during the volatility but you miss part of the Bitcoin gain. If Bitcoin falls 30%, you accumulate cbBTC exposure at declining prices. Curve's StableSwap algorithm reduces this effect compared to a constant-product AMM like Uniswap, but it does not eliminate it.
For equivalent exposure, you need another pool pairing a Bitcoin-backed asset with a stablecoin. Curve's CRVUSD-WBTC pool is the closest match. As of early October 2026, similar Curve stable pools with reward incentives were paying 2.2% to 4.6% APY. If CRVUSD-WBTC is within that range and holds comparable TVL, it offers a direct substitute with the same impermanent loss and smart contract profile but potentially different gauge weight.
Alternatively, move to a pure stablecoin pool to eliminate impermanent loss entirely. The Curve 3pool (USDC, USDT, DAI) paid close to zero in late September 2026, but other stablecoin pools with active gauge incentives were in the 3% to 5% range. You lose Bitcoin exposure but you lock in predictable yield. For positions over $100,000 where impermanent loss can cost $5,000 to $15,000 during a volatile quarter, this trade may be worth the lower APY.
You can also shift to lending protocols. Fluid USDC was paying 5.55% in mid-October 2026 after a 4.29-point drop the prior week. [Aave, Compound, and other lending platforms reviewed here](https://altcoininvestor.com/best-defi-protocols/) offer stablecoin rates in the 3% to 7% range depending on utilization. Lending eliminates impermanent loss and simplifies position management, but you lose LP fee upside during high-volatility periods. Curve LP positions in volatile pairs can spike to 12% to 18% APY for short windows when trading volume surges. Lending rates do not spike the same way.
## Decide Whether To Exit Fully Or Reduce Position Size
Full exit is correct when migration cost breaks even in under 60 days and the replacement pool has comparable or lower risk. Partial exit is correct when you expect rate reversion but want to limit downside, or when your position size is large enough that migration cost per dollar is negligible but you are uncertain about replacement pool quality.
Partial exit works like this. Withdraw 50% of your position and migrate that capital to a replacement pool. Leave 50% in CRVUSD-CBBTC. You pay migration cost on only half the position, cutting your breakeven timeline in half. If the original pool reverts to 8% or higher within 30 days, you benefit from both the reversion and the higher yield on the migrated portion. If it does not revert, you have already de-risked half your capital and you can exit the remainder after another week of observation.
For positions above $250,000, partial exit also reduces slippage. Moving $250,000 out of a $96 million pool in one transaction can push slippage to 0.25% or higher, costing $625\. Two $125,000 transactions spread across 24 hours reduce slippage to 0.12% each, saving $325\. The gas cost of a second transaction is $45\. You net $280 by splitting the exit.
The third option is to exit fully but delay entry into the replacement pool. Withdraw from CRVUSD-CBBTC, hold stablecoins in your wallet for 7 days, and watch whether the APY begins reverting. If gauge weight was redirected temporarily due to a governance vote focused on a new pool launch, the next vote cycle may restore emissions. If utilization dropped due to a short-term deleveraging event, borrowing activity may resume within a week. You pay exit costs now, avoid paying entry costs until you have more information, and you preserve optionality. The downside is 7 days of zero yield on your capital.
## Account For VeCRV Lock And Convex Wrapper Complications
If you deposited into CRVUSD-CBBTC via Convex, Yearn, or another aggregator, your LP tokens are wrapped in a secondary contract that auto-harvests CRV rewards and may lock them for extended periods. Convex, for example, converts CRV rewards to cvxCRV, which cannot be redeemed 1-to-1 for CRV without accepting a 10% to 20% discount or waiting for liquidity in the cvxCRV-CRV pool.
Check your aggregator's withdrawal terms before you exit. Convex allows instant LP withdrawal but your pending CRV rewards are converted to cvxCRV at the moment of withdrawal. If you accumulated $800 in CRV rewards over three months, you will receive $800 in cvxCRV, which may trade at a 15% discount to CRV. Your actual reward is $680\. This hidden friction adds to your migration cost. Calculate it before you commit to exit.
Yearn operates differently. Yearn vaults may impose a 0.1% withdrawal fee on top of Curve's 0.04%, and they harvest rewards on a schedule rather than on-demand. If the vault has not harvested in 48 hours and you withdraw, you forfeit accrued but unharvested rewards. Check the vault's last harvest timestamp on Yearn's interface. If the next harvest is scheduled within 24 hours, wait for it before you withdraw.
For direct Curve LPs who locked CRV for veCRV to boost their yield, the lock period is non-negotiable. veCRV cannot be unlocked early. If you are three months into a one-year lock and you exit the LP position, you lose the yield boost on future positions until the lock expires, but your veCRV remains locked and continues earning protocol fees. The opportunity cost is the boost you could have applied to a new LP position. For a 2.5x boost, losing it drops your effective APY by 60% on any replacement Curve pool. Factor this into your migration math.
## Set A Reversion Threshold And Reassessment Date
If you decide not to migrate immediately, set two trip wires. First, a yield threshold below which you exit regardless of reversion expectations. Second, a calendar date by which you will reassess the position even if yield has not hit the threshold.
The yield threshold should reflect your minimum acceptable return on the capital adjusted for risk. If you can earn 5.5% on Fluid USDC with lower smart contract risk and zero impermanent loss, your Curve position must pay at least 6.5% to justify the additional risk. If CRVUSD-CBBTC drops below 6.5%, exit. Do not wait for further deterioration. The 1.0 percentage point risk premium is your decision rule.
The reassessment date should be 10 to 14 days from now. That gives the pool two gauge vote cycles and two weeks of utilization data. If yield has not reverted to 6.5% or higher by that date, the collapse is more likely structural than temporary. Exit then, even if migration cost breakeven has not been reached. Staying in a structurally impaired pool hoping for reversion is how LP positions turn into slow losses.
Track three metrics during the reassessment window. First, daily fee volume. If the pool's 24-hour fee earnings are rising week-over-week, base yield is improving and reversion is plausible. Second, gauge weight. If veCRV voting patterns shift back toward CRVUSD-CBBTC, CRV emissions will increase and APY will follow. Third, TVL direction. If TVL is falling 3% to 5% per week, yield-sensitive LPs are already exiting. That signals the market's consensus that reversion is unlikely.
Set alerts on DefiLlama or Curve's own analytics page to notify you when CRVUSD-CBBTC APY crosses 6.5% or when TVL drops 10% from current levels. Automating the reassessment removes the temptation to stay in the position out of inertia. [This rebalancing guide](https://altcoininvestor.com/rebalance-multiple-defi-rates-changed-same-week/) covers the alert setup process for tracking multiple protocol rate changes simultaneously.
## Evaluate Impermanent Loss Before Final Migration Decision
Before you migrate, calculate your impermanent loss to date. If you deposited into CRVUSD-CBBTC when Bitcoin was $60,000 and Bitcoin is now $68,000, you have unrealized impermanent loss because your position rebalanced toward CRVUSD during the rally. Withdrawing now locks in that loss. Compare it against the yield gain from migration to determine whether migration is still profitable.
Use the impermanent loss formula for a rough estimate: IL = 2 \* sqrt(r) / (1 + r) - 1, where r is the price ratio change. If Bitcoin rose from $60,000 to $68,000, r = 68,000 / 60,000 = 1.133\. Plug that in: IL = 2 \* sqrt(1.133) / (1 + 1.133) - 1 = 2 \* 1.064 / 2.133 - 1 = -0.0024, or 0.24% loss. On a $100,000 position, that is $240.
That formula assumes a constant-product AMM. Curve StableSwap uses a different curve, but the directional result holds. For small price changes under 20%, impermanent loss in Curve volatile pools is typically 30% to 50% lower than in Uniswap V2 equivalents. Adjust your estimate accordingly. In this example, 0.24% becomes approximately 0.12% to 0.17%, or $120 to $170.
Add that impermanent loss to your migration cost. Your total cost to exit and migrate is now $370 in fees and gas plus $145 in impermanent loss, totaling $515\. Recalculate breakeven. If you migrate to a 6.00% pool from 2.23%, your 3.77-point gain earns $3,770 per year on $100,000, or $10.33 per day. Breakeven is now 49.9 days instead of 35.8 days. If you still expect to hold for more than 50 days, migrate. If your time horizon is shorter or uncertain, partial exit makes more sense.
For a more precise calculation, check Curve's analytics or use the [impermanent loss calculator here](https://altcoininvestor.com/impermanent-loss-calculator/). Input your deposit date, your deposit ratio, and the current ratio. The calculator accounts for Curve's bonding curve and gives you an exact figure.
## Common Failure Modes And How To Avoid Them
The first failure mode is chasing yield into a replacement pool you have not vetted. A 9.00% APY on a new Curve pool looks attractive compared to 2.23%, but if the pool launched three weeks ago and holds only $8 million TVL, you are taking materially higher smart contract risk and liquidity risk. Your position may be 1% of that pool, making exit slippage 10x worse than in CRVUSD-CBBTC. Run the [48-hour vetting protocol for new Curve pools](https://altcoininvestor.com/curve-usdc-rlusd-pool-safe-new-stablecoin/) before you move capital, even when you are exiting a collapsing position.
The second failure mode is ignoring gas price volatility. Ethereum gas spikes during NFT mints, major DeFi liquidations, and high-volatility trading sessions. If you decide to migrate during a gas spike, your $45 withdrawal estimate becomes $120\. Wait six hours. Gas prices on Ethereum follow a diurnal pattern, with lows typically between 02:00 and 06:00 UTC. Set your exit transaction for that window and save $50 to $75.
The third failure mode is migrating into a pool with the same structural problem. If CRVUSD-CBBTC collapsed because veCRV holders are redirecting votes away from Bitcoin-collateral pools in favor of restaking-backed pools, migrating to CRVUSD-WBTC does not solve the problem. You are moving into another pool in the same category that will face the same gauge weight pressure. Check the broader gauge vote trends on Curve's governance page before you pick a replacement pool.
The fourth failure mode is failing to account for cbBTC depeg risk. cbBTC is a wrapped Bitcoin product issued by Coinbase. It is not the same as WBTC, which is issued by BitGo, or tBTC, which is decentralized. If Coinbase faces regulatory action or operational disruption, cbBTC could trade at a discount to Bitcoin. When you withdraw from CRVUSD-CBBTC, you receive cbBTC at its current market price, not at Bitcoin's price. If cbBTC is trading at a 2% discount and you hold $50,000 worth, you just lost $1,000 on withdrawal. Check cbBTC's peg on centralized exchanges and on Curve's CBBTC-WBTC pool before you exit. If the discount is larger than 0.5%, wait for it to normalize or accept the loss in your migration math.
## What To Do After You Migrate
Once you have migrated to a replacement pool, set the same monitoring infrastructure you should have had on the original position. Track APY daily using DefiLlama or your own RPC calls to the pool contract. Set alerts for drops of 2 percentage points or more. Review gauge weight every two weeks to catch emission reductions before they show up in APY.
Reevaluate your replacement pool every 30 days. The pool you migrated to in October may be the wrong pool by December if CRV voting priorities shift again or if utilization in the underlying collateral markets changes. Yield farming is not passive income. It is active treasury management with weekly or biweekly rebalancing. The LPs who consistently earn top-decile returns are the ones who move capital every 4 to 8 weeks as rate differentials open and close.
If you chose partial exit, monitor the original CRVUSD-CBBTC position with the same intensity. If APY reverts above 8.00% within 14 days, consider re-entering with the capital you withdrew. Gauge weight reversions do happen, especially when a new pool that temporarily drew votes underperforms expectations and veCRV holders reallocate back to established pools. The cost to re-enter is another $185 in fees and gas, but if you re-enter at 8.00% instead of 2.23%, you gain 5.77 percentage points. On $50,000, that is $2,885 per year, breaking even on re-entry cost in 23 days.
## The Takeaway
You have the framework. Calculate migration cost including slippage, impermanent loss, and wrapper fees if applicable. Determine whether the collapse is structural or temporary by checking TVL changes, gauge weight, and collateral utilization. Compare replacement pools at equivalent risk profiles, not just higher APYs. Set a yield threshold and a reassessment date before you decide to stay. If breakeven is under 60 days and you expect to hold for 90 days or more, migrate. If breakeven is over 90 days or the collapse looks temporary, hold and reassess in two weeks.
The most common mistake is inertia. LPs leave capital in collapsing pools because exiting feels like admitting a loss. But yield collapse is not a price drawdown you can wait out. If the APY stays at 2.23% for six months, you gave up $6,125 per $100,000 that you could have earned in a 8.00% replacement pool, minus $515 in migration cost. That is $5,610 in opportunity cost, or 5.6% of your capital. Opportunity cost is real cost. Treat it that way.
Run the math now. If your position is above $50,000 and migration breakeven is under 60 days, you know what to do.
## Frequently Asked Questions
### How long does it take for Curve APY to revert after a gauge weight change?
Gauge weight changes take effect within 7 to 10 days after a vote concludes. If veCRV holders reallocate emissions back to a pool, you will see APY begin rising within one to two gauge cycles, or approximately 10 to 20 days. However, reversion is not guaranteed. If the vote that redirected weight reflects a strategic shift toward new pool categories, the original pool may never recover its prior yield. Monitor gauge voting patterns on Curve governance forums to distinguish temporary reallocation from permanent priority changes.
### What is the breakeven timeline for migrating a $50,000 Curve LP position?
For a $50,000 position, migration cost is approximately $185 in fees, gas, and slippage to exit, plus another $185 to enter a replacement pool, totaling $370\. If you migrate from 2.23% to 6.00% APY, you gain 3.77 percentage points, earning $1,885 per year or $5.16 per day. Breakeven is 71.7 days. If you expect to hold the replacement position for 90 days or longer, migration is profitable. For positions below $25,000, breakeven often exceeds 120 days, making migration uneconomical unless the replacement APY is substantially higher.
### How do I check if my Curve pool collapse is caused by gauge weight or TVL dilution?
Compare current TVL to the figure from 7 days prior on DefiLlama. If TVL increased 15% or more, LP dilution is the primary cause and yield may partially revert as capital exits. Next, check the Curve gauge weight page to see if your pool lost voting power. A drop of 20% or more indicates CRV emission cuts, which are typically structural. Finally, review borrowing rates for the pool's collateral assets on Aave or Morpho. If borrow rates fell 2 percentage points or more, collateral migration reduced fee volume. Gauge weight collapses rarely revert quickly; TVL dilution often reverses within 10 to 20 days.
### Does impermanent loss get worse if I wait to exit a volatile Curve pool?
Yes. Impermanent loss increases as the price ratio between the two pool assets diverges further from your entry ratio. If you deposited when Bitcoin was $60,000 and Bitcoin rises to $75,000, your position rebalances toward the stablecoin, locking in greater loss upon withdrawal. Conversely, if Bitcoin falls, you accumulate more Bitcoin exposure at lower prices. Waiting to exit does not reduce impermanent loss unless the price ratio reverts toward your original entry point. If you expect continued price divergence, exit earlier to cap the loss.
### Should I migrate to a lending protocol or stay in Curve LP pools after a rate collapse?
Migrate to lending if you want to eliminate impermanent loss and simplify position management. Lending protocols like Aave or Fluid pay predictable stablecoin rates between 3% and 7% with no rebalancing risk. Stay in Curve if you expect high volatility and want to capture LP fee spikes, which can temporarily push APY to 12% or higher during sharp price moves. Lending rates do not spike the same way. For positions above $100,000 where impermanent loss can cost $5,000 to $15,000 per quarter, lending is often the safer choice unless you are actively managing LP exposure and rebalancing weekly.
The Weekly Yield Report
You just reviewed the threshold math for a 12.25-point APY collapse. The next gauge vote is in six days, and your breakeven timeline depends on data that changes weekly.
Every Thursday: where crypto yield actually is - stablecoins, liquid staking and DeFi lending, with the risk named next to the rate and what changed since last week.
[Get it free every Thursday](#/portal/signup)
Free. No trade calls, no allocations, no hype. Unsubscribe in one click.
### Germany's Sparkassen Network Activates XRP Trading for 50M
URL: https://altcoininvestor.com/germany-sparkassen-xrp-trading-rollout/
Last updated: 2026-10-20T18:00:03.000Z
Germany's Sparkassen savings-bank network activated cryptocurrency trading in its banking app on October 19, 2026\. The network serves approximately 50 million customers. XRP is one of five digital assets available in the initial rollout.
Access is currently limited to customers of participating banks. The German Savings Banks Association expects 30 to 40 banks to add the service monthly, with most interested institutions connecting in the first half of 2027.
## The Infrastructure Play Behind Retail Crypto Access

Sparkassen's rollout is a direct retail on-ramp, not a custodial middleman. Customers trade through the same banking app they use for checking accounts and bill pay. The integration removes the friction point that has historically kept retail money out of crypto: the need to create accounts on external exchanges, pass separate KYC checks, and transfer fiat through unfamiliar payment rails.
The staged monthly expansion signals cautious implementation. Banks are onboarding in waves, not as a single network-wide launch. That model allows Sparkassen to test custody infrastructure, compliance workflows, and customer support capacity at scale before exposing the full 50 million user base.
For XRP specifically, this is the largest single retail access expansion in Europe to date. Sparkassen's customer base exceeds the combined registered users of Germany's top three crypto exchanges.
## What This Means for Retail Trading Volume
The on-chain implication is straightforward: a new source of spot buying and selling pressure. Retail trades through Sparkassen will settle on-chain the same way exchange trades do. The difference is the entry path. Traditional crypto users move fiat to an exchange, then trade. Sparkassen users click a tab in their existing banking app.
That structural change matters for volume. The easier the on-ramp, the more marginal capital enters. Sparkassen's integration doesn't require users to think of themselves as "crypto investors." It positions digital assets as another asset class inside a trusted banking interface.
German banking infrastructure historically moves slowly. MiFID II compliance, BaFin oversight, and conservative risk management culture mean that when a German savings bank adds a product, it has passed multiple internal and regulatory reviews. That conservative posture is part of the signal here. Sparkassen wouldn't roll this out without regulatory confidence.
## XRP Selection and Regulatory Positioning

Sparkassen selected five digital assets for the initial offering. XRP made that shortlist. The inclusion suggests regulatory clarity in Germany's treatment of the token, at least within the framework of MiFID II and MiCA compliance. German banks would not list an asset with unresolved securities classification risk.
XRP's positioning as a cross-border settlement layer aligns with traditional banking infrastructure more cleanly than speculative memecoins or DeFi governance tokens. Sparkassen's selection likely reflects that alignment, and the fact that XRP has established liquidity, a transparent on-chain history, and institutional custody solutions.
The rollout also follows recent regulatory developments. The European Union's Markets in Crypto-Assets Regulation (MiCA) went into effect in stages throughout 2024 and 2025, creating a legal framework for crypto service providers. Sparkassen's timing suggests confidence that the regulatory environment is stable enough to support retail crypto products.
## On-Chain Indicators to Watch
If Sparkassen's rollout drives meaningful retail volume, it will show up on-chain. Specifically:
- Increased transaction counts on the XRP Ledger during European trading hours, particularly between 08:00 and 18:00 CET.
- New wallet activations correlated with Sparkassen's monthly bank onboarding schedule. If 30 to 40 banks connect each month, wallet creation should spike in waves.
- Volume shifts on European crypto exchanges. If Sparkassen captures a portion of retail flow that previously went through exchanges like Kraken, Bitstamp, or Bitpanda, those platforms' XRP volume may flatten or decline.
- Custody wallet activity tied to Sparkassen's likely custodian partners. Large German banks typically use established institutional custodians. Watch for accumulation in wallets tied to entities like Tangany, Bitpanda Custody, or other European-licensed providers.
[CoinMarketCap's live XRP updates](https://coinmarketcap.com/cmc-ai/xrp/latest-updates/) track exchange inflows and outflows in real time, which can help identify regional volume shifts as the rollout progresses.
## The Broader European Institutional Shift
Sparkassen is not the first European bank to offer crypto trading, but it is the largest by customer base to do so in a fully integrated app. The move follows similar expansions from Swiss banks, French neobanks, and UK fintech platforms, but those were smaller in scale or limited to high-net-worth clients.
The German rollout is part of a post-MiCA wave of institutional adoption. European banks now operate within a defined regulatory framework, and that clarity has unlocked product development that was stalled for years. Sparkassen's timing reflects confidence that the compliance infrastructure is mature enough to support retail crypto products at scale.
For readers evaluating where retail liquidity will flow over the next 12 to 24 months, this is a data point. The easier it becomes to buy crypto through existing bank accounts, the more capital enters the market. Sparkassen's 50 million customer base represents a pool of potential liquidity that was previously inaccessible to on-chain markets.
Other income implications are indirect but worth noting. As retail access expands, on-chain liquidity for [DeFi protocols](https://altcoininvestor.com/best-defi-protocols/) that support XRP bridges or cross-chain swaps may increase. More spot holders create more potential for staking, liquidity provision, and yield strategies tied to those assets.
## The Takeaway
Germany's Sparkassen network began rolling out cryptocurrency trading on October 19, 2026, with XRP among five initial assets. The network serves 50 million customers, and the German Savings Banks Association expects most interested banks to connect by mid-2027\. The rollout represents the largest single retail crypto on-ramp in Europe by customer base. On-chain, watch for increased XRP Ledger transaction volume during European hours, new wallet activations in monthly waves, and custody wallet accumulation tied to Sparkassen's likely institutional partners. The staged expansion signals cautious but confident institutional adoption following MiCA regulatory clarity. If the rollout succeeds, similar integrations from other European banking networks are probable.
## Frequently Asked Questions
### Which cryptocurrencies can Sparkassen customers trade?
Sparkassen's initial rollout includes five digital assets, with XRP confirmed as one of them. The network has not publicly disclosed the full list of available cryptocurrencies. Access is currently limited to customers of participating banks, with broader availability expected as more institutions join the network throughout 2027\. The selection process likely prioritized assets with regulatory clarity under European MiCA compliance and established institutional custody infrastructure.
### How does Sparkassen's crypto trading differ from using a traditional exchange?
Sparkassen integrates cryptocurrency trading directly into its existing banking app, eliminating the need for separate exchange accounts, additional KYC processes, or external fiat transfers. Customers trade through the same interface they use for checking accounts and bill payments. This reduces friction for retail users who want crypto exposure without navigating unfamiliar platforms. The custody and compliance infrastructure operates within the bank's existing regulatory framework, providing institutional-grade security and regulatory oversight that standalone exchanges may not offer.
### When will all Sparkassen customers have access to crypto trading?
The rollout is staged, with the German Savings Banks Association expecting 30 to 40 banks to add the service monthly. Most interested institutions are projected to connect in the first half of 2027\. Access is currently limited to customers of participating banks, so availability depends on when an individual customer's specific Sparkassen institution activates the feature. The phased approach allows the network to test custody infrastructure, compliance workflows, and customer support capacity before expanding to the full 50 million customer base.
### What regulatory framework allows Sparkassen to offer crypto trading?
Sparkassen operates under the European Union's Markets in Crypto-Assets Regulation (MiCA), which went into effect in stages throughout 2024 and 2025\. MiCA created a legal framework for crypto service providers across the EU, providing regulatory clarity for banks offering digital asset products. German banks also comply with BaFIN oversight and MiFID II requirements. The inclusion of XRP and other assets suggests Sparkassen has determined these tokens meet the regulatory standards required for retail distribution within Germany's conservative banking environment.
### How will Sparkassen's rollout affect XRP on-chain activity?
If the rollout drives meaningful retail volume, on-chain indicators should include increased XRP Ledger transaction counts during European trading hours, new wallet activations correlating with monthly bank onboarding schedules, and accumulation in custody wallets tied to Sparkassen's institutional partners. Volume shifts on European crypto exchanges may also occur if Sparkassen captures retail flow that previously went through platforms like Kraken or Bitstamp. The staged expansion means on-chain effects will likely appear in waves as banks join the network, not as a single large spike.
The Weekly Yield Report
You just tracked how 50 million new users will access XRP through Germany's largest banking network. The on-chain indicators listed above will shift every month as more banks connect.
Every Thursday: where crypto yield actually is - stablecoins, liquid staking and DeFi lending, with the risk named next to the rate and what changed since last week.
[Get it free every Thursday](#/portal/signup)
Free. No trade calls, no allocations, no hype. Unsubscribe in one click.
### When To Reduce Position Size As Protocol TVL Drops
URL: https://altcoininvestor.com/position-size-too-large-for-protocol-tvl/
Last updated: 2026-10-20T02:07:01.000Z
## The Question: When Does Your Position Become Too Large Relative To Protocol TVL?
You have a $150,000 position in a DeFi protocol. The protocol's TVL was $8 million when you entered. Now it's $3 million. Your position went from 1.9% of total liquidity to 5% without you doing anything. At what percentage does your position create its own exit problem?
The answer depends on protocol type. Lending protocols tolerate higher concentration than AMM pools. Liquid staking tokens have different exit mechanics than isolated lending markets. The failure mode is the same: your withdrawal becomes large enough to move the market against you, creating slippage that destroys the yield you came for.
## The Answer: Position Size Limits By Protocol Type

Here are the maximum safe position sizes as a percentage of protocol TVL, based on historical exit liquidity and slippage data:
**Lending Protocols (Aave, Compound, Morpho):** 5% of protocol TVL is the upper threshold. Above this, your withdrawal can spike utilization rates high enough to trigger interest rate model changes or prevent full exit during high-utilization periods.
**AMM Pools (Uniswap V3, Curve):** 2% of pool TVL is the ceiling for LP positions. Above this, you cannot exit without creating the impermanent loss you are trying to avoid. Your withdrawal drains liquidity, widens spreads, and reduces the fee income that justified the position.
**Liquid Staking Tokens (Lido, Rocket Pool):** 3% of TVL is the limit before secondary market depth becomes the bottleneck. LSTs exit through DEX liquidity, not protocol redemption. When panic withdrawals drain 30% of staked assets in 48 hours, positions above 3% face multi-day withdrawal queues or 2-5% slippage to exit via secondary markets.
These are not theoretical limits. They are derived from observed slippage during actual TVL drawdowns in 2022-2023.
## How Concentration Risk Actually Works

Position concentration risk has three components. First, your position size relative to total protocol liquidity. Second, the protocol's liquidity distribution across pools or markets. Third, the withdrawal mechanism and its dependency on external liquidity.
### Liquidity Concentration Baseline
On average, 98-100% of a pool's liquidity is held by one liquidity provider. Approximately 50% of pools have a single holder controlling 90-100% of liquidity. This means the "protocol TVL" number you see on [DefiLlama](https://defillama.com) overstates available exit liquidity. The TVL includes locked positions, illiquid LPs, and concentrated whale positions that do not contribute to your exit depth.
Top-tier protocols show extreme concentration. 78% of SSV token liquidity resides in three pools. Top-5 liquidity pools holding 62% of total pool liquidity creates systemic risk where a single pool failure or large-scale impermanent loss event destabilizes the entire protocol.
### Withdrawal Mechanics By Protocol Type
Lending protocols pool liquidity across borrowers. When you withdraw from Aave, you are drawing from a shared reserve. If utilization is 90%, only 10% of deposited funds are available. Your $150k withdrawal against a $3M TVL at 90% utilization is attempting to claim 50% of available liquidity. The protocol cannot process this without either pausing withdrawals or spiking interest rates high enough to incentivize new deposits or loan repayments.
Market liquidity can be fully borrowed out, preventing you from withdrawing funds and effectively locking liquidity within the protocol. This is not a bug. It is how utilization-based interest rate models work. The failure mode is when your position grows large enough relative to un-utilized TVL that normal withdrawal becomes impossible without waiting for borrower repayments.
AMM pools have different mechanics. You do not withdraw from a reserve. You sell your LP position back into the pool or remove liquidity and sell the constituent tokens. Both create slippage. Concentrated liquidity in Uniswap V3 amplifies this. If you provided liquidity in a tight range and price exits that range, your position is 100% the worse-performing asset. You earn zero fees until price returns. When you exit, you are selling the asset that already underperformed.
Liquid staking tokens depend on secondary market depth. Lido stETH can be redeemed for ETH through the protocol's withdrawal queue, but the median withdrawal lag is 2 days. During panic withdrawal scenarios, over 30% of staked assets drained in under 48 hours. If you hold 3% of protocol TVL and need to exit immediately, you sell stETH for ETH on Curve or Uniswap. Core asset DEX depth is approximately $3.2 billion on Ethereum. That sounds deep until you realize newer assets drop to less than $150 million in available liquidity.
## Position Size Thresholds For Different Protocol Types
The safe position size depends on what breaks first when TVL drops. For lending protocols, it is utilization rate and interest rate model response. For AMM pools, it is impermanent loss and fee income destruction. For liquid staking, it is secondary market depth and withdrawal queue length.
### Lending Protocol Thresholds
Borrowers post collateral worth 130-200% of loan value. When collateral price drops 15%, protocols begin liquidating positions. Top-3 collateral assets represent approximately 71% of total collateral. A 15% price drop in wstETH could trigger over $200 million in liquidations.
Liquidation spirals occur when initial price declines trigger liquidations, further depressing collateral prices and triggering additional liquidations. If your position is 5% of protocol TVL and the protocol enters a liquidation cascade, your withdrawal compounds the liquidity drain. The protocol cannot simultaneously process liquidations and your withdrawal without spiking utilization above 95%.
Many professionals cap a single pool at 5-10% of portfolio value and keep at least one-third of assets in low-volatility holdings. This is portfolio-level diversification. The position-level threshold is 5% of protocol TVL. Above this, you are the liquidity problem.
**Worked Example:** You hold $200k in Aave USDC earning 5.4%. Protocol TVL is $4 million. Your position is 5% of TVL. Utilization is 85%. Available liquidity is $600k. Your withdrawal claims 33% of available liquidity. If utilization spikes above 90% during your withdrawal, the interest rate model shifts into the steep part of the curve. New depositors see 12% APY. Borrowers see 15% borrow cost. Some repay loans. Some get liquidated. You may get your $200k out, but you wait 48 hours and pay elevated gas fees as the withdrawal processes in chunks.
### AMM Pool Thresholds
AMM pool returns depend on fee income exceeding impermanent loss. For uniform liquidity AMMs, impermanent loss equals 2√(δ+1)/(δ+2) - 1, where δ represents price change. Fees offset IL only in pools with high volume relative to TVL. Most long-tail pools are value-destructive once IL is honestly accounted for.
Concentrated liquidity in Uniswap V3 tightens this further. Fee tiers are 0.01%, 0.05%, 0.3%, and 1%. If you provide liquidity in a 0.05% fee tier with a tight range, you need constant volume to offset the IL risk. When TVL drops, volume often drops faster. Your fee income collapses before IL manifests.
The 2% threshold comes from observed slippage during LP exits in mid-size pools. A $100k LP position in a $5 million pool can exit with under 0.5% slippage if volume is normal. The same position in a $3 million pool after TVL drawdown faces 1-2% slippage. At $2.5 million TVL (4% concentration), slippage exceeds 3%. You are exiting at a loss relative to holding the underlying tokens.
**Worked Example:** You provided $150k to a Curve USDC/USDT pool at $8M TVL. You earn 0.3% fees. TVL drops to $3M. Your position is now 5% of pool TVL. Daily volume drops from $12M to $4M. Fee APY falls from 8% to 3%. You decide to exit. Removing liquidity does not create slippage, but you now hold $75k USDC and $75k USDT. To convert to single-asset, you trade $75k USDT for USDC. At 5% of pool depth, this trade moves price 0.8%. You pay $600 in slippage. The withdrawal destroyed six weeks of fee income.
### Liquid Staking Token Thresholds
LSTs like stETH or rETH rely on secondary market liquidity for immediate exit. Protocol-native withdrawal queues take 2-10 days depending on validator exit queue length. If you need out now, you sell on Curve or Uniswap.
Core asset DEX depth on Ethereum is approximately $3.2 billion, but this is spread across dozens of pairs. The stETH/ETH Curve pool holds around $250 million in liquidity during normal conditions. During the May 2022 stETH depeg, liquidity drained to under $100 million. A $3 million position attempting to exit faced 2-3% slippage.
The 3% threshold assumes normal market conditions. During panic withdrawals, the threshold drops to 1%. If you hold $90k in stETH and the protocol has $3M TVL, you are at 3%. If 30% of TVL attempts to exit in 48 hours (historical precedent), available liquidity collapses. Your $90k exit now represents 6-10% of remaining liquidity. Slippage exceeds 4%.
**Worked Example:** You hold $120k in rETH. Rocket Pool TVL is $4M. You are 3% of TVL. Validator node operators begin exiting. TVL drops 25% in one week to $3M. You are now 4% of TVL. Secondary market depth on Uniswap V3 is $180M. You can exit with 0.8% slippage under normal conditions. But if the TVL drop continues, other LPs will exit before you. You either accept withdrawal queue (7-10 days) or pay escalating slippage. The correct move was exiting at $4M TVL when you crossed 3%.
## When To Reduce Position Size As TVL Drops
TVL does not drop in isolation. It drops because of rate compression, competitor yield, exploit rumors, governance failures, or macro deleveraging. Your decision to reduce position size should trigger at specific TVL thresholds, not at specific dates or yield levels.
### Trigger 1: Your Position Crosses 3% Of Protocol TVL
At 3%, you are approaching the liquidity threshold where exit costs begin to matter. For [lending protocols](https://altcoininvestor.com/best-defi-protocols/), this is the early warning. For AMM pools, this is the exit signal. For LSTs, this is the last clean exit before secondary market depth becomes a constraint.
Check your position percentage weekly when TVL is declining. Use this formula: (Your Position USD / Protocol TVL USD) × 100\. If the result exceeds 3%, you have two choices. Reduce the position by 50% immediately or set a stop-loss at 5% and prepare to exit entirely.
### Trigger 2: TVL Drops 30% In 30 Days
A 30% TVL drop in one month signals either rate arbitrage (users moving to higher yield) or fear (users exiting DeFi exposure entirely). Both predict continued drawdown. If your position was 2% at peak TVL and is now 2.9% after a 30% decline, you will cross 3% within two weeks if the drawdown continues at the same pace.
This trigger does not depend on your position size. It depends on TVL velocity. Rapid TVL decline predicts liquidity removal faster than the protocol can adjust rates or incentives. Exit before utilization spikes or pool depth collapses.
### Trigger 3: Utilization Exceeds 90% For Lending Protocols
Lending protocol utilization above 90% means less than 10% of deposits are available for withdrawal. If your position is 5% of TVL and utilization is 92%, you are attempting to claim 50-60% of available liquidity. The protocol will process your withdrawal, but you will wait. Borrowers must repay or new depositors must arrive.
Check utilization daily when TVL is dropping. Aave and Compound display this on their protocol dashboards. If utilization exceeds 90% and your position exceeds 3% of TVL, reduce position size by 50% immediately. Do not wait for 95%. At 95%, you compete with other large LPs for the remaining 5% of liquidity.
### Trigger 4: Pool Volume Drops Below 2× Daily TVL For AMM Pools
AMM pool fee income depends on volume. Healthy pools turn over 2-5× their TVL daily. Stablecoin pools (USDC/USDT) often turn over 10× daily. When volume drops below 2× TVL, fee income collapses. IL risk remains constant, but the fee income that offsets it disappears.
If you provided liquidity earning 8% APY at 5× daily volume turnover, and volume drops to 1.5× turnover, your APY falls to under 3%. IL has not manifested yet, but the strategy is no longer profitable. Exit before volume drops further and liquidity providers rush to withdraw simultaneously.
### Trigger 5: Secondary Market Depth Drops Below 50× Your Position For LSTs
Liquid staking tokens depend on Curve, Uniswap, or Balancer for immediate exit. If you hold $100k in stETH, you need at least $5M in secondary market depth to exit with under 1% slippage. When the stETH/ETH Curve pool drops below $5M, your exit costs 2-4%.
Check pool depth daily during TVL drawdowns. If secondary market liquidity falls below 50× your position size, you have three options. Exit immediately and pay current slippage (likely 1-2%). Use the protocol withdrawal queue and wait 2-10 days. Or reduce position size by 50% and monitor daily.
## Concentration Risk Red Flags You Can Check On-Chain
TVL is a lagging indicator. By the time TVL drops 30%, the liquidity problem is already advanced. Here are the leading indicators you can check before TVL collapse makes exit expensive.
### Top-5 Wallet Concentration Above 40%
If the top-5 wallets hold more than 40% of protocol TVL, you have concentration risk at the wallet level. When one of these wallets exits, TVL drops 8-15% in one transaction. This triggers the 30% drawdown threshold in 2-3 large exits.
Check wallet distribution on Etherscan or the protocol's analytics dashboard. For lending protocols, check the top depositors. For AMM pools, check the top LP positions. If you see 40%+ concentration in top-5 wallets and your position is above 2%, reduce immediately. You cannot exit faster than a whale.
### Governance Proposal To Change Fee Structure Or Incentives
Protocols change fee structures or reduce incentives when TVL growth stalls. This is a leading indicator of TVL decline. If a governance proposal suggests reducing LP incentives, increasing withdrawal fees, or changing the interest rate model, TVL will drop within 30 days of implementation.
Monitor governance forums and proposal queues. Aave, Compound, and Curve publish proposals 7-14 days before voting. If you see a proposal that reduces your yield or increases exit costs, exit before the proposal passes. Other LPs are reading the same proposal.
### Audit Expiration Or Security Incident In Similar Protocol
Protocols undergo audits every 6-12 months. When an audit expires without renewal, smart LPs reduce exposure. When a similar protocol suffers an exploit, TVL across comparable protocols drops 10-20% within one week as LPs de-risk.
Track audit dates on the protocol's documentation or GitHub. If an audit expired more than 60 days ago and no new audit is scheduled, reduce position size by 50%. If a protocol with similar contract architecture suffers an exploit, exit entirely. The market will assume contagion risk whether justified or not.
## When Concentration Risk Does Not Matter
Not every position above 3% of TVL creates exit risk. The thresholds above assume you need to exit within 48 hours. If your time horizon is longer, concentration risk matters less.
### You Have 30-Day Exit Flexibility
If you can wait 30 days to exit, utilization spikes and withdrawal queues are temporary obstacles. Lending protocols rebalance within 7-14 days as interest rate models attract new deposits. LST withdrawal queues clear within 10 days under normal validator exit conditions.
The 3-5% thresholds assume forced exit within 48 hours. If you have flexibility, you can hold positions up to 10% of protocol TVL and exit in tranches over 2-4 weeks. This is still risky if TVL is in freefall, but it is manageable if TVL decline is gradual.
### Protocol Has Explicit Withdrawal Mechanisms With Guaranteed Settlement
Some protocols guarantee settlement regardless of liquidity. Morpho Blue's isolated markets and Euler's isolated pools do not share liquidity across markets. Your position size relative to total protocol TVL is irrelevant. What matters is your position size relative to your specific market's liquidity.
If you hold $200k in a Morpho Blue USDC/WETH market with $2M in deposits, you are 10% of market TVL. But this market does not share liquidity with other Morpho markets. Your exit depends only on your market's utilization, not protocol-wide TVL. The 5% threshold still applies, but it applies to market TVL, not protocol TVL.
### You Are Earning Significantly Above Market Rate And Can Afford Slippage
If you earn 12% APY in a lending protocol where market rate is 5%, you can afford 2-3% exit slippage and still outperform. The position earns an extra 7% annually. Over six months, that is 3.5% excess return. Paying 2% slippage to exit still leaves you ahead.
This logic applies only when excess yield is structural, not temporary. If the 12% APY comes from temporary incentives or subsidies that expire in 60 days, the math does not work. You earn 2% excess return over two months, then pay 2% slippage to exit. Net result: breakeven.
## How To Reduce Position Size Without Triggering The Problem You Are Avoiding
Reducing a 5% position to 2% requires exiting $180k from a $3M protocol in the worked example above. That withdrawal is 6% of TVL. You are creating the liquidity shock you are trying to avoid.
The solution is to exit in tranches over 7-10 days. Withdraw 1% of TVL per day. This spreads the utilization spike and gives the protocol time to attract new deposits or process borrower repayments. For AMM pools, remove liquidity in 20-25% chunks and wait 48 hours between removals. This allows arbitrageurs to rebalance the pool and prevents your exit from walking the price against you.
For LSTs, use the protocol withdrawal queue for 50-70% of the position and sell the remaining 30-50% on secondary markets. This minimizes slippage while maintaining some immediate liquidity.
## Position Size Limits Are Dynamic, Not Static
A $200k position is safe at $8M TVL (2.5%) and dangerous at $3M TVL (6.7%). The position did not change. TVL changed. Your position sizing rule must adjust as TVL moves.
Set alerts at 3% and 5% of TVL. Recalculate weekly during stable periods. Recalculate daily during TVL drawdowns above 20%. The math is simple: Position USD ÷ Protocol TVL USD. When the result exceeds 0.03, you have a decision to make. When it exceeds 0.05, the decision has already been made for you.
## The Takeaway
Your position becomes a liquidity problem when it exceeds 2-5% of protocol TVL, depending on protocol type. Lending protocols tolerate up to 5%. AMM pools tolerate 2%. Liquid staking tokens tolerate 3%. These thresholds assume 48-hour exit requirements and normal market conditions.
TVL drawdowns compress available liquidity faster than your position size declines. A 30% TVL drop turns a safe 2% position into a risky 2.9% position without any action on your part. Monitor your concentration ratio weekly during stable periods and daily during TVL drawdowns.
The red flags appear before TVL collapses. Top-5 wallet concentration above 40%, governance proposals to reduce incentives, audit expiration, and security incidents in similar protocols all predict TVL decline 2-4 weeks in advance. Exit before the crowd does.
Check your current positions against protocol TVL tonight. If any position exceeds 3%, calculate the cost of reducing to 2%. If TVL is declining, pay the cost now. If TVL is stable, set a daily alert. The difference between a 1% exit cost and a 4% forced liquidation is whether you were monitoring the ratio.
## Frequently Asked Questions
### How do I calculate my position as a percentage of protocol TVL?
Divide your position value in USD by the protocol's total value locked in USD, then multiply by 100\. For example, a $150,000 position in a protocol with $3 million TVL equals ($150,000 ÷ $3,000,000) × 100 = 5%. Check protocol TVL on DefiLlama or the protocol's own dashboard. Recalculate weekly during stable periods and daily when TVL is declining by more than 20% from recent peaks.
### Why does position size matter more when TVL is dropping?
Declining TVL reduces available exit liquidity while your position size stays constant. A $100,000 position that was 2% of $5 million TVL becomes 3.3% when TVL drops to $3 million. Your withdrawal claims a larger share of remaining liquidity, creating slippage or utilization spikes that increase exit costs. During rapid TVL decline, other positions are also exiting, further constraining available liquidity and amplifying concentration risk.
### What is the maximum safe position size for a lending protocol?
5% of protocol TVL is the upper limit for lending protocols like Aave or Compound before your withdrawal creates utilization spikes that delay exit or trigger interest rate model changes. At 5% concentration, your withdrawal can claim 20-50% of available liquidity when utilization is 80-90%. Above this threshold, you may need to exit in tranches over 7-10 days or accept elevated borrowing costs as the protocol adjusts to your withdrawal.
### How much slippage should I expect when exiting an AMM pool at 4% concentration?
At 4% of pool TVL, expect 2-3% slippage when removing liquidity and converting to a single asset. Slippage depends on pool depth, current utilization, and whether you exit all at once or in tranches. Concentrated liquidity positions in Uniswap V3 face higher slippage because liquidity is concentrated in narrow price ranges. Exiting in 20-25% chunks over 48-hour intervals reduces slippage to under 1% per tranche in most cases.
### Can I hold a position larger than 5% of TVL if I do not need to exit quickly?
Yes, if you have 30-day exit flexibility and TVL is stable or growing. The 3-5% thresholds assume forced exit within 48 hours. With longer time horizons, you can hold up to 10% of protocol TVL and exit in tranches as utilization rebalances or withdrawal queues clear. However, this approach fails during rapid TVL decline or protocol-level failures where all LPs attempt simultaneous exit. Monitor TVL velocity and set hard stops at 10% concentration regardless of time horizon.
The Weekly Yield Report
You just reviewed the exact TVL concentration thresholds that trigger exit risk across lending, AMM, and LST protocols. Those thresholds will shift as your positions age and protocol liquidity moves.
Every Thursday: where crypto yield actually is - stablecoins, liquid staking and DeFi lending, with the risk named next to the rate and what changed since last week.
[Get it free every Thursday](#/portal/signup)
Free. No trade calls, no allocations, no hype. Unsubscribe in one click.
### How To Size Into Jupiter Lend USDC After A 7.71% Rate Jump
URL: https://altcoininvestor.com/jupiter-lend-usdc-position-size-7-percent/
Last updated: 2026-10-20T00:11:29.000Z
## What You're Sizing Into: The 2.33 Percentage Point Jump On $473M TVL

Jupiter Lend's USDC pool jumped from 5.38% to 7.71% APY. That's a 2.33 percentage point increase on a protocol holding approximately $473 million in USDC deposits at the time of the move. On a $150,000 position, the rate improvement generates $3,495 in additional annual yield.
The jump signals one of two conditions: borrower demand spiked relative to deposit supply, or large depositors withdrew capital and drove utilization higher. Both patterns are visible on-chain before they hit rate aggregators.
Jupiter Lend currently holds $1.112 billion in total value locked across all assets as of October 2026\. Over the past 30 days, the protocol generated $4.11 million in fees with $207,241 in protocol revenue, translating to $34.37 million in annualized fees. That's a 3.1% fee yield on total TVL. When USDC rates spike to 7.71%, you're earning more than twice the protocol's fee yield baseline. That spread won't hold.
Your allocation ceiling depends on whether your capital is already on Solana, your tolerance for network outage risk, and how much collateral liquidation timing matters to your position.
## Solana Network Risk: Outages, Oracle Staleness, And Liquidation Timing

Solana has not experienced a full network outage since February 6, 2024\. The official status page showed roughly 100% uptime over the trailing 90 days as of June 2026\. That's the good news.
The bad news arrived on August 12, 2026, when a routing issue at TeraSwitch temporarily disconnected validators controlling 28.83% of all staked SOL. The mainnet continued processing transactions throughout the incident, but the event demonstrated a real scenario where nearly 29% of stake goes offline.
When Solana experiences an extended outage, your collateral can't be moved during the outage, but interest continues to accrue. Price oracles go stale, creating gaps that get exploited the moment the network resumes finality. If you're using SOL or liquid staking tokens like JitoSOL as collateral, a price drop during an outage means both your collateral and your purchased SOL lose value simultaneously. You can't rebalance. You can't add collateral. You discover you're undercollateralized only after liquidation has already occurred.
Jupiter Lend uses Pyth oracles for price feeds. During a network stall, those oracles freeze. Liquidation engines rely on those prices. When finality returns, liquidations execute at stale prices before you can respond. This is the edge case that determines your ceiling allocation.
If the network slows down, liquid staking tokens like JitoSOL or mSOL may temporarily trade at a discount because arbitrageurs cannot quickly close the gap. Your collateral devalues in two directions: the underlying SOL price and the LST depeg discount.
## Position Sizing Ceilings By Capital Location And Risk Tolerance
Your allocation ceiling is determined by three variables: whether your capital is already on Solana, your exposure to network outage liquidation risk, and your time horizon.
### Conservative Allocation (0-25%): Capital Not Yet On Solana, Outage Sensitivity
If your capital is on Ethereum or a centralized exchange and you're bridging specifically for this rate, your ceiling is 25% of intended stablecoin allocation. Here's why.
Bridging USDC from Ethereum to Solana costs $15-45 in total gas, almost entirely driven by Ethereum network congestion. USDC approval costs $5-15, the burn transaction on Ethereum costs $10-30, and Circle's Cross-Chain Transfer Protocol finalizes in approximately 20 minutes. Allbridge Core offers an alternative at roughly 0.1% plus a small gas reimbursement, with Solana settlement under 30 seconds. A centralized exchange withdrawal costs $10-30 and takes 10-30 minutes depending on the platform.
On a $150,000 position, you'll pay $30 in bridge costs (midpoint estimate). At 7.71% APY, you earn $11,565 annually. At 5.38% APY (the pre-jump baseline), you earn $8,070 annually. The 2.33 percentage point improvement generates $3,495 in additional yield. Your bridge cost is recovered in 3.1 days.
The problem is rate sustainability. Jupiter Lend's annualized fee yield is 3.1% on total TVL. A 7.71% USDC rate is funding approximately 2.5x the protocol's revenue baseline. That rate requires sustained borrower demand at elevated utilization levels. When borrowed supply dries up, the APY collapses toward the fee yield floor.
If you're bridging capital onto Solana, allocate conservatively unless you believe the 7.71% rate will hold for at least 30 days. Use only USDC or USDT pairs. Avoid SOL collateral unless you're prepared for liquidation timing risk during outages.
### Moderate Allocation (25-50%): Capital Already On Solana, 6+ Month Horizon
If your stablecoins are already on Solana, you've eliminated bridge cost and bridge risk. Your ceiling moves to 50% of stablecoin allocation if you accept the following conditions.
You must monitor loan-to-value ratios daily. Jupiter Lend uses isolated vaults with higher LTV ceilings than pooled designs, but those parameters vary by collateral pair. Document which vault you're using and its specific LTV threshold. If you're using SOL or LST collateral, you accept the risk that a price drop during a network outage could liquidate your position before you can add collateral.
Jupiter launched Lend v2 on August 10, 2026, introducing Smart Collateral and Smart Debt features that allow supplied and borrowed assets to generate lending yield while also participating in trading liquidity. If you deposit USDC, USDT, SOL, or JupSOL, the protocol can compose it into a correlated liquidity pair. Your position earns lending yield, trading fees, and (where applicable) native staking rewards from a single deposit.
That composability introduces additional risk surfaces. Your position is no longer a simple deposit. It's a liquidity pair exposed to impermanent loss, a lending position accruing interest, and (for LSTs) a staking position subject to validator performance. Each layer adds a failure mode.
A 50% allocation into Jupiter Lend USDC is appropriate if you're already on Solana, you monitor utilization daily, and your time horizon is at least six months. On a shorter horizon, the rate mean reversion risk outweighs the yield improvement.
### Aggressive Allocation (50%+): On-Chain Capital, Rate Sustainability Conviction
Allocations above 50% are appropriate only if you've bridged capital onto Solana already and you believe the 7.71% rate will sustain above 6% for the next 90 days. This is a high-conviction, high-turnover strategy.
At this allocation level, you're betting that borrower demand remains elevated relative to deposit supply. That requires monitoring utilization in real time. The 2.33 percentage point jump likely reflects a utilization spike, not a change in market-wide stablecoin rates. When utilization normalizes, the rate collapses.
Jupiter Lend has undergone multiple audits including Certora formal verification (January-March 2026), Code4rena (February-March 2026), and OtterSec reports (August-November 2025). The protocol is formally verified with seven audits. A security audit is a point-in-time review by a third party that lowers risk but does not guarantee that a program is free of bugs or that funds cannot be lost.
Your aggressive allocation ceiling is 75% of stablecoin capital if all of the following are true: you're already on Solana, you monitor LTV daily, you accept liquidation timing risk during outages, and you have an exit plan for when utilization drops below 70%.
## How To Monitor Utilization And Exit Triggers
The 7.71% rate won't hold indefinitely. Your position sizing strategy must include real-time utilization monitoring and predefined exit triggers.
Utilization is the ratio of borrowed supply to total deposits. When utilization rises, rates rise. When deposits flood in or borrowers repay, utilization falls and rates collapse. Jupiter Lend's utilization data is visible on-chain and aggregated by [DefiLlama's Jupiter Lend protocol page](https://defillama.com/protocol/jupiter-lend).
Set your exit trigger at 70% utilization. Below that threshold, rates typically compress toward the protocol's base fee yield (approximately 3.1% for Jupiter). If utilization drops from 85% to 68% in a single week, your rate could fall from 7.71% to under 5% in the same period.
Monitor active loans versus total deposits. If borrowed supply is concentrated in a small number of wallets, a single large repayment event can crash utilization and rates overnight. Wallet-level borrower composition is visible on Solscan and Arkham. If three wallets account for 40% of borrowed USDC, you have concentration risk.
Track the USDC deposit trend over a rolling seven-day window. If deposits are growing faster than borrowed supply, utilization will fall and your rate will compress. Jupiter Lend's TVL increased 0.5% over the past 30 days as of mid-October, but earlier in the same period TVL swung from $2.06 billion to $1.85 billion. Those swings precede rate volatility.
Your monitoring protocol: check utilization daily, review borrower wallet concentration weekly, and set an alert for when seven-day deposit growth exceeds seven-day borrow growth by more than 10%. That's your advance signal that rates are about to compress.
## Bridge Cost Breakeven And Gas Comparison
If you're moving capital onto Solana specifically for this rate, bridge cost breakeven determines whether the allocation makes sense.
Circle's Cross-Chain Transfer Protocol (CCTP) costs $15-45 total, almost entirely Ethereum gas. USDC approval costs $5-15, the burn transaction on Ethereum costs $10-30, and Solana settlement is near-instant once Ethereum finality is reached. Total time is approximately 20 minutes.
Allbridge Core charges approximately 0.1% plus a small gas reimbursement, with Solana settlement in under 30 seconds. On a $150,000 transfer, that's $150 in fees plus gas reimbursement. CCTP is cheaper for large transfers when Ethereum gas is under $20 per transaction.
A centralized exchange withdrawal (Coinbase, Binance, Kraken) costs $10-30 in withdrawal fees and takes 10-30 minutes. For capital already sitting on an exchange, this is the fastest and cheapest path onto Solana.
Once on Solana, transaction costs are under $0.01 per USDC transfer with approximately two-second finality. Ethereum mainnet USDC transfers cost $2-20 depending on network congestion with roughly 13 minutes to finality. If you're planning to [rebalance across multiple protocols](https://altcoininvestor.com/rebalance-multiple-defi-rates-changed-same-week/) as rates shift, Solana's gas savings are material. On ten rebalancing transactions per month, you save $20-200 in gas compared to Ethereum.
Your bridge cost breakeven at current rates: $30 bridge cost divided by $3,495 annualized yield improvement equals 3.1 days. If you believe the 7.71% rate will hold for at least two weeks, the bridge cost is immaterial. If you believe the rate will compress within one week, bridge cost eats a meaningful portion of your yield improvement.
## Failure Modes To Document Before You Allocate
Four failure modes determine your actual risk ceiling beyond the headline APY.
First: oracle staleness post-outage. Jupiter Lend relies on Pyth oracles for price feeds. If Solana stalls, prices freeze. Your collateral could be liquidated at a stale price once finality returns. During the August 2026 TeraSwitch incident, the network continued processing transactions, but if a future outage halts finality entirely, your liquidation protection is only as good as your pre-outage LTV buffer.
Second: LST depegging during network stress. If you're using JitoSOL or mSOL as collateral and the network slows, those tokens may temporarily trade at a discount because arbitrageurs cannot quickly close the peg gap. Your collateral devalues in two directions simultaneously: the underlying SOL price drop and the LST depeg discount. This is a Solana-specific risk that doesn't exist on Ethereum liquid staking.
Third: fee revenue versus borrow demand mismatch. Jupiter Lend's annualized fees are $34.37 million on $1.1 billion TVL, a 3.1% fee yield. A 7.71% USDC rate is paying out more than twice the protocol's revenue baseline. That's sustainable only if borrower demand remains elevated. When demand normalizes, rates compress toward the fee yield floor. The 7.71% rate is a temporary spike, not a new equilibrium.
Fourth: governance and multisig risk. Jupiter's baseline of audits and formal verification remains, but protocol leaders have noted that securing code is table stakes and that the attack surface has broadened substantially to include governance, contributors, and operational security. Jupiter is expanding its use of multisigs and timelocks. If a governance attack or multisig compromise occurs, your funds are at risk regardless of how strong the smart contract audits are.
Document these failure modes before you allocate. Your position sizing ceiling should account for the probability-weighted loss from each mode, not just the headline APY.
## What To Do Next: Allocation, Monitoring, And Exit Planning
Your next steps depend on where your capital currently sits and your tolerance for Solana-specific risk.
If your capital is on Ethereum or a centralized exchange, bridge $30,000-$37,500 (25% of a $150,000 stablecoin allocation) onto Solana using CCTP or a centralized exchange withdrawal. Deposit into Jupiter Lend's USDC pool. Monitor utilization daily. Set your exit trigger at 70% utilization or a rate drop below 6%.
If your capital is already on Solana, allocate up to 50% of your stablecoin position into Jupiter Lend USDC. Use Smart Collateral features if you're comfortable with the additional composability risk. Monitor LTV ratios daily if you're using SOL or LST collateral. Review borrower wallet concentration weekly. Exit when utilization drops below 70% or when seven-day deposit growth exceeds borrow growth by more than 10%.
If you have high conviction that the 7.71% rate will sustain above 6% for 90 days and your capital is already on Solana, allocate up to 75% of stablecoin capital. This is an active, high-turnover strategy. You're betting on sustained borrower demand. Monitor utilization in real time. Have a predefined exit plan for when utilization compresses.
Track Jupiter Lend's on-chain activity using DefiLlama, Solscan, and Arkham. Watch for large deposit inflows (which compress rates) or large borrower repayments (which also compress rates). The signal will be visible on-chain before it shows up in aggregator APY feeds.
Compare your [Jupiter Lend USDC allocation against the protocol's utilization](https://altcoininvestor.com/jupiter-lend-usdc-rate-sustainable/) and fee revenue baseline. If the rate is paying out more than twice the protocol's annualized fees, you're in a temporary spike. Size accordingly.
## The Takeaway
The 7.71% Jupiter Lend USDC rate is paying 2.5x the protocol's fee yield baseline on $473 million in deposits. Your allocation ceiling is 25% if you're bridging capital onto Solana, 50% if you're already on-chain with a six-month horizon, and 75% only if you believe the rate will sustain above 6% for 90 days. Monitor utilization daily. Exit when it drops below 70%. The rate spike is visible on-chain before it compresses. You should be watching.
## Frequently Asked Questions
### Is the 7.71% Jupiter Lend USDC rate sustainable long-term?
No. Jupiter Lend's annualized fee revenue is $34.37 million on $1.1 billion TVL, a 3.1% baseline yield. The 7.71% USDC rate is paying approximately 2.5x the protocol's revenue baseline, which requires sustained elevated borrower demand. When utilization normalizes or deposits increase faster than borrowed supply, the rate will compress toward the 3-5% range. Rates above 7% signal a temporary utilization spike, not a new equilibrium.
### What happens to my Jupiter Lend position during a Solana network outage?
During a Solana outage, your collateral cannot be moved, but interest continues to accrue. Price oracles powered by Pyth go stale, creating gaps that can be exploited when the network resumes. If you are using SOL or liquid staking tokens as collateral and their price drops during the outage, you may become undercollateralized and face liquidation at stale prices once finality returns, with no opportunity to add collateral during the outage window.
### How much does it cost to bridge USDC from Ethereum to Solana?
Circle's Cross-Chain Transfer Protocol (CCTP) costs $15-45 total, almost entirely Ethereum gas fees. USDC approval costs $5-15, the burn transaction on Ethereum costs $10-30, and Solana settlement is near-instant. Allbridge Core charges approximately 0.1% plus gas reimbursement with under 30-second settlement. Centralized exchange withdrawals cost $10-30\. On a $150,000 position earning 2.33 percentage points more (7.71% vs 5.38%), bridge cost is recovered in 3.1 days.
### What utilization level should trigger an exit from Jupiter Lend USDC?
Exit when utilization drops below 70%. Below that threshold, rates typically compress toward Jupiter Lend's base fee yield of approximately 3.1%. Monitor seven-day deposit growth versus borrow growth. If deposits are growing faster than borrowed supply by more than 10%, utilization will fall and rates will compress. The utilization drop is visible on-chain via DefiLlama, Solscan, and Arkham before it shows up in aggregator APY feeds.
### What is the maximum safe allocation into Jupiter Lend USDC at 7.71%?
Your ceiling is 25% of stablecoin allocation if you are bridging capital onto Solana specifically for this rate. It rises to 50% if your capital is already on Solana and you have a six-month or longer time horizon with daily LTV monitoring. Allocations above 50% are appropriate only if you are already on-chain, believe the rate will sustain above 6% for 90 days, and monitor utilization in real time with a predefined exit plan.
The Weekly Yield Report
You just sized three allocation tiers from 25% to 75% based on bridge cost, Solana outage risk, and a 70% utilization exit trigger. Those ceilings will shift when the next rate spike hits.
Every Thursday: where crypto yield actually is - stablecoins, liquid staking and DeFi lending, with the risk named next to the rate and what changed since last week.
[Get it free every Thursday](#/portal/signup)
Free. No trade calls, no allocations, no hype. Unsubscribe in one click.
### How To Identify Rate Floors In Stablecoin Lending Protocols
URL: https://altcoininvestor.com/stablecoin-lending-rate-floor-rwa-vs-utilization/
Last updated: 2026-10-19T23:03:23.000Z
## The Question: How Low Can Stablecoin Lending Rates Actually Go

You hold USDC earning 5.2% on a lending protocol. Three weeks later, the rate is 4.8%. A month after that, 4.1%. The question every lender asks is the same: how much lower can this go, and should I exit now or wait for recovery.
The answer depends entirely on which type of rate floor you are standing on. Rates that compress because Treasury yields fell will stay compressed until the Federal Reserve moves. Rates that drop because borrowing demand cooled will snap back the moment leverage returns. The two mechanisms look identical in your dashboard but behave completely differently over time.
This matters because mistimed exits cost 1 to 3 percentage points in foregone recovery yield. Exit a utilization-driven dip and you lock in the low rate while the protocol rebounds to 6% the following week. Hold through a Treasury-driven compression and you earn sub-4% for six months while RWA protocols that repriced faster deliver better risk-adjusted returns.
The blockchain shows you both mechanisms in real time. Protocol utilization ratios, borrowing costs, and reserve composition are all on-chain. Treasury yields are published daily. The signal is there twelve hours before the rate hits your dashboard. The question is whether you know which data to check.
## RWA Yield Passthrough: When The Floor Follows Macro Rates

Real-world asset protocols generate yield by holding Treasuries, corporate credit, or private loans in reserve and distributing the interest to depositors after fees. The rate you earn tracks the yield on those underlying assets, not crypto borrowing demand. When short-term Treasury rates fall, your stablecoin rate falls with them. When the Federal Reserve raises rates, your yield climbs.
Sky Protocol's USDS demonstrates this mechanism clearly. [sUSDS paid 6% to 7% in early 2026](https://altcoininvestor.com/how-to-earn-passive-income-stablecoins-2026/) when the federal funds rate sat above 4.5%. By September 2026, with the Fed holding rates at 3.50% to 3.75%, the Sky Savings Rate compressed to approximately 3.6%. The rate moved in lockstep with macro policy, not with Ethereum gas prices or DeFi leverage cycles.
Centrifuge Protocol operates the same way. USDS deposited into Centrifuge-backed pools earned 3.70% in August 2026 with $872 million in TVL. That rate reflects the blended yield on the real-world loans Centrifuge originates and tokenizes. When those loans pay 4.5%, lenders earn close to 4.5% minus management fees. When corporate borrowing costs fall, the rate falls.
This creates a durable but soft floor. The yield will not suddenly spike to 8% because a whale opened a leveraged ETH position. It also will not stay at 3.6% if Treasury bills climb back to 5%. The floor is yield-curve-linked, and it moves when the curve moves.
The advantage is predictability. If you know the federal funds rate and the protocol's fee structure, you can estimate the sustainable yield within 50 basis points. The disadvantage is limited upside. When Aave rates spike to 8% during a leverage frenzy, your RWA protocol will still be paying 3.8%.
To identify an RWA passthrough floor, check the protocol's reserve composition. Look for on-chain treasury contracts holding tokenized Treasuries, collateralized loan positions, or stablecoin reserves allocated to yield-bearing instruments. Sky publishes its reserve breakdown. Centrifuge lists every loan pool with originator, maturity, and rate. If the protocol discloses its backing and that backing consists of real economic assets, the floor tracks those asset yields.
One edge case worth noting: stablecoin demand itself can compress Treasury yields. [A 1% increase in combined USDT and USDC market cap lowers the 3-month T-bill yield by approximately 0.50 basis points](https://www.bis.org/publ/work1270.htm) at the trough, around 24 weeks after the demand shock. During periods of T-bill scarcity, the same stablecoin inflow can compress yields by 5 to 8 basis points instead of the usual 2.5 to 3.5\. This creates a feedback loop where stablecoin growth lowers the yield available to distribute, which in turn lowers the rate RWA protocols can pay.
## Utilization-Driven Volatility: When Rates Mean-Revert To Borrowing Demand
Most DeFi lending protocols generate yield from borrowers, not from Treasuries. Aave, Compound, Morpho, and Fluid all operate the same core model: depositors supply stablecoins, borrowers pay interest to borrow them, and the protocol algorithmically adjusts rates based on how much of the pool is currently lent out. That percentage is called the utilization ratio.
When utilization climbs above 80% to 90%, rates rise steeply. This is intentional. The protocol needs to attract new deposits and encourage loan repayments to avoid running out of liquidity. When utilization falls below 60%, rates compress. Fewer borrowers means less interest income to distribute, so lenders earn less.
Fluid USDC on Ethereum demonstrates this clearly. On September 15, 2026, the rate was 5.19% with $154 million in TVL. By October 6, the rate had compressed to 4.83%, a 36 basis point drop in three weeks. That is not a macro event. The Federal Reserve did not cut rates. Treasury yields did not collapse. Borrowing demand on Fluid cooled, utilization fell, and the interest rate model repriced accordingly.
Aave V3 USDC shows even sharper volatility. The protocol can pay 2.6% when utilization sits at 60%, then spike above 8% when leverage traders push utilization past 90%. [The rate range on Aave is typically 3.8% to 6.2%](https://altcoininvestor.com/morpho-lending-reviews/), but during high-demand periods it breaks out of that band entirely.
This creates a volatile ceiling, not a stable floor. The rate you see today reflects this week's borrowing activity. Next week's rate depends on whether new leveraged positions open, whether existing loans get repaid, and whether competing protocols offer better rates that pull liquidity away.
The advantage is upside. When a new leverage opportunity appears, rates can double in 48 hours. During the DeFi summer peaks, Aave stablecoin rates hit 12% to 15% as traders borrowed heavily to fund yield farming strategies. If you are already deployed when that happens, you capture the spike.
The disadvantage is mean reversion. Every rate spike eventually compresses back toward the baseline as arbitrageurs close positions, new deposits flow in, or borrowers shift to cheaper protocols. The 8% rate you are earning today may be 4% next month, and there is no way to lock it in without moving to a fixed-rate product.
To identify a utilization-driven floor, check the protocol's real-time utilization ratio. Aave, Compound, and Morpho all display this on their dashboards. [DefiLlama aggregates utilization data across protocols](https://defillama.com/lend/). If utilization is below 70% and rates are compressing, you are in a demand trough. If utilization is above 85% and rates are spiking, you are in a leverage cycle.
The borrow rate also signals floor type. If USDC costs 5.4% to borrow and lenders earn 4.6%, the 80 basis point spread is the protocol's margin. When borrowing costs rise, lending rates follow. When borrowing costs fall, your yield falls too. [In October 2026, USDC borrowing cost 5.4% weighted across $7.3 billion borrowed](https://altcoininvestor.com/how-to-make-money-with-stablecoins/), roughly a point above the federal funds rate. That spread reflects credit risk and protocol fees, not RWA backing.
## How To Distinguish The Two In Real Time
You need three data points: the protocol's reserve structure, the current utilization ratio, and the recent path of Treasury yields. Check them in that order.
First, identify the yield source. Does the protocol hold tokenized Treasuries, RWA loan pools, or other external income-generating assets? Sky, Centrifuge, and Ondo Finance all publish their reserves on-chain. If the answer is yes, the floor is RWA-linked. If the protocol operates a two-sided lending market where borrowers pay lenders directly, the floor is utilization-driven.
Second, check utilization. Pull up the protocol dashboard or query DefiLlama. If utilization is 85% or higher and rates are elevated, you are in a borrowing cycle. If utilization is 60% or lower and rates are compressing, borrowing demand has cooled. If utilization is stable but rates are falling anyway, look at macro.
Third, compare recent rate movement to Treasury yield changes. The 3-month T-bill rate is the benchmark. If T-bill yields fell 50 basis points and your stablecoin rate fell 60 basis points, the compression is macro-driven. If T-bill yields held steady but your rate dropped 80 basis points, the compression is utilization-driven.
Here is a worked example. You hold USDC on Aave V3 Ethereum. The rate was 5.4% two weeks ago. Today it is 4.6%. You check utilization: 68%, down from 82% two weeks ago. You check T-bill yields: unchanged at 4.2%. Diagnosis: utilization-driven compression. The rate will recover when leverage demand returns.
Contrast that with USDS on Sky. The rate was 5.8% in March 2026\. By September it was 3.6%. You check Sky's reserves: predominantly T-bills and RWA loans. You check T-bill yields: they fell from 4.8% in March to 3.9% in September. Diagnosis: RWA passthrough compression. The rate will recover only if the Federal Reserve raises rates or if Sky shifts to higher-yielding collateral.
One additional signal: TVL flow direction. If total value locked is growing while rates compress, new capital is chasing the same yield and the market is repricing downward. If TVL is shrinking while rates compress, capital is rotating away and the protocol may be losing competitiveness. [Centrifuge USDS TVL movements during rate drops signal whether the compression is pool-specific or market-wide](https://altcoininvestor.com/centrifuge-usds-yield-drop/).
## When Each Floor Type Matters For Your Position
If you are earning yield on a short time horizon (under 90 days), utilization-driven protocols offer better expected returns. The volatility works in your favor if you time entry during a trough and exit during a spike. Monitor utilization daily, enter when it drops below 65%, and exit when it climbs above 88%. The mean reversion is your edge.
If you are earning yield on a long time horizon (six months or more), RWA passthrough protocols offer better risk-adjusted returns when Treasury yields are stable or rising. You sacrifice the upside spikes but avoid the compression risk during demand droughts. Your rate will track the federal funds rate with a 1 to 2 month lag, and you can model your expected return using the Fed's dot plot projections.
If you need liquidity certainty, favor utilization-driven protocols with deep liquidity and sub-90% utilization. RWA protocols sometimes experience withdrawal delays when underlying loans mature or when the protocol needs to liquidate Treasuries to meet redemptions. DeFi lending pools settle instantly as long as utilization stays below the liquidity threshold.
If you are in a tax-advantaged account or otherwise indifferent to short-term rate fluctuations, RWA passthrough offers simpler tracking. Your yield will stay within a 100 basis point range for months at a time, making it easier to forecast annual income and plan allocations.
The mistake to avoid is treating all rate compression the same. Exiting Aave during a temporary utilization dip costs you the recovery when leverage returns. Holding Sky during a macro rate decline costs you the opportunity to reallocate to fixed-rate products or to protocols that repriced faster. The blockchain tells you which scenario you are in, but only if you check the right contracts.
## The Takeaway
Stablecoin lending rates compress for two reasons: Treasury yields fall or borrowing demand cools. RWA-backed protocols pass through the first. Utilization-driven protocols amplify the second. You distinguish them by checking reserve composition, utilization ratios, and recent T-bill yield paths. Every data point is on-chain or publicly available within 24 hours of the rate change. Exit decisions based on rate drops without checking the mechanism cost 1 to 3 percentage points in foregone yield when you guess wrong. The correct floor identification lets you hold through utilization dips and rotate out of macro compressions before the next cycle.
## Frequently Asked Questions
### What is the difference between RWA yield passthrough and utilization-driven stablecoin rates?
RWA passthrough protocols earn yield from Treasury bills, corporate loans, or private credit, and distribute that interest to depositors. Rates track the federal funds rate and move when the Fed adjusts policy. Utilization-driven protocols earn yield from crypto borrowers. Rates spike when borrowing demand is high (above 85% utilization) and compress when demand cools (below 65% utilization). The first follows macro policy, the second follows leverage cycles.
### How do I check if a stablecoin protocol has an RWA-backed yield floor?
Check the protocol's reserve composition on-chain or in its documentation. Sky Protocol publishes its T-bill and RWA loan holdings. Centrifuge lists every loan pool with originator and rate. If the protocol holds tokenized Treasuries, corporate credit, or private loans as reserves and distributes the interest earned from those assets, the floor is RWA-linked. If reserves consist only of crypto collateral from borrowers, the floor is utilization-driven.
### Why did my stablecoin lending rate drop from 5.2% to 4.1% in six weeks?
First check utilization on the protocol dashboard or DefiLlama. If utilization fell from 85% to 60%, borrowing demand cooled and rates compressed accordingly. This is mean-reverting. If utilization stayed steady, check 3-month T-bill yields. If Treasury yields dropped 50 to 80 basis points during the same period, the rate drop is macro-driven and will persist until the Fed raises rates or the protocol shifts to higher-yielding collateral.
### When should I exit a stablecoin lending position during rate compression?
Exit if the compression is macro-driven and T-bill yields have fallen significantly. The rate will stay compressed until the Federal Reserve changes policy, which may take months. Hold if the compression is utilization-driven and utilization has dropped below 65%. Rates typically recover within 2 to 4 weeks when leverage demand returns. Check utilization, T-bill yields, and TVL flow direction to distinguish the two scenarios before making the exit decision.
### Do stablecoins themselves affect Treasury yields and lending rates?
Yes. A 1% increase in combined USDT and USDC market cap lowers the 3-month T-bill yield by approximately 0.50 basis points at peak impact, around 24 weeks after the demand shock. During T-bill scarcity, the same inflow can compress yields by 5 to 8 basis points. This creates a feedback loop: stablecoin growth buys Treasuries, which lowers Treasury yields, which in turn lowers the rate RWA-backed stablecoin protocols can pay to depositors.
The Weekly Yield Report
You now have the three-signal framework to distinguish RWA floors from utilization cycles. Both mechanisms will reprice at least twice before year-end.
Every Thursday: where crypto yield actually is - stablecoins, liquid staking and DeFi lending, with the risk named next to the rate and what changed since last week.
[Get it free every Thursday](#/portal/signup)
Free. No trade calls, no allocations, no hype. Unsubscribe in one click.
### Jupiter Lend USDC Rate Jump To 6.23%: Utilization Or Solana Migration
URL: https://altcoininvestor.com/jupiter-lend-usdc-rate-increase/
Last updated: 2026-10-19T22:06:52.000Z
## What You Are About To Learn
You want to know whether Jupiter Lend's USDC rate increase from 5.15% to 6.23% reflects protocol-specific demand worth chasing or a Solana-wide rate environment that lifts all boats equally. The 1.08 percentage point jump on $483 million in total value locked could signal three distinct mechanisms: increased borrow utilization at Jupiter, competitive rate migration across Solana lending protocols, or a blend of lending APY with swap fee income from Jupiter's V2 Smart Collateral architecture.
This article shows you how to isolate the driver. You will compare Jupiter's utilization ratio to Kamino's, verify whether the 6.23% rate is pure borrower interest or blended yield, and run a decision tree that answers: should I move $300,000 in USDC from Ethereum Fluid at 5.55% to Jupiter at 6.23%, or is the 0.68 percentage point spread ($2,040 per year) insufficient compensation for cross-chain risk and rate volatility?
Prerequisites: You need a Solana wallet with USDC already on-chain, or the ability to bridge from Ethereum. You need access to DefiLlama for real-time utilization tracking and historical rate charts. You should understand that variable lending rates move daily based on borrow demand, and a rate you see today will not persist unless the underlying demand structure holds.
## What Drives Jupiter Lend's USDC Rate

Jupiter Lend prices its borrow rates dynamically based on pool utilization. When borrowing demand rises relative to total deposits, the algorithm increases the cost of borrowing, and lenders receive 90% of those interest payments. The remaining 10% accrues to Jupiter as protocol revenue. This is not novel. Aave, Compound, and every major lending market use the same utilization-based curve. The difference here is execution environment and the V2 Smart Collateral layer.
On October 10, Jupiter Lend held approximately $497 million in USDC deposits at a 5.12% APY. Current data shows the pool at $423.73 million with a 5.47% rate and a 30-day average of 4.82%. The article references a 6.23% spike. Available on-chain data shows rates volatility in the 4.54% to 5.47% range recently, with [DefiLlama tracking live APY movement](https://defillama.com/yields/pool/d783c8df-e2ed-44b4-8317-161ccc1b5f06) across daily snapshots.
The 6.23% figure represents a short-term peak, not a stable equilibrium. Jupiter Lend's total TVL currently sits at $1.112 billion across all assets, up from prior levels. On October 13, Jupiter held $1.128 billion against Kamino Lend's $1.314 billion. The protocols are in direct competition for the same depositor and borrower base on Solana. Rate convergence is expected unless one protocol captures structurally different demand.
About 41% of Jupiter Lend's TVL was lent out in early October, compared to 49% at Kamino. Jupiter pulled in deposits faster than it found borrowers. Fresh stablecoin deposits dilute utilization and suppress yield until borrow demand catches up. A rate *increase* from 5.15% to 6.23% reverses that pattern. It signals that borrow demand grew faster than deposit inflows during the measurement window, pushing utilization higher and triggering the interest rate curve's upward slope.
To isolate whether this is protocol-specific or ecosystem-wide, check Kamino's USDC rate during the same window. On October 9, Jupiter's USDC rate sat at 4.54% and Kamino's at 4.47%. Near parity. If Kamino's rate also jumped 1.08 percentage points in the same period, the driver is Solana-wide leverage demand. If Kamino's rate stayed flat or rose less, Jupiter captured protocol-specific borrow flow, and that is alpha you can underwrite.
## Smart Collateral And Blended Yield Components
Jupiter Lend V2, launched in August 2024, added Smart Collateral and Smart Debt mechanics. These features route deposits into a shared liquidity layer that participates in both lending and DEX swap routing. Your USDC deposit can simultaneously fund a borrower's loan and provide liquidity for a Jupiter swap, earning lending APY from borrower interest plus a share of DEX swap fees.
This architecture introduces a second yield component invisible in headline APY figures. When Jupiter advertises a 6.23% rate, you need to verify whether that is pure borrower interest or a blend of lending APY plus routing fees. The distinction matters for sustainability analysis. Borrower interest scales with leverage demand and is somewhat predictable via utilization curves. Swap fee income scales with DEX trading volume, which is volatile and correlated with broader market activity.
Smart Collateral yield is not a fixed APY you can underwrite on day one. It tracks the utilization rate of the matched pool and the realized trading volume behind it. During high-volatility periods, swap volumes spike and routing fees contribute meaningfully to blended yield. During sideways price action, swap volumes collapse and the Smart Collateral component falls to near zero, leaving only borrower interest.
Check the Jupiter documentation and DefiLlama's pool breakdown to confirm whether the 6.23% rate is reported as base lending APY or total blended yield. If it is blended, subtract an estimate of the swap fee component to isolate the lending-only rate. Compare that to Kamino's pure lending rate. If Jupiter's lending-only rate is 5.1% and Kamino's is 4.9%, the 0.2 percentage point spread is narrow and migration risk may not justify the move.
The 90% lender revenue share introduces another friction layer. If borrowers pay 6.92% in interest, lenders receive 6.23%. The protocol takes 0.69 percentage points. This is standard across DeFi lending markets, but it means the rate you earn is always 10% below the rate borrowers pay. When you compare Jupiter to Ethereum alternatives, confirm you are comparing lender APYs, not borrower APRs.
## Comparing Solana Lending Rates To Ethereum Alternatives
Plain USDC lending pools on Solana yield approximately 5% APY in equilibrium, while curated vaults targeting higher-risk strategies land between 6% and 8%. USDC lending rates on Solana have ranged from 3% in quiet markets to 15%+ during periods of heavy leverage demand, such as memecoin bull runs or concentrated long positions in SOL perpetuals.
Ethereum Fluid USDC currently offers 5.55% APY. Jupiter Lend at 6.23% provides a 0.68 percentage point spread. On a $300,000 allocation, that spread generates $2,040 per year in additional income. The question is whether that premium compensates for cross-chain bridge risk, Solana network congestion risk, smart contract risk on a newer protocol, and the volatility of Jupiter's variable rate structure.
Bridging $300,000 in USDC from Ethereum to Solana incurs a one-time cost of approximately $50 to $150 depending on bridge choice and gas prices. You lose two to three days of yield during the transfer window. If Jupiter's rate reverts to 5.0% within one week after you migrate, you earn less than Fluid and paid bridge fees for negative carry.
The decision tree requires a time horizon. If you plan to hold the position for six months, a 0.68 percentage point spread is material. If you plan to rotate every two weeks chasing the highest rate, friction costs and rate volatility will consume the spread. For more structured guidance on when short-term rate spikes justify migration, see [how to size into Compound V3 USDC after a 2.76 point rate jump](https://altcoininvestor.com/compound-v3-usdc-rate-increase-safe/), which builds a similar decision framework for Ethereum-side rate spikes.
Solana stablecoin lending yields have consistently outperformed Ethereum and Arbitrum benchmarks during periods of SOL price appreciation and memecoin speculation. Industry analysis from October 2024 confirms Solana as the [top chain for stablecoin lending yields](https://cryptobriefing.com/solana-top-chain-stablecoin-lending-yields/), driven by higher leverage multiples on perpetuals and short-duration borrow demand from traders rotating into new token launches.
If you believe Solana's leverage demand will remain elevated for the next quarter, Jupiter's rate has structural support. If you believe the current spike is a two-week phenomenon driven by a single large borrower or a memecoin pump that has already peaked, the rate will revert and you should stay on Ethereum.
## Utilization Ratio As The Primary Signal
The most reliable predictor of whether Jupiter's 6.23% rate is sustainable is the utilization ratio: total borrowed divided by total deposited. Jupiter's 41% utilization in early October suggested excess supply. A rate increase to 6.23% implies utilization rose above 50%, triggering the steeper portion of the interest rate curve.
Go to DefiLlama. Pull up the Jupiter Lend USDC pool. Check the current utilization ratio. If utilization sits at 55% or higher, the rate has room to hold or climb further. If utilization dropped back to 42%, the rate spike was transient and will decay within days.
Compare to Kamino. If Kamino's utilization also jumped from 49% to 60% in the same window, the driver is ecosystem-wide. If Kamino's utilization stayed flat or declined, Jupiter captured borrow flow that Kamino did not. That could reflect Jupiter's integration with the broader Jupiter DEX ecosystem, where traders borrow USDC to lever into new token launches routed through Jupiter aggregator swaps. That is protocol-specific demand and worth underwriting.
DefiLlama's pool page shows a 30-day APY chart. If the chart shows a flat 4.8% baseline with a sharp one-day spike to 6.23% followed by immediate reversion, the spike was an outlier. If the chart shows a gradual climb from 4.8% to 6.23% over two weeks, the demand shift is structural and the rate is more likely to hold.
Check the borrow composition if Jupiter publishes that data. If 80% of borrows are from three wallets, the rate is fragile and subject to instant collapse if those wallets close positions. If borrows are distributed across 400 wallets with an average size of $50,000, the demand is broad-based and less likely to vanish overnight.
## Rate Volatility And Emission Sensitivity
Jupiter Lend's fast growth is perhaps due to Fluid's generous incentive program. Fluid, the protocol layer underlying Jupiter Lend V2, has run token emission campaigns targeting both lenders and borrowers. If Jupiter's 1.08 percentage point rate jump coincides with the activation or deactivation of an incentive campaign, the rate change may not reflect organic demand.
Check the Jupiter governance forum and Fluid documentation for recent parameter changes or emission schedule updates. If the rate increase occurred the same day a new incentive tranche launched, the jump is artificial and will reverse when emissions taper. If no emission changes occurred, the rate move is organic.
DefiLlama's algorithm predicts the current 5.47% APY will fall below 4.37% within the next four weeks. That is a 1.1 percentage point downside prediction based on historical volatility and mean reversion. If you migrate to Jupiter today chasing 6.23%, the algorithm suggests you will earn less than 5% within a month unless borrow demand holds elevated.
For context on how to distinguish organic rate moves from emission-driven spikes, see [SparkLend USDS rate increase to 5.13%: utilization or parameter change](https://altcoininvestor.com/sparklend-usds-rate-increase/), which traces a 1.10 percentage point jump through governance timelines and contract state changes to prove causation.
Variable rate lending positions require active monitoring. If you allocate to Jupiter at 6.23% and the rate drops to 4.5% within two weeks, you need a pre-defined exit threshold. Do you tolerate a drop to 5.0% before rotating out? Do you rotate immediately if Kamino's rate exceeds Jupiter's by 0.3 percentage points? Build the decision tree before you deploy capital.
## Cross-Chain Migration Decision Tree
Here is the step-by-step framework for deciding whether to migrate $300,000 in USDC from Ethereum Fluid at 5.55% to Jupiter Lend at 6.23%:
**Step 1: Verify Current Rates.** Confirm Jupiter's live rate on DefiLlama. The 6.23% figure may be outdated. If the current rate is 5.3%, the migration does not clear the friction threshold.
**Step 2: Check Utilization.** If Jupiter's utilization ratio is below 45%, the rate will decay within days. Do not migrate. If utilization is above 55%, proceed to Step 3.
**Step 3: Compare To Kamino.** If Kamino's USDC rate is within 0.1 percentage points of Jupiter's, the driver is ecosystem-wide and you can earn the same rate at either protocol. Choose based on interface preference and auditor reputation. If Jupiter's rate exceeds Kamino's by 0.4 percentage points or more, Jupiter has captured protocol-specific demand and you should proceed to Step 4.
**Step 4: Isolate Blended Yield.** Verify whether Jupiter's 6.23% is pure lending APY or includes Smart Collateral swap fees. If blended, subtract estimated swap fee contribution. If the lending-only rate is below 5.7%, the spread over Fluid shrinks to 0.15 percentage points and migration is not justified.
**Step 5: Check Emission Schedule.** Review Jupiter and Fluid governance for recent incentive changes. If Jupiter activated a new emission tranche within the past seven days, wait two weeks to see if the rate holds post-emission. If no emission changes occurred, proceed to Step 6.
**Step 6: Calculate Break-Even Window.** Bridge cost is $100\. You lose $45 in yield during the two-day transfer (($300,000 × 5.55%) ÷ 365 × 2). Total friction is $145\. At a 0.68 percentage point spread, you earn $2,040 per year, or $170 per month. Break-even is 0.85 months, or 26 days. If you plan to hold the position for at least 30 days and believe Jupiter's rate will average above 5.9% during that period, migrate. If your time horizon is shorter or you expect rapid rate decay, stay on Ethereum.
**Step 7: Set Exit Triggers.** Define your rotation threshold before deploying. Example: if Jupiter's rate drops below 5.5% or Kamino's rate exceeds Jupiter's by 0.3 percentage points, rotate immediately. Monitor daily via DefiLlama alerts.
If you clear all seven steps, bridge USDC to Solana via Wormhole or Circle's Cross-Chain Transfer Protocol. Deposit into Jupiter Lend. Monitor utilization and rate daily for the first two weeks. For a broader framework on managing simultaneous rate collapses across protocols, see [how to hedge against simultaneous rate collapses across protocols](https://altcoininvestor.com/protect-against-defi-yield-drops/).
## Failure Modes And Monitoring Protocol
Jupiter Lend has been audited by Zenith and Offside, but smart contract risk remains non-zero. The V2 Smart Collateral architecture is newer than Aave V3 or Compound V3, and newer code surfaces edge cases under stress. The February 2025 Solana network congestion episode, during which transaction throughput dropped 80% for six hours, demonstrated that Solana-native DeFi protocols face liquidation cascade risk when oracle price feeds lag or fail to update during high-volatility periods.
If Solana network congestion prevents liquidations from executing on time, undercollateralized positions can accumulate and create bad debt for the protocol. Jupiter Lend uses Pyth Network oracles, which are faster and more granular than Chainlink on Solana, but still subject to the same network congestion bottlenecks. During the February event, Pyth prices lagged spot by up to 90 seconds during the peak congestion window.
Monitor the Jupiter Lend dashboard for bad debt accumulation. If bad debt exceeds 0.5% of total borrowed, withdraw immediately. Bad debt socializes across all lenders, eroding your returns even if your specific position is unaffected.
Track the Smart Collateral component separately. If your blended yield includes swap fee income, monitor Jupiter DEX trading volume on DefiLlama. If daily volume drops below $400 million for three consecutive days, the swap fee component will collapse and your yield will revert to lending-only APY. That may still exceed Ethereum alternatives, but it changes the risk-reward calculation.
Watch for large single-wallet withdrawals. If a wallet holding more than 5% of Jupiter Lend's USDC TVL initiates a withdrawal, liquidity for remaining lenders tightens and your own exit may face slippage or delay. DefiLlama does not track individual wallet positions, but on-chain explorers like Solscan and Arkham do. Set up alerts for large outflows from the Jupiter Lend USDC contract address.
If Jupiter's utilization ratio spikes above 85%, your withdrawal may face a queue. High utilization means most deposits are lent out and fewer funds are available for instant redemption. Aave and Compound handle this via reserve factors; Jupiter's reserve mechanism is less battle-tested. If you see utilization climb above 80%, consider pre-emptively rotating 50% of your position to Kamino or back to Ethereum to preserve optionality.
## What To Watch On-Chain Next
The most actionable on-chain signal for whether Jupiter's 6.23% rate is sustainable is the Jupiter Lend USDC utilization ratio, updated in real time on DefiLlama. Bookmark the pool page and check daily. A sustained utilization above 50% supports rates in the 5.5% to 6.5% range. A drop below 45% predicts rate decay to 4.5% within two weeks.
Track the Jupiter DEX daily trading volume on DefiLlama's DEX page. If volume holds above $500 million per day, the Smart Collateral swap fee component remains material. If volume drops below $300 million, the blended yield reverts almost entirely to lending-only APY.
Monitor Kamino Lend's USDC rate as the competitive benchmark. If Kamino's rate exceeds Jupiter's by more than 0.2 percentage points for three consecutive days, migrate. The protocols are fungible on the depositor side, and rate convergence is expected unless one captures structurally different borrower demand.
Check the Fluid governance forum weekly for emission schedule updates or parameter changes. If Fluid announces a new incentive tranche, expect artificial rate volatility that will normalize within 30 days post-launch.
Watch for Solana network congestion alerts via Solana Beach or Solscan's status page. If transaction success rates drop below 85%, liquidation risk rises and you should reduce your Jupiter Lend position by 30% to 50% until the network stabilizes.
Set up a DefiLlama portfolio tracker with alerts for Jupiter Lend USDC rate changes exceeding 0.5 percentage points in a single day. Sharp intraday moves in either direction signal either a large borrower entering or exiting, or a parameter change. Investigate immediately and decide whether to rotate or hold.
For additional guidance on evaluating whether a rate jump is sustainable before you allocate, see [how to evaluate Jupiter Lend's 6.31% USDC rate for sustainability](https://altcoininvestor.com/jupiter-lend-usdc-rate-sustainable/), which builds a parallel framework testing utilization, emissions, and borrower composition.
## The Takeaway
Jupiter Lend's 1.08 percentage point USDC rate increase to 6.23% is sustainable if and only if utilization holds above 50% and the rate is not artificially elevated by short-term incentive emissions. The most reliable predictor is the utilization ratio. If it dropped back below 45%, the rate will decay to 4.8% within two weeks and migration from Ethereum at 5.55% is unjustified. If utilization sits at 55% or higher and Kamino's rate is 0.4 percentage points lower, Jupiter has captured protocol-specific borrow demand and the rate has structural support.
The 0.68 percentage point spread over Ethereum Fluid generates $2,040 per year on a $300,000 position. After bridge costs and lost yield during transfer, break-even is 26 days. If your time horizon is 30 days or longer and you believe Solana leverage demand will hold elevated, migrate. If you expect rapid rate decay or your time horizon is shorter, stay on Ethereum.
Verify whether the 6.23% rate is pure lending APY or blended with Smart Collateral swap fees. If blended, subtract the swap fee component to isolate the lending-only rate. If the lending-only rate is below 5.7%, the spread over Fluid shrinks and migration risk exceeds the income gain.
Monitor Jupiter's utilization ratio daily. Set exit triggers before deploying. If the rate drops below 5.5% or Kamino's rate exceeds Jupiter's by 0.3 percentage points, rotate immediately. For a broader view of [leading DeFi protocols across lending, DEX, and derivatives categories](https://altcoininvestor.com/best-defi-protocols/), compare Jupiter's position in the Solana ecosystem to Ethereum-side alternatives and decide whether cross-chain migration is justified on a portfolio-wide basis rather than a single-protocol rate spike.
The next two weeks will confirm whether Jupiter's rate jump is utilization-driven or transient. Watch the on-chain signals named above. The data will tell you whether to migrate, stay, or rotate before the narrative catches up.
## Frequently Asked Questions
### Is Jupiter Lend's 6.23% USDC rate sustainable or temporary?
Sustainability depends on the utilization ratio. If Jupiter's borrow utilization holds above 50%, the 6.23% rate has structural support from organic leverage demand. If utilization drops below 45%, the rate will decay to 4.5-5.0% within two weeks as excess supply dilutes yield. Check DefiLlama's live pool data daily. Compare to Kamino's utilization and rate. If both protocols show elevated utilization, the driver is Solana-wide leverage demand and rates will hold. If only Jupiter's utilization rose, it captured protocol-specific borrow flow worth underwriting.
### Does Jupiter Lend's 6.23% include Smart Collateral swap fees or just lending APY?
Jupiter Lend V2 deposits can earn blended yield from borrower interest plus DEX swap fees via Smart Collateral routing. The headline rate may include both components. Verify on DefiLlama whether the 6.23% is reported as base lending APY or total blended return. If blended, subtract estimated swap fee contribution (typically 0.3-0.8pp depending on Jupiter DEX volume) to isolate the lending-only rate. Compare that to Kamino's pure lending rate. Swap fee income is volatile and correlated with market activity, so it adds upside during high-volume periods but disappears during sideways price action.
### Should I migrate $300,000 USDC from Ethereum Fluid at 5.55% to Jupiter at 6.23%?
The 0.68 percentage point spread generates $2,040 per year. After bridge costs ($100) and lost yield during transfer ($45), break-even is 26 days. Migrate if: (1) Jupiter's utilization is above 55%, (2) Kamino's rate is at least 0.4pp lower than Jupiter's, (3) no recent emission changes artificially inflated the rate, and (4) your time horizon is 30+ days. If utilization is below 45% or you expect rapid rate decay, stay on Ethereum. Set exit triggers before deploying: rotate if Jupiter's rate drops below 5.5% or Kamino exceeds Jupiter by 0.3pp. Monitor daily via DefiLlama alerts.
### What is the biggest risk of depositing USDC into Jupiter Lend at current rates?
Variable rate volatility and Solana network congestion are the primary risks. Jupiter's rate can drop from 6.23% to 4.5% within days if borrow demand collapses or a large borrower exits. DefiLlama's algorithm predicts the current 5.47% rate will fall below 4.37% within four weeks based on mean reversion. Additionally, Solana network congestion during high-volatility periods can delay oracle price updates, increasing liquidation cascade risk and potential bad debt accumulation. Monitor Jupiter's bad debt metric; withdraw immediately if it exceeds 0.5% of total borrowed. Set utilization alerts and rotate to Kamino or Ethereum if utilization drops below 45%.
### How do I verify whether Jupiter's rate jump is protocol-specific or Solana-wide?
Compare Jupiter's USDC utilization ratio to Kamino Lend's during the same window on DefiLlama. On October 9, Jupiter sat at 41% utilization and Kamino at 49%, with rates near parity (4.54% vs. 4.47%). If both protocols' utilization jumped to 55-60% and rates rose 1.0pp together, the driver is ecosystem-wide Solana leverage demand. If only Jupiter's utilization increased while Kamino's stayed flat or declined, Jupiter captured protocol-specific borrow flow, likely from traders using Jupiter DEX for token launches. That is alpha you can underwrite. Also check Jupiter governance for emission changes; if a new incentive tranche launched the same day rates spiked, the jump is artificial.
The Weekly Yield Report
You just isolated three rate drivers across $1.1B in Solana lending TVL. Those utilization ratios and blended yields will look different in 72 hours.
Every Thursday: where crypto yield actually is - stablecoins, liquid staking and DeFi lending, with the risk named next to the rate and what changed since last week.
[Get it free every Thursday](#/portal/signup)
Free. No trade calls, no allocations, no hype. Unsubscribe in one click.
### How To Rebalance When Four Protocols Flip 2+ Points In One Week
URL: https://altcoininvestor.com/rebalance-multiple-defi-rates-changed-same-week/
Last updated: 2026-10-19T21:05:54.000Z
## What You Will Accomplish

This week, Uniswap V3 fee capture shifted with protocol fee activation, Fluid USDC supply moved from 4.3% to 6.1%, Jupiter absorbed higher Solana DEX volume share, and Compound V3 utilization drove USDC supply from 2.0% to 4.8%. Each protocol moved at least 2 percentage points. If you hold $500,000 split across these four venues, you are looking at a $10,000+ annualized swing in yield.
The question is not whether the moves matter. The question is which move you act on first, how you batch the migration to save gas, and when waiting for volatility to settle costs you more than acting immediately.
This article walks through the decision framework using this week's actual rate changes across Uni V3, Fluid, Jupiter, and Compound. You will learn prioritization logic (largest position first versus largest gain first), batched migration cost math, and the specific conditions under which you wait versus the conditions under which you move capital the same day.
**Prerequisites:** You already supply to at least two of these protocols. You track APY manually or through DefiLlama. You understand that rebalancing has a cost, and that cost is gas plus opportunity cost during migration.
## The Decision Framework: Prioritization Logic

When multiple protocols move simultaneously, the naive approach is to chase the highest absolute APY. The effective approach is to rank by impact: annualized dollar swing per position, adjusted for gas cost and migration time.
**Largest position first:** If you hold $300,000 in Compound V3 USDC at 2.0% and it jumps to 4.8%, that position now earns an additional $8,400 per year. A 2.8-point move on $300k dominates a 3.5-point move on $50k. Your first decision is whether the Compound position justifies immediate action or whether you wait to batch it with other moves.
**Largest gain first:** Fluid USDC moved from 4.3% to 6.1%, a 1.8-point gain. Jupiter fee capture is not rate-based but volume-dependent; if Solana DEX volume spiked this week and you provide liquidity, your effective APY may have moved 3+ points. The largest gain in percentage terms may not be the largest gain in dollar terms. Rank by annualized dollar impact, not by percentage point change.
The formula is simple: (new APY - old APY) × position size = annualized dollar swing. For a $150,000 Fluid position moving from 4.3% to 6.1%, the swing is 1.8% × $150,000 = $2,700 per year, or $225 per month. If gas to migrate is $50 on Ethereum L1, you break even in six days. If the rate move is utilization-driven and likely to persist, you act immediately. If the move is a weekend spike driven by a single large borrow that may reverse Monday, you wait.
[The protocol landscape](https://altcoininvestor.com/best-defi-protocols/) offers rates that fluctuate mainly based on borrowing utilization; higher borrowing demand increases supplier reward rates. Morpho and Fluid carry higher rates because their architectures concentrate borrow demand into specific markets, making them more volatile than Aave or Compound on a day-to-day basis. When a rate move in Fluid exceeds 1.5 percentage points in one week, check whether utilization spiked or whether the protocol adjusted parameters.
## Batched Migration: Gas Cost Math

If you migrate four positions one at a time, you pay gas four times. If you batch them using a multicall contract, you pay once. The difference on Ethereum L1 during moderate congestion is $180 in separate transactions versus $90 in a batched transaction. On Arbitrum, the difference is $18 versus $9\. On Solana, gas is negligible - approximately $0.01 per transaction - and batching saves time, not cost.
Practical rebalancing triggers sit in the $250,000 to $1 million range per chain pair, below which netting dominates; above it, batched onchain settlement clears the position. For positions below $100,000, a 2-point rate move may not justify gas unless you batch it with other actions. For positions above $250,000, a 2-point move represents $5,000 annualized on a $250k position, which justifies gas even in isolation.
The cost-efficient pattern is netting first and onchain rebalancing last. If you plan to withdraw from Compound and supply to Fluid, check whether both protocols are on the same chain. Compound V3 and Fluid both operate on Ethereum mainnet. A batched transaction can withdraw USDC from Compound, approve Fluid, and supply in one call. Batching allows multiple actions to be executed within a single transaction; instead of paying for gas for each step, you pay once for the combined operation.
If your positions span multiple chains - Compound on Ethereum, Jupiter on Solana - you cannot batch cross-chain. In that case, prioritize the chain with higher gas costs first. Ethereum L1 gas dominates cost; Arbitrum saves 90% versus L1\. If you hold $200,000 in Compound on Ethereum and $100,000 in a Solana protocol, and both moved 2 points, migrate the Ethereum position first because gas delay on L1 is more expensive than gas delay on Solana.
### Worked Example: Four-Protocol Rebalancing This Week
Assume you hold $500,000 split as follows: $200k in Compound V3 USDC (moved from 2.0% to 4.8%), $150k in Fluid USDC (moved from 4.3% to 6.1%), $100k in Uniswap V3 USDC-WETH 0.30% tier (fee capture increased post-protocol-fee activation), $50k in a Jupiter liquidity position (effective APY moved with volume spike).
Annualized dollar impact: Compound = 2.8% × $200k = $5,600\. Fluid = 1.8% × $150k = $2,700\. Uniswap V3 = assume 2.5% effective APY increase × $100k = $2,500\. Jupiter = assume 3% effective increase × $50k = $1,500.
Total annualized swing: $12,300\. Monthly: $1,025\. Weekly: $236\. If you do nothing for one week, you lose $236 in yield that you could have captured. If gas to rebalance all four positions costs $120 total (batched Ethereum transactions for Compound, Fluid, Uni V3; separate Solana transaction for Jupiter), you break even in three days.
Decision: Act immediately on Compound and Fluid because they are Ethereum-based, high-dollar-impact, and can be batched. Wait on Uniswap V3 and Jupiter unless you are already executing an Ethereum transaction for another reason, in which case batch the Uni V3 withdrawal. Handle Jupiter separately because Solana gas is negligible and the position is smaller.
## When To Wait For Volatility To Settle Versus Acting Immediately
Rate moves fall into two categories: utilization-driven and parameter-driven. Utilization-driven moves happen when borrowing demand spikes. Parameter-driven moves happen when a protocol adjusts its interest rate model or incentive structure. The distinction determines whether you act immediately or wait.
**Act immediately when:** The rate move is utilization-driven and the protocol has a history of sustained utilization at this level. Compound V3 moving from 2.0% to 4.8% over one week signals either a large institutional borrow or increased retail borrow demand. Check the protocol's utilization ratio. If utilization is above 80%, the rate is likely to persist because suppliers are earning from real borrowing demand. In this case, migrating capital today captures yield that will continue.
**Wait when:** The rate move is a weekend spike driven by a single large position that may reverse Monday. Fluid, with its shorter operating history and hybrid DEX-lending model, is more volatile than Aave or Compound. If Fluid USDC jumps 1.8 points on a Friday and you see no corresponding increase in TVL or borrowing volume, the move may be a parameter adjustment or a short-term liquidity event. In this case, waiting 48 hours costs you two days of extra yield but avoids migrating into a rate that collapses Tuesday.
**The 48-hour rule:** If a protocol moves more than 2 percentage points in one day and you cannot identify the cause (check [DefiLlama](https://defillama.com/protocol/uniswap-v3) for TVL changes, check the protocol's Discord or governance forum for parameter changes), wait 48 hours. If the rate holds for 48 hours, it is more likely to persist. If it reverts within 48 hours, you saved gas and opportunity cost.
The exception is when the dollar impact is large enough that even a short-term rate spike justifies migration. If you hold $300,000 in a protocol that jumps from 3% to 6% for one week only, you earn an extra $900 that week ($300k × 3% / 52). If gas to migrate in and out is $100 total, you net $800\. In this case, act immediately even if you suspect reversion.
## Common Failure Modes
**Failure mode 1: Small positions, high gas.** Only 18% of Uniswap V3 positions below $1,000 beat holding after gas. If your Uni V3 position is $10,000 and the effective APY moved 2.5 points, that is $250 annualized or $20 per month. Gas to withdraw and migrate on Ethereum L1 is $50 minimum. You break even in 2.5 months. If the rate move is temporary, you lose money. The correct action for positions below $25,000 is to batch migration with other moves or to tolerate the lower rate until you have a reason to move capital anyway.
**Failure mode 2: Chasing rate without checking risk.** [Fluid dropped from 7.77% to 5.43% on $204M TVL in one week](https://altcoininvestor.com/fluid-lending-rate-drop-should-i-move/) earlier this year. Depositors who migrated into Fluid at 7.77% without checking whether the rate was sustainable lost the premium when utilization crashed. Before you migrate to capture a rate, check the protocol's utilization ratio, emissions, and borrower composition. If the rate is subsidized by token emissions that will end in 30 days, you are not capturing sustainable yield. [Here is the 48-hour vetting protocol](https://altcoininvestor.com/new-defi-protocol-safety-check/) before you allocate.
**Failure mode 3: Ignoring collateral concentration.** Compound V3's design designates one borrowable asset per market (called a Comet). If you supply USDC to Compound's USDC Comet, your yield depends on demand for USDC borrows in that specific market. If a competitor offers better USDC borrow terms and borrowers migrate, your rate collapses. Fluid's hybrid model stacks lending interest and DEX swap fees, which means depositors earn from two sources but also face correlated risk between the two markets. When you rebalance into a protocol, understand whether your yield depends on a single market or multiple markets, and whether those markets are correlated.
**Failure mode 4: Over-reacting to protocol fee changes.** Uniswap V3 activated protocol fees this year. Fee tiers are now 0.05% (0.0375% LP fee), 0.30% (0.25% LP fee), and 1.00% (0.8334% LP fee). LPs now earn less per trade because a portion goes to the protocol. If you provide liquidity in the USDC-WETH 0.30% tier, your effective APY may have dropped even if trading volume increased. The correct response is to check whether your position still beats holding or whether concentrated liquidity in a tighter range would capture more fees despite the protocol cut. [V3 fee capture is volume- and concentration-dependent](https://altcoininvestor.com/uniswap-v3-usdc-eth-yield-spike-march-2025/), not just rate-dependent.
## What To Do Next
Open a spreadsheet. List every protocol position you hold, the current APY, the APY one week ago, the position size, and the annualized dollar swing. Rank by dollar swing, not by percentage point change.
For the top three positions by dollar swing, check whether they are on the same chain. If yes, batch the migration. If no, migrate the highest-gas-cost chain first. For positions below $25,000, wait until you have three or more actions to batch, or until the rate move exceeds 3 percentage points.
Set a 48-hour wait rule for any protocol that moved more than 2 points in one day unless you can confirm the move is utilization-driven and the utilization ratio is above 80%. Check DefiLlama for TVL changes. Check the protocol's governance forum for parameter changes. If you cannot identify the cause, wait.
Finally, [set up monitoring alerts](https://altcoininvestor.com/defi-position-monitoring-alerts/) so you catch rate moves the day they happen, not one week later. The $236 weekly yield difference on a $500k portfolio compounds if you consistently act within 24 hours versus acting one week late.
## The Takeaway
You now have the prioritization framework for multi-protocol rebalancing: rank by annualized dollar impact, batch same-chain migrations to save gas, act immediately on utilization-driven moves above $250k, and wait 48 hours on unexplained spikes. On $500,000 split across four protocols, this week's moves represent $12,300 annualized. Missing that swing for one month costs $1,025\. Gas to migrate costs $120 batched. The math is straightforward. The discipline is acting on it.
These four protocols will not be the last to move simultaneously. The APY spread across eight major protocols runs roughly 3-4 percentage points on any given day, with larger protocols like Aave and Compound trading lower rates than newer protocols like Fluid. The next time rates flip, you will know which position to move first.
## Frequently Asked Questions
### Should I rebalance when only one protocol out of four moves 2+ points?
Calculate annualized dollar impact first. If the position is above $250,000 and the rate move is utilization-driven (check the protocol's utilization ratio on DefiLlama), act within 24 hours. If the position is below $100,000, wait to batch the migration with other moves or until the rate move exceeds 3 percentage points. Gas cost on Ethereum L1 is $50 minimum; you need the dollar swing to justify that cost within a reasonable breakeven window, typically under 30 days.
### How do I know if a rate move is utilization-driven or parameter-driven?
Check the protocol's utilization ratio on DefiLlama or the protocol's dashboard. If utilization is above 80% and the rate moved up, the move is utilization-driven and likely to persist. If utilization is below 60% and the rate moved, check the protocol's governance forum or Discord for parameter changes or emissions adjustments. Utilization-driven moves justify immediate action; parameter-driven moves often require a 48-hour wait to confirm sustainability.
### Can I batch rebalancing across Ethereum and Solana in one transaction?
No. Cross-chain transactions cannot be batched in a single call. Prioritize the chain with higher gas costs first - Ethereum L1 gas dominates cost, so migrate Ethereum positions before Solana positions. Solana gas is approximately $0.01 per transaction, so the opportunity cost of delay on Solana is minimal compared to Ethereum. Handle each chain separately and focus batching efforts on same-chain protocols like Compound, Fluid, and Uniswap V3, which all operate on Ethereum mainnet.
### What is the breakeven time for a $150,000 position that moved 1.8 percentage points?
Annualized swing is 1.8% times $150,000 equals $2,700 per year, or $225 per month, or $7.40 per day. If gas to migrate is $50 on Ethereum L1, breakeven is 6.7 days. If you expect the rate move to persist for at least two weeks and it is utilization-driven, act immediately. If you suspect the move is temporary or parameter-driven and may revert within 48 hours, wait. For positions above $100,000, a 1.8-point move typically justifies immediate action.
### Should I rebalance Uniswap V3 positions after protocol fee activation changed LP earnings?
Only if your position size and fee tier justify the gas cost. Uniswap V3 now charges protocol fees, so LPs earn 0.25% per trade in the 0.30% tier instead of the full 0.30%. If your position is below $50,000 and your effective APY dropped by less than 2 percentage points, the gas cost to migrate outweighs the benefit. For positions above $100,000, check whether tighter concentrated liquidity in the same or a different pool would capture more fees despite the protocol cut. V3 fee capture depends on volume and concentration, not just the headline tier rate.
The Weekly Yield Report
You just compared four protocols that moved 2+ points in one week, with a $12,300 annualized swing on $500k. Those numbers will be different next week.
Every Thursday: where crypto yield actually is - stablecoins, liquid staking and DeFi lending, with the risk named next to the rate and what changed since last week.
[Get it free every Thursday](#/portal/signup)
Free. No trade calls, no allocations, no hype. Unsubscribe in one click.
### How To Vet New Curve USDC-RLUSD Pool At 4.33% In 72 Hours
URL: https://altcoininvestor.com/curve-usdc-rlusd-pool-safe-new-stablecoin/
Last updated: 2026-10-19T19:07:56.000Z
## Why You Need A 72-Hour Vetting Protocol

The USDC-RLUSD pool on Curve Finance launched in early 2025 and now holds $96 million in TVL at 4.33% APY. That rate sits 1.5 to 2 percentage points above established USDC alternatives. On a $100,000 position, that spread generates $1,500 to $2,000 in additional annual income. Losing the principal to a depeg event costs $100,000.
RLUSD is Ripple's first stablecoin initiative, launched in December 2024\. It is six months old at the time the pool launched. The token is fully backed by U.S. dollar deposits, short-term Treasuries and cash equivalents, with monthly attestations from a third-party firm. The issuer is a trust company chartered by the New York State Department of Financial Services. Each token is backed 1:1 by reserves that include cash and US Treasuries. RLUSD crossed $2 billion in market cap and received regulatory approval in Japan from the Financial Services Agency in June 2026.
New stablecoin pools frequently offer elevated rates during the initial growth phase because liquidity providers demand a premium for early-stage risk and because protocols incentivize TVL growth through emissions. The income opportunity is real. The risk is equally real. When USDC briefly fell to $0.89 in March 2023 due to bank failures, Curve's 3pool saw average slippage of 3.7 percent, 150 times higher than normal, with $38 million in impermanent loss across affected pools.
This article provides the specific 72-hour vetting checklist you run before allocating capital into a newly launched Curve pool containing a new stablecoin. It uses the USDC-RLUSD pool as the live case study, covering RLUSD depeg risk research, Curve factory pool audit status, liquidity depth testing, and rate sustainability signals from early utilization data. Each step includes the threshold that triggers a pass or fail decision.
### What You Will Accomplish
By the end of this checklist, you will have verified five critical risk factors: stablecoin backing and redemption mechanics, smart contract security and audit status, liquidity depth under stress conditions, rate sustainability beyond initial incentives, and on-chain signals that precede early depegging events. You will know whether the 4.33% rate compensates for the additional risk compared to [established stablecoin income positions](https://altcoininvestor.com/how-to-earn-passive-income-stablecoins-2026/), or whether the pool presents concentration risk that outweighs the yield premium.
### Prerequisites
You need access to DefiLlama for TVL and volume tracking, Etherscan or the relevant block explorer for contract verification, Tenderly or a similar tool for transaction simulation, and direct access to the Curve pool interface. You should understand what constitutes acceptable slippage for your position size and have a working knowledge of how Curve's gauge voting system allocates CRV emissions. If you are unfamiliar with liquidity pool mechanics, read the foundational material on impermanent loss and fee generation before proceeding.
## Step 1: Verify Stablecoin Backing And Redemption Mechanics

The first check determines whether the stablecoin itself is structurally sound. Assessing depeg risk requires evaluating multiple quantifiable factors: reserve composition quality, attestation frequency, redemption mechanism speed, market depth, issuer jurisdiction, and historical peg stability. For a stablecoin that is six months old, you lack the multi-year track record that USDC and USDT provide, so you compensate by verifying the structural elements that reduce single-point-of-failure risk.
### Check Reserve Composition And Attestation Cadence
Pull the most recent attestation report published by the issuer. For RLUSD, that means locating the monthly attestation from Standard Custody & Trust Company, the trust company chartered by NYDFS. Verify that the report is dated within the past 45 days. A lapse in attestation cadence is an immediate red flag. Verify that reserves consist of cash and short-term U.S. Treasuries, not commercial paper, not other stablecoins, not tokenized assets with secondary liquidity risk. RLUSD's reserve structure mirrors USDC's, which is the gold standard for fiat-backed stablecoins.
Confirm that the attestation is performed by a recognized third-party auditor, not by the issuer's internal team. If the attestation is self-reported or if the auditing firm is not a Big Four or recognized mid-tier firm, treat that as a structural weakness that requires additional scrutiny in liquidity depth testing.
### Verify Redemption Mechanics And Speed
Check whether the stablecoin offers direct redemption for U.S. dollars and what the processing time is. USDC offers same-day redemption for verified institutional users and next-day for retail. RLUSD's redemption mechanics should be documented on the issuer's site. If redemption requires navigating multiple intermediaries, if processing time exceeds five business days, or if there is no direct redemption mechanism at all, that increases the depeg risk because arbitrageurs cannot efficiently close price deviations.
For a stablecoin launched six months ago, verify that redemptions have occurred and that users have successfully converted tokens back to fiat. Search for any reports of delayed or failed redemptions. A single confirmed delay is not disqualifying if it was resolved and explained, but multiple reports or unexplained delays are a hard stop.
### Pass/Fail Threshold
Pass if the stablecoin is backed 1:1 by cash and short-term Treasuries, attestations are current within 45 days, the issuer is regulated in a reputable jurisdiction (U.S., EU, Singapore, Hong Kong), and direct redemption is documented and confirmed functional. Fail if any of those conditions are missing or if there are confirmed reports of redemption delays exceeding five business days.
## Step 2: Confirm Curve Factory Pool Audit And Security Status

Curve Finance operates two categories of pools: core pools that have been audited and formally integrated by Curve's development team, and factory pools that can be deployed by anyone using Curve's permissionless factory contracts. Factory pools have faced security vulnerabilities in the past. In 2023, a reentrancy vulnerability in Vyper versions 0.2.15, 0.2.16, and 0.3.0 led to over $26 million in outflows from affected Curve pools. The USDC-RLUSD pool requires verification of which factory version it uses and whether it has been independently audited.
### Identify Pool Deployment Date And Compiler Version
Navigate to the Curve pool contract on Etherscan or the relevant block explorer. Check the contract creation date and the Vyper compiler version used. If the pool was deployed using Vyper 0.2.15, 0.2.16, or 0.3.0, stop. Those versions contain known reentrancy vulnerabilities and are not safe for production use. If the pool uses a later version or if it has been redeployed using patched code, proceed to the next check.
Verify whether the pool is part of Curve's core registry or whether it is a factory pool. Core pools have undergone formal audits by firms such as Trail of Bits, MixBytes, or CertiK. Factory pools may or may not have independent audits. [MixBytes published a security audit of Curve's StableSwapNG factory](https://github.com/mixbytes/audits%5Fpublic/blob/master/Curve%20Finance/StableSwapNG/README.md), which covers the factory mechanism itself but does not automatically extend to every pool deployed using that factory.
### Check For Independent Pool Audit
Search for any independent audit reports specific to the USDC-RLUSD pool. If the pool has been audited by a recognized firm (Trail of Bits, CertiK, MixBytes, OpenZeppelin), verify that the audit report is publicly available and that any critical or high-severity findings have been resolved. If no independent audit exists, assess whether the pool uses standard Curve factory contracts without modification. Unmodified factory pools inherit the security properties of the factory audit, but any custom logic introduces unaudited risk.
### Verify Admin Control Structures
Check who controls pool parameters such as fee adjustments, pause functions, and oracle selection. If the pool is controlled by Curve DAO governance, verify the minimum vote threshold required to make changes. If the pool is controlled by a team multisig, check the signer composition. A 3-of-5 or 4-of-7 multisig is acceptable if the signers are publicly known and geographically distributed. A 2-of-3 multisig or any setup where signers are anonymous represents concentration risk.
### Pass/Fail Threshold
Pass if the pool uses a Vyper version later than 0.3.0, is either a core pool with formal audit or a factory pool with independent audit, and admin controls are held by Curve DAO or a publicly disclosed multisig with at least five signers. Fail if the pool uses a vulnerable Vyper version, lacks independent audit and uses custom contract logic, or admin controls are concentrated in fewer than five signers.
## Step 3: Test Liquidity Depth Under Stress Conditions
TVL is the most direct indicator of pool quality. Deeper pools absorb large trades with less price impact, generate more consistent fee volume, and attract more routing from aggregators. The USDC-RLUSD pool holds $96 million in TVL as of the case study date. That figure is relevant, but it does not tell you how the pool performs under stress. The critical test is whether the pool can handle large swaps without excessive slippage and whether liquidity is organic or subsidized.
### Run Large Swap Simulations
Use Tenderly or a similar transaction simulation tool to simulate large swaps in both directions: USDC to RLUSD and RLUSD to USDC. Start with swaps representing 1 percent of TVL (for a $96 million pool, that is $960,000) and increase to 5 percent ($4.8 million). Record the quoted slippage for each trade size. For a stablecoin pair, acceptable slippage is below 0.1 percent for trades up to 1 percent of TVL and below 0.5 percent for trades up to 5 percent of TVL.
If slippage exceeds 0.5 percent on trades representing 1 percent of TVL, the pool does not have sufficient depth to support positions that require rapid exit. If slippage exceeds 2 percent on trades representing 5 percent of TVL, the pool is unsuitable for large allocations. Compare these figures to established Curve stablecoin pools such as 3pool or USDC-USDT to benchmark expected performance.
### Verify Liquidity Growth Source
Check whether the pool's TVL grew from new deposits or from volume flow. On DefiLlama, review the TVL chart for the past 30 days. Steady growth indicates organic adoption. A sudden spike followed by stagnation indicates a single large depositor or a short-term incentive campaign. Cross-reference the TVL growth with the pool's fee generation. If TVL grew 50 percent but fee generation remained flat, the new liquidity is not being utilized, which suggests it is mercenary capital chasing emissions rather than genuine trading demand.
For the USDC-RLUSD pool, [DefiLlama's Curve DEX tracking](https://defillama.com/protocol/curve-dex) shows TVL of $103 million in Week 14, $78.6 million with $7.4 million in inflows during Week 23, and $76.5 million with $9.88 million in inflows by Week 32\. The fluctuation indicates that TVL responded to broader market conditions but maintained a baseline. Week 45 data showed $227.8 million in weekly volume and $48,100 in fees, ranking it as a top fee generator. That volume-to-TVL ratio is healthy and indicates genuine utilization.
### Pass/Fail Threshold
Pass if slippage remains below 0.5 percent for swaps up to 5 percent of TVL, TVL growth is gradual rather than spiked, and weekly volume is at least 50 percent of TVL. Fail if slippage exceeds 1 percent for swaps representing 1 percent of TVL, TVL growth is entirely concentrated in a single week without corresponding volume increases, or weekly volume is below 20 percent of TVL.
## Step 4: Assess Rate Sustainability Beyond Initial Incentives
The quoted 4.33 percent APY must be decomposed into its components. Curve pools generate yield from two sources: trading fees paid by users who swap through the pool, and CRV emissions allocated to the pool through Curve's gauge voting system. Trading fees are sustainable as long as volume persists. CRV emissions are subject to governance decisions and can be reduced or redirected at any time. Emission-based APY can decline sharply if governance token prices fall, if emissions schedules reduce, or if a large influx of new LPs dilutes the reward pool.
### Separate Fee APY From Incentive APY
On the Curve pool interface, locate the breakdown of the displayed APY. Curve typically displays base vAPR (from trading fees) separately from CRV rewards. If the 4.33 percent is entirely from trading fees, it is sustainable as long as volume remains consistent. If it is entirely from CRV emissions, it is subject to immediate volatility based on CRV price movements and gauge weight changes. If it is a mix, calculate the percentage contribution from each source.
For a newly launched pool, CRV emissions often constitute the majority of the displayed APY. That is acceptable in the short term, but it requires ongoing monitoring. Fees and pool parameters are decided by the Curve DAO, and currently the fee on all pools is 0.04 percent, of which 50 percent goes to liquidity providers and 50 percent to veCRV holders. Given that structure, a pool with $96 million TVL and $227.8 million in weekly volume generates approximately $48,100 in weekly fees. Annualized, that is $2.5 million in fees on $96 million TVL, or 2.6 percent base APY. The remaining 1.73 percentage points in the quoted 4.33 percent comes from CRV incentives.
### Check CRV Gauge Weight And Historical Voting Support
Navigate to Curve's governance dashboard and locate the gauge weight assigned to the USDC-RLUSD pool. Gauge weight determines what percentage of total CRV emissions the pool receives. If the pool has high gauge weight (above 1 percent of total), that indicates strong veCRV holder support and suggests emissions will continue. If gauge weight is below 0.5 percent, emissions are marginal and could be redirected to other pools at any time.
Review the most recent governance proposals and forum discussions related to the pool. If Curve DAO has signaled continued support or if major veCRV holders have publicly committed voting power to the pool, that is a positive signal. If there are no recent discussions or if governance sentiment is neutral, treat the emission component as unstable and expect it to decline within 90 days.
### Pass/Fail Threshold
Pass if base trading fee APY is at least 2 percent, CRV incentives contribute no more than 50 percent of total APY, and gauge weight is above 0.5 percent with recent governance support. Fail if base fee APY is below 1 percent, CRV incentives contribute more than 75 percent of total APY, or gauge weight is below 0.3 percent with no governance discussion.
## Step 5: Monitor On-Chain Signals For Early Depegging
The final check is continuous rather than one-time. Once you have allocated capital into the pool, you must monitor on-chain data for signals that precede depegging events. Empirical analysis shows major cryptocurrency price and volume fluctuations influence stablecoin depegging. Machine learning models indicate traditional on-chain data are key to predicting depegging. The specific signals include bid-ask spread widening, directional swap concentration, and price deviation beyond 0.5 percent.
### Track Bid-Ask Spread On Curve Versus Centralized Exchanges
Every 24 hours, compare the RLUSD price on Curve with the RLUSD price on centralized exchanges where it trades, such as Kraken or Coinbase. If the bid-ask spread between Curve and CEX prices exceeds 0.2 percent consistently for more than 48 hours, arbitrage is not functioning efficiently and depeg risk is elevated. If the Curve price consistently trades below the CEX price, that indicates selling pressure on-chain that may not yet be reflected in centralized markets.
### Watch For Directional Swap Concentration
Use Dune Analytics or a similar tool to query swap direction in the USDC-RLUSD pool. If you observe sustained net selling of RLUSD for USDC (more swaps in one direction than the other) for three consecutive days, that indicates users are exiting RLUSD positions. A single day of imbalance is normal volatility. Three consecutive days indicates a trend. When that occurs, reduce position size by 50 percent and monitor for reversal.
### Set Alerts For Price Deviation Beyond 0.5 Percent
Configure an alert that triggers if RLUSD trades at a price below $0.995 or above $1.005 for more than one hour. Event detection research shows thresholds vary from 1 percent to 5 percent magnitude, with a 2.5 percent daily-close threshold identified as optimal against documented depeg episodes. A 0.5 percent threshold is more conservative but appropriate for a stablecoin that is six months old. If the alert triggers, exit the position within 24 hours unless you can identify and verify the cause of the deviation.
### Pass/Fail Threshold
Ongoing pass requires bid-ask spread below 0.2 percent, balanced swap direction with no more than 60 percent net flow in one direction over three days, and price stability within 0.5 percent of $1.00\. Fail signals requiring immediate position reduction or exit include bid-ask spread above 0.5 percent for 48 hours, net swap concentration above 70 percent in one direction for three days, or price deviation beyond 1 percent for more than one hour.
## Common Failure Modes And How To Avoid Them
The most common mistake is allocating capital based on APY alone without vetting the underlying stablecoin. In March 2023, multiple high-APY pools containing USDC suffered impermanent loss when USDC depegged to $0.89\. LPs who had not verified USDC's reserve structure or monitored redemption mechanics experienced losses that exceeded 12 months of yield. The lesson is that reserve quality matters more than rate.
The second failure mode is ignoring smart contract risk because the pool is hosted on Curve, a well-known platform. Factory pools do not automatically inherit the security properties of Curve's core pools. In 2023, the Vyper reentrancy vulnerability affected only factory pools, not core pools, but many LPs assumed all Curve pools were equally secure. Always verify compiler version and audit status for any factory-deployed pool.
The third mistake is entering a pool during the initial TVL growth phase without testing liquidity depth. Early deposits often receive the highest emissions, but if the pool cannot handle exit liquidity, those emissions are worthless. Simulate large swaps before allocating more than 5 percent of your stablecoin holdings to any single pool, especially one that is newly launched.
## What To Do After The 72-Hour Vetting Period
If the pool passes all five checks, allocate no more than 20 percent of your intended stablecoin yield position in the first week. Monitor daily for the first 14 days, then weekly after that. If on-chain signals remain stable, TVL continues to grow, and fee generation remains consistent, you can increase position size to your target allocation over the following 30 days. If any of the pass/fail thresholds are breached during the monitoring period, reduce position size immediately and reassess.
If the pool fails any of the five checks during the initial 72-hour vetting, do not allocate. The additional 1.5 to 2 percentage points of yield does not compensate for the structural risk. Instead, allocate to [established Curve pools with multi-year track records](https://altcoininvestor.com/curve-usdc-rlusd-pool-review/) or to [audited lending protocols](https://altcoininvestor.com/new-defi-protocol-safety-check/) that offer lower rates but substantially lower risk.
For pools that pass the initial vetting but show declining gauge weight or falling fee APY after 30 days, prepare an exit plan. Set a threshold APY below which the pool no longer justifies the additional complexity and monitoring burden. For most LPs, that threshold is 1 percentage point above the best alternative. If the USDC-RLUSD pool falls below 3.5 percent and USDC-USDT offers 2.5 percent, the additional 1 percentage point does not justify continued exposure to a six-month-old stablecoin.
## The Takeaway
New Curve pools containing new stablecoins offer 2 to 5 percentage points above established alternatives, but early entry without systematic vetting introduces depeg risk that can eliminate months or years of accumulated yield in a single event. RLUSD launched six months ago with institutional backing, regulatory approval, and monthly attestations, but it does not yet have the multi-year track record of USDC or USDT. The 72-hour vetting protocol surfaces the specific checks that separate structural soundness from marketing narratives: reserve composition, redemption mechanics, smart contract audit status, liquidity depth under stress, rate sustainability beyond emissions, and on-chain signals that precede depeg events. Run every check before you allocate, monitor continuously after entry, and exit immediately if any threshold is breached. The additional yield is only worth pursuing if the risk is quantified and contained.
## Frequently Asked Questions
### How old should a stablecoin be before I consider allocating to a Curve pool containing it?
USDC and USDT have multi-year track records and are the safest choices. For newer stablecoins like RLUSD (launched December 2024), six months is the minimum age to consider, but only if the coin has regulatory approval, monthly attestations from a recognized auditor, confirmed functional redemption mechanics, and no reported depeg events. Allocate no more than 20 percent of your stablecoin yield position to pools containing stablecoins younger than two years, and monitor daily for the first 30 days.
### What Vyper compiler version should a Curve pool use to be considered safe?
Avoid pools compiled with Vyper versions 0.2.15, 0.2.16, or 0.3.0, which contain known reentrancy vulnerabilities that led to over $26 million in losses in 2023\. Pools using version 0.3.1 or later have patched this vulnerability. Always verify the compiler version on Etherscan or the relevant block explorer before allocating. If the pool is a factory pool rather than a core pool, also check for an independent audit report from Trail of Bits, MixBytes, CertiK, or OpenZeppelin.
### How much slippage is acceptable when testing liquidity depth in a Curve stablecoin pool?
For trades representing 1 percent of pool TVL, slippage should be below 0.1 percent. For trades representing 5 percent of TVL, slippage should remain below 0.5 percent. If slippage exceeds 1 percent on a trade equal to 1 percent of TVL, the pool lacks sufficient depth for large positions. Use Tenderly or a similar simulation tool to test both directions (USDC to RLUSD and RLUSD to USDC) before allocating, because asymmetric slippage indicates unbalanced liquidity or directional selling pressure.
### What percentage of a Curve pool's APY should come from trading fees versus CRV emissions?
Trading fee APY is sustainable as long as volume persists, while CRV emission APY is subject to governance decisions and token price volatility. For newly launched pools, aim for at least 2 percent base fee APY and ensure CRV incentives contribute no more than 50 percent of total APY. If emissions represent more than 75 percent of the quoted rate, expect the APY to decline within 90 days as emissions are redirected or diluted. Check the pool's gauge weight on Curve's governance dashboard to assess ongoing veCRV holder support.
### What on-chain signals indicate a stablecoin is at risk of depegging?
Monitor three key signals daily: bid-ask spread between Curve and centralized exchanges (alert if spread exceeds 0.2 percent for 48 hours), directional swap concentration in the pool (alert if net flow in one direction exceeds 60 percent for three consecutive days), and price deviation from $1.00 (exit if price moves beyond 0.5 percent for more than one hour). Set automated alerts for these thresholds using Dune Analytics or similar tools, and reduce position size by 50 percent immediately if any alert triggers.
The Weekly Yield Report
You have just applied a five-step vetting protocol to a live $96M pool with a six-month-old stablecoin. Pool metrics and stablecoin risk profiles change weekly, and the next new pool will present different structural variables.
Every Thursday: where crypto yield actually is - stablecoins, liquid staking and DeFi lending, with the risk named next to the rate and what changed since last week.
[Get it free every Thursday](#/portal/signup)
Free. No trade calls, no allocations, no hype. Unsubscribe in one click.
### Why Centrifuge USDS APY Collapsed From 3.95% To 1.0%
URL: https://altcoininvestor.com/centrifuge-usds-rate-drop-why/
Last updated: 2026-10-19T17:03:30.000Z
## The Question: Why Did Centrifuge USDS APY Drop 2.95 Percentage Points

Centrifuge USDS dropped from 3.95% to 1.0% APY over a four-week period in October 2026, erasing 2.95 percentage points of annual yield on $327 million in total value locked. That collapse cost a $100,000 position $2,950 in annual income. The drop was not gradual rebalancing. It was a repricing event driven by changes in the underlying real-world asset loan portfolio that backs Centrifuge yield.
The driver was a combination of three factors: credit risk repricing after overdue loan accumulation, protocol fee introduction that reduced net yield to depositors, and competition from alternative Sky ecosystem vaults offering structurally higher rates on comparable risk. The collapse was not a utilization issue. Utilization-driven rate moves reverse when capital exits. This one did not.
This article documents the mechanism behind the rate collapse, provides the withdrawal timing framework for positions still in Centrifuge USDS, and ranks the Sky ecosystem alternatives that currently pay 3.3% to 4.75% on comparable or lower risk.
## How Centrifuge USDS Yield Actually Works

Centrifuge is a real-world asset protocol that tokenizes loans and securitizes them into onchain investment pools. The pools hold consumer credit, trade finance, real estate mortgages, and corporate receivables. Depositors supply USDC, DAI, or USDS into specific pools, and the protocol routes that capital to originators who issue loans in the real economy. The loans generate interest. Centrifuge distributes that interest to depositors after deducting protocol fees, originator fees, and any credit losses.
The yield depends on four variables: loan coupon rates, originator credit quality, protocol fee structure, and utilization rate within each pool. Unlike DeFi lending, where rates update every block based on onchain utilization, Centrifuge rates depend on the performance of real-world borrowers whose repayment capacity does not update in real time. This creates lag. A loan goes overdue in July. The protocol adjusts rates in September.
Sky (formerly MakerDAO) allocates a portion of its reserve backing into Centrifuge RWA vaults. Those allocations earn yield that flows into the Sky Savings Rate paid to holders of sUSDS. Centrifuge USDS pools are part of that reserve stack. When Centrifuge pool yields drop, Sky reallocates capital to higher-yielding alternatives, which further reduces utilization and compounds the rate decline for remaining depositors.
Centrifuge currently holds $1.628 billion in total value locked across all pools. The flagship pools are JTRSY, which holds U.S. Treasury bills and pays 3.30% APY, and JAAA, which holds AAA-rated collateralized loan obligations. The USDS-specific pool that collapsed from 3.95% to 1.0% was backed by a diversified RWA portfolio that included higher-risk corporate credit and trade finance loans.
## What Caused The 2.95 Percentage Point Collapse

The collapse was triggered by three concurrent events in September and October 2026\. First, Centrifuge reported more than $26 million in loans overdue for more than 90 days, concentrated in trade finance and emerging market receivables. That credit deterioration forced the protocol to reprice risk across affected pools. Yields on higher-risk tranches dropped as expected loss provisions increased. The USDS pool, which held exposure to these overdue loans, absorbed the repricing impact directly.
Second, Centrifuge introduced protocol fees in mid-2026 after operating fee-free since launch. The fee structure charges 25 to 50 basis points annually on assets under management. For a pool previously yielding 3.95% gross, a 40-basis-point fee reduces net depositor yield to 3.55%. Combined with loan repricing, net yields fell further. The 1.0% terminal rate suggests gross loan yields dropped to approximately 1.4% to 1.5%, implying significant credit deterioration or maturity mismatch in the underlying portfolio.
Third, Sky reallocated capital from lower-yielding Centrifuge pools into alternative RWA providers and onchain lending markets that offered structurally higher risk-adjusted returns. [Stablecoin yield platforms](https://altcoininvestor.com/how-to-earn-passive-income-stablecoins-2026/) like Morpho Blue offered 4.1% to 6.8% on USDC with transparent onchain collateral, making RWA pools paying below 2% unattractive. As Sky withdrew capital, utilization in the affected Centrifuge pool fell, which in an RWA context means fewer new loans were funded, reducing average portfolio yield further.
The collapse was not cyclical. Centrifuge TVL peaked at $2 billion in Q1 2026 and has declined 0.4% month-over-month to the current $1.628 billion. That trajectory reflects structural capital exit, not temporary rebalancing. Depositors who stayed in the USDS pool past mid-September locked in the lower rate for the duration of the loan terms backing the pool, which in trade finance and receivables can extend 90 to 180 days.
## Withdrawal Timing: When To Exit Centrifuge USDS Positions
Centrifuge pools do not offer instant withdrawal. Redemption depends on pool liquidity, which is a function of loan maturities and new deposit inflows. When you request a withdrawal, the protocol queues your redemption and fills it as loans mature and repay principal. In periods of capital outflow, that queue lengthens. The current average redemption time for Centrifuge RWA pools is 21 to 35 days, depending on pool-specific liquidity.
If you hold USDS in the affected pool paying 1.0%, you are earning $1,000 annually per $100,000 deployed. The opportunity cost against alternative Sky ecosystem vaults paying 3.3% to 4.75% is $2,300 to $3,750 per year per $100,000\. Over a 30-day redemption window, that opportunity cost is $192 to $313\. Withdrawal makes sense if you expect the rate to remain below 2.5% for longer than 60 days, because the lost yield during the redemption period will be recovered within the following 90 days in a higher-yielding alternative.
Do not cancel a redemption request once submitted unless new loan originations in the pool demonstrate a credible path back above 3.0% yield. Centrifuge governance publishes pool-level origination data monthly. If the USDS pool shows no new loan issuance for two consecutive months, the 1.0% rate is structural, not temporary.
For positions above $50,000, the annual opportunity cost of staying in a 1.0% pool when alternatives pay 4.0% is $1,500 per $50,000 deployed. That makes immediate withdrawal the correct decision even if redemption takes 35 days. For positions below $10,000, gas costs for exit and redeployment may consume 0.5% to 1.5% of capital depending on network congestion, which extends the breakeven horizon to 120 days. Smaller positions should wait for on-chain gas optimization or batch exits during low-congestion periods.
## Sky Ecosystem Alternatives Ranked By Current Rate And Risk
Sky's sUSDS token pays the Sky Savings Rate, currently 3.75% APY. The SSR is set by Sky governance and backed by a diversified reserve portfolio that includes USDC held in money-market-fund tokens (38% of reserves), RWA loans through partners like BlockTower, Centrifuge, and Monetalis (22% of reserves), and onchain DeFi lending. The rate has ranged from 3.75% to 9.0% over the past 18 months, with the recent decline reflecting Fed rate cuts and reduced onchain borrowing demand.
sUSDS is a direct alternative to Centrifuge USDS with meaningfully lower structural risk. Sky's reserve diversification reduces single-pool credit risk. The redemption process is instant for positions below the liquidity buffer threshold, which currently sits at approximately $50 million per day. For positions above $100,000, sUSDS offers better liquidity, higher current yield, and governance-backed rate stability compared to single-pool Centrifuge exposure.
Centrifuge's flagship JTRSY pool, which holds U.S. Treasury bills, currently pays 3.30% APY on $1.01 billion in assets. JTRSY is backed by a $1 billion Grove Basin facility that enables instant redemptions into USDC for positions up to $10 million. The credit risk is U.S. sovereign, not corporate or trade finance. For risk-adjusted income, JTRSY at 3.30% is preferable to the collapsed USDS pool at 1.0%, even though the headline rate is 45 basis points below sUSDS. The liquidity advantage and zero credit risk justify the rate discount for positions that require redemption flexibility.
Outside the Sky ecosystem, [DeFi lending platforms](https://defillama.com/protocol/centrifuge) offer comparable rates with full transparency. Aave V3 USDC supply currently pays 3.8% to 5.2% depending on utilization. Morpho Blue offers 4.1% to 6.8% through curated vaults. Spark pays 3.9% to 4.7%. Fluid pays 4.3% to 5.5%. All four platforms offer instant withdrawals subject to pool liquidity, which in established markets like USDC is functionally unlimited for positions below $1 million.
The trade-off is smart contract risk versus RWA credit risk. Aave and Morpho have been audited extensively and operate with onchain collateral that is visible in real time. Centrifuge RWA pools depend on offchain loan performance that updates monthly at best. For depositors prioritizing transparency and liquidity, onchain lending at 4.5% is structurally superior to RWA lending at 3.3%, even before adjusting for the redemption lag.
## When The 1.0% Rate Might Recover
Recovery depends on new loan origination in the affected pool and resolution of the $26 million in overdue loans. If Centrifuge successfully collects or writes off the overdue portfolio and replaces it with higher-quality loans paying 5% to 6.5% coupons, gross pool yields could return to the 3.0% to 3.5% range within six months. That timeline assumes active loan origination, which requires both originator appetite and depositor capital.
The current capital outflow trend suggests depositors are not waiting for recovery. Centrifuge TVL declined from $2 billion to $1.628 billion over six months, a 18.6% drawdown. That pace reflects sustained withdrawal pressure, not temporary volatility. Governance has not announced pool-specific interventions to restore yields in the USDS pool, which means the 1.0% rate is being treated as market-clearing rather than as a crisis requiring subsidy or restructuring.
Monitor Centrifuge governance proposals for fee reductions, loan portfolio restructuring, or capital injection commitments. If governance votes to waive protocol fees temporarily or to buy out overdue loans at par, those actions would signal credible recovery intent. Absent those moves, the 1.0% rate reflects the market's assessment of the pool's loan portfolio quality, and that assessment will not improve without new capital or loan origination.
For depositors in emerging markets where stablecoin yield serves as dollar-substitute savings, the calculus is different. A 1.0% dollar yield still exceeds local currency deposit rates in Argentina (negative real after inflation), Turkey (negative real), Nigeria (barely positive real), and Lebanon (frozen deposits). In those contexts, the question is not whether 1.0% is competitive against DeFi alternatives, but whether it is competitive against no access to dollar yield at all. For users in those markets, Centrifuge USDS at 1.0% remains a viable savings mechanism if capital controls or exchange restrictions block access to higher-yielding alternatives.
## What Centrifuge Rate Collapses Signal About RWA Yield Durability
RWA yield is less transparent and less liquid than onchain DeFi yield, but it has historically been more stable during periods of low onchain borrowing demand. That stability held through 2023 and 2024, when DeFi lending rates fell below 2% but RWA pools maintained 4% to 6% through exposure to corporate credit and trade finance. The October 2026 collapse breaks that pattern. It demonstrates that RWA yields are subject to credit deterioration that can reprice faster than depositor expectations adjust.
The $26 million in overdue loans represents 1.6% of Centrifuge's total $1.628 billion TVL, but it is concentrated in specific pools. For the USDS pool, the overdue exposure was likely 8% to 12% of pool assets, which is sufficient to force a full repricing of expected returns. This concentration risk is inherent in single-pool RWA strategies. Diversification across multiple Centrifuge pools or across RWA providers reduces that risk but does not eliminate it.
The lesson is that RWA yield must be evaluated on credit fundamentals, not on headline APY. A 5.5% RWA pool backed by trade finance receivables in Vietnam or Nigeria carries meaningfully higher credit risk than a 3.3% pool backed by U.S. Treasury bills. The rate differential reflects that risk. Depositors who chase the higher headline rate without evaluating the underlying loan portfolio will absorb repricing losses when loans go overdue.
Centrifuge publishes loan-level data for most pools, including originator identity, loan terms, repayment status, and collateral type. That data is accessible through the Centrifuge app and through third-party analytics platforms like RWA.xyz. Depositors should review that data monthly for any pool yielding above 4.0%. A 4.5% yield on trade finance should prompt questions about originator track record, borrower geography, and historical default rates. A 3.3% yield on Treasury bills does not.
## The Takeaway
The Centrifuge USDS collapse from 3.95% to 1.0% was a credit repricing event, not a utilization anomaly. It was driven by $26 million in overdue loans, new protocol fees, and capital reallocation by Sky into higher-yielding alternatives. The 1.0% rate will not recover without new loan origination or governance intervention, neither of which is currently visible. Positions above $50,000 should exit immediately and redeploy into sUSDS at 3.75%, JTRSY at 3.30%, or onchain lending at 4.0% to 5.5%. Smaller positions should evaluate gas costs and wait for network optimization before moving. RWA yield requires credit diligence. The rate differential between 3.3% and 5.5% exists because the risk differential is real, and that risk reprices when loans go overdue. Transparency and liquidity favor onchain alternatives for depositors who can access them. For users in capital-controlled economies, even 1.0% dollar yield remains structurally valuable if it is the only accessible alternative to frozen local currency deposits.
## Frequently Asked Questions
### Why did Centrifuge USDS APY drop from 3.95% to 1.0%?
The 2.95 percentage point collapse resulted from three concurrent factors: more than $26 million in loans overdue for over 90 days forced credit risk repricing, new protocol fees of 25 to 50 basis points reduced net yields, and Sky reallocated capital to higher-yielding alternatives like Morpho Blue (4.1% to 6.8%) and onchain lending. The drop was not utilization-driven. It reflects structural deterioration in the underlying RWA loan portfolio quality and repricing of expected credit losses.
### How long does it take to withdraw from Centrifuge USDS pools?
Redemption takes 21 to 35 days on average, depending on pool liquidity and loan maturity schedules. When you request withdrawal, the protocol queues your redemption and fills it as loans mature and repay principal. In periods of capital outflow, the queue lengthens. Centrifuge RWA pools do not offer instant redemption because capital is deployed into real-world loans with fixed terms. For positions above $50,000, the opportunity cost of waiting justifies immediate exit even with a 35-day redemption window.
### What are the best alternatives to Centrifuge USDS at 1.0% yield?
Sky's sUSDS pays 3.75% with instant redemption and diversified reserve backing. Centrifuge's own JTRSY pool pays 3.30% backed by U.S. Treasury bills with a $1 billion instant redemption facility. Onchain lending offers higher rates: Aave V3 USDC pays 3.8% to 5.2%, Morpho Blue pays 4.1% to 6.8%, Spark pays 3.9% to 4.7%, and Fluid pays 4.3% to 5.5%. All provide better liquidity and transparency than the collapsed USDS pool.
### Will Centrifuge USDS rates recover above 3.0%?
Recovery depends on new loan origination and resolution of $26 million in overdue loans. If Centrifuge replaces the overdue portfolio with higher-quality loans paying 5% to 6.5% coupons, gross yields could return to 3.0% to 3.5% within six months. However, TVL declined 18.6% from $2 billion to $1.628 billion over six months, and governance has not announced pool-specific interventions. The 1.0% rate reflects market assessment of current loan portfolio quality and will not improve without new capital or origination.
### What does the Centrifuge collapse reveal about RWA yield risk?
RWA yields depend on offchain loan performance that updates monthly at best, creating lag between credit deterioration and rate adjustment. The $26 million in overdue loans represented only 1.6% of total Centrifuge TVL but was concentrated enough in the USDS pool (likely 8% to 12% of pool assets) to force full repricing. Single-pool RWA exposure carries concentration risk that diversification across pools or providers reduces but does not eliminate. Credit diligence is mandatory for any RWA pool yielding above 4.0%.
The Weekly Yield Report
You have just traced a 2.95pp yield collapse through RWA credit repricing, protocol fees, and capital reallocation. Those drivers will reappear in other single-pool exposures.
Every Thursday: where crypto yield actually is - stablecoins, liquid staking and DeFi lending, with the risk named next to the rate and what changed since last week.
[Get it free every Thursday](#/portal/signup)
Free. No trade calls, no allocations, no hype. Unsubscribe in one click.
### Does Vanguard Offer Crypto ETFs? Direct Staking Yields vs. Tax Wrappers
URL: https://altcoininvestor.com/cryptocurrency-etf-vanguard/
Last updated: 2026-10-19T16:06:03.000Z
## Vanguard's Position: No Proprietary Crypto Products

Vanguard does not offer its own cryptocurrency ETFs. The firm has no plans to launch Bitcoin, Ethereum, or any other digital asset product under its own brand.
As of December 2, 2025, Vanguard brokerage customers can trade select third-party cryptocurrency ETFs and mutual funds that primarily hold Bitcoin, Ether, XRP, Solana, and other regulated digital assets. But these are products issued by BlackRock, Fidelity, Grayscale, Bitwise, and Morgan Stanley, not Vanguard.
The firm's official position centers on cash flow. Vanguard focuses on securities that generate transparent, recurring income such as dividends and bond interest. Cryptocurrencies do not fit that framework, and the company has stated it will not change course.
This stance is notable. Vanguard initially blocked customer access to spot Bitcoin and Ethereum ETFs from January 2024 through early December 2025, even after the SEC approved them. That restriction triggered the #BoycottVanguard campaign and visible advisor outflows to Fidelity and Schwab. The December 2025 policy reversal allows trading but does not signal product development.
New CEO Salim Ramji, a former BlackRock ETF executive, has not announced any shift in Vanguard's product roadmap. For now, the answer to "Does Vanguard offer crypto ETFs?" is no.
## What Crypto ETFs Are Available Through Vanguard Brokerage

Vanguard customers can trade third-party crypto ETFs. The products available fall into three categories: spot Bitcoin ETFs, spot Ethereum ETFs, and staking-enabled ETFs.
### Spot Bitcoin ETFs
Morgan Stanley Bitcoin Trust (MSBT) charges 0.14% annually, the lowest expense ratio in the category as of October 2026\. Grayscale Bitcoin Mini Trust carries a 0.15% fee. Both iShares Bitcoin Trust (IBIT) and Fidelity Wise Origin Bitcoin Fund (FBTC) charge 0.25%.
Grayscale Bitcoin Trust (GBTC), the legacy product that converted from a closed-end fund, still charges 1.50%. That is six times higher than the industry average.
On a $10,000 investment held for 10 years, MSBT would cost approximately $145 in cumulative fees. GBTC would cost $1,550\. The difference is $1,405, and that assumes no appreciation. In practice, the drag compounds as the portfolio grows.
### Spot Ethereum ETFs
iShares Ethereum Trust (ETHA) by BlackRock charges 0.25%. Bitwise Ethereum ETF (ETHW) charges 0.20%. Neither product stakes its Ethereum holdings, so shareholders receive zero yield despite the underlying asset's staking capability.
This is the core opportunity cost. Ethereum natively generates 2.78% to 3.3% APY when staked. A spot ETF holder pays 0.20-0.25% annually and earns nothing. The net drag is 3% to 3.5% per year compared to direct ownership.
### Staking-Enabled ETFs
On March 17, 2026, the SEC and CFTC issued a joint interpretive release classifying Ethereum staking rewards as non-securities activity. That regulatory green light allowed issuers to launch staking ETFs.
BlackRock's iShares Staked Ethereum Trust (ETHB) stakes 70% to 95% of its holdings. Gross staking returns measure 3.1% to 3.3%, but after fund fees and custody costs, net distributions to shareholders fall to 1.9% to 2.6%.
Morgan Stanley launched Ethereum and Solana ETFs at 0.14% in late July 2026 with staking rewards included. Bitwise followed with Solana staking products.
These products solve the zero-yield problem but not the fee problem. Every layer between you and the validator reduces what you keep.
For a detailed comparison of leading products and their fee structures, see [Best Crypto ETFs Compared: Fees, Holdings, Direct Staking](https://altcoininvestor.com/best-crypto-etf/).
## Direct Staking Yields vs. ETF-Wrapped Yields

The yield gap between direct staking and ETF wrappers is measurable.
### Ethereum Staking
Native staking on Ethereum averages 2.78% to 3.3% APR as of mid-2026\. Validators who run MEV-Boost software capture an additional 0.5% to 1% from transaction ordering fees.
Solo validators who operate their own hardware and manage keys directly keep 100% of gross rewards. No intermediary takes a cut.
Lido, the largest liquid staking protocol with over $27 billion in total value locked, charges a 10% protocol fee. Depositing any amount of ETH yields roughly 2.3% APY after fees. You receive stETH, a liquid token that can be traded or used in DeFi while your ETH remains staked.
Centralized exchanges including Coinbase, Kraken, and Binance each take 25% or more of gross staking rewards. Net yield to users typically lands between 2.5% and 3%.
Spot Ethereum ETFs such as ETHA charge 0.25% annually and generate zero yield. The net result is a -0.25% drag relative to holding ETH in a wallet.
Staking Ethereum ETFs such as ETHB deliver 1.9% to 2.6% net after fees and custody costs. That is 0.4% to 1.4% below what you would earn through Lido and 0.7% to 1.4% below solo staking.
### Solana Staking
Solana staking yields currently run between 5.2% and 8% APY, depending on validator selection and commission rates. Validators charge 5% to 10%, so net yields for delegators range from 4.6% to 7.6%.
No spot Solana ETF has been approved as of October 2026\. Staking-enabled Solana products exist but are limited to issuers like Morgan Stanley and Bitwise. Fee structures for these products have not been disclosed in full, but the pattern holds: every wrapper layer reduces your take-home yield.
### The Yield Comparison Table
Here is what a $10,000 Ethereum position earns annually across different custody and staking methods:
- Solo validator (3.3% gross, 0% fee): $330 per year
- Lido liquid staking (3.3% gross, 10% fee): $230 per year
- Centralized exchange (3.3% gross, 25% fee): $250 per year
- Staking ETF (3.3% gross, fees and custody costs): $190 to $260 per year
- Spot ETF (0% yield, 0.25% fee): -$25 per year
The difference between solo staking and a spot ETF is $355 annually on $10,000\. Over 10 years, assuming no price appreciation and no compounding, that is $3,550 in foregone income.
If you reinvest staking rewards, the gap widens. Compounding 3.3% annually turns $10,000 into $13,842 after 10 years. A spot ETF charging 0.25% with zero yield leaves you with $9,753 after fees. The difference is $4,089.
For a breakdown of how staking income accrues across chains and what inflation does to real returns, see [Crypto Staking Returns: Where Yield Comes From And What It Costs](https://altcoininvestor.com/crypto-staking-returns-across-chains/).
## The Tax Reality: Direct Staking Does Not Eliminate Tax Burden
One argument for holding crypto in an ETF wrapper is tax deferral. If you hold an ETF in an IRA, you avoid annual capital gains tax on price appreciation. Staking rewards inside a staking ETF may also defer taxes until withdrawal.
But direct staking does not escape taxation.
The IRS treats staking rewards as ordinary income at fair market value the moment you gain dominion and control. That typically means the moment the reward appears in your wallet. You owe income tax whether or not you sell.
In 2023, the IRS issued Rev. Rul. 2023-14, confirming this position. Staking rewards are taxed as ordinary income at receipt, not when sold. For detailed guidance on how the IRS defines "dominion and control," see [Crypto Staking Tax Treatment: What The IRS Actually Says](https://altcoininvestor.com/crypto-staking-tax-treatment-irs/).
Federal income tax on staking rewards ranges from 10% to 37%, depending on your marginal bracket. State income tax adds another layer.
In New York City, stacking federal (37%), state (11%), and net investment income tax (3.8%) can push the marginal rate on staking income to 55.6%. A 3% staking yield becomes 1.3% after taxes.
In Texas, Florida, Wyoming, Nevada, Washington, South Dakota, Alaska, Tennessee, and New Hampshire, there is no state income tax. The same 3% yield becomes roughly 2% after federal tax only, assuming a 37% marginal rate.
Geography matters. Moving from New York to Texas saves 10 to 14 percentage points on staking income.
### Do Staking ETFs Solve the Tax Problem?
No.
Staking distributions from ETFs may be taxable as ordinary income the year they are distributed, even if reinvested. The tax treatment depends on whether the ETF is held in a taxable account or a tax-advantaged account like an IRA.
In a taxable account, staking distributions are ordinary income. You still owe tax at receipt. The ETF structure does not change that.
In an IRA, the distributions grow tax-deferred, but you pay ordinary income tax on the entire withdrawal at retirement. You do not benefit from the lower long-term capital gains rate.
The fee layer (0.20% to 0.25%) is a guaranteed drag that cannot be recovered. Even if you defer taxes, you cannot defer fees. That cost compounds every year.
For tools that help calculate tax liability on staking income across jurisdictions, see [Best Crypto Tax Software For DeFi Yield And Staking Income](https://altcoininvestor.com/best-crypto-tax-software-defi-yield-staking/).
## When an ETF Wrapper Makes Sense
There are scenarios where a crypto ETF is the right choice, even with the fee drag and yield gap.
### Regulatory Simplicity
ETFs trade on regulated exchanges. Custody is handled by a qualified custodian. You do not manage private keys, worry about wallet security, or navigate DeFi protocols.
For individuals who lack technical confidence or who prefer to keep all investments under one brokerage roof, an ETF removes operational risk.
### Tax-Advantaged Accounts
If you hold crypto in an IRA, 401(k), or other tax-deferred account, an ETF may be your only option. Most custodians do not allow direct cryptocurrency holdings in retirement accounts.
In that case, the question is not "ETF or direct staking?" but "ETF or nothing." A staking ETF earning 1.9% to 2.6% net beats a spot ETF earning 0% minus fees.
### Estate Planning
ETFs simplify inheritance. When you die, your heirs receive shares with a step-up in cost basis. No one needs to recover seed phrases, manage hardware wallets, or interact with smart contracts.
Direct crypto holdings require careful estate planning. If your heirs do not have access to your private keys, the funds are permanently lost. That risk is real.
### When You Value Liquidity Over Yield
Staking ETFs do not impose lock-up periods. You can sell shares any time the market is open.
Direct staking on Ethereum requires a validator exit queue. During periods of high demand, unstaking can take days or weeks. Solana has a multi-day unbonding period. Liquid staking tokens like stETH trade on secondary markets, but those markets can experience slippage during stress.
If you need guaranteed liquidity with no protocol-level delays, an ETF is faster.
## When Direct Staking Makes Sense
Direct staking is the better choice when you can tolerate the operational requirements and want to maximize yield.
### Solo Validators
Running your own Ethereum validator requires 32 ETH (approximately $64,000 at $2,000 per ETH), technical knowledge, and 24/7 uptime. You earn 3.0% to 3.3% base yield plus MEV rewards.
There is slashing risk. If your validator goes offline or signs conflicting attestations, you can lose a portion of your stake. Penalties are typically small (a few basis points) unless you commit a severe protocol violation.
Solo validators keep 100% of rewards. No intermediary takes a cut. Over 10 years, that difference is worth thousands of dollars on a 32 ETH position.
### Liquid Staking via Lido
Lido allows you to stake any amount of ETH with no minimum. You receive stETH, a token that tracks your staked ETH plus accrued rewards.
Lido charges a 10% protocol fee, bringing net yield to approximately 2.3%. You retain liquidity. stETH can be traded on Uniswap, Curve, and other DEXs, or used as collateral in lending protocols like Aave.
The trade-off is smart contract risk. If Lido's contracts are exploited or a majority of its validators are slashed, you could lose funds. As of October 2026, Lido manages over $27 billion in TVL with no major incidents, but the risk is non-zero.
### When You Live in a No-Tax State
If you reside in Texas, Florida, Wyoming, or another state with no income tax, the after-tax yield on direct staking is 10 to 14 percentage points higher than it would be in New York or California.
A 3.3% staking yield taxed at 37% federal rate leaves you with 2.08%. The same yield taxed at 37% federal plus 11% state leaves you with 1.3%. Over 10 years on a $50,000 position, that is a $3,900 difference.
Geography is a variable you can control. If you are considering relocation for tax purposes, staking income is one data point in that calculation.
For a comprehensive look at how staking works and what you earn across different networks, see [What Is Staking? How It Works And What It Pays](https://altcoininvestor.com/what-is-crypto-staking/).
## Fee Drag Over Time: The Compounding Cost
Expense ratios are quoted as annual percentages, but the real cost is what they do to terminal wealth.
On a $10,000 investment over 10 years at 8% annual appreciation:
- 0.14% fee (MSBT): terminal value of $21,434
- 0.25% fee (IBIT/FBTC): terminal value of $21,200
- 1.50% fee (GBTC): terminal value of $19,079
The difference between the lowest-cost and highest-cost product is $2,355 on $10,000\. That is 11% of your initial capital, lost to fees.
If you assume 12% annual appreciation (Bitcoin's long-term average), the gap widens:
- 0.14% fee: $30,908
- 1.50% fee: $26,533
The spread is now $4,375, or 43.7% of your initial investment.
Every 10 basis points of fee costs you roughly 1% of terminal wealth over a decade. That relationship is linear at small fee levels and accelerates as fees rise above 0.50%.
Staking yield works the same way in reverse. Earning 3.3% annually on a $10,000 position for 10 years, reinvested, produces $13,842\. Earning 1.9% produces $12,079\. The difference is $1,763, or 12.7% of the ending balance.
These are not small numbers. They are the difference between meeting a financial goal and falling short.
## Regulatory and Protocol Risks
Neither ETFs nor direct staking are risk-free.
### ETF Regulatory Risk
The SEC approved spot Bitcoin and Ethereum ETFs in 2024 and 2026, but that approval is not permanent. A future administration could reverse course, impose new restrictions, or deny applications for staking products on other assets.
Staking ETFs depend on ongoing regulatory clarity. The March 17, 2026 SEC-CFTC interpretive release classified ETH staking as non-securities activity, but that guidance is not binding on future commissions.
If the SEC reverses its position, staking ETFs could be forced to liquidate staked positions, convert to spot-only products, or shut down entirely. Shareholders would face forced sales, tax events, and potential losses.
### Protocol and Slashing Risk
Validators who sign conflicting attestations or remain offline for extended periods can be slashed. Penalties typically range from 0.5 ETH to a full validator balance in extreme cases.
Solo validators bear this risk directly. Liquid staking protocols like Lido distribute slashing risk across thousands of validators, reducing the impact on any single depositor.
Staking ETFs delegate to professional validators but are not immune. If a validator used by BlackRock or Bitwise is slashed, the ETF's net asset value declines. Shareholders bear that loss proportionally.
### Unstaking Liquidity Risk
Ethereum's validator exit queue can create liquidity delays. During periods of high unstaking demand (such as a market crash), it can take days or weeks to exit a validator position.
Liquid staking tokens like stETH trade on secondary markets, but those markets can depeg during stress. In May 2022, stETH traded as low as 0.93 ETH per stETH, a 7% discount. Selling at a discount locks in a loss that would not occur if you waited for the validator exit.
ETFs solve this problem. Shares trade continuously during market hours with tight bid-ask spreads. You can exit in seconds, not days.
## The Takeaway
Vanguard does not offer cryptocurrency ETFs and has no plans to launch one. Customers can trade third-party products from BlackRock, Fidelity, Grayscale, Bitwise, and Morgan Stanley, but those products carry fees and opportunity costs.
Spot Bitcoin ETFs charge 0.14% to 1.50% annually and generate zero yield. Spot Ethereum ETFs charge 0.20% to 0.25% and also generate zero yield, despite Ethereum's native staking capability.
Staking-enabled ETFs deliver 1.9% to 2.6% net after fees and custody costs. That is 0.4% to 1.4% below what you would earn through liquid staking protocols like Lido and 0.7% to 1.4% below solo validator yields.
Direct staking earns 2.3% to 3.3% on Ethereum and 5.2% to 8% on Solana, depending on commission and validator selection. The trade-off is operational complexity, tax reporting burden, and protocol risk.
ETFs make sense for tax-advantaged accounts, estate planning, and investors who prioritize regulatory simplicity and liquidity over yield maximization.
Direct staking makes sense for technically capable investors in low-tax jurisdictions who can tolerate key management, smart contract risk, and the tax obligation that accrues at receipt of rewards.
The yield gap is measurable. On a $10,000 Ethereum position held for 10 years, the difference between solo staking at 3.3% and a spot ETF at -0.25% is $4,089 after compounding.
Fee drag is permanent. Yield opportunity is finite. The numbers tell you which path costs less.
For a detailed primer on how staking works and what it pays across networks, see [What Is Staking? A Complete Beginner's Guide With Real Numbers](https://altcoininvestor.com/what-is-crypto-staking-beginners-guide/).
## Frequently Asked Questions
### Does Vanguard offer its own cryptocurrency ETFs?
No. Vanguard does not offer its own cryptocurrency ETFs and has no plans to launch Bitcoin, Ethereum, or other digital asset products. As of December 2025, Vanguard brokerage customers can trade select third-party crypto ETFs from issuers like BlackRock, Fidelity, Grayscale, Bitwise, and Morgan Stanley, but these are not Vanguard-branded funds. The firm's focus remains on securities that generate transparent cash flow such as dividends and bond interest.
### What are the lowest-cost crypto ETFs available through Vanguard brokerage?
Morgan Stanley Bitcoin Trust (MSBT) charges 0.14% annually, the lowest spot Bitcoin ETF fee as of October 2026\. Grayscale Bitcoin Mini Trust charges 0.15%. For Ethereum, Bitwise Ethereum ETF (ETHW) charges 0.20% and iShares Ethereum Trust (ETHA) charges 0.25%. Morgan Stanley also launched Ethereum and Solana staking ETFs at 0.14% in July 2026\. Grayscale Bitcoin Trust (GBTC) remains the most expensive at 1.50%.
### How much more yield do I earn from direct staking compared to a staking ETF?
Direct Ethereum staking via Lido earns approximately 2.3% net after the 10% protocol fee. Solo validators earn 3.0-3.3% with no intermediary fees. Staking ETFs like BlackRock's ETHB deliver 1.9-2.6% net after fund fees and custody costs. That is 0.4-1.4% less than direct staking. On a $10,000 position over 10 years, the compounding difference is $1,200 to $1,800 in foregone income.
### Are staking rewards from crypto ETFs taxed differently than direct staking?
No. Staking distributions from ETFs held in taxable accounts are taxed as ordinary income, the same as direct staking rewards. The IRS treats both as income at fair market value when received. ETFs held in tax-advantaged accounts like IRAs defer taxes until withdrawal, but you still pay ordinary income tax rates at retirement, not the lower long-term capital gains rate. The ETF wrapper does not eliminate tax, it only defers it in qualified accounts.
### When does a crypto ETF make more sense than direct staking?
Crypto ETFs make sense when you hold them in tax-advantaged accounts like IRAs where direct crypto custody is not permitted, when you lack technical confidence to manage private keys and interact with staking protocols, when you prioritize regulatory simplicity and professional custody, or when you need guaranteed liquidity without protocol-level unbonding delays. Estate planning also favors ETFs, as heirs receive shares with a step-up in cost basis and no need to recover private keys.
Tool mentioned above
Koinly
Koinly imports from 800+ exchanges and wallets and handles the DeFi cases most tools get wrong - rebasing tokens, LP positions, staking rewards.
[Try Koinly](https://koinly.io/?via=F6E2E35A&utm%5Fsource=affiliate)
We may earn a commission if you sign up through this link, at no cost to you. It does not change what gets recommended.
The Weekly Yield Report
You just compared ETF fees from 0.14% to 1.50% and direct staking yields from 2.3% to 8%. Those numbers shift every quarter as new products launch and fee competition continues.
Every Thursday: where crypto yield actually is - stablecoins, liquid staking and DeFi lending, with the risk named next to the rate and what changed since last week.
[Get it free every Thursday](#/portal/signup)
Free. No trade calls, no allocations, no hype. Unsubscribe in one click.
### How To Exit When Fluid USDC Drops 2.34 Points In One Week
URL: https://altcoininvestor.com/fluid-lending-rate-drop-should-i-move/
Last updated: 2026-10-19T15:04:48.000Z
## What A 2.34 Point Rate Drop Means For Your Position

Fluid USDC lending paid 7.77% APY two weeks ago. It now pays 5.43% on $204M TVL. That 2.34 percentage-point drop costs a $100,000 position $2,340 annually, or $195 per month. The question is whether you exit immediately to capture higher rates elsewhere, or whether you wait for utilization-driven reversion.
This article covers the decision tree for positions between $500 and $1M, the gas cost break-even calculations that determine when migration makes economic sense, and the current alternative lending positions ranked by rate stability and comparable smart contract risk. It uses Fluid's historical rate volatility pattern to show whether 5.43% represents a floor or a midpoint, and it names the specific data points you check within 24 hours to make the call.
The income mechanism is straightforward. You decide within one business day whether to migrate capital from Fluid to a higher-yielding alternative, capturing 1 to 2.5 percentage points in additional annual yield, or you determine that gas costs and withdrawal queue risk exceed the gain. For a $100,000 position, a 1.5 percentage point differential equals $1,500 per year. Gas costs on Ethereum are currently $0.07 to $0.15 per withdrawal at 0.14 Gwei. The math is clear once you run it.
## Fluid's Rate Volatility Pattern And Historical Context
Fluid combines lending and DEX liquidity into one pool, allowing tighter utilization and higher supply rates than Aave or Compound at similar borrow demand. The protocol's Smart Collateral and Smart Debt primitives let LP positions act as both collateral and earning assets simultaneously, which increases capital efficiency. The trade-off is rate volatility. When borrow demand shifts or when large borrowers repay positions, supply rates compress quickly.
As of October 6, 2026, Fluid USDC on Ethereum paid 4.83% APY with $130M TVL. On Arbitrum it paid 4.38% with $61M TVL. The protocol's all-time high TVL was $2.684B on October 9, 2025\. By October 18, 2026, total TVL across all assets had declined to $880.89M. A 7.77% to 5.43% drop represents a 234 basis-point move, which is extreme but consistent with the protocol's utilization-driven rate model.
Fluid rates have swung from 5.19% on September 15, 2026, to 4.83% on October 6, showing 50 to 100 basis-point moves over two-week periods. A 234 basis-point drop typically follows one of three events: large borrower repayments reducing borrow APY, TVL inflows from yield-chasers rotating in after rate compression elsewhere, or protocol governance adjustments to debt ceilings. The difference between a temporary compression and a sustained floor depends on whether borrow demand returns.
Fluid's rate model is utilization-driven, not governance-set like Sky's DSR. Rates revert if borrow demand returns, if TVL exits and reduces depositor supply, or if new borrowing pressure builds. Historical precedent shows that rates typically hold within plus or minus 50 basis points for 7 to 14 days unless a new governance cap increase or protocol-wide liquidity shock occurs. September's spike to 5.2% held for more than three weeks before compressing in October. That pattern suggests 5.43% may not be the floor.
Before you exit, check current utilization on [DeFiLlama's Fluid protocol page](https://defillama.com/protocol/fluid). If utilization is below 60%, borrow demand is soft and rates are unlikely to revert quickly. If utilization is above 75%, the protocol is approaching the steep section of its interest-rate curve and rates may revert within days. If utilization is between 60% and 75%, you are in the judgment zone where your position size and alternative rate differential determine the call.
## Gas Cost Break-Even Calculations By Position Size
Ethereum gas fees on October 19, 2026, are 0.14 Gwei at normal priority, which translates to approximately $0.007 for a standard ETH transfer and $0.06 for a token swap. A USDC transfer burns roughly 45,000 units of gas, closer to 65,000 when the receiving address has never held USDC. At current base fees and $3,000 ETH, that works out to $0.07 to $0.15 per withdrawal.
For positions under $500, gas costs represent 0.014% to 0.03% of principal. A 1.5 percentage point rate differential yields $7.50 per year on a $500 position. If gas costs $0.15 to exit Fluid and $0.15 to enter an alternative, total migration cost is $0.30\. You recover that cost in 14 days at a 1.5 point differential. The break-even is fast, but you must account for approval transaction costs if you are interacting with a new protocol for the first time. Approval transactions add $5 to $15 in first-time costs for DeFi users interacting with fToken contracts or alternative lending pools.
For positions between $500 and $10,000, break-even windows are 2 to 4 weeks at a 50 basis-point rate difference. If you expect Fluid's rate to revert within that window, holding is rational. If you expect the rate to remain compressed or compress further, immediate exit captures the differential. At a $10,000 position, a 1 percentage point differential equals $100 annually, or $8.33 per month. Gas costs are $0.30 to $0.50 for a round-trip migration. You recover migration costs in 1 to 2 days.
For positions above $10,000, exit rationale becomes APY rate delta, not gas. A $100,000 position earning 1.5 percentage points more annually captures $1,500\. Gas costs are irrelevant. The decision depends entirely on whether you believe Fluid's rate will revert, and on what timeline. If you do not have conviction that reversion will occur within 30 days, migrate immediately.
One critical consideration: Fluid uses an Automated Debt Ceiling that increases per block, creating a smoothing curve that prevents sudden large withdrawals. During high-exit periods, users may face queue delays. If you are exiting a six-figure position, check current ceiling utilization on DeFiLlama before initiating withdrawal. If utilization is above 90%, plan for a multi-day redemption window. Aave and Compound offer instant redemption. Fluid does not guarantee it.
## Current Alternative USDC Lending Rates Ranked By Stability
As of October 6, 2026, Maple syrupUSDC paid 5.18% on $2.6B TVL. Aave v3 on Ethereum paid 4.60% with $128M USDC TVL. Across the largest pools as of mid-October, Maple is at 5.1%, Aave Base at 5.6%, Kamino on Solana at 5.9%, Fluid Arbitrum at 6.2%, and Compound at 6.2%. Those are the alternatives you evaluate against Fluid's current 5.43% Ethereum rate.
Maple syrupUSDC offers 5.18% with $2.6B TVL, which represents deep liquidity and institutional credit risk rather than smart contract risk. Maple operates as a credit marketplace where institutions borrow against real-world revenue streams. The trade-off is a 30-day withdrawal queue, which means you cannot exit instantly. If you are comfortable with the credit risk and the withdrawal delay, Maple offers 0.25 percentage points less than Fluid Arbitrum but substantially more liquidity and a more stable rate environment. Maple's rate has held within 10 basis points for six weeks.
Aave v3 on Ethereum offers 4.60% with $128M USDC TVL. Aave has the deepest audit history in DeFi and instant redemption during normal market conditions. The rate is 83 basis points below Fluid's current 5.43%, which means a $100,000 position would earn $830 less annually. For conservative allocators who prioritize liquidity and contract maturity over rate optimization, Aave is the benchmark. If Fluid's rate compresses below 4.60%, Aave becomes the rational default unless you are willing to accept elevated smart contract risk for marginal yield.
Morpho Blue curated vaults offer rates between 4.1% and 6.8%, depending on the curator and the underlying collateral composition. Morpho is a meta-lending protocol where curators select markets and manage risk parameters. The upside is higher potential yield. The downside is curator risk, which adds a layer of counterparty exposure beyond the base protocol smart contract risk. If you are evaluating Morpho, verify that the curator publishes on-chain performance history and that the vault's collateral is not concentrated in a single borrower. Curator transparency is uneven.
Fluid Arbitrum offers 4.38% with $61M TVL as of October 6, 2026\. That is 105 basis points below Fluid Ethereum's current 5.43% rate. Lower TVL on Arbitrum typically correlates with lower borrow demand, which produces lower supply rates. If you are migrating to capture rate differential, Fluid Arbitrum is not the destination unless you expect utilization to spike on that chain specifically.
For positions under $1,000, consider migrating to Solana or Base equivalents where transaction fees are sub-cent. Kamino on Solana offers 5.9% with lower absolute TVL but substantially lower exit costs. If you are optimizing for small positions, Layer 2 and alternative Layer 1 protocols eliminate gas as a meaningful decision factor.
One additional alternative: [stablecoin income strategies beyond lending](https://altcoininvestor.com/how-to-earn-passive-income-stablecoins-2026/) include yield-bearing tokens and structured products that may offer more stable returns in environments where lending rate volatility exceeds your risk tolerance.
## Smart Contract Risk And Security Considerations
Fluid holds $1B TVL with audits by Statemind and OpenZeppelin. The protocol launched in February 2024, which gives it approximately two years of operating history as of this article's publication. That is a shorter track record than Aave, which has operated since 2020, or Compound, which launched in 2018\. Shorter operating history increases tail risk. The probability of an undiscovered critical vulnerability decreases with time and with cumulative value secured.
On May 31, 2026, Fluid experienced a $215,000 exploit. That represents 0.024% of TVL at the time, which is a low relative impact but material for protocol risk assessment. The exploit was contained and the protocol continued operating. For new allocators, this history is relevant context. The question is not whether an exploit occurred, but whether the protocol's response and subsequent security upgrades demonstrate operational competence.
Fluid's architecture introduces novel risk compared to Aave and Compound. The protocol's integration of lending and DEX liquidity into a single pool increases capital efficiency but also increases the surface area for potential exploits. Smart Collateral and Smart Debt primitives are innovative but unproven at the scale of multi-billion-dollar TVL. If you are comparing Fluid to Aave on the basis of smart contract risk, Aave has the longer operating history and the larger bug-bounty program.
One additional consideration: Fluid is ERC-4626 compatible, which means third-party vaults can wrap Fluid exposure. If you are interacting with Fluid through a vault wrapper rather than directly, check the wrapper contract's audit history separately. Wrapper risk compounds base protocol risk.
For allocators prioritizing rate over security, the current decision is whether 5.43% on Fluid justifies the incremental risk compared to 4.60% on Aave. That 83 basis-point differential equals $830 annually on a $100,000 position. If you would accept a $830 annual cost to reduce the probability of a six-figure loss, Aave is the rational choice. If you are optimizing for yield and accept the risk, Fluid remains competitive at 5.43%.
## The 24-Hour Decision Tree For Positions Above $10,000
If your position is above $10,000, run this sequence within 24 hours:
**Step 1:** Check Fluid's current utilization rate on DeFiLlama. If utilization is below 60%, borrow demand is soft and rate reversion is unlikely in the next 7 to 14 days. If utilization is above 75%, the protocol is approaching the steep section of its interest-rate curve and rates may spike within 48 to 72 hours. If utilization is between 60% and 75%, proceed to Step 2.
**Step 2:** Compare Fluid's current 5.43% rate to Maple's 5.18%, Aave's 4.60%, and Compound's 6.2%. Maple offers 25 basis points less with deeper liquidity and institutional credit risk. Aave offers 83 basis points less with the longest operating history and instant redemption. Compound offers 77 basis points more with similar smart contract risk and slightly lower TVL. If Compound's 6.2% rate has held stable for more than 7 days, that is your migration target unless you have specific concerns about Compound's current utilization or governance.
**Step 3:** Check Fluid's Automated Debt Ceiling utilization. If the ceiling is above 90%, large withdrawals may queue for multiple blocks or days. If you need instant liquidity, Aave is the safer exit route even at 83 basis points lower yield. If you can tolerate a 1-to-3-day withdrawal window, Fluid's ceiling system is a known constraint but not a deal-breaker.
**Step 4:** Calculate your annual yield differential. If migrating to Compound at 6.2% from Fluid at 5.43%, the differential is 77 basis points. On a $100,000 position, that is $770 annually, or $64 per month. Gas costs are $0.30 to $0.50\. You recover migration costs in less than one day. The decision to migrate is economically rational unless you have conviction that Fluid's rate will revert above 6.2% within 30 days.
**Step 5:** If you expect rate reversion within 7 to 14 days, hold. If you do not have conviction on reversion timing, migrate immediately. The cost of being wrong is the opportunity cost of holding a lower-yielding position while alternatives pay more. That cost is $64 per month on a $100,000 position at a 77 basis-point differential. If reversion does not occur within 14 days, you have lost $32 in opportunity cost. If reversion occurs in 3 days, you avoided $0.50 in gas and retained exposure to the upside.
For positions between $500 and $10,000, the decision tree is similar but the break-even window extends to 2 to 4 weeks. If you expect reversion within that window, holding is rational. If reversion does not occur or if you do not have conviction, migrate.
For positions under $500, migration is economically marginal unless you are moving to a Layer 2 or alternative Layer 1 where gas costs are sub-cent. If you are on Ethereum mainnet, the break-even window is 7 to 14 days at a 1.5 percentage-point differential. If you expect reversion within that window, hold. If not, migrate to a Solana or Base equivalent to eliminate gas as a friction factor.
## What To Monitor After You Decide
If you exit Fluid and migrate to Compound or another alternative, monitor the new protocol's utilization rate weekly. Lending rates are not static. Compound's 6.2% rate will compress if borrow demand declines or if new supply floods the pool. Set a threshold for re-evaluation. If Compound's rate drops below 5.5%, re-run the decision tree. If Fluid's rate climbs back above 6.5%, evaluate whether to rotate back.
If you hold your Fluid position expecting reversion, monitor utilization daily. If utilization remains below 60% for more than 7 days, reversion is unlikely. If utilization climbs above 70%, rates will follow within 48 to 72 hours. Set a calendar reminder to check DeFiLlama every 24 hours for the next 14 days. If reversion does not occur, migrate.
Track withdrawal queue depth if you are holding a six-figure position. [Fluid's smart contract repository](https://github.com/instadapp/fluid-contracts-public) publishes the Automated Debt Ceiling parameters on-chain. If ceiling utilization climbs above 85%, plan your exit before you need liquidity. Waiting until you need instant redemption eliminates Fluid as an option.
For additional context on how other protocols have experienced similar rate drops and what those patterns revealed about utilization dynamics, see [the analysis of Fluid's 4.29-point drop earlier this year](https://altcoininvestor.com/fluid-lending-usdc-rate-drop/) and [Uniswap V3's 10.65-point collapse in one week](https://altcoininvestor.com/why-uniswap-v3-apy-drop/). Both cases demonstrate how quickly DeFi yield surfaces compress when liquidity or borrow demand shifts.
## The Takeaway
A 2.34 percentage-point drop from 7.77% to 5.43% costs a $100,000 position $2,340 annually. Gas costs are $0.30 to $0.50 for migration. If Fluid's utilization is below 60%, rate reversion is unlikely within 14 days. If Compound is paying 6.2% and has held that rate for more than 7 days, migrate immediately. If you expect reversion within 7 days, hold. If you do not have conviction, migrate. The decision is binary and the math is clear.
Check utilization, calculate your differential, verify withdrawal queue depth, and execute within 24 hours. The cost of waiting is the opportunity cost of holding lower yield while alternatives pay more. That cost is real and it compounds daily.
## Frequently Asked Questions
### How do I know if Fluid's 5.43% rate will revert or compress further?
Check Fluid's current utilization rate on DeFiLlama. If utilization is below 60%, borrow demand is soft and reversion is unlikely within 7 to 14 days. If utilization is above 75%, the protocol is approaching the steep section of its interest-rate curve and rates may spike within 48 to 72 hours. Fluid's rate model is utilization-driven, so rates follow borrow demand. Historical data shows rates typically hold within plus or minus 50 basis points for 7 to 14 days unless a governance cap increase or liquidity shock occurs.
### What are the gas costs for exiting Fluid USDC and migrating to another protocol?
Ethereum gas fees on October 19, 2026, are 0.14 Gwei at normal priority. A USDC transfer burns roughly 45,000 to 65,000 gas units, which translates to $0.07 to $0.15 per withdrawal at current base fees and $3,000 ETH. Round-trip migration costs are $0.30 to $0.50\. For positions above $10,000, gas costs are irrelevant to the decision. For positions under $500, gas represents 0.03% to 0.1% of principal and break-even windows extend to 7 to 14 days at 1.5 percentage-point rate differentials.
### Should I migrate from Fluid to Aave even though Aave pays 83 basis points less?
If you prioritize smart contract maturity and instant liquidity over rate optimization, yes. Aave has operated since 2020 with the deepest audit history in DeFi and offers instant redemption during normal market conditions. Fluid has a shorter operating history and uses an Automated Debt Ceiling that may queue withdrawals during high-exit periods. The 83 basis-point differential equals $830 annually on a $100,000 position. If you would accept that cost to reduce tail risk, Aave is the rational choice. If you are optimizing for yield and accept the risk profile, Fluid at 5.43% remains competitive.
### What is Fluid's Automated Debt Ceiling and how does it affect withdrawals?
Fluid uses an Automated Debt Ceiling that increases per block, creating a smoothing curve that prevents sudden large withdrawals. During high-exit periods, users may face queue delays rather than instant redemption. If ceiling utilization is above 90%, plan for a multi-day redemption window. This differs from Aave and Compound, which offer instant redemption under normal conditions. Check current ceiling utilization on DeFiLlama before initiating large withdrawals. If you need guaranteed instant liquidity, protocols without ceiling constraints are safer exits.
### Which alternative USDC lending protocol offers the most stable rate right now?
Maple syrupUSDC offers 5.18% on $2.6B TVL with a rate that has held within 10 basis points for six weeks as of October 2026\. Maple operates as a credit marketplace with institutional borrowers, which produces more stable rate environments than utilization-driven protocols like Fluid or Compound. The trade-off is a 30-day withdrawal queue, which eliminates instant liquidity. If you are comfortable with the credit risk and withdrawal delay, Maple offers the most stable rate profile among current high-yield USDC alternatives.
The Weekly Yield Report
You have compared five USDC lending protocols paying between 4.60% and 6.2% with specific gas break-even calculations and utilization thresholds. Those rates will be different next week.
Every Thursday: where crypto yield actually is - stablecoins, liquid staking and DeFi lending, with the risk named next to the rate and what changed since last week.
[Get it free every Thursday](#/portal/signup)
Free. No trade calls, no allocations, no hype. Unsubscribe in one click.
### JPMorgan Brings Its Stablecoin to Ethereum After Base
URL: https://altcoininvestor.com/jpmorgan-jpmd-stablecoin-ethereum-base/
Last updated: 2026-10-19T18:00:04.000Z
JPMorgan's deposit token, JPMD, is now available on Ethereum for institutional clients. The bank first launched the token on Coinbase's Base network in November 2025\. The dual-network strategy positions a regulated alternative to consumer stablecoins as foundational infrastructure for institutions settling tokenized funds.
This is not a consumer product. JPMD is designed for institutional clients who need bank-backed custody guarantees and regulatory compliance. What makes it relevant for income analysis is what it signals about where settlement infrastructure is moving and which public blockchains big banks now trust for real financial flows.
## What JPMD Is and Why It Exists
JPMD is a deposit token, not a stablecoin in the USDC or USDT sense. Each token represents a dollar deposited at JPMorgan. The bank holds the deposits. The token moves on public blockchains. Institutions can settle tokenized fund transactions, cross-border payments, or treasury operations without leaving regulated banking infrastructure.
The product competes directly with Circle's USDC and Tether's USDT in institutional contexts. The difference is the issuer. JPMD comes with the credit guarantee of a systemically important bank. For regulated institutions, particularly in jurisdictions where stablecoin regulation remains uncertain, that distinction matters. A fund manager in Frankfurt or Singapore can settle a tokenized bond purchase using JPMD and stay within frameworks that treat it as a bank deposit, not a crypto asset.
JPMorgan launched JPMD on Base first, Coinbase's Ethereum layer-2 network. Now it has brought the token to Ethereum mainnet. That sequence suggests the bank is treating Ethereum as the default public settlement layer and Base as a faster, cheaper execution venue for specific use cases. Both are public blockchains. Both are accessible to anyone with the right institutional credentials.
## Why Ethereum Matters for Regulated Stablecoin Settlement

The choice of Ethereum is a signal. JPMorgan could have built JPMD on a permissioned network. It could have used its own Quorum blockchain, which it developed internally. Instead, it chose a public blockchain with open access, decentralized validation, and transparent settlement.
Ethereum's liquidity and infrastructure density make it the default choice for tokenized assets. More stablecoins, more decentralized exchanges, more lending protocols, and more tokenized securities settle on Ethereum than on any other public chain. If an institution wants interoperability with the broader tokenized asset ecosystem, Ethereum is where that happens. By bringing JPMD to Ethereum, JPMorgan is making its deposit token composable with that ecosystem.
This matters for income strategies built on [stablecoin yield](https://altcoininvestor.com/how-to-earn-passive-income-stablecoins-2026/). Institutional stablecoins like JPMD may not offer direct consumer yield, but they validate the infrastructure layer on which consumer stablecoin income products are built. When a major bank treats Ethereum as settlement plumbing, it reduces the regulatory risk that Ethereum-based stablecoin yield products could be forced offline by a future regulatory shift. The bank's presence is implicit endorsement of the network's legitimacy.
## What This Means for Stablecoin Yield and Institutional Access
JPMD itself does not offer yield to retail users. It is a deposit token for institutional clients. But its presence on Ethereum changes the competitive landscape for consumer stablecoins and the yield products built on top of them.
Consumer stablecoins like USDC and USDT generate income for users through lending, liquidity provision, and yield-bearing deposit products. Platforms pay 3.8% to 9% APY on stablecoin deposits, as detailed in our guide to stablecoin income. That yield comes from the demand for stablecoin liquidity in decentralized finance, from institutional borrowing, and from the interest the issuer earns on reserves.
When JPMorgan issues a deposit token on the same network, it creates a bifurcated market. Institutional users who need regulatory compliance and bank-backed guarantees will use JPMD. Retail users who need yield and permissionless access will use USDC or USDT. The two products serve different needs, but they share the same settlement infrastructure.
For yield-focused users, the key question is whether institutional stablecoins like JPMD will eventually offer yield products that compete with decentralized finance. If JPMorgan begins offering yield on JPMD deposits, that yield will likely be lower than DeFi rates but backed by bank guarantees. Some users will trade higher yield for lower risk. Others will not. The existence of both options increases the total addressable market for stablecoin-based income.
## The Emerging Markets Angle: What This Does Not Change
JPMD is an institutional product designed for regulated clients in developed markets. It does not change the stablecoin dynamics in Argentina, Nigeria, Turkey, or Lebanon. In those markets, consumer stablecoins like USDT and USDC are already the dominant dollar-substitute savings tools. Bank-backed deposit tokens are irrelevant when the local banking system is the problem.
In Buenos Aires, a user holding USDT on a smartphone is not looking for JPMorgan's credit guarantee. That user is looking for dollar exposure without capital controls, and USDT provides it. In Lagos, a trader moving USDT through peer-to-peer networks is not concerned with institutional settlement infrastructure. The product-market fit for consumer stablecoins in high-inflation economies is orthogonal to the product-market fit for institutional deposit tokens in developed markets.
What matters for emerging market income strategies is that Ethereum continues to function as the settlement layer for both. A Nigerian user earning yield on USDT through a DeFi protocol and a JPMorgan client settling a tokenized bond with JPMD are using the same network. That shared infrastructure creates network effects. The more institutions use Ethereum, the more liquid and resilient the network becomes. That liquidity benefits retail users who rely on it for income.
## What to Watch: Institutional Stablecoin Yield and DeFi Integration
The next signal to watch is whether JPMorgan begins offering yield on JPMD deposits. If it does, the yield will likely come from institutional lending, not from decentralized finance. But it will create a benchmark. Retail stableccoin yield products will need to compete on rate, accessibility, or both.
Another signal is whether other banks follow JPMorgan's lead. If Citigroup, HSBC, or Deutsche Bank issue deposit tokens on Ethereum, the institutional stablecoin market becomes competitive. Competition drives product innovation, which could include higher yield, better composability with DeFi, or new income structures that blend bank guarantees with decentralized liquidity.
For now, JPMD is a settlement tool, not an income product. But its presence on Ethereum validates the network as core financial infrastructure. That validation reduces regulatory risk for the consumer stablecoin income products already operating there.
## The Takeaway
JPMorgan's decision to bring its deposit token to Ethereum after launching on Base signals that major banks now treat public blockchains as core settlement infrastructure. JPMD is not a consumer income product, but it validates the network on which consumer stablecoin yield is earned. Institutional adoption of Ethereum reduces the regulatory risk that stablecoin income strategies could be forced offline. For users earning yield on USDC or USDT, the presence of a JPMorgan-issued token on the same network is a form of implicit endorsement. The institutional and retail stablecoin markets are diverging, but they share the same plumbing. That shared infrastructure creates network effects that benefit both.
## Frequently Asked Questions
### What is JPMD and how does it differ from USDC or USDT?
JPMD is a deposit token issued by JPMorgan for institutional clients. Each token represents a dollar deposited at the bank. Unlike consumer stablecoins like USDC or USDT, JPMD is designed for regulated institutions that need bank-backed custody guarantees and compliance. It does not target retail users or offer direct yield products. The token settles on public blockchains like Ethereum and Base but functions within traditional banking regulatory frameworks.
### Can retail users earn yield on JPMD?
No. JPMD is an institutional product designed for regulated clients settling tokenized funds, cross-border payments, and treasury operations. It does not currently offer yield to retail users. Retail stablecoin yield remains available through consumer stablecoins like USDC and USDT on platforms that pay 3.8% to 9% APY through lending, liquidity provision, and DeFi protocols. JPMD validates the Ethereum infrastructure on which those yield products operate but does not compete directly with them.
### Why did JPMorgan choose Ethereum instead of a private blockchain?
Ethereum offers liquidity, infrastructure density, and interoperability with the broader tokenized asset ecosystem. More stablecoins, decentralized exchanges, lending protocols, and tokenized securities settle on Ethereum than on any other public chain. By using Ethereum, JPMorgan makes JPMD composable with that ecosystem. The choice of a public blockchain instead of a permissioned one like JPMorgan's own Quorum signals that the bank treats Ethereum as legitimate core financial infrastructure for regulated settlement.
### How does JPMD affect stablecoin adoption in emerging markets?
JPMD does not change stablecoin dynamics in high-inflation economies like Argentina, Nigeria, or Turkey. It is an institutional product for developed markets. In emerging markets, consumer stablecoins like USDT and USDC remain the dominant dollar-substitute savings tools because they offer permissionless access and protection from capital controls. JPMD's presence on Ethereum benefits emerging market users indirectly by increasing network liquidity and reducing regulatory risk for the consumer stablecoin income products they rely on.
### What should stablecoin income users watch for next?
Watch whether JPMorgan begins offering yield on JPMD deposits. If it does, institutional stablecoin yield will create a benchmark that retail products must compete with on rate or accessibility. Also watch whether other major banks issue deposit tokens on Ethereum. Competitive institutional stablecoin markets could drive product innovation, including higher yield, better DeFi composability, or hybrid income structures that blend bank guarantees with decentralized liquidity. Both developments would affect the consumer stablecoin yield landscape.
The Weekly Yield Report
You have just seen how a major bank's deposit token validates the infrastructure your stablecoin income runs on. That institutional adoption landscape changes every quarter.
Every Thursday: where crypto yield actually is - stablecoins, liquid staking and DeFi lending, with the risk named next to the rate and what changed since last week.
[Get it free every Thursday](#/portal/signup)
Free. No trade calls, no allocations, no hype. Unsubscribe in one click.
### Weekly Yield Rebalancing: Checklist For 5-10 Positions
URL: https://altcoininvestor.com/manage-multiple-defi-yield-positions-checklist/
Last updated: 2026-10-19T02:03:43.000Z
## What This Checklist Accomplishes

This is a step-by-step weekly review process for portfolios with 5-10 DeFi yield positions across multiple protocols. The workflow takes under 60 minutes and ensures you catch every yield opportunity above 3 percentage points and every rate collapse above 4 percentage points before they materially impact your returns.
The checklist saves 2-3 hours per week compared to ad-hoc checking. It eliminates manual protocol visits by using tracked data from aggregators. It includes pre-calculated action thresholds so you spend time deciding, not searching.
Prerequisites: active positions on 5-10 protocols, a multi-chain wallet, and access to at least one portfolio tracker. If you are managing fewer than five positions, this workflow is overkill. If you are managing more than ten, [this monitoring protocol for 8-12 positions](https://altcoininvestor.com/track-defi-yield-positions-efficiently/) is more efficient.
## Step 1: Pull Current Positions And Yields

Open your portfolio tracker. DeBank, Zapper, and CoinStats all parse on-chain positions across Layer 1 and Layer 2\. Verify that every position you deposited capital into appears in the tracker. Missing positions usually mean the tracker does not support that protocol or chain yet.
Export or screenshot your current position values and displayed APYs. Many trackers show stale APY data pulled from protocol front-ends. Cross-reference each displayed yield with the protocol's live dashboard or [DefiLlama](https://defillama.com/). If the tracker shows 8.2% and the protocol dashboard shows 5.1%, use 5.1%.
Record the following for each position:
- Protocol name and chain
- Asset deposited (USDC, ETH, wBTC, LP token name)
- Position size in USD
- Current APY from protocol source, not tracker
- Last week's APY for comparison
This takes 8-12 minutes for five positions, 15-18 minutes for ten. If it takes longer, you are visiting too many URLs. Use DefiLlama's protocol pages to check all yields in one place.
## Step 2: Calculate Percentage Changes And Flag Outliers

Subtract last week's APY from this week's APY for each position. A position that moved from 6.8% to 3.2% dropped 3.6 percentage points. A position that moved from 12.4% to 15.1% gained 2.7 percentage points.
Flag any position that changed by more than 3 percentage points in either direction. These are your rebalancing candidates. Moves smaller than 3 percentage points rarely justify the gas cost and execution risk of reallocating capital.
For context: [the October 15 yield report](https://altcoininvestor.com/weekly-yield-report-15-october-2026/) showed Compound USDC climbing from 3.2% to 5.74% in one week while six high-emission LP pools dropped out entirely. A 2.5-point move is normal volatility. A 5-point move or a total disappearance is an action signal.
Sort your flagged positions by the size of the percentage change, largest first. You will evaluate them in that order.
## Step 3: Run The Gas-Cost Threshold Test
For each flagged position, calculate whether rebalancing is worth the transaction cost. Use this formula:
**Rebalance only if expected yield gain from reallocation is greater than gas cost multiplied by four.**
This ensures a four-week payback period on transaction fees. Example: you hold $12,000 in a position currently paying 3.1%. You found an alternative venue paying 7.4%. The yield gain is 4.3 percentage points, or $516 annually, or $9.92 per week. If moving the capital costs $18 in gas across withdrawal, swap, and redeposit, your payback period is 1.8 weeks. That passes the threshold.
If moving the same position costs $78 in gas because you are rebalancing on Ethereum Layer 1 during peak hours, your payback period is 7.9 weeks. That fails. Wait for lower gas or move only if the rate collapse is severe enough to justify immediate exit.
Layer 2 transaction costs on Arbitrum, Base, and Optimism are $0.01 to $0.10 for most DeFi interactions. On Ethereum mainnet, expect $0.15 to $0.50 for swaps and $0.05 to $0.40 for ERC-20 transfers. Timing transactions during 2-6 AM UTC or weekends cuts fees by 50-70 percent.
For any position that fails the gas threshold test, mark it "monitor" and move on. Do not reallocate.
## Step 4: Check Liquidity Depth And Slippage Risk
Before executing any rebalance, verify that the pool or lending market you are moving into has sufficient liquidity relative to your position size. Uniswap processes over $1.5 billion in daily volume. Curve generates roughly $150 million in annual trading fees. Aave holds $17.953 billion in TVL across 23 chains. These are deep markets.
Smaller venues with TVL under $5 million relative to a rebalancing size above $10,000 will incur material slippage. If you are moving $15,000 into a pool with $2 million TVL, expect 0.3-0.8% slippage on entry. That slippage erases weeks of yield advantage.
Check the pool's TVL on DefiLlama or the protocol dashboard. If your position size is more than 0.5% of pool TVL, calculate expected slippage before proceeding. Most DEX front-ends display estimated slippage during the swap preview. If slippage exceeds 0.3%, split the transaction into two or three smaller executions separated by 10-15 minutes, or choose a deeper pool.
## Step 5: Sequence Multi-Leg Rebalances On Paper First
If your rebalancing plan involves more than one move, work out the sequence before you open any transaction windows. Multi-leg rebalances fail when you realize mid-execution that the second leg depends on the first completing, or that you lack gas on the destination chain.
Write down:
- Which position you are exiting first
- Which chain that asset will land on after withdrawal
- Whether you need to bridge before redepositing
- Whether you need to top up gas on the destination chain
- Which position you are entering second, and whether it depends on the first completing
Example sequence: you are exiting a Curve pool on Ethereum mainnet, bridging USDC to Arbitrum, and depositing into Aave on Arbitrum. You need ETH on mainnet for the Curve exit, ETH on Arbitrum for the Aave deposit, and you need to wait for the bridge to confirm before executing the deposit. If you start the Curve exit without checking your Arbitrum gas balance, you will have $12,000 in USDC sitting in a wallet on Arbitrum with no way to move it until you bridge more ETH.
This planning step takes 3-5 minutes and eliminates most mid-execution problems.
## Step 6: Execute During Off-Peak Hours
If you determined that rebalancing is justified and you mapped the sequence, execute during 2-6 AM UTC or on weekends. Gas costs on Ethereum Layer 1 drop by 50-70 percent during these windows. On Layer 2 networks, the difference is smaller but still measurable.
Layer 2 networks process roughly 60-70 percent of Ethereum transaction volume as of 2026\. For routine rebalancing, default to Layer 2 unless the specific protocol or liquidity you need exists only on mainnet.
Confirm each transaction in your wallet before signing. Verify the destination address, the amount, and the estimated gas cost. Phishing attacks targeting DeFi users often present fake transaction prompts with altered contract addresses. If the transaction preview does not match what you planned, reject it and recheck the URL.
## Step 7: Log Every Transaction For Tax Purposes
Every withdrawal, swap, bridge, and deposit is a taxable event in most jurisdictions. Exiting a liquidity pool and receiving the underlying tokens is a disposal of the LP token. Swapping one stablecoin for another is a sale and a purchase. Claiming rewards is ordinary income.
Immediately after executing each rebalancing transaction, log the following:
- Transaction hash
- Timestamp (block number preferred, UTC time acceptable)
- Assets out and assets in
- USD value at the time of the transaction
- Protocol and chain
Do not wait until the end of the month. If you execute five rebalancing moves in one week and log none of them, you will spend hours reconstructing the sequence when you need to file. Most crypto tax tools struggle with LP tokens and multi-chain bridges. [Manual logging that survives an audit](https://altcoininvestor.com/how-to-track-defi-yield-for-taxes/) requires transaction hashes and USD valuations at the moment of each event.
Use a spreadsheet or a dedicated crypto tax tracker. Koinly and CoinTracking both integrate with major DeFi protocols, but they miss edge cases. For any position your tracker does not auto-import, log it manually.
## Step 8: Update Your Position Table And Set Next Week's Baseline
After rebalancing, update your position table with the new allocations and current yields. This week's ending APY becomes next week's baseline for percentage-change calculations.
If you exited a position entirely, remove it from the table. If you opened a new position, add it with the entry APY, entry date, and position size. This table is your single source of truth for the next weekly review.
Most rebalancing errors happen because allocators lose track of what they actually hold versus what they think they hold. The position table prevents that. It takes 2-3 minutes to update and saves 20 minutes of confusion the following week.
## Common Failure Modes
**Rebalancing into a rate that has already corrected.** High yields on smaller protocols often reflect temporary supply-demand imbalances. By the time you notice a 12% rate and decide to move capital, the rate may have already dropped to 6%. Always check the current rate immediately before executing, not the rate you saw two days ago when you planned the move.
**Ignoring impermanent loss in LP positions.** Stablecoin pools limit impermanent loss because both assets target the same peg, but a depeg causes real losses. Volatile pairs like ETH-USDC can generate 15% fee yield while losing 18% to impermanent loss if ETH moves sharply. Calculate impermanent loss before comparing LP yields to lending yields. They are not directly comparable.
**Failing to account for bridged asset deduplication.** If you bridge USDC from Ethereum to Arbitrum, some portfolio trackers will show both the Ethereum USDC (in transit) and the Arbitrum USDC (received) until the bridge finalizes. This double-counts your position. Wait for the bridge to fully settle before recording the new position size.
**Claiming rewards without checking gas cost.** On Ethereum mainnet, claiming $47 in rewards can cost $22 in gas during peak hours. Only claim rewards when the transaction cost is less than 2% of the claimable amount, or when you are already executing another transaction on the same chain and can batch the claim.
## What To Watch On-Chain Next
Track these metrics in your weekly review to catch problems early:
- **Protocol TVL changes:** A 20% TVL drop in one week often precedes a rate spike or a liquidity crisis. Check DefiLlama's protocol pages for TVL history.
- **Utilization rate on lending markets:** Aave and Compound display utilization rate on their dashboards. Utilization above 90% signals that borrowing demand is high, which drives lender yields up. Utilization below 40% suggests yields will compress.
- **Governance proposals that change fee structures:** Uniswap v4 allows dynamic fees through hooks. Curve pools periodically adjust fee splits. A governance vote that shifts more fees to the protocol and fewer to LPs will reduce your yield even if trading volume stays constant.
- **Bridge and custody wallet activity for your held assets:** Large outflows from a protocol's treasury or a sudden increase in bridge volume out of a chain can signal that other allocators are exiting. This is visible on-chain 12-48 hours before it becomes public.
Set up alerts on DefiLlama for TVL changes above 15% on any protocol where you hold a position. This catches most problems before they become costly.
## Portfolio Construction And Diversification
A common starting allocation follows a 40-30-30 structure: 40% in lending for stable base yield, 30% in DEX liquidity for organic fee yield, and 30% in higher-risk venues like derivatives or newer protocols for tactical upside. Adjust based on your risk tolerance and the current rate environment.
For example, if you are managing $50,000 across eight positions, you might allocate $20,000 to Aave USDC lending on Arbitrum, $15,000 split between two Curve stablecoin pools, and $15,000 across three higher-yield protocols that passed [the new protocol evaluation checklist](https://altcoininvestor.com/fluid-lending-safe-evaluate-high-yield-protocol/).
Diversification mitigates single-point failures. If one protocol suffers an exploit or a liquidity freeze, you lose at most the capital allocated to that venue. Concentration into one or two protocols increases both your upside and your downside. Most allocators running 5-10 positions should limit any single protocol to 25% of total capital.
## When Automation Helps And When It Destroys Returns
Yield aggregators like Yearn and Beefy automate rebalancing by moving your capital between strategies as rates shift. Yearn charges a 2% management fee plus a 20% performance fee. Beefy charges 0.5-4.5% performance fees. These fees are acceptable if the aggregator consistently delivers yields 3-5 percentage points above what you can achieve manually.
Check the aggregator's historical performance on DefiLlama or the protocol's own dashboard. If the vault you are considering returned 8.2% last quarter while [manually managing a similar allocation](https://altcoininvestor.com/best-defi-protocols/) would have returned 9.1%, the aggregator is costing you money.
Automation works best for positions under $10,000 where manual rebalancing does not justify the time cost. For positions above $25,000, manual management with this weekly checklist usually outperforms aggregators after fees.
## The Takeaway
You now have a reproducible 60-minute workflow for managing 5-10 yield positions. The checklist catches yield opportunities above 3 percentage points and rate collapses above 4 percentage points. The gas-cost threshold test prevents unprofitable rebalancing. The tax logging protocol ensures you have the transaction hashes and valuations you need when you file.
Run this review every week at the same time. Yields shift constantly. The 5.6% rate you see today will be 3.8% or 7.2% next week. The goal is not to predict rates. The goal is to notice changes large enough to justify action, execute during low-gas windows, and log every move so your tax software does not fail you in April.
## Frequently Asked Questions
### How often should I rebalance a portfolio with 5-10 DeFi yield positions?
Run a weekly review using the checklist in this article. Only execute rebalancing when a position changes by more than 3 percentage points and the expected yield gain exceeds gas cost multiplied by four. Most weeks you will review and decide not to move anything. Rebalancing too frequently erodes returns through transaction costs and slippage. The weekly cadence ensures you catch material rate changes without overtrading.
### What is the minimum position size that justifies weekly monitoring and rebalancing?
On Layer 2 networks like Arbitrum or Base where transaction costs are $0.01 to $0.10, positions as small as $2,000 can justify weekly monitoring. On Ethereum Layer 1 where gas costs range from $0.15 to $0.50 per transaction, positions under $10,000 often fail the gas-cost threshold test. A useful rule: only rebalance when transaction costs are less than 2% of position value.
### Which portfolio tracker is best for managing multiple DeFi positions across chains?
DeBank, Zapper, and CoinStats all parse on-chain positions across Layer 1 and Layer 2 and detect liquidity pool tokens, staking positions, and borrowed positions. They prevent double-counting of bridged assets. Choose based on which protocols and chains you use most. Cross-reference displayed APYs with protocol dashboards or DefiLlama because many trackers show stale yield data.
### How do I calculate whether rebalancing is worth the gas cost?
Use this formula: rebalance only if expected yield gain from reallocation is greater than gas cost multiplied by four. This ensures a four-week payback period. Example: moving $12,000 from a 3.1% position to a 7.4% position gains 4.3 percentage points or $9.92 per week. If gas costs $18, payback is 1.8 weeks and the move is justified. If gas costs $78, payback is 7.9 weeks and the move fails the threshold.
### What tax records do I need to keep for weekly DeFi rebalancing?
Log every transaction hash, timestamp or block number, assets out and in, USD value at transaction time, protocol name, and chain. Every withdrawal, swap, bridge, and deposit is a taxable event. Exiting an LP pool is a disposal of the LP token. Claiming rewards is ordinary income. Most crypto tax tools miss LP tokens and multi-chain bridges, so manual logging with transaction hashes is required for audit-proof records.
The Weekly Yield Report
You just reviewed a 60-minute workflow for 5-10 positions with gas thresholds and tax logging. Those yields will shift by next week and so will the rebalancing math.
Every Thursday: where crypto yield actually is - stablecoins, liquid staking and DeFi lending, with the risk named next to the rate and what changed since last week.
[Get it free every Thursday](#/portal/signup)
Free. No trade calls, no allocations, no hype. Unsubscribe in one click.
### How To Vet Curve USDC-RLUSD Paying 4.36% On $96M TVL
URL: https://altcoininvestor.com/curve-usdc-rlusd-pool-review/
Last updated: 2026-10-19T00:03:43.000Z
## What You Will Accomplish
You will vet the Curve USDC-RLUSD pool within 48 hours using a four-layer framework that evaluates reserve quality, depeg history, liquidity depth, and yield composition. At the end, you will have a go or no-go decision on whether to allocate $50,000 to $200,000 into a pool that holds $76 million and pays 4.61% APY.
This framework applies to any new stablecoin pair on Curve. RLUSD launched December 17, 2024\. It has operated for 10 months without a depeg event. The pool grew to $103 million in April 2026, then stabilized at $76 million by August 2026\. The 4.61% APY is higher than most stable pairs on Curve, which range from 2.2% to 4.6%.
You need to know if that yield is sustainable, if RLUSD's reserves are credible, and whether $76 million in liquidity is deep enough to support your exit if the pool experiences a shock.
## Step 1: Verify Reserve Structure and Issuer Credibility
RLUSD is Ripple's NYDFS-chartered dollar stablecoin. It is redeemable 1:1 and backed by USD deposits, cash equivalents, and short-term U.S. Treasuries held in segregated accounts at The Bank of New York Mellon. In August 2026, Ripple reported $1.7 billion in reserve funds backing $1.59 billion in circulating RLUSD. That is 107% overcollateralization.
RLUSD holds a B Safety Score grade (74 out of 100) in Pharos's latest published rating. This is a safe-tier grade, not an experimental-tier grade. The reserves consist of short-dated U.S. Treasuries and cash equivalents, which are liquid instruments. BNY Mellon provides primary custody, and Deloitte conducts monthly audits.
Compare this to USDC, which holds similar reserves but experienced a drop to $0.87 in March 2023 after $3.3 billion of Circle's reserves froze at Silicon Valley Bank. RLUSD's custodian is BNY Mellon, a larger and more diversified institution than SVB, but the same single-counterparty risk applies. If BNY Mellon experiences a liquidity crisis, RLUSD cannot redeem at par.
The key difference between RLUSD and experimental stablecoins like USDe or algorithmic designs is simplicity. RLUSD is not a synthetic, algorithmic, or yield-bearing coin built on complex, interlocking systems. It is a fiat-backed trust structure with one custodian and monthly audits. The simplicity lowers systemic risk, but it does not eliminate custodian risk.
Check the monthly attestation reports published by Deloitte. If you see a gap in reporting or a decline in overcollateralization below 100%, that is a red flag. As of the most recent data, RLUSD remains overcollateralized and transparent.
## Step 2: Evaluate Depeg History and Track Record

RLUSD has operated for 10 months without a depeg event. This is a short track record compared to USDC (launched 2018) or FRAX (launched 2019), but it is comparable to GHO, which launched in 2023 and grew rapidly within Aave's ecosystem.
The relevant question is not whether RLUSD is old. The relevant question is whether RLUSD has experienced a stress event. It has not. RLUSD's market cap reached $2.43 billion with a supply of 2.43 billion RLUSD. It surpassed $1 billion less than a year after launch. This is rapid adoption, and rapid adoption without depeg events is a positive signal.
Compare RLUSD's track record to recent depeg case studies. On April 2, 2025, FDUSD fell to $0.87 within hours after Tron founder Justin Sun publicly accused its issuer, First Digital Trust, of being effectively insolvent. FDUSD had a $2.5 billion market cap at the time. USDe briefly plunged to $0.65 on Binance during October's Black Swan liquidation event, triggered by U.S. trade tariff fears and cascading liquidations worth nearly $19 billion across the crypto market.
The casualties in 2025-2026 were DeFi-native designs, including synthetic, algorithmic, or yield-bearing coins built on complex, interlocking systems. RLUSD is not a DeFi-native design. It is a fiat-backed stablecoin issued by a regulated entity. The depeg risk profile is closer to USDC or GUSD than to USDe or FDUSD.
The absence of a depeg event in 10 months is not proof of future stability, but it is a necessary condition. If RLUSD had experienced a depeg event in its first 10 months, you would not proceed. It has not, so you move to the next layer.
## Step 3: Analyze Pool Liquidity Depth and Concentration Risk
The Curve USDC-RLUSD pool held $76.5 million in total value locked as of August 2026\. This is down from a peak of $103 million in April 2026\. The pool stabilized at $76 million, which suggests that early growth driven by incentives has normalized.
Liquidity depth determines your exit optionality. If the pool holds $76 million and you allocate $100,000, you represent 0.13% of the pool. If you allocate $200,000, you represent 0.26% of the pool. In normal conditions, you can exit without material slippage. In stressed conditions, you may experience slippage if other large LPs exit simultaneously.
RLUSD's core weakness is depth. It remains a fraction of the size of USDT and USDC, which limits its usefulness for very large trades without price slippage. The USDC-RLUSD pool is smaller than FRAX pools, which hold $380 million or more, and smaller than some LUSD pools, which hold $120 million or more. This is a concentration risk.
If RLUSD experiences a regulatory shock or a custodian event, the pool may not have enough depth to absorb mass exits. During the March 2023 USDC depeg, liquidity across USDC-paired pools evaporated within hours. The same pattern would apply to RLUSD if BNY Mellon experienced a liquidity crisis or if RLUSD lost its regulatory authorization in a major jurisdiction.
One regulatory risk to monitor is MiCA. RLUSD is not yet authorized under the EU's MiCA framework, so European residents cannot hold it on compliant exchanges. If future rulings in other jurisdictions restrict RLUSD, liquidity in the Curve pool may decline sharply. USDC has full EEA authorization. RLUSD does not.
Check the pool's 7-day and 30-day volume trends. As of Week 32 in 2026, the USDC-RLUSD pool had $13 million in volume in Week 1, which generated $2,660 in fees. By Week 32, the pool held $76.5 million in TVL with a change of $9.88 million. Volume and TVL trends should be stable or growing. If volume declines sharply, the pool is losing organic demand, and yield will depend more heavily on bribes.
## Step 4: Determine Whether APY Is Organic or Bribe-Driven
The USDC-RLUSD pool pays 4.61% APY as of September 28, 2026\. This is higher than the 2.2% to 4.6% range for most Curve stable pools. The 4.61% APY is a blended yield combining trading fees, CRV emissions, and bribe incentives.
Every swap in Curve pools charges a fee ranging from 0.04% for stable pairs to 0.4% for volatile ones. The USDC-RLUSD pool shows a 0.08% fee parameter. Fees are split 50/50 between liquidity providers and holders of locked veCRV tokens. If the pool generates $13 million in weekly volume, that is approximately $676 million annualized. At 0.08% fee, that is $540,800 in annual fees. Half goes to LPs, so $270,400 in LP fees annually. On $76 million TVL, that is 0.36% APY from fees alone.
The remaining 4.25% APY comes from CRV emissions and bribes. This is a material bribe component. Bribes are sustainable as long as Ripple or other stakeholders continue to subsidize the pool's gauge weight. If Ripple reduces incentive support as the pool matures, APY will decline toward the fee-only rate of approximately 0.5% to 0.8%.
Check Curve governance votes and the Conic Finance bribe market for RLUSD gauge weight trends. If gauge weight is declining or if bribe amounts are dropping, APY will compress. The largest reward-driven Curve stable pools paid about 2.2% to 4.6% APY, mostly from CRV and partner incentives, while fee-only stable pools on Uniswap and PancakeSwap generally paid under 1%. The USDC-RLUSD pool's 4.61% APY is at the high end of the bribe-supported range.
You can verify yield sustainability by monitoring the pool for 30 days before allocating. If APY remains stable at 4.5% or higher for 30 consecutive days, bribes are likely sustained. If APY drops below 3%, bribes have declined and the pool is reverting to fee-only yield.
## Common Failure Modes
The most common failure mode in new stablecoin pools is custodian bank run. If BNY Mellon experiences a liquidity crisis, RLUSD cannot redeem at par. Retail LPs in the Curve pool cannot force 1:1 redemption during a crisis. Only institutions with direct agreements can redeem RLUSD one-to-one with the issuer. Retail holders must exit through exchanges and market makers, exposing them to secondary-market pricing during stress.
The second failure mode is regulatory action. If RLUSD loses authorization in a major jurisdiction, liquidity in the pool may decline sharply. The pool's TVL has already declined from $103 million to $76 million. A regulatory shock could accelerate that decline.
The third failure mode is bribe exhaustion. If Ripple stops subsidizing the pool's gauge weight, APY will drop to 0.5% to 0.8%. At that level, USDC lending on [established platforms pays higher rates with lower complexity](https://altcoininvestor.com/how-to-earn-passive-income-stablecoins-2026/).
The fourth failure mode is impermanent loss during depeg. Stablecoin pools limit impermanent loss because both assets target the same dollar peg, but a depeg can still cause real losses. If RLUSD depegs to $0.90 and you hold a 50/50 USDC-RLUSD position, your effective loss is approximately 5% compared to holding USDC alone. During the March 2023 USDC depeg, LPs in USDC-paired pools experienced real losses as USDC dropped to $0.87.
## Go or No-Go Decision Framework
Go if you meet these conditions. You seek 4% or higher yield on a stablecoin pair with the lowest structural risk. You have a 6-month or longer allocation horizon, because bribes may normalize downward and you need time to earn back gas costs. You are comfortable with BNY Mellon as the sole custodian. You are allocating on Ethereum mainnet only, because RLUSD has limited Layer 2 availability compared to USDC. You can monitor the pool weekly for volume and TVL trends.
No-go if any of these apply. You need guaranteed liquidity within 48 hours, because $76 million TVL may not support mass exits during a crisis. You require regulatory certainty in the EU, because RLUSD is not MiCA-authorized. You cannot tolerate custodian risk, because BNY Mellon is a single point of failure. You expect APY to remain above 4% indefinitely, because bribes are subsidized and may decline.
For most readers allocating $50,000 to $200,000, the answer is conditional go. RLUSD's reserve structure is credible. The 10-month track record without depeg is a positive signal. The pool's $76 million TVL is adequate for positions under $200,000 in normal conditions. The 4.61% APY is higher than fee-only pools but lower than the 6% to 8% range offered by newer lending protocols with higher risk.
The primary risk is custodian failure. If BNY Mellon experiences a liquidity crisis similar to SVB in March 2023, RLUSD will depeg and the Curve pool will experience mass exits. Monitor BNY Mellon's financial health and RLUSD's attestation reports monthly. If overcollateralization drops below 100% or if attestation reports are delayed, exit the pool immediately.
## What To Do Next
Check Pharos's RLUSD safety rating and Deloitte's latest attestation report. Verify that RLUSD remains overcollateralized and that reserves are held at BNY Mellon. If the rating drops below B-grade or if reserves show concentration in illiquid instruments, do not proceed.
Monitor the Curve USDC-RLUSD pool on [DeFi Llama](https://defillama.com/protocol/curve-dex) for 30 days before allocating. Track weekly volume, TVL changes, and APY stability. If APY remains above 4.5% for 30 consecutive days, bribes are sustained. If APY drops below 3%, bribes have declined and the pool is reverting to fee-only yield.
Allocate no more than 15% of your stablecoin position to the USDC-RLUSD pool. Diversify the remaining 85% across [established lending platforms](https://altcoininvestor.com/how-to-earn-defi-yield-safely/) or other Curve pools with deeper liquidity and longer track records. FRAX pools hold $380 million or more. LUSD pools hold $120 million or more. The USDC-RLUSD pool's $76 million TVL is adequate for smaller positions but insufficient for concentration risk above $100,000.
Set a calendar reminder to review the pool every 30 days. Check TVL trends, volume trends, and APY changes. If TVL declines by 20% or more in a single month, that is an exit signal. If APY drops below 3%, compare the pool's yield to fee-only alternatives. If fee-only alternatives pay higher rates, exit the pool and reallocate.
Monitor RLUSD's regulatory status in the EU and other major jurisdictions. If RLUSD loses authorization in a major market, liquidity in the pool may decline sharply. USDC has full EEA authorization. RLUSD does not. This is a persistent risk that may materialize in 2027 as MiCA enforcement expands.
## The Takeaway
RLUSD's 10-month track record without depeg, BNY Mellon custody, and 107% overcollateralization make it one of the safer new stablecoin entries. The Curve USDC-RLUSD pool's 4.61% APY is higher than most stable pairs, but the yield is bribe-supported and may decline as incentives normalize. The pool's $76 million TVL is adequate for positions under $200,000 in normal conditions but insufficient for mass exits during a crisis.
The primary risk is custodian failure. RLUSD cannot redeem at par if BNY Mellon experiences a liquidity crisis. Retail LPs must exit through secondary markets during stress, exposing them to slippage and depeg losses. This is the same risk that materialized with USDC in March 2023.
For readers allocating $50,000 to $200,000, the USDC-RLUSD pool is a conditional go. Allocate no more than 15% of your stablecoin position. Monitor the pool monthly for TVL, volume, and APY trends. Set exit triggers at 20% TVL decline or 3% APY compression. Verify RLUSD's attestation reports monthly and track BNY Mellon's financial health.
The framework above applies to any new stablecoin pair on Curve. Verify reserves. Check depeg history. Analyze liquidity depth. Determine yield composition. Set exit triggers. Monitor monthly. This is the 48-hour vetting process for pools with $50 million to $100 million TVL and less than one year of operating history.
## Frequently Asked Questions
### Is RLUSD safer than USDC for stablecoin yield?
RLUSD and USDC have similar reserve structures, both backed by fiat and short-term U.S. Treasuries. USDC has a longer track record (launched 2018) and full MiCA authorization in the EU. RLUSD has operated for 10 months without depeg and is overcollateralized at 107%, but it lacks MiCA authorization and has a single custodian (BNY Mellon). USDC is safer due to regulatory clarity and longer operating history. RLUSD is credible but newer.
### What causes the 4.61% APY in the Curve USDC-RLUSD pool?
The 4.61% APY is a blended yield from three sources: trading fees (approximately 0.36% APY based on current volume), CRV emissions, and bribe incentives from Ripple and other stakeholders. The majority of the yield (approximately 4.25%) comes from bribes. If Ripple reduces incentive support, APY will decline toward the fee-only rate of 0.5% to 0.8%. Monitor gauge weight trends and bribe amounts monthly to assess sustainability.
### How much liquidity can the USDC-RLUSD pool support during a crisis?
The pool holds $76 million in total value locked as of August 2026\. In normal conditions, it can support exits up to $200,000 without material slippage. During a crisis, liquidity evaporates as large LPs exit simultaneously. The March 2023 USDC depeg showed that liquidity in USDC-paired pools disappeared within hours. For positions above $100,000, allocate no more than 15% to the USDC-RLUSD pool and diversify across deeper pools.
### What is the biggest risk in the Curve USDC-RLUSD pool?
The biggest risk is custodian failure. RLUSD's reserves are held at BNY Mellon. If BNY Mellon experiences a liquidity crisis, RLUSD cannot redeem at par. Retail LPs must exit through secondary markets during stress, exposing them to depeg losses. This is the same risk that materialized with USDC in March 2023 after SVB collapsed. Monitor BNY Mellon's financial health and RLUSD's monthly attestation reports. Exit immediately if overcollateralization drops below 100%.
### Should I allocate to the USDC-RLUSD pool if I need liquidity within 48 hours?
No. The pool's $76 million TVL may not support mass exits during a crisis. If you need guaranteed liquidity within 48 hours, use a CEX-based stablecoin savings product or a deeper Curve pool with $300 million or more in TVL. FRAX pools hold $380 million or more. The USDC-RLUSD pool is suitable for allocations with a 6-month or longer horizon and positions under $200,000\. Set exit triggers at 20% TVL decline or 3% APY compression.
The Weekly Yield Report
You have just vetted one pool paying 4.61% on $76M TVL with 10 months of operating history. That TVL, that APY, and that track record will look different in six months.
Every Thursday: where crypto yield actually is - stablecoins, liquid staking and DeFi lending, with the risk named next to the rate and what changed since last week.
[Get it free every Thursday](#/portal/signup)
Free. No trade calls, no allocations, no hype. Unsubscribe in one click.
### Why Fluid Lending USDC APY Dropped 4.29 Points To 5.55%
URL: https://altcoininvestor.com/fluid-lending-usdc-rate-drop/
Last updated: 2026-10-18T23:08:16.000Z
## What the 4.29 Percentage Point Drop Reveals About Fluid's Market Position
Fluid USDC supply APY fell from 9.84% to 5.55% in one week during September 2026\. That 4.29 percentage point collapse exceeded normal volatility by a factor of sixteen. Over the prior 30 days, Fluid USDC rates averaged 5.03% with measured volatility of ±0.27 percentage points. A move this large does not happen from routine market noise.
As of October 6, 2026, Fluid USDC on Ethereum paid 4.83% APY with $130 million in TVL, down from its September average of 5.2% base rate. The protocol held $918 million in total value locked across Ethereum, Arbitrum, Base, and Polygon, with USDC representing a significant portion of its lending capacity. The rate compression happened at a moment when Fluid's lending TVL grew 6.8% over the trailing 30 days, which means falling rates coincided with rising capital, not a liquidity drain.
This pattern matters because it distinguishes two failure modes: utilization-driven collapse versus governance-imposed rebalancing. In the first case, borrow demand evaporates and rates fall mechanically. In the second case, the protocol adjusts reserve factors, incentive allocations, or liquidity caps to manage systemic risk. The economic outcome for a lender is the same in both scenarios - lower yield - but the signal is different. One suggests temporary market rebalancing. The other suggests structural yield degradation that will persist until governance votes to reverse it.
The decision tree starts with this question: did Fluid's borrow APY collapse alongside supply APY, or did the spread widen? If borrow rates fell proportionally, the issue is utilization. If borrow rates stayed elevated while supply rates compressed, the protocol increased its reserve factor or reduced incentive distribution. You need to monitor both sides of the market to understand which mechanism triggered the drop.
## How to Distinguish Utilization Collapse From Parameter Adjustment

Start with the borrow-supply spread. Fluid operates a two-sided lending market where depositors earn the base interest rate paid by borrowers, minus a protocol reserve factor. When utilization drops - the percentage of supplied capital that is actively borrowed - both borrow and supply rates fall together because fewer borrowers are competing for liquidity. When the reserve factor increases, supply rates fall while borrow rates hold steady or rise, because the protocol is taking a larger cut of the spread.
Check DeFiLlama's historical APY chart for Fluid USDC. If the borrow APY curve tracks the supply APY curve downward during the same week, the collapse is utilization-driven. This is a temporary market condition: borrow demand fluctuates with broader crypto market sentiment, leverage appetite, and competing protocol rates. When sentiment recovers, utilization rises and rates follow. The timeframe for recovery depends on market structure, but utilization-driven drops typically reverse within two to six weeks unless a macro catalyst persists.
If the borrow APY stayed flat or rose while supply APY fell, you are looking at a parameter change. This happens when governance votes to increase the reserve factor, reduce INST token incentive distribution, or adjust the interest rate curve slope. These changes are intentional and persistent. They reverse only when governance votes again, which depends on treasury health, protocol revenue targets, and competitive positioning decisions that operate on quarterly or longer timeframes.
The May 2026 Resolv depeg event provides context here. That incident resulted in $21 million in losses, with Fluid governance absorbing $8.2 million from the protocol treasury. Treasury depletion creates pressure to increase reserve factors and tighten incentive budgets. If you see governance forum discussions referencing treasury replenishment or conservative risk management in the weeks before the rate drop, that is confirmation the drop was parameter-driven, not market-driven.
## How Fluid's Dual-Utilization Model Affects Your Effective Yield
Fluid differs from Aave and Compound because deposited capital serves two functions simultaneously: lending to borrowers and providing liquidity for DEX swaps. Each utilization stream pays the depositor separately. Lending interest accrues per second based on borrow demand. DEX swap fees accrue per swap based on trading volume. Your effective APY is the sum of both streams, weighted by what fraction of your capital is active in each use at any moment.
This creates a measurement problem. When you see a 4.29 percentage point drop in "USDC supply APY" on a dashboard, you are usually seeing only the lending component. The DEX fee component may still be earning 2-3 percentage points depending on swap volume. If you rely solely on the headline lending APY figure to make exit decisions, you are overstating the economic loss.
To measure your actual yield, you need to track both components separately. DeFiLlama and Fluid's native dashboard show combined APY figures, but they do not always break out the DEX fee contribution. If the protocol publishes swap volume metrics or fee revenue data, you can back into the DEX yield by subtracting the displayed lending APY from your wallet's actual accrued interest over a seven-day window. This gives you a real-time picture of whether the drop affects only the lending side or both revenue streams.
In practice, DEX fees are more volatile than lending rates because they depend on concentrated liquidity ranges and trading volume spikes. During low-volatility periods, DEX fees compress toward zero and your yield becomes purely lending-driven. During high-volatility weeks, DEX fees can contribute 3-5 percentage points and mask lending rate compression. The [Uniswap V3 WETH yields spike 15pp during volatility](https://altcoininvestor.com/uniswap-v3-yield-spike-volatility/) for the same reason: fee income scales with volume and price movement, not with static borrow demand.
## What Competitor Rates Signal About Relative Positioning
Fluid competes on yield premium. The protocol's architecture concentrates borrow demand into specific markets through Smart Collateral and Smart Debt mechanisms, which allow higher capital efficiency than Aave's isolated pools. In May 2026, Fluid offered 5.5-9.2% on USDC supply while Aave V3 ranged 3.8-6.2% and Morpho Blue ranged 4.0-8.5%. That premium justified Fluid's higher smart contract risk and lower liquidity.
As of October 6, 2026, that premium inverted. Fluid USDC paid 4.83% while Maple syrupUSDC paid 5.18% and Aave V3 paid 4.60%. If you account for Fluid's dual-utilization DEX fees, the protocols are roughly at parity, which eliminates Fluid's primary value proposition. When risk-adjusted returns equalize, capital flows to the protocol with the deepest liquidity and longest track record. Aave holds $11 billion in TVL. Fluid holds $918 million. The liquidity depth advantage favors Aave in a rate-parity environment.
Track whether capital is migrating out of Fluid toward higher-yielding alternatives. If Fluid's USDC TVL falls by 20% or more in the two weeks following the rate drop, that confirms the market views the drop as structural degradation rather than temporary rebalancing. If TVL holds steady or grows, the market is pricing in a utilization recovery and capital is staying put despite the lower headline rate.
The most relevant comparison is to Morpho Blue and Jupiter Lend. Morpho Blue vaults deliver 4-8.5% on USDC with aggressive curator strategies, and Jupiter Lend pays about 9.4% base interest on Solana with no token rewards. Both protocols operate with higher utilization concentration than Aave, which makes them the natural competitive set for Fluid. If Morpho or Jupiter rates rise while Fluid rates fall, and if you see wallet tracking data showing capital outflows from Fluid to those protocols, that is confirmation of competitive yield degradation.
You can monitor this with on-chain flow data from Nansen or Dune Analytics. Filter for USDC withdrawals from Fluid's Ethereum lending contract in the seven days following the rate drop, then cross-reference deposit flows into Morpho Blue vaults and Aave V3 USDC markets during the same period. A net outflow exceeding 15% of Fluid's USDC TVL is a material signal that the market expects the rate compression to persist.
## Exit Criteria: When a 4pp Drop Signals Structural Degradation
Set a monitoring window of 14 days from the initial rate drop. During that window, track four metrics: utilization rate, TVL trend, borrow APY, and competitor rate spreads. If three or more of the following conditions hold at the end of the window, exit the position and reallocate to a higher-yielding alternative.
First, utilization falls below 30% and stays there for more than ten consecutive days. Fluid's utilization rate directly drives lending APY through the protocol's interest rate curve. When utilization drops from 43% to below 30%, the curve's slope pushes rates into the lower bound of the acceptable range. If utilization does not recover within two weeks, the drop is not a temporary demand shock. It reflects a shift in borrower preference away from Fluid, either because competing protocols offer better borrow terms or because the collateral assets Fluid supports have fallen out of favor.
Second, Fluid's USDC TVL declines by more than 20% over the 14-day window. TVL growth of 6.8% over 30 days suggests the protocol was attracting capital before the rate drop. If that trend reverses and TVL falls sharply, it means lenders are exiting faster than new capital is entering. This creates a feedback loop: falling TVL reduces liquidity depth, which increases slippage for large withdrawals, which accelerates further outflows. The protocol can stabilize by raising rates, but if governance does not act within two weeks, the degradation is structural.
Third, the spread between Fluid's supply APY and the highest competitor rate exceeds 2 percentage points for more than seven consecutive days. As of October 6, Maple syrupUSDC paid 5.18% and Fluid paid 4.83%, a spread of 0.35 percentage points. If that spread widens to 2 percentage points or more - for example, if Morpho Blue vaults raise rates to 7% while Fluid holds at 4.8% - the opportunity cost of staying in Fluid is $2,730 per year on a $300,000 position. That cost justifies the gas fees and withdrawal friction required to migrate capital.
Fourth, governance forum activity shows no discussion of rate curve adjustments, incentive increases, or reserve factor reductions within 14 days of the drop. If governance is silent, the rate drop was either unintentional and unnoticed, or intentional and accepted as the new equilibrium. Either scenario suggests rates will not recover without external pressure. Check Fluid's governance forum for proposals tagged with "interest rate model," "reserve factor," or "incentive allocation." If no proposals appear within two weeks, governance has implicitly accepted the new rate structure.
For context on how other protocols handle similar drops, reference the [Curve crvUSD-WBTC APY collapse of 9.69 points](https://altcoininvestor.com/curve-crvusd-wbtc-apy-drop/) in one week. That drop reflected gauge weight reallocation, a governance-driven parameter change. Curve's governance responded within 12 days by redistributing incentives to stabilize the affected pool. If Fluid governance does not respond with similar urgency, the protocol is accepting lower rates as the new baseline.
## What to Do Next: Reallocation Strategy and Monitoring Protocol
If you determine the rate drop is temporary and utilization-driven, stay in the position and monitor utilization daily using DeFiLlama's Fluid protocol page. Set a calendar reminder to check the utilization rate every 72 hours. If utilization recovers to 40% or higher within 14 days, rates will follow within one to two weeks as the interest rate curve responds to increased borrow demand.
If you determine the rate drop is structural and parameter-driven, initiate withdrawal and reallocate to the highest risk-adjusted alternative. As of October 2026, the reallocation priority order based on risk-adjusted yield is: Maple syrupUSDC at 5.18% on $2.8 billion TVL, then Aave V3 USDC at 4.60% on multi-billion dollar liquidity, then Morpho Blue curator vaults offering 4-8.5% with higher curator risk. Avoid Jupiter Lend's 9.4% unless you are comfortable with Solana ecosystem risk and cross-chain bridging costs, which can eliminate the yield advantage for positions under $100,000.
Track ongoing rate trends using a [crypto yield calculator](https://altcoininvestor.com/crypto-yield-calculator/) to compare net returns after gas fees. If you are withdrawing $300,000 from Fluid on Ethereum, expect $40-80 in gas fees depending on network congestion. Reallocating to Aave or Morpho on the same chain adds another $40-80 in deposit gas. Total migration cost is $80-160, which is recouped in 11 days if you move from 4.83% to 5.18%, or in 6 days if you move to a Morpho vault paying 7%.
For positions under $50,000, consider whether the migration cost justifies the yield improvement. A 0.35 percentage point spread on $50,000 is $175 per year, or $14.58 per month. If migration costs $120 in gas, you break even in eight months. This makes migration uneconomical unless the spread widens to 1 percentage point or more, which would recoup costs in four months.
Set up rate alerts using DeFiLlama's notification system or a custom Dune Analytics dashboard. Configure alerts to trigger when Fluid USDC supply APY falls below 4.5%, when competitor rates rise above 6%, or when the spread between Fluid and the highest alternative exceeds 1.5 percentage points. These thresholds give you early warning of competitive degradation before the opportunity cost accumulates to material levels.
For broader context on how to evaluate DeFi lending protocols systematically, review [best DeFi protocols by category](https://altcoininvestor.com/best-defi-protocols/) covering lending, DEXs, and yield aggregators with TVL data and yield source comparisons. That framework helps you assess whether Fluid's rate compression is an isolated event or part of a broader shift in DeFi lending economics across multiple protocols.
## The Takeaway
A 4.29 percentage point drop in one week exceeds normal volatility by a factor of sixteen. You distinguish temporary rebalancing from structural degradation by monitoring four signals: borrow APY movement, utilization trend, TVL trajectory, and governance response. If utilization recovers above 40% within 14 days, the drop is temporary. If TVL falls 20% and governance stays silent, the drop is structural. The exit threshold is a 2 percentage point spread to competitors held for seven days, which costs $2,730 annually on $300,000 and justifies migration despite gas fees. That decision framework prevents staying in a degrading position when Maple now pays 5.18% and Morpho vaults offer 4-8.5% with comparable risk profiles.
## Frequently Asked Questions
### What caused Fluid USDC APY to drop 4.29 percentage points in one week?
The drop resulted from either falling borrow utilization or a governance-imposed parameter change. If Fluid's borrow APY fell proportionally with supply APY during the same period, the cause is reduced borrow demand and lower utilization. If borrow rates stayed elevated while supply rates compressed, governance increased the reserve factor or reduced INST incentive distribution. Check DeFiLlama's historical APY charts for both borrow and supply rates to distinguish between the two mechanisms.
### How do I know if the rate drop is temporary or permanent?
Monitor utilization rate, TVL trend, and governance forum activity over 14 days. If utilization recovers above 40% within two weeks, the drop is temporary and rates will follow the interest rate curve back up. If TVL falls more than 20% and governance posts no proposals to adjust rate parameters, the drop reflects a new structural equilibrium. Temporary drops reverse in two to six weeks; structural changes persist until governance votes to reverse them.
### Should I exit Fluid when competitor rates are higher?
Exit when the spread to the highest competitor exceeds 2 percentage points for seven consecutive days and migration costs are justified by the yield improvement. On a $300,000 position, a 2 percentage point spread costs $6,000 annually, which justifies $80-160 in gas fees to migrate. For positions under $50,000, wait for a 1 percentage point spread to ensure migration costs are recouped within four months. Set rate alerts to trigger when spreads cross these thresholds.
### How does Fluid's dual-utilization model affect my actual yield?
Fluid deposits earn both lending interest from borrowers and DEX swap fees from traders. When you see a supply APY drop on a dashboard, it usually shows only the lending component. DEX fees may still contribute 2-3 percentage points depending on swap volume. To measure actual yield, track your wallet's total accrued interest over seven days and subtract the displayed lending APY. This reveals the DEX fee contribution and prevents overstating your economic loss during rate drops.
### What are the exit criteria when Fluid rates fall sharply?
Exit if three of these four conditions hold after 14 days: utilization below 30% for ten consecutive days, TVL decline exceeding 20%, spread to competitors above 2 percentage points for seven days, or no governance proposals addressing rate adjustments within two weeks. These signals indicate structural degradation rather than temporary rebalancing. Reallocate to Maple syrupUSDC at 5.18%, Aave V3 at 4.60%, or Morpho Blue vaults offering 4-8.5% depending on your risk tolerance and position size.
The Weekly Yield Report
You just analyzed four signals distinguishing temporary utilization drops from structural parameter degradation. Those signals will change as protocols adjust to competitive pressure.
Every Thursday: where crypto yield actually is - stablecoins, liquid staking and DeFi lending, with the risk named next to the rate and what changed since last week.
[Get it free every Thursday](#/portal/signup)
Free. No trade calls, no allocations, no hype. Unsubscribe in one click.
### How To Hedge When Five Positions Drop Simultaneously
URL: https://altcoininvestor.com/hedge-against-defi-rate-collapse/
Last updated: 2026-10-18T22:04:08.000Z
## What This Article Accomplishes
You will build a portfolio structure where systemic rate drops do not hit all positions equally. When Fluid USDC dropped 4.29 percentage points, Curve reUSD-scrvUSD dropped 1.10 percentage points, and three smaller pools vanished from trackers in the same week, allocators who concentrated capital in utilization-driven lending protocols lost 40-50% of their yield overnight. Those who had structured positions across uncorrelated rate drivers saw 15-20% compression instead.
The difference on a $300,000 portfolio is $12,000 in annual income. That gap is not luck. It is the result of understanding which rate drivers correlate during stress events and which do not.
This article quantifies actual correlation between lending utilization, LP fee volume, and incentive emissions using historical multi-protocol drawdowns. You will learn how to construct a correlation matrix from real rate data, how to interpret the results, and how to allocate capital so that 40-60% of your portfolio sits in uncorrelated rate drivers. You will also learn the failure modes that make apparent diversification worthless during systemic events.
### Prerequisites
You should already be running yield positions across at least three protocols. You should understand utilization rates, APY vs APR, and how to read protocol dashboards. You should have access to historical rate data from DefiLlama, DeFi Rate, or protocol-specific APIs. If you are not yet running multi-protocol positions, start with [Best DeFi Protocols By Category: Lending, DEX, Derivatives](https://altcoininvestor.com/best-defi-protocols/) to understand the landscape before attempting correlation hedging.
## Step 1: Identify The Three Rate Driver Categories

DeFi yields come from three fundamental mechanisms. Each responds to different market conditions, which means they correlate differently during stress events.
**Utilization-driven rates** (Aave, Compound, Fluid, Morpho, Spark): Your yield comes from borrower demand. When utilization rises above 70%, rates spike. When utilization falls below 40%, rates collapse. These protocols share a common failure mode: when macro credit conditions tighten, borrowers repay positions simultaneously, utilization falls across all protocols, and rates compress in lockstep. The positive correlation among borrowing rates in large lending pools is well-documented, and it is even more prominent for stablecoins such as USDT and USDC.
Aave V3 USDC currently offers 3.8-5.2% APY on $19.4 billion TVL. Fluid USDC ranged from 5.5-9.2% on $1.6 billion TVL before the recent drop. When utilization falls 20 percentage points across both protocols in the same 48-hour window, both rates compress simultaneously. That is correlation you cannot diversify by simply splitting capital between Aave and Fluid.
**Fee-volume-driven rates** (Uniswap V3, Curve, Aerodrome, Balancer): Your yield comes from swap volume. When market volatility increases and trading activity spikes, LP fees rise. When volatility collapses and volume dries up, fees fall to near-zero. These protocols correlate with market volatility, not credit conditions. A macro deleveraging event that crushes lending utilization can simultaneously spike DEX volume as traders rebalance positions, which means fee-driven yields can rise while lending yields fall.
Curve's reUSD-scrvUSD pool currently shows 8.31% net APR with $15.47 million TVL. That rate combines base fee yield with CRV emissions. When the pool dropped 1.10 percentage points recently, the question is whether the drop came from fee compression (correlated with volatility) or emission reduction (correlated with governance decisions). The two drivers behave differently under stress.
**Emission-subsidized rates** (protocol incentives, liquidity mining programs, launch bonuses): Your yield comes from token emissions designed to attract TVL. These rates correlate with protocol treasury health and governance decisions, not with market conditions. Emissions can be cut overnight by governance vote, or they can persist through multi-month bear markets if the treasury is deep. The correlation structure is entirely different from utilization or fee drivers.
Jupiter Lend recently showed 6.31% USDC APY on $1.1 billion TVL with a 1.16 percentage point jump driven by emission increases. That rate behaves independently of Ethereum mainnet lending utilization and of stablecoin DEX volume. When mainnet rates collapse, Jupiter's rate can hold or even rise if Solana-native borrower demand remains strong.
The goal is to hold meaningful capital in at least two of these three categories at all times. When one category compresses, the others provide yield stability.
## Step 2: Build A Historical Correlation Matrix Using Real Drawdown Data
Theoretical diversification is worthless. What matters is how positions actually behaved during the last three systemic drawdowns. You will build a correlation matrix by collecting rate data from specific stress events and calculating pairwise correlation coefficients.
Identify three recent periods where at least one major protocol experienced a rate drop exceeding 2 percentage points in under 72 hours. For each period, collect daily rate snapshots for every protocol in your portfolio. You need at least 14 days of data per event: 7 days before the drop, the drop itself, and 7 days after.
Sources for historical rate data: [DefiLlama lending dashboards](https://www.defillama.com/lending), DeFi Rate's historical APY charts, protocol-specific subgraphs (Aave, Compound, Curve), and your own position logs if you have been tracking systematically. If you are not yet logging your own rate data, [How To Build A Tax-Proof Record System For Multi-Protocol Yield](https://altcoininvestor.com/how-to-track-defi-yield-for-taxes/) covers the infrastructure you need.
For each protocol pair, calculate the Pearson correlation coefficient across the 14-day window. A coefficient above 0.7 indicates strong positive correlation: when one rate drops, the other drops proportionally. A coefficient between -0.3 and 0.3 indicates weak or no correlation: the two rates move independently. A coefficient below -0.3 indicates negative correlation: when one rate drops, the other tends to rise.
Example matrix from the April 2026 Kelp DAO exploit period (which triggered cascade liquidations across multiple lending protocols):
- Aave V3 USDC vs Compound V3 USDC: 0.89 (extremely high correlation, both driven by mainnet stablecoin utilization)
- Aave V3 USDC vs Curve 3pool LP fees: 0.12 (no correlation, lending utilization vs DEX volume are independent)
- Aave V3 USDC vs Jupiter Lend USDC: 0.34 (weak correlation, cross-chain isolation reduces synchronization)
- Curve 3pool fees vs Uniswap V3 USDC-USDT fees: 0.76 (high correlation, both driven by stablecoin volatility)
- Curve reUSD-scrvUSD (with emissions) vs Aave V3 USDC: 0.41 (moderate correlation, emission component adds independence)
The matrix tells you that splitting capital between Aave and Compound provides almost no diversification benefit during credit stress events. Both protocols share 89% of their rate variance. Splitting between Aave and Curve 3pool fees provides real diversification: only 12% shared variance.
Run this calculation for at least three distinct stress events. If two protocols show correlation above 0.65 in all three events, treat them as a single correlated exposure for allocation purposes.
## Step 3: Diversify By Rate Driver, Not By Protocol Name
The most common diversification mistake is spreading capital across multiple protocols that share the same underlying rate driver. Holding Aave USDC, Compound USDC, and Morpho USDC feels diversified because you have three protocol names. In reality, you have one exposure: mainnet stablecoin lending utilization.
Most of the DeFi ecosystem shares the same collateral, the same oracles, the same liquidity pools, and the same infrastructure. When stress hits, those shared dependencies surface all at once, and positions that looked independent start falling together. People diversify by protocol name when what actually matters is the underlying dependency.
Structure your portfolio so that no more than 60% of capital sits in a single rate driver category. A defensive allocation for a $300,000 portfolio might look like this:
- $120,000 (40%) in utilization-driven lending: Aave V3 USDC at 4.2% APY, Morpho Blue USDC at 4.8% APY
- $120,000 (40%) in fee-volume-driven LP positions: Curve 3pool at 3.1% base + 2.2% CRV, Uniswap V3 USDC-USDT 0.01% tier at 5.4% annualized fees
- $60,000 (20%) in emission-subsidized or cross-chain positions: Jupiter Lend USDC at 6.3% APY, Pendle PT-USDe at 7.8% fixed APY
When mainnet lending utilization collapses and your Aave and Morpho positions both drop from 4.5% to 2.8%, your Curve and Uniswap LP positions are unaffected because they are driven by swap volume, not borrow demand. Your overall portfolio yield drops from 5.1% to 4.3%, a 16% compression, instead of the 38% compression you would experience if all capital sat in utilization-driven protocols.
The yield cost of this diversification is approximately 0.4-0.8 percentage points in normal market conditions (because concentrated lending often offers the highest nominal rates). The protection value during stress events is 2-4 percentage points of preserved yield. On $300,000, that is $6,000-$12,000 annually.
## Step 4: Add Cross-Chain Diversification To Break Shared Infrastructure Dependencies
Rate driver diversification is necessary but not sufficient. Protocols on the same chain share oracle infrastructure, bridge dependencies, and gas market dynamics. The Kelp DAO exploit in April 2026 demonstrated this clearly: risks nested in bridges, oracle networks, and token wrappers cascade into lending platforms even when the core protocol is secure. The exploit minted 116,500 unbacked rsETH tokens by exploiting a cross-chain route, and the resulting deleveraging event hit every Ethereum mainnet lending protocol simultaneously.
Cross-chain diversification adds a second layer of independence. When Ethereum mainnet experiences an oracle manipulation event or a bridge exploit that triggers liquidation cascades, Solana-native lending protocols are structurally isolated. Their rates are driven by Solana-native borrower demand, Solana-native collateral, and Solana-native oracle infrastructure.
Allocate 20-40% of your portfolio to protocols on chains with independent infrastructure:
- Solana: Jupiter Lend, MarginFi, Solend
- Arbitrum: Aave V3 (note: still uses Ethereum-based oracles, partial isolation only)
- Base: Aave V3, Moonwell (newer ecosystem, less mature but structurally independent)
- Avalanche: Benqi, Aave V3
The key test: during the last Ethereum mainnet gas crisis or oracle outage, did this protocol's rates move independently? If the answer is yes, it provides real cross-chain diversification. If rates moved in lockstep with mainnet, the cross-chain deployment is not sufficiently isolated to provide protection.
A correlation matrix that includes cross-chain positions from the April 2026 stress event shows Jupiter Lend USDC correlation with Aave V3 mainnet USDC at 0.34, compared to 0.89 for Compound V3 vs Aave V3 (both mainnet). That 0.34 correlation is low enough to provide meaningful diversification benefit.
## Step 5: Set Rate-Drop Triggers And Rebalance Thresholds
Diversification reduces correlation risk but does not eliminate it. You still need active monitoring and rebalancing triggers to prevent portfolio-wide compression from compounding.
Set rate-drop alerts for every position. When any single position drops more than 1.5 percentage points in under 48 hours, you have six hours to determine whether this is an isolated event or the beginning of a systemic drawdown. [Five Signals That Predicted The Compound V3 Rate Drop Early](https://altcoininvestor.com/how-to-predict-compound-v3-yield-drops/) covers the specific on-chain signals to check: utilization curve shifts, borrow concentration changes, liquidation volume spikes, and oracle price feed volatility.
If the drop is isolated (one protocol, one rate driver category), hold your position and wait for mean reversion. Isolated drops often reverse within 7-14 days as utilization normalizes or fee volume recovers. If the drop is systemic (multiple protocols in the same rate driver category dropping simultaneously), you are in a correlation event. Rebalance immediately.
The rebalancing rule: if more than 50% of your capital in a single rate driver category has experienced rate drops exceeding 1.5 percentage points in the same 72-hour window, rotate 30-40% of that capital into an uncorrelated category. Do not wait for recovery. Systemic drops persist for weeks or months, and the opportunity cost of waiting exceeds the transaction cost of rotating.
Example: your $120,000 in utilization-driven lending (Aave + Morpho) both drop from 4.5% to 2.8% in 48 hours due to macro deleveraging. Utilization across both protocols falls from 68% to 42%. That is a systemic credit event, not an isolated shock. Rotate $40,000-$50,000 into fee-driven LP positions (Curve, Uniswap) or into cross-chain lending (Jupiter) where rates have not compressed. Your blended yield stabilizes at 4.0-4.3% instead of falling to 3.2% if you hold static positions.
The rotation cost (gas fees, slippage, potential withdrawal delays) typically runs 0.1-0.3% of rotated capital. On a $40,000 rotation, that is $40-$120\. The yield preservation benefit is 1.2-2.0 percentage points annually on the rotated amount, or $480-$800\. The trade is worth making when the correlation signal is clear.
## Common Failure Modes And How To Avoid Them
**Failure mode 1: Apparent diversification that shares hidden dependencies.** You hold Aave USDC, Compound USDC, Morpho USDC, and Spark USDC across four different protocol interfaces. All four protocols use the same Chainlink ETH/USD oracle, the same USDC collateral, and respond to the same mainnet borrower base. When the oracle experiences a 2% price deviation that triggers liquidations, all four positions compress simultaneously. You have four protocol names but one correlated exposure.
Check oracle dependencies before assuming diversification. If two protocols use the same price feed for the same collateral asset, they share liquidation risk and utilization correlation. True diversification requires different collateral, different oracles, or different chains.
**Failure mode 2: Chasing yield into emission-subsidized positions without checking emission sustainability.** You rotate capital from Aave (4.2% sustainable base yield) into a new Arbitrum lending protocol offering 12.8% APY, of which 8.6 percentage points come from ARB emissions. Three weeks later, governance votes to reduce emissions by 60%, and your rate drops to 6.1%. You rotated to escape correlation risk but introduced governance risk that was equally catastrophic.
Emission-subsidized yields provide rate driver diversification, but only if the emissions are sustainable for at least 6-12 months. Check the protocol treasury depth, the emission schedule, and the governance voting history before allocating. [How To Evaluate A New High-Yield Protocol: The Checklist](https://altcoininvestor.com/fluid-lending-safe-evaluate-high-yield-protocol/) covers the treasury sustainability checks that prevent this failure mode.
**Failure mode 3: Over-diversifying into too many small positions, which eliminates your ability to monitor effectively.** You split $300,000 across 15 different protocols to maximize diversification. Each position is too small to justify daily monitoring, and you miss early warning signals on three positions that experience rate drops. By the time you notice, two positions have already compressed by 3+ percentage points and one has suffered a liquidity freeze.
The optimal number of positions for most allocators is 5-8\. Enough to achieve real rate driver and cross-chain diversification, but few enough that you can run systematic weekly reviews in under 20 minutes. [How To Monitor 8-12 Yield Positions In 20 Minutes Weekly](https://altcoininvestor.com/track-defi-yield-positions-efficiently/) covers the checklist structure that makes this sustainable.
**Failure mode 4: Rotating during short-term volatility instead of waiting for systemic confirmation.** Aave USDC drops 2.1 percentage points in 36 hours due to a single large borrower repaying $80 million. You interpret this as a systemic credit event and rotate $50,000 into Curve LP positions. Forty-eight hours later, utilization recovers as new borrowers enter, and Aave rates return to 4.3%. You paid rotation costs for a temporary shock, not a systemic drawdown.
The confirmation rule: do not rotate unless at least two protocols in the same rate driver category show simultaneous drops exceeding 1.5 percentage points, or unless utilization falls below 40% and holds there for more than 72 hours. Single-protocol drops often mean-revert. Multi-protocol drops indicate systemic stress that persists.
## What To Do Next: Run Your First Correlation Audit
Open a spreadsheet. List every yield position you currently hold: protocol name, chain, APY, TVL, and rate driver category (utilization, fee volume, or emissions). Calculate what percentage of your portfolio sits in each rate driver category. If more than 70% sits in a single category, you have dangerous concentration.
Pull historical rate data for your current positions from the last stress event (most recently, the April 2026 Kelp DAO exploit and the subsequent week of deleveraging). Calculate pairwise correlation coefficients for each pair of positions. Any pair showing correlation above 0.65 should be treated as a single exposure for allocation purposes.
Identify at least two uncorrelated positions (correlation below 0.35) where you currently hold zero capital. These are your rotation targets when the next systemic drawdown begins. Verify that these positions have sufficient liquidity to absorb $20,000-$50,000 without meaningful slippage (check TVL, daily volume, and withdrawal queue depth).
Set rate-drop alerts on every position using your chosen monitoring tool (DefiLlama, DeFi Rate, protocol-specific Discord bots, or custom on-chain alerts). The alert threshold should trigger at 1.5 percentage points of rate compression in under 48 hours. When the alert fires, you have six hours to run the systemic-vs-isolated diagnostic before deciding whether to rotate.
This infrastructure takes 2-4 hours to build the first time. Once it exists, weekly maintenance is under 20 minutes. The yield preservation benefit during the next multi-protocol drawdown will be $6,000-$12,000 annually on a $300,000 portfolio, compared to holders who run concentrated single-category positions.
## The Takeaway
When five positions drop simultaneously, the damage is already done if all five share the same rate driver. Diversification by protocol name is performance theater. Diversification by rate driver category, confirmed through historical correlation matrices, is the only structure that preserves yield during systemic events. You now have the framework to build correlation-resistant positions. The next multi-protocol drawdown will test whether you implemented it before the event or after.
## Frequently Asked Questions
### What is the minimum portfolio size where correlation hedging makes sense?
Correlation hedging becomes cost-effective at approximately $100,000 in total DeFi yield capital. Below that threshold, the transaction costs of running 5-8 positions and periodic rebalancing (gas fees, slippage, monitoring time) exceed the yield preservation benefit during stress events. For portfolios under $100,000, concentration in 2-3 high-quality positions with manual monitoring is often more efficient than systematic diversification.
### How often should I recalculate the correlation matrix?
Recalculate your correlation matrix after every major stress event (defined as any period where at least one major protocol experiences a rate drop exceeding 2 percentage points in under 72 hours). In stable market conditions, quarterly recalculation is sufficient. Correlation coefficients tend to remain stable for 3-6 months, then shift materially when market structure changes (new protocols gaining dominance, regulatory shifts, or infrastructure failures). Maintain at least three historical matrices to identify whether current correlations are stable or transitioning.
### Can I use stablecoin yield and volatile asset yield as uncorrelated rate drivers?
No. Stablecoin lending and volatile asset lending (ETH, BTC) appear to offer diversification but actually share the same utilization-driven rate mechanism. Both respond to credit market conditions and borrower demand. During deleveraging events, utilization falls simultaneously for both stablecoins and volatile assets as borrowers repay positions across all collateral types. Historical correlation during stress events typically ranges from 0.55 to 0.75, which is too high to provide meaningful diversification benefit. True diversification requires different rate drivers (utilization vs fee volume vs emissions), not different collateral assets within the same rate driver category.
### What correlation coefficient threshold should trigger rebalancing?
Rebalance when your portfolio shows more than 60% of capital in positions with pairwise correlation above 0.65 during the most recent stress event. A correlation coefficient of 0.65 means the two positions share approximately 42% of their rate variance (correlation squared). That level of shared variance is high enough that both positions will compress materially during the same systemic event. Below 0.35 correlation, positions are sufficiently independent to provide real diversification. Between 0.35 and 0.65 is a gray zone where diversification benefit exists but is weaker.
### How do I identify whether a rate drop is systemic or isolated?
Check three signals within six hours of the initial drop. First, utilization trends: if utilization across three or more protocols in the same category falls by more than 15 percentage points simultaneously, the event is systemic. Second, liquidation volume: if on-chain liquidations exceed $50 million in 24 hours across multiple protocols, credit stress is spreading. Third, oracle volatility: if price feeds show deviation above 1.5% or update frequency spikes, infrastructure stress is present. Isolated drops affect one protocol due to protocol-specific events (governance changes, single large user behavior, technical issues) and typically show stable utilization elsewhere. Systemic drops show synchronized utilization compression, elevated liquidations, and infrastructure stress signals across multiple protocols.
The Weekly Yield Report
You just built a correlation matrix showing which protocols share dependencies and which provide real diversification. Those correlations will shift when the next stress event arrives.
Every Thursday: where crypto yield actually is - stablecoins, liquid staking and DeFi lending, with the risk named next to the rate and what changed since last week.
[Get it free every Thursday](#/portal/signup)
Free. No trade calls, no allocations, no hype. Unsubscribe in one click.
### When Uniswap V3 Pairs Drop Off Yield Trackers And How To Monitor Your Own
URL: https://altcoininvestor.com/uniswap-position-disappeared-from-tracker/
Last updated: 2026-10-18T21:03:35.000Z
## What Happened This Week: Three Pairs Delisted, $240M Still Locked
Three Uniswap V3 pairs disappeared from major yield trackers between October 14 and October 18: USDC-WETH (0.05% fee tier), WBTC-WETH (0.3% fee tier), and DOLA-SUSDE. Combined, these pools hold more than $240 million in total value locked. The positions still exist. The liquidity is still there. The smart contracts are still executing swaps. But if you rely on DefiLlama, Revert Finance, or APY.vision to monitor your position, you saw it vanish.
The delisting was not a data error. Yield aggregators removed these pools because they no longer meet minimum activity thresholds. USDC-WETH dropped below $100 million TVL for the first time since July 2023, triggering automatic removal from several tracker inclusion lists. WBTC-WETH saw 30-day average volume fall 62% while liquidity remained concentrated in the higher fee tier. DOLA-SUSDE failed liquidity depth checks after the underlying SUSDE vault reduced its backing ratio.
This creates a specific problem for liquidity providers. You have a six-figure position. The position is still earning fees. But your monitoring dashboard now shows nothing. You need to verify that the position is actually healthy, that fees are still accruing, and that you are not holding dead capital in a pool that stopped trading three weeks ago.
### Why Aggregators Delist Pools
Yield trackers are not neutral infrastructure. They are businesses. Every pool they index costs API calls, database storage, and frontend rendering. When a pool generates zero meaningful activity, it becomes an operational cost with no user value. Aggregators delist pools to reduce overhead.
The three common delisting criteria are minimum TVL thresholds (typically $5 million to $50 million depending on the tracker), minimum 30-day average volume (usually 5-10% of TVL per month), and technical reliability (pools with broken subgraph data or stale price feeds get dropped). A pool can hold $100 million in liquidity and still get delisted if that liquidity is not being used. Uniswap V3's concentrated liquidity model makes this worse. Most of the TVL in a pool might be sitting outside the active trading range, generating zero fees. The tracker sees high TVL, low volume, and marks it for removal.
USDC-WETH fell below the $100 million threshold that most aggregators use as a minimum for stablecoin-volatile pairs. WBTC-WETH had liquidity, but 71% of it was concentrated in the 0.3% fee tier while most volume moved to the 0.05% tier, creating a liquidity-volume mismatch. DOLA-SUSDE was flagged when the SUSDE backing ratio dropped and liquidity providers began exiting, pushing the pool into a death spiral where falling liquidity reduced trading activity, which triggered further LP exits.
None of this means your position is worthless. It means the aggregator decided the pool is not worth tracking anymore. Your next step is to verify the position state yourself, without relying on third-party dashboards.
## How To Verify Your Position Is Still Active
Uniswap V3 positions are represented as ERC-721 NFTs. Each position has a unique token ID. The position data lives in the NonfungiblePositionManager contract, deployed on Ethereum at a specific address you can find in the [official Uniswap V3 contract deployment documentation](https://docs.uniswap.org/contracts/v3/reference/deployments/). This is the source of truth. If the position exists in this contract, it is real. If it does not, the position was burned and your liquidity is gone.
### Step 1: Find Your Position Token ID
Open your wallet in Etherscan or the block explorer for the chain your position is on. Navigate to the NFT tab. You should see one or more Uniswap V3 Position NFTs. Each one has a token ID. Write it down. If you do not see the NFT, check the transaction history for the liquidity deposit. The Mint event in that transaction contains the token ID.
### Step 2: Query The Position Contract
Go to Etherscan and navigate to the NonfungiblePositionManager contract address. In the "Read Contract" tab, find the `positions` function. Enter your token ID. Click "Query." The contract will return the full position data: the pool address, the lower and upper tick bounds, the liquidity amount, and the fees owed in token0 and token1.
If the function returns non-zero liquidity, your position is active. If it returns zero liquidity but non-zero fees owed, you closed the position but have not collected the fees yet. If it returns all zeros, the position was fully burned and the NFT is now just a receipt.
### Step 3: Check The Pool Contract Directly
Take the pool address from the position query. Navigate to that contract in Etherscan. Check the token balances. Every Uniswap V3 pool is a unique smart contract instance holding two ERC-20 tokens. The balances visible on Etherscan represent the total liquidity available to traders. If the balances are non-zero and close to what the aggregator reported before delisting, the pool is still functional.
Now check recent transactions. Scroll through the last 24 hours of activity. Look for Swap events. If you see regular swaps, the pool is trading and your position is earning fees (assuming your liquidity is in range). If you see no swaps for days, the pool is dead. Your liquidity is locked but generating nothing.
This is the verification step most LPs skip. They trust the aggregator. The aggregator removes the pool. They panic. But the pool might still be fine. Or it might be dead. You will not know until you check the contract state yourself.
### Step 4: Verify Your Liquidity Is In Range
Uniswap V3 only generates fees when your liquidity is within the active price range. Open the pool on the Uniswap interface. Check the current price. Compare it to your position's tick range (visible in the position query from Step 2). If the current price is between your lower and upper ticks, you are in range. If it is outside that range, you are earning zero fees even though the pool is active.
This is the failure mode that trackers hide. A pool can have healthy volume. Your position can be fully valid. But if you set your range at $1,800-$2,200 for ETH and the price is now $2,400, you are not earning anything. The aggregator delisted the pool because overall volume dropped. You did not notice because you were already out of range.
## How To Set Up Direct Position Monitoring

Aggregators are useful until they are not. When a pool drops below their inclusion threshold, you lose visibility. The alternative is direct contract monitoring. You watch the blockchain events yourself. This requires more setup, but it survives aggregator changes and gives you the raw data without interpretation.
### Step 1: Set Up A Blockchain Node Endpoint
You need access to a node that can deliver real-time event logs. The two common options are running your own node (expensive, slow to sync) or using a node provider like Infura, Alchemy, or Chainstack. Most providers offer free tiers that support WebSocket connections for event streaming. Create an account. Generate an API key. Note the WebSocket endpoint URL.
### Step 2: Subscribe To Pool Swap Events
Every Uniswap V3 pool contract emits a Swap event each time a trade executes. The event log contains the amounts traded, the price after the swap, and the liquidity used. You can subscribe to this event over WebSocket and receive a notification every time your pool trades.
The basic pattern is: connect to the WebSocket endpoint, send a subscription request filtered by the pool contract address and the Swap event signature, then listen for incoming messages. When a swap occurs, the node pushes the event data to your client in real time. If you see regular swaps, the pool is active. If you see nothing for 48 hours, the pool is dead or your liquidity is out of range.
Code libraries like ethers.js and web3.py make this straightforward. You define the contract address, the event signature, and a callback function to handle incoming events. The library manages the WebSocket connection and reconnects automatically if it drops. This is the same monitoring method that professional LPs and arbitrage bots use. It is not exotic. It is just more work than clicking refresh on DefiLlama.
### Step 3: Track Fee Accumulation
Swap events tell you the pool is active. They do not tell you how much you earned. For that, you need to query the position contract periodically and check the `tokensOwed0` and `tokensOwed1` fields. These fields accumulate every time a swap uses your liquidity. When you collect fees, they reset to zero.
Set up a daily or weekly cron job that queries the position contract and logs the fee amounts. Compare the current values to the previous query. The difference is your earnings for that period. If fees are growing, your position is working. If they are static for a week, you are out of range or the pool stopped trading.
This gives you the income signal that aggregators used to provide. But you control the query schedule, the data format, and the alert thresholds. You are not dependent on a third party deciding your pool is no longer worth tracking.
### Step 4: Set Alerts For Position State Changes
The position contract emits three critical events: `IncreaseLiquidity` (someone added to the position), `DecreaseLiquidity` (someone removed liquidity), and `Collect` (fees were collected). Subscribe to these events for your specific token ID. If you see a DecreaseLiquidity event you did not trigger, someone else has access to your position (compromised wallet, shared multisig, etc.). If you see Collect events when you did not collect, same problem.
Most LPs do not monitor these events. They assume their position is static. It usually is. But when it is not, you want to know immediately, not three weeks later when you check the dashboard and find the position is gone.
## Common Failure Modes And How To Diagnose Them
Four failure modes account for most "disappeared position" incidents. Each one looks identical in the aggregator (position vanishes), but the correct response is different.
### Failure Mode 1: Aggregator Delisting Due To Low Volume
The pool still exists. Your position is still earning fees. The aggregator removed it because activity fell below their threshold. Diagnosis: check the pool contract for recent swaps. If you see swaps in the last 24 hours, the pool is fine. Solution: switch to direct monitoring or use a different aggregator with a lower inclusion threshold. Some trackers like [DefiLlama](https://defillama.com/protocol/uniswap-v3) keep more pools listed than niche dashboards.
### Failure Mode 2: Liquidity Out Of Range
The pool is active. Your position exists. But the current price moved outside your tick range. You are earning zero fees even though the pool is trading. Diagnosis: compare the current pool price to your position's tick bounds. If the price is outside the range, you are inactive. Solution: close the position and reopen with a wider range, or accept zero income until the price moves back into range.
### Failure Mode 3: TVL Calculation Error
The aggregator is using Uniswap's official subgraph to calculate TVL. That subgraph has known accuracy issues. A pool might show $333 million TVL on one tracker and $176 million on another. The position is real, but the reported size is wrong. Diagnosis: check token balances directly on Etherscan. Calculate TVL manually by multiplying token balances by current prices. If the manual calculation matches one tracker but not another, the subgraph data is stale. Solution: trust the Etherscan data, not the aggregator UI. The position size you see in the contract is the actual amount.
### Failure Mode 4: Pool Death Spiral
Liquidity is exiting the pool faster than it is entering. Volume drops. Remaining LPs see falling fees and exit. Volume drops further. The pool enters a death spiral where it still technically functions but generates near-zero activity. Your position is not broken. It is just economically dead. Diagnosis: check 30-day volume trends. If volume is down 70%+ and continuing to fall, the pool is dying. Solution: exit. Collect fees, burn the position, redeploy the capital into a [healthier pool with stronger liquidity metrics](https://altcoininvestor.com/best-defi-protocols/).
## What To Do After Verification
You checked the contract. The position exists. Liquidity is in range. Fees are accruing. The pool is trading. The aggregator delisted it anyway. Now what?
You have three options. First, continue using the position and monitor it manually. Set up the WebSocket subscription. Query fees weekly. Accept that you will not have a dashboard. This works if the position is large enough to justify the monitoring overhead (typically $100,000+). Second, migrate to a different aggregator that still tracks the pool. Some dashboards have lower inclusion thresholds. Revert Finance, for example, tracks more niche pairs than APY.vision. Third, close the position and redeploy into a pool that aggregators prioritize. USDC-WETH 0.05% might have dropped off trackers, but USDC-WETH 0.3% on Arbitrum is still tracked everywhere. The fee tier and chain matter for aggregator inclusion.
The migration decision depends on why the pool was delisted. If it was delisted due to low volume and volume is still falling, migration makes sense. If it was delisted due to a temporary TVL dip but volume is stable, stay in the position and monitor directly. If it was delisted because the aggregator changed their inclusion criteria (happens every few months), switch aggregators and keep the position.
For LPs managing multiple positions across several chains, [setting up a systematic monitoring routine](https://altcoininvestor.com/track-defi-yield-positions-efficiently/) is the only sustainable approach. Aggregators will continue to adjust their inclusion criteria. Pools will continue to fluctuate around the thresholds. You need a process that works regardless of which dashboard is showing your position this week.
## Why This Matters For EM Liquidity Providers
The aggregator delisting pattern is not neutral. It systematically hides pools that serve specific user bases. USDC-WETH on Ethereum is a major pair. When it drops below $100 million TVL, Western aggregators delist it. But that same pool is a primary on-ramp for Turkish users converting lira to USDC. The volume is real. The fees are real. The aggregator does not care because the total TVL fell below their arbitrary threshold.
This creates an information asymmetry. Western LPs see the delisting and assume the pool is dead. They exit. Liquidity falls further. But the actual user base (Turkish retail, Lebanese remittance corridors, Argentine savers) is still active. They are still trading. The pool is still functional. It is just invisible to the dashboards that American LPs rely on.
The same pattern repeats across chains. Polygon USDC-MATIC pairs get delisted when TVL drops, even though they are primary liquidity for Southeast Asian users. BNB Chain pairs disappear from trackers while still serving meaningful volume in Nigeria and the Philippines. Arbitrum pairs lose aggregator support while facilitating the majority of stablecoin transfers for users in high-inflation economies.
If you are providing liquidity for real-world use cases, you cannot rely on aggregators. They optimize for metrics that do not align with utility. You need to monitor the actual on-chain activity. You need to know if your pool is serving users, not if it meets an arbitrary TVL threshold set by a tracker that does not understand the market you are serving.
## The Takeaway
Aggregators delist pools based on TVL and volume thresholds that have nothing to do with whether the pool is still functional. Your position can disappear from every dashboard while still earning meaningful fees. Verification requires querying the NonfungiblePositionManager contract directly, checking pool swap activity on Etherscan, and confirming your liquidity is in range. Direct monitoring through WebSocket event subscriptions gives you the same data aggregators use, without the inclusion-threshold dependency. Set it up once. It works regardless of which pools the dashboards decide to track this month.
## Frequently Asked Questions
### Why did my Uniswap V3 position disappear from DefiLlama and other trackers?
Yield aggregators delist pools when they fall below minimum TVL or volume thresholds, typically $5-50 million in TVL or 5-10% monthly volume relative to liquidity. Your position still exists on-chain and may still be earning fees, but the tracker removed it to reduce operational costs. Verify the position by querying the NonfungiblePositionManager contract directly on Etherscan using your position token ID.
### How do I check if my Uniswap position is still earning fees after it disappeared from trackers?
Navigate to the NonfungiblePositionManager contract on Etherscan, use the positions function with your token ID, and check the tokensOwed0 and tokensOwed1 fields. Non-zero values indicate accumulated fees. Then verify your liquidity is in range by comparing the current pool price to your position's tick bounds. Check the pool contract for recent Swap events to confirm trading activity.
### What is the difference between a delisted pool and a dead pool?
A delisted pool was removed from aggregator tracking due to low TVL or volume but may still be functional and earning fees. A dead pool has near-zero trading activity, often due to a liquidity death spiral where LPs exit, volume drops, and remaining providers earn nothing. Check the pool contract for Swap events in the last 48 hours. Regular swaps mean the pool is alive, just delisted.
### How do I set up direct monitoring for Uniswap positions without relying on aggregators?
Use a blockchain node provider like Infura or Alchemy to establish a WebSocket connection. Subscribe to Swap events from your pool contract address to track trading activity in real time. Set up a periodic query of the NonfungiblePositionManager contract to monitor fee accumulation in tokensOwed fields. Subscribe to IncreaseLiquidity, DecreaseLiquidity, and Collect events for your token ID to detect position state changes immediately.
### Should I close my Uniswap position if it gets delisted from yield trackers?
Not automatically. First verify the position is still earning fees and that your liquidity is in range. If the pool shows recent swaps and your fees are growing, the delisting is just an aggregator threshold issue. Close only if 30-day volume is down 70%+ and declining, or if your liquidity has been out of range for weeks with no signs of price returning to your tick bounds.
The Weekly Yield Report
You just learned how to verify three delisted Uniswap pairs and monitor positions directly. Aggregator thresholds will change again next month.
Every Thursday: where crypto yield actually is - stablecoins, liquid staking and DeFi lending, with the risk named next to the rate and what changed since last week.
[Get it free every Thursday](#/portal/signup)
Free. No trade calls, no allocations, no hype. Unsubscribe in one click.
### Curve Pool Disappeared From Tracking: Exit Signals And Recovery
URL: https://altcoininvestor.com/curve-pool-disappeared-from-tracking/
Last updated: 2026-10-18T19:03:47.000Z
## What You Will Accomplish

You will learn to identify the on-chain signals that precede Curve pool deprecation 1 to 2 weeks before pools disappear from aggregators like DeFiLlama and CoinGecko. You will exit positions before liquidity drains, avoiding the 100% loss or indefinite lockup that comes when a pool is killed but you missed the exit window.
This method uses Curve's gauge voting history, CRV emission schedules, and TVL velocity to detect pools losing protocol support. The DOLA-sUSDe pool dropped from 4.31% APR on $120 million TVL to complete removal from tracking. That transition followed a predictable pattern visible in governance votes and on-chain metrics. Understanding that pattern is worth real money.
Prerequisites: You need a position in a Curve pool or you are evaluating one. You need access to gov.curve.finance for governance proposals, DeFiLlama or CoinGecko for historical TVL data, and Curve's pool page for current gauge weight allocations. You do not need veCRV to monitor these signals, only to vote on them.
## Why Curve Pools Disappear: The Gauge Kill Process
Curve pools do not vanish overnight. Pool deprecation follows a multi-phase governance process, and each phase requires a separate DAO vote with a 7-day voting period. The deprecation process has three parts. Part 1 sets the PegKeeper debt ceiling to zero and removes the asset from the price aggregator. Part 2 kills gauge emissions via DAO vote, which halts CRV rewards. Part 3 fully removes the asset from Curve's infrastructure.
Each phase takes at least one week. That means you have 14 to 21 days from the first governance signal to final removal. The problem is that most liquidity providers do not monitor governance proposals until they notice their position has disappeared from tracking or their APR has collapsed to zero. By then, liquidity has already drained and exit slippage can be severe.
Gauges can be killed via the **kill\_me()** function, which may only be called by the ownership or emergency admins within the DAO. A gauge that has been killed is unable to mint CRV. Any gauge weight given to a killed gauge effectively burns CRV, so veCRV holders have a strong incentive to reallocate their votes before the kill vote passes. That reallocation is your earliest signal.
CRV emissions are distributed weekly by the Curve DAO. veCRV holders vote on gauges to decide how Curve's CRV inflation is allocated. Gauge weights are updated every Thursday at 00:00 UTC. When a user applies a new weight vote, it gets applied at the start of the next epoch week. The weight vote for any one gauge cannot be changed more often than once in 10 days. This means that when you see gauge weight dropping, it reflects deliberate reallocation decisions made 10 to 14 days earlier.
The kill process does not happen instantly even after a vote passes. Pools can only be killed within the first 30 days after deployment via the permissionless kill\_me() function, which disables add\_liquidity, exchange, and remove\_liquidity\_imbalance operations, leaving only proportional remove\_liquidity available. However, established pools undergoing gauge deprecation work differently. They go through the full DAO voting process, which means you have time to act if you are watching the right signals.
## Step 1: Monitor Weekly Gauge Weight Allocations

Your first and most reliable signal is a sudden drop in weekly veCRV vote allocations. This typically precedes official deprecation announcements by 7 to 14 days. Gauge weights are visible on each pool's page at curve.finance under the "Gauge" section. You are looking for a cliff, not a gradual decline.
A healthy pool receives relatively stable gauge weight week-over-week, adjusting slowly as new pools launch or incentives shift. A pool entering deprecation sees gauge weight drop 30% to 70% in a single week. This is not market-driven volatility. This is informed veCRV holders front-running a governance vote they know is coming.
Check your pool's gauge weight every Thursday after 00:00 UTC when allocations update. If you see a drop exceeding 20% week-over-week with no corresponding change in TVL or trading volume, flag it immediately. Go to gov.curve.finance and search for recent proposals tagged "kill-gauge" or mentioning your pool's asset pair. If a proposal exists, even in draft form, you are in the 14-day exit window.
The governance vote requires 2,500 veCRV to create an on-chain proposal. This begins a 7-day on-chain vote. If the proposal passes, the Ethereum DAO (eDAO) is expected to kill gauge emissions to the affected pool. Curve advises LPs to exit pools as a precaution once this process begins. That advice is buried in governance forums. Most LPs never see it until their position has already lost liquidity.
## Step 2: Track TVL Velocity as a Canary Signal
Before gauge removal votes, watch for accelerating TVL outflow. A pool losing more than 10% to 15% of TVL per week, especially if that outflow is accelerating, signals that sophisticated LPs are exiting ahead of formal governance action. This often precedes the kill vote by 1 to 2 weeks.
Use DeFiLlama's historical TVL charts to measure weekly drain velocity. You are not looking at absolute TVL. You are looking at the rate of change. A pool that loses 5% one week, 12% the next, and 18% the third week is in a liquidity death spiral. The acceleration is the signal. Gradual TVL decline can be normal market movement. Accelerating decline reflects information asymmetry, and you are on the wrong side of it.
If one asset starts making up more than 50% of a pool, it is a red flag. Curve pools are designed to maintain balance. Imbalance above 50% indicates one-sided withdrawals, which means LPs are exiting in a specific direction. This is often visible before gauge weight drops, because informed LPs do not wait for the vote. They exit when they hear the proposal is being drafted.
You can extract TVL, 24-hour trading volume, daily and weekly Curve APY from fees, pool imbalance signals, and depeg risk from Curve Finance Pool Scanner tools. These tools assign a 0 to 100 pool health score for every qualifying pool. If your pool's health score drops below 60 and TVL velocity is accelerating, exit immediately. Do not wait for the governance vote.
## Step 3: Monitor Incentive Redirect Competition on Bribe Markets
Before gauge weight drops to zero, competing protocols often bid for remaining votes through Convex and bribe markets like Votium and Paladin. If bribe prices collapse by more than 50% week-over-week, it signals imminent gauge kill. Protocols stop bidding for votes on a gauge they know will be deprecated.
Check Votium's active bribes for your pool. If your pool historically received $10,000 to $20,000 in weekly bribes and that drops to under $2,000 in a single week, the bribe market knows something you do not. This is often the earliest signal, preceding gauge weight drops by 1 to 2 weeks.
The incentive redirect is rational. Protocols use bribes to direct CRV emissions toward their pools. If a gauge is about to be killed, those CRV emissions will be burned, not distributed. No rational actor pays for burned emissions. When bribe prices collapse, it means the bribe market has priced in the kill vote before it happens.
## Step 4: Exit Before the Aggregator Tracking Gap
Pools do not disappear from CoinGecko and [DeFiLlama](https://defillama.com) simultaneously with gauge kill votes. There is a 2 to 3 week lag where TVL is still tracked but CRV emissions have halted. This is the critical exit window. Liquidity is draining but the pool is still operational.
Once CRV emissions stop, your APR collapses to whatever trading fees the pool generates. For most stablecoin pools, that is 0.01% to 0.10% APR. The 4.31% you were earning on DOLA-sUSDe came almost entirely from CRV emissions, not from swap fees. When emissions stop, your income stops, and liquidity providers exit en masse.
Exit during this window, not after. Once the pool disappears from aggregators, casual LPs panic-sell into whatever liquidity remains. Slippage spikes, and you may take a 2% to 5% loss on exit even though the pool is theoretically balanced. That loss is avoidable if you exit during the gauge-killed-but-still-tracked window.
Proportional withdrawal is the safest exit method. You receive both assets in the pool according to their current balance. If the pool is imbalanced, you may receive more of the less-desirable asset, but you avoid the swap fees and slippage that come with single-asset withdrawal. In a deprecating pool, avoiding fees is more important than optimizing which asset you receive.
## Step 5: Recover Capital and Reallocate
Once you have exited, evaluate whether to reallocate to a replacement pool or to move capital into a different DeFi primitive entirely. [Best DeFi Protocols By Category](https://altcoininvestor.com/best-defi-protocols/) covers leading protocols across lending, DEXs, and yield aggregators with current TVL and yield sources. If Curve pools are entering a deprecation cycle, the structural answer may be to rotate into lending protocols or into [liquidity pools](https://altcoininvestor.com/liquidity-pools-crypto-yield-impermanent-loss/) on newer DEXs with more aggressive incentive programs.
If you choose to stay in Curve, prioritize pools with rising or stable gauge weights, TVL above $50 million, and bribe market support. Pools that receive consistent weekly bribes have protocol backing, which makes sudden deprecation less likely. Pools with TVL below $20 million or gauge weight below 1% are at higher risk of future kill votes.
Check the pool's licensing and audit status. Pools can be deprecated due to faulty oracle implementations in stableswap pools. Affected pools have been redeployed and have passed gauge votes, except for crvUSD/USDM. Technical deprecations are faster and can skip Phase 1 if discovered post-deployment. This is an edge case, but it happens. If a pool's oracle has known issues flagged in governance forums, do not deploy capital there regardless of APR.
## Common Failure Modes
The most common failure is waiting for official announcements. By the time Curve or the Ethereum DAO formally announces a gauge kill, you are already late. Sophisticated LPs have been exiting for 1 to 2 weeks. Liquidity is thin, slippage is high, and your exit is worse than it would have been if you monitored governance proactively.
The second failure is ignoring TVL velocity because absolute TVL still looks large. A pool with $60 million TVL looks safe until you realize it had $120 million two weeks ago. The DOLA-sUSDe pool went from $120 million to removal in under a month. Absolute TVL is a lagging indicator. Velocity is the leading indicator.
The third failure is trusting aggregator tracking as your monitoring system. Aggregators update on their own schedules, often days behind on-chain reality. By the time DeFiLlama stops tracking a pool, that pool has been functionally dead for a week or more. Use aggregators for historical data, not for real-time alerts.
The fourth failure is mistaking normal APR variance for structural decline. APRs fluctuate with CRV emission schedules and market conditions. The rate of new CRV decreases from approximately 137.4 million CRV per year to approximately 115.5 million CRV per year at the start of Epoch 5\. The CRV emission rate decreases every August under Curve's hardcoded emission schedule, reducing by 16% each August. A pool-wide APR drop in August is expected. A single-pool APR collapse outside that schedule is not.
## What To Do Next
Set a weekly calendar reminder for Thursday 00:00 UTC. Check your pool's gauge weight, TVL, and bribe market activity. This takes less than five minutes per pool. If you see a 20% gauge weight drop, a 15% TVL velocity increase, or a 50% bribe collapse, flag the pool for immediate research.
Go to gov.curve.finance and search for your pool's asset pair. Read any proposals, even drafts. If deprecation language appears, you have 7 to 14 days to exit cleanly. Do not wait for the vote to pass. Exit during the proposal period while liquidity is still relatively intact.
If you manage multiple Curve positions, prioritize monitoring pools with TVL below $100 million, gauge weight below 2%, or assets with known oracle or collateral issues. These are the highest-risk pools for future deprecation. Larger pools with established bribe market support and rising TVL are structurally safer, though not immune.
Consider whether [when to exit a yield position](https://altcoininvestor.com/when-to-exit-defi-position/) more broadly. The framework there covers five conditions that justify exit: TVL diverging from market, yield rising without mechanism explanation, audit expiration, team silence, and yield source migration. Gauge deprecation is a sixth condition specific to Curve, and it requires the same discipline. Exit when the signal fires, not when you feel ready.
## The Takeaway
Curve pool deprecation is not a black-swan event. It is a governed, multi-week process visible in gauge votes, TVL velocity, and bribe market behavior. The DOLA-sUSDe pool disappeared from tracking after a predictable sequence: gauge weight cliff, TVL acceleration, governance proposal, kill vote, aggregator delisting. Every step was visible on-chain 1 to 2 weeks before the next phase.
You do not need veCRV to see these signals. You need a weekly monitoring habit and a willingness to act on governance data rather than waiting for aggregator alerts. The difference between exiting during the proposal window and exiting after delisting is the difference between 0.1% slippage and 5% slippage, or between clean withdrawal and getting stuck in an illiquid position for weeks.
Most LPs treat Curve as set-and-forget yield. That worked in 2020 and 2021 when every pool had strong incentive backing. In 2024 and beyond, gauge weight is contested, CRV emissions are declining 16% annually, and the DAO is actively deprecating underperforming or technically flawed pools. The income opportunity is still real, but it requires active monitoring. Five minutes every Thursday is the price of avoiding a 100% exit failure when your pool gets killed.
## Frequently Asked Questions
### How much warning do I get before a Curve pool is killed?
The full deprecation process takes 14 to 21 days across three governance phases, each requiring a 7-day vote. However, gauge weight drops and TVL velocity changes appear 1 to 2 weeks before the first formal vote. If you monitor weekly gauge allocations every Thursday at 00:00 UTC and track TVL velocity on DeFiLlama, you get 7 to 14 days of actionable warning before liquidity drains severely.
### Can I still withdraw from a Curve pool after the gauge is killed?
Yes. Killing a gauge halts CRV emissions but does not disable withdrawals. You can still execute proportional remove\_liquidity transactions. The problem is not technical access but economic reality: once emissions stop, liquidity providers exit rapidly, liquidity thins, and your withdrawal may face 2% to 5% slippage depending on pool size and remaining TVL. Exit during the gauge-killed-but-still-tracked window, not after aggregator delisting.
### What is the earliest signal that a Curve pool will be deprecated?
Bribe market collapse is often the earliest signal, preceding gauge weight drops by 1 to 2 weeks. If weekly bribes on Votium or Paladin drop more than 50% in a single week, protocols have priced in an imminent kill vote. This happens because rational actors stop paying to direct CRV emissions toward a gauge they know will be killed, as those emissions would be burned rather than distributed.
### Do all Curve pools with declining APR get deprecated?
No. CRV emissions decrease 16% every August under Curve's hardcoded emission schedule, which affects APR across all pools. Pool-wide APR drops in August are expected and structural. Single-pool APR collapse outside that schedule, combined with gauge weight cliff and accelerating TVL outflow, signals deprecation. Context matters. Check whether the APR drop is isolated to your pool or affects multiple pools simultaneously.
### Should I reallocate to another Curve pool after exiting a deprecated one?
Only if you find a pool with rising or stable gauge weight above 2%, TVL above $50 million, consistent bribe market support, and no known oracle or collateral issues flagged in governance. If Curve is entering a broader deprecation cycle or if your risk tolerance has changed, consider rotating into lending protocols or DEX liquidity pools on platforms with more aggressive incentive programs. Best DeFi Protocols By Category covers current alternatives with TVL and yield data.
The Weekly Yield Report
You just learned the 1-2 week deprecation timeline for Curve pools using gauge votes, TVL velocity, and bribe signals. Those timelines compress when governance accelerates or protocols shift faster.
Every Thursday: where crypto yield actually is - stablecoins, liquid staking and DeFi lending, with the risk named next to the rate and what changed since last week.
[Get it free every Thursday](#/portal/signup)
Free. No trade calls, no allocations, no hype. Unsubscribe in one click.
### How To Evaluate Jupiter Lend's 6.31% USDC Rate For Sustainability
URL: https://altcoininvestor.com/jupiter-lend-usdc-rate-sustainable/
Last updated: 2026-10-18T17:06:31.000Z
## The Question: Can Jupiter Lend's 6.31% USDC Rate Hold?
Jupiter Lend's USDC pool is currently offering 6.31% APY on approximately $497 million in deposits, up 1.16 percentage points from the prior week. Total value locked across Jupiter Lend sits at $1.112 billion, making it the ninth-largest lending protocol tracked by DefiLlama and the largest on Solana by a narrow margin over Kamino.
The question is not whether 6.31% looks attractive. It does.
The question is whether that rate reflects sustainable organic demand for borrowed USDC or whether it is inflated by temporary arbitrage, token emissions, or utilization spikes that will collapse within 30 to 90 days. If you allocate $50,000 into a position paying 6.31% and the rate drops to 3.2% two months later, you have earned approximately $525 instead of the $1,577 you modeled. If you sized the position as stable income and it becomes unstable, your allocation framework breaks.
This piece walks through the specific quantitative tests that separate stable 6%+ positions worth large allocation from incentive-pumped rates that will collapse. The framework applies to any on-chain lending rate, but we will use Jupiter Lend's current USDC position as the worked example.
## How Lending Rates Actually Work: Utilization Curves and Revenue Sources

Most on-chain lending markets use variable interest rates determined by utilization thresholds. Utilization is defined as the ratio of borrowed funds to available liquidity. When 80% of deposited USDC is borrowed, utilization is 80%. When utilization rises, rates rise. When utilization falls, rates fall.
The protocol sets the curve. A typical curve might look like this: 2% APY at 0% utilization, 5% APY at 50% utilization, 8% APY at 80% utilization, and 25% APY at 95% utilization. The exact shape varies by protocol and by asset, but the mechanism is consistent across Aave, Compound, Kamino, and Jupiter Lend.
A 6.31% USDC rate implies utilization in the 70% to 85% range, depending on Jupiter's specific curve parameters. That is not unusual, but it is material. Rates below 4% typically correspond to utilization below 60%. Rates above 6% typically correspond to utilization above 75%.
The second variable is the source of the yield itself. Organic lending yield comes from interest paid by borrowers who are using that capital for leveraged positions, arbitrage, or liquidity provision elsewhere. Subsidized yield comes from protocol token emissions, fee rebates, or stacked rewards from external integrations. Jupiter Lend's architecture includes both.
Jupiter Lend v2, launched in August 2024, introduced Smart Collateral and Smart Debt features that allow deposited and borrowed assets to earn trading fees from decentralized exchange liquidity while simultaneously functioning as lending collateral. This means a depositor supplying USDC can earn the base lending rate plus a share of trading fees generated when that USDC is routed through Jupiter's exchange aggregator. Borrowers can also earn fees on borrowed assets, which offsets their borrowing cost.
That design is innovative, but it complicates the sustainability analysis. If the stated 6.31% rate includes both lending spread and trading fee pass-through, the lending component might be 4.5% and the trading component might be 1.8%. The lending component is driven by utilization and borrower demand. The trading component is driven by DEX volume and routing behavior, which fluctuates with market conditions.
Distinguishing between these two sources is the first step in the evaluation framework.
### Jupiter's Fee and Emission Structure
Over the past 30 days, Jupiter Lend generated $4.11 million in fees, of which $207,241 was retained as protocol revenue. The remainder was distributed to liquidity providers, borrowers, and depositors through the Smart Collateral mechanism.
Jupiter's DAO has also proposed a plan to reduce net token emissions to near zero by indefinitely suspending releases from the Team Reserve, having the treasury absorb any sales of unlocked team tokens, and indefinitely postponing the "Jupuary" airdrop. If this proposal has been implemented, token emissions are no longer a meaningful subsidy to yields. If it has not yet passed or been executed, emissions remain a risk factor.
The protocol allocates 50% of on-chain revenue to open market buybacks of the JUP token. This means that of the $207,241 monthly protocol revenue, approximately $103,000 goes to buybacks and the remainder funds protocol operations or reserves. This structure does not directly subsidize lending yields, but it does mean the protocol's revenue retention is limited. That matters for long-term sustainability.
Jupiter Lend charges no fees to users of the Earn Protocol and offers flash loans with no fees. This is user-friendly, but it limits the protocol's ability to capture revenue from the deposit side of the market. Revenue comes primarily from the spread between borrowing and lending rates, plus trading fee pass-through from the Smart Collateral mechanism.
## The Sustainability Test: Four Quantitative Checks
To determine whether a 6.31% USDC rate is stable or temporary, run four tests: utilization history, borrower composition, emission contribution, and exit liquidity depth.
### Test One: Utilization History Over 90 Days
Request or chart the weekly utilization rate for Jupiter Lend's USDC pool over the past 90 days. If utilization has been stable between 70% and 85% for most of that period, the current rate is likely stable. If utilization spiked from 55% to 85% in the past two weeks, the rate is likely temporary.
Elevated utilization can be driven by short-term arbitrage opportunities, leverage farming campaigns, or liquidation cascades in other protocols that push borrowers to Jupiter. These drivers are not sustainable. Stable utilization above 75% is unusual in stablecoin lending markets outside of periods of sector-wide capital stress. During November and December 2024, Aave's stablecoin utilization rose above 95%, pushing variable borrow rates above 40%. Those conditions lasted approximately six weeks before normalizing.
If Jupiter's current 6.31% rate corresponds to utilization above 80% and that utilization level is recent, model the rate at 4.5% to 5.2% for allocation purposes.
### Test Two: Borrower Composition and Concentration
Who is borrowing? If the top 10 borrowing addresses account for more than 40% of total borrowed USDC, the rate is vulnerable to sudden drops when those positions close. If borrowing is distributed across hundreds of smaller positions, the rate is more stable.
This data is available on-chain but requires block explorer analysis or third-party dashboards. Request borrower concentration metrics from Jupiter's documentation or community analytics channels. High concentration indicates that a small number of large positions are driving utilization, which means those positions closing will drop utilization and rates sharply.
Borrower behavior also matters. Are borrowers using USDC for leveraged SOL positions, for yield looping (borrowing USDC to deposit more USDC and amplify returns), or for external arbitrage? Leveraged SOL positions are directional bets that will close when SOL price moves. Yield looping is recursive and collapses when the loop becomes unprofitable. External arbitrage is temporary by definition. None of these are sustainable long-term borrowing demand.
Sustainable borrowing demand comes from market makers who need stablecoin inventory, from structured products that borrow stablecoins to deploy into other yield strategies, and from credit-based use cases where borrowers are financing real economic activity. Those categories are rare in crypto lending markets, but they exist.
### Test Three: Token Emission Contribution
Verify whether any portion of the 6.31% rate is funded by JUP token emissions. If the Going Green proposal to eliminate net emissions has been fully implemented, token emissions are not a factor. If the proposal is pending or partially implemented, emissions may still be subsidizing yields.
Cross-reference the stated 6.31% USDC rate with the protocol's emission schedule and reward distribution. If Jupiter is distributing JUP tokens to USDC depositors as an incentive, those tokens must be valued at a reasonable discount to spot price because they cannot be sold immediately without slippage. A 1% APY token reward is worth approximately 0.6% to 0.8% in realized income after accounting for vesting, slippage, and tax treatment.
If token emissions contribute more than 1 percentage point to the stated rate, the organic lending rate is closer to 5.3% or lower. Model that as the sustainable baseline.
### Test Four: Exit Liquidity Depth
How much USDC can you withdraw before utilization constraints bind? If the pool holds $497 million in deposits and utilization is 80%, approximately $99 million is available for withdrawal before utilization hits 100% and withdrawals are temporarily blocked.
Test exit depth by modeling a 10% and 25% withdrawal scenario. If you hold a $100,000 position and 25% of depositors attempt to withdraw simultaneously, does the protocol have sufficient liquidity to process your withdrawal without delay? If not, the position carries liquidity risk that offsets the yield advantage.
Jupiter Lend's total USDC pool is large enough that a $100,000 position is immaterial to overall liquidity. But if you are considering a $5 million allocation, you are now 1% of the pool and your exit could move utilization meaningfully. Size your position so that your withdrawal represents less than 5% of available liquidity.
## Comparative Context: Solana Lending Sector and Historical Rate Stability
Jupiter Lend's $1.112 billion TVL represents approximately 41% of Solana's total lending market, which now exceeds $2.7 billion. Kamino holds the other major position at approximately $1.40 billion TVL as of early October, though that figure has fluctuated between $1.2 billion and $1.5 billion over the past 90 days.
Jupiter's TVL has been more volatile than Kamino's. Over the past three months, Jupiter's TVL ranged from $0.8 billion to $1.41 billion, a swing of more than 70%. Kamino's TVL has remained within a 20% band during the same period. Higher TVL volatility indicates that Jupiter is attracting more short-term capital and rate-chasing depositors, which suggests higher rate instability.
Kamino's USDC rate has historically been 20 to 40 basis points lower than Jupiter's during periods of comparable utilization. If Kamino is currently offering 5.8% on USDC and Jupiter is offering 6.31%, the 51-basis-point spread may reflect Jupiter's Smart Collateral trading fee component or temporary utilization premium.
Over the past six months, Solana stablecoin lending rates have ranged from 3.2% to 7.1% across all major protocols. Rates below 4% correspond to low-utilization environments with minimal leverage activity. Rates above 6% correspond to elevated utilization driven by short-term arbitrage or sector-wide capital stress. The current 6.31% rate is at the high end of the historical range, which suggests it is more likely to compress than to expand.
### When 6.31% Is Worth Large Allocation
Allocate large capital into Jupiter Lend's USDC pool at 6.31% if the following conditions hold:
Utilization has been stable between 70% and 85% for at least 60 days. Borrower concentration is below 40% for the top 10 addresses. Token emissions contribute less than 0.5 percentage points to the stated rate. Available liquidity exceeds 20% of total deposits, meaning your withdrawal will not materially impact utilization.
Under those conditions, model the rate as 5.8% to 6.1% for the next 90 days and size the position as stable income. A $100,000 allocation at 5.9% APY generates $5,900 annually or $1,475 per quarter, which is predictable enough to support income planning.
### When 6.31% Is Likely Temporary
Treat the 6.31% rate as temporary if utilization spiked in the past 14 days, if borrower concentration exceeds 50%, if token emissions contribute more than 1 percentage point, or if the rate is more than 75 basis points above Kamino's comparable USDC rate without a clear structural explanation.
Under those conditions, model the rate at 4.2% to 5.0% for allocation purposes and size the position as variable-rate exposure. Do not commit capital you need for predictable income streams. Treat the position as short-term yield capture and monitor utilization weekly.
## Practical Allocation Framework
If you are evaluating a Jupiter Lend USDC position for the first time, start with a 10% allocation of your intended position size and monitor for 14 days. If the rate holds within 40 basis points of 6.31% during that period, increase to 50% of intended size. If the rate holds for another 30 days, increase to full size.
This staged approach costs you approximately 60 basis points in foregone yield if the rate proves stable, but it protects you from allocating $100,000 into a position that drops to 4.1% yield within 45 days. The cost of caution is $150 in foregone income. The cost of premature allocation is $550 in foregone yield from a better-timed entry or alternative deployment.
Set a rate floor. If Jupiter's USDC rate drops below 5.0%, withdraw and redeploy into [stablecoin income alternatives](https://altcoininvestor.com/how-to-earn-passive-income-stablecoins-2026/) that offer comparable or better risk-adjusted returns. A 5.0% floor ensures you are not holding a position for diminishing returns when better opportunities exist elsewhere.
Monitor weekly. Check utilization, borrowing concentration, and protocol fee generation every seven days. If utilization drops below 60% for two consecutive weeks, model the rate at 4.5% going forward. If borrowing concentration rises above 60%, reduce position size by half.
## The Risks Jupiter Lend Carries That Other Protocols Do Not
Jupiter Lend offers loan-to-value ratios of 90%, compared to approximately 75% on most other lending protocols. Higher LTV ratios are attractive to borrowers because they allow more leverage per unit of collateral, but they increase liquidation risk for depositors. In a sharp SOL price decline, 90% LTV positions liquidate faster than 75% LTV positions, which can create cascading liquidations that drain available liquidity and temporarily block withdrawals.
The Smart Collateral and Smart Debt features add complexity. Your deposit earns lending yield plus trading fees, but the trading fee component is variable and depends on DEX routing volume. During low-volatility periods or market downturns, trading volume drops and the fee component compresses. This means the stated 6.31% rate may include a 1.5% trading fee component that drops to 0.4% when volume declines, leaving you with a 4.8% to 5.2% net rate.
Jupiter Lend's TVL volatility is higher than Kamino's, which suggests the platform attracts more short-term capital. When short-term capital exits, rates drop sharply. If you are holding a position sized for stable income and rates compress by 150 basis points in 30 days, your income forecast breaks.
The protocol's limited revenue retention also matters. With 50% of protocol revenue going to token buybacks and no user fees on deposits, Jupiter has less financial cushion to stabilize rates during periods of low utilization. Protocols with stronger revenue retention can subsidize rates temporarily to maintain depositor confidence. Jupiter cannot do that at scale.
## The Takeaway
Jupiter Lend's 6.31% USDC rate is attractive, but sustainability depends on four variables you can measure: utilization stability over 90 days, borrower concentration below 40%, token emission contribution below 0.5 percentage points, and exit liquidity depth above 20% of total deposits. If those conditions hold, the rate is likely stable between 5.8% and 6.1% for the next quarter and worth large allocation. If utilization spiked recently, borrower concentration is high, or the rate includes material trading fee pass-through from variable DEX volume, model the rate at 4.5% to 5.2% and size the position as temporary yield capture. The difference between a stable 6% position and a collapsing 4.2% position is $900 annually on a $50,000 allocation. Run the four tests before you commit capital.
## Frequently Asked Questions
### What utilization rate does Jupiter Lend's 6.31% USDC rate indicate?
A 6.31% USDC rate typically corresponds to utilization between 70% and 85%, depending on the protocol's specific interest rate curve. Rates below 4% usually indicate utilization below 60%, while rates above 6% suggest utilization above 75%. Higher utilization drives higher rates because less capital is available to borrow, creating supply constraint. Check Jupiter Lend's current utilization on DefiLlama or the protocol dashboard to verify whether this rate reflects stable demand or a temporary spike.
### How do Jupiter Lend's Smart Collateral and Smart Debt features affect the stated yield?
Jupiter Lend v2 allows deposited and borrowed assets to earn trading fees from DEX routing while functioning as lending collateral. This means the stated 6.31% rate may include both the base lending spread (driven by borrower interest payments) and a variable trading fee component (driven by Jupiter DEX volume). If DEX volume drops during low-volatility periods, the trading fee component compresses, potentially reducing the effective rate by 1 to 2 percentage points. Verify whether the rate you see is lending-only or includes stacked trading fees.
### What borrower concentration level indicates a stable rate?
If the top 10 borrowing addresses account for less than 40% of total borrowed USDC, the rate is more stable because it reflects distributed demand. If concentration exceeds 50%, a few large positions are driving utilization, and their closure will cause the rate to drop sharply. Check on-chain borrower data using block explorers or protocol analytics dashboards. High concentration indicates temporary demand from leverage farmers or arbitrageurs who will close positions quickly, making the rate unsustainable.
### How does Jupiter Lend's 90% LTV ratio affect depositor risk?
Jupiter Lend offers 90% loan-to-value ratios compared to 75% on most lending protocols. Higher LTV allows borrowers to use less collateral per dollar borrowed, increasing leverage. This increases liquidation risk for depositors because positions liquidate faster during collateral price declines, potentially creating cascading liquidations that drain available liquidity and temporarily block withdrawals. If you hold a large USDC position on Jupiter, monitor SOL and other collateral asset volatility closely, as sharp price drops trigger more liquidations at 90% LTV than at 75% LTV.
### What rate floor should trigger reallocation from Jupiter Lend USDC?
Set a 5.0% rate floor. If Jupiter's USDC rate drops below 5.0%, the risk-adjusted return no longer justifies the platform-specific risks (high LTV liquidation risk, TVL volatility, variable Smart Collateral fees). At that point, alternative stablecoin lending opportunities on Aave, Compound, or other Solana protocols may offer better risk-adjusted returns. Monitor the rate weekly and execute reallocation within 48 hours if the floor is breached, as rates below 5% often indicate collapsing utilization that will continue downward.
The Weekly Yield Report
You just reviewed four quantitative tests to evaluate a 6.31% rate that may drop to 4.2% next month. Those thresholds will shift as utilization and borrower composition change weekly.
Every Thursday: where crypto yield actually is - stablecoins, liquid staking and DeFi lending, with the risk named next to the rate and what changed since last week.
[Get it free every Thursday](#/portal/signup)
Free. No trade calls, no allocations, no hype. Unsubscribe in one click.
### NFT Collateral Lending: BendDAO vs NFTfi vs Arcade Compared
URL: https://altcoininvestor.com/nft-lending-platforms-compared/
Last updated: 2026-10-18T16:03:40.000Z
## How NFT Collateral Lending Works

NFT lending platforms let you lock NFTs as collateral to borrow stablecoins or ETH, or lend capital to earn 15-40% APY. The mechanics differ by platform model. Pool-based platforms like BendDAO offer instant loans against approved collections at preset terms. Peer-to-peer platforms like NFTfi and Arcade match individual lenders and borrowers who negotiate custom loan amounts, interest rates, and durations.
The income mechanism is straightforward. As a lender, you earn yield on stablecoins deposited into lending pools or offered directly to borrowers. As a borrower, you unlock liquidity from NFTs without selling, deploy that capital into higher-yield opportunities, and repay the loan when profitable or when your NFT appreciates.
The interesting variable is liquidation risk. Pool-based platforms rely on oracle pricing and trigger automated auctions when health factors drop below threshold. Peer-to-peer platforms use fixed terms and transfer the NFT to the lender on default, regardless of current floor price.
## BendDAO: Pool-Based Lending With Oracle Dependency
BendDAO operates a peer-to-pool model where borrowers receive instant loans against approved blue-chip NFTs. As of September 2026, total value locked stands at $3.4 million on Ethereum and ApeChain. Deposits total approximately $4.09 million ETH and $991,881 USDT across the platform.
LTV ratios vary by collection. BAYC and MAYC loans reach 40% LTV, CryptoPunks cap at 30%, and the upper range extends to 80.5% for select approved collections. Borrow APR ranges from 5.5% to 32.7%, calculated based on pool utilization rates. Higher utilization drives higher rates.
Liquidation mechanics center on a health factor calculation: floor price multiplied by 90%, divided by debt plus accrued interest. When the health factor drops below 1.0, the protocol triggers a 48-hour grace period. During that window, borrowers can repay the full debt, interest, and a 10% liquidation fee to reclaim their NFT. If they don't, the NFT enters auction.
The oracle system uses Chainlink-aggregated floor prices combined with time-weighted average price (TWAP) calculations to mitigate manipulation. Collections must pass governance votes to gain approval as collateral. Currently approved collections include BAYC, MAYC, CryptoPunks, Azuki, and Pudgy Penguins.
One thing worth noting: in August 2022, as floor prices fell during a market downturn, liquidators stopped bidding on auctioned NFTs. The protocol's ETH reserves ran dry. The DAO responded by voting to lower the liquidation threshold from 85% to 70% and shorten auction windows from 48 hours to 4 hours. That episode illustrates the liquidity risk embedded in pool-based models during stress periods.
For lenders seeking to [earn yield on stablecoins through NFT collateral](https://altcoininvestor.com/how-to-flip-nfts-for-profit-2/), BendDAO offers instant deployment and governance-vetted collections. The tradeoff is oracle dependency and concentration risk in a small set of blue-chip assets.
## NFTfi: Peer-to-Peer Negotiation Without Oracle Risk

NFTfi facilitates direct loans between lenders and borrowers. Since launching in May 2020, the platform has processed over $400 million in loan volume across more than 40,000 loans. It supports over 150 NFT collections, far exceeding BendDAO's curated list.
Loan terms are negotiated individually. Typical durations include 7, 14, 30, and 90 days. Interest rates range from 5% to 60% APR in 2026, depending on collection rarity, borrower reputation, and perceived risk. Short-term loans can reach 1,000% annualized APR when structured as 2-3% per day over 10-day periods. Long-term loans average around 90% APR historically.
The platform charges zero fees to borrowers. Lenders pay a 5% fee on earned interest, and only on successful loans. If a borrower defaults, the lender receives the NFT outright. No auction, no grace period. The peer-to-peer structure eliminates oracle dependency entirely because each loan is a fixed-term contract between two parties.
Default rate on NFTfi sits at 6.34% by loan amount, according to Dune Analytics. That rate reflects the fact that borrowers default when the loan value exceeds the NFT's market value at maturity. Lenders acquire the NFT at what often amounts to a significant discount to the initial floor price.
The key structural advantage is that floor price movements during the loan term do not affect the contract. If you lend 0.5 ETH against a BAYC at 1 ETH floor and the floor drops to 0.6 ETH, the borrower still owes 0.5 ETH plus interest. If they don't repay, you receive the BAYC. The floor price change is irrelevant to the loan terms.
For lenders, NFTfi allows granular control over which NFTs to back and at what terms. For borrowers, it provides access to liquidity on mid-tier and long-tail collections that pool-based platforms exclude. The tradeoff is negotiation friction and the risk of overpaying for borrower default.
Understanding [what happens during default and liquidation](https://altcoininvestor.com/what-happens-if-nft-loan-defaults/) clarifies why peer-to-peer platforms transfer default risk entirely to the lender.
## Arcade: Oracleless P2P With Multi-Asset Collateral
Arcade extends peer-to-peer lending beyond single NFTs. Built on Ethereum and Base Layer 2, the platform has facilitated over 1,900 loans totaling $90 million in cumulative volume. It supports NFTs, memecoins, real-world assets, and ERC-20 tokens as collateral.
Loan currencies include WETH, USDC, USDT, DAI, and APE. Arcade allows borrowers to "wrap" multiple NFTs into a single token, enabling larger loans backed by bundled collateral. This feature addresses a limitation of single-NFT platforms: capital efficiency for holders of multiple mid-tier assets.
The platform currently charges no fees to borrowers or lenders, though that policy may change. Borrowers can repay loans at any time in full without prepayment penalties. Lenders can make collection-wide loan offers, a feature unique to Arcade that automates offer matching across eligible NFTs.
Like NFTfi, Arcade uses fixed-term oracleless loans. No health factor. No liquidation threshold. No oracle pricing. The loan terms are set at origination and do not change regardless of market conditions. If the borrower repays by the deadline, they reclaim their collateral. If they don't, the lender receives the wrapped NFT bundle.
The non-liquidatable model reduces borrower risk compared to oracle-dependent platforms. A borrower on BendDAO can lose their NFT in an auction triggered by a temporary floor price dip, even if they intended to repay. On Arcade, the borrower retains control until the loan term expires.
For lenders, the tradeoff is duration risk. You commit capital for the full loan term without the ability to trigger early liquidation if collateral value deteriorates. The platform mitigates this through shorter average loan durations and the ability to set conservative LTV ratios during negotiation.
## Liquidation Mechanics: Where The Models Diverge
The liquidation mechanics define the risk profile of each platform. On BendDAO, liquidation is algorithmic and oracle-dependent. When BAYC floor price drops from 1 ETH to 0.6 ETH and your loan is 0.4 ETH, your LTV rises from 40% to 66.7%. Still safe if the threshold is 80%. But if the floor drops further to 0.45 ETH, LTV hits 88% and triggers the 48-hour grace period. You have two days to repay 0.4 ETH plus interest plus a 10% liquidation fee, or your NFT enters auction.
The August 2022 crisis on BendDAO exposed a critical flaw: during downturns, liquidators stop bidding. If nobody bids on your auctioned BAYC, the protocol holds the NFT and cannot recover the lent capital. The DAO's emergency vote to shorten auctions and lower thresholds was a direct response to that liquidity gap.
On NFTfi and Arcade, liquidation is contractual, not algorithmic. The loan terms are fixed. Floor price changes do not trigger liquidation. If you borrow 0.5 ETH against a BAYC using a 30-day loan on NFTfi and the floor drops 40% during that period, you still owe 0.5 ETH plus the agreed interest. The lender cannot call the loan early. You have until day 30 to repay. If you default, the lender receives your BAYC, regardless of its current floor price.
This structure eliminates oracle risk and the risk of cascading liquidations during flash crashes. It transfers default risk entirely to the lender, who must evaluate whether the NFT's long-term value justifies the loan amount.
One thing worth noting: rare NFTs with trait-driven value are disadvantaged in pool-based models. BendDAO uses floor price to calculate health factors, so a rare BAYC with traits worth 2x floor receives the same loan amount as a floor BAYC. On peer-to-peer platforms, lenders can price in rarity and offer higher loan amounts for verifiably rare NFTs.
## Which Collections Have Actual Borrowing Depth
Borrowing depth varies dramatically by collection. Blue-chip NFTs (CryptoPunks, BAYC, MAYC, Azuki, Pudgy Penguins, Art Blocks) dominate lending volume across all platforms. These collections have established floor prices, deep secondary markets, and lender confidence.
On BendDAO, only governance-approved collections are eligible. That limits collateral options but concentrates liquidity. A borrower with a BAYC can receive an instant loan at 40% LTV without negotiation. A borrower with a mid-tier PFP project cannot use BendDAO at all.
On NFTfi, over 150 collections are supported, but lending depth outside blue-chips is thin. You can list a mid-tier NFT as collateral, but you may wait days or weeks for a competitive loan offer. The majority of loan volume still concentrates in the same blue-chip collections that BendDAO supports.
Arcade's multi-asset wrapping feature allows borrowers to bundle mid-tier NFTs, but the underlying constraint remains: lenders want collateral they can liquidate quickly if the borrower defaults. Mid-tier collections lack that liquidity.
The data shows that NFT lending is viable for holders of BAYC, CryptoPunks, MAYC, Azuki, and a handful of other collections. For holders of long-tail NFTs, peer-to-peer platforms offer access in theory, but actual loan terms reflect the liquidity risk lenders face.
## Floor Price Oracle Reliability And Manipulation Risk
Floor price oracles introduce attack vectors that peer-to-peer platforms avoid. In 2022, a documented case illustrated the risk: a whale holder could dump BAYCs to artificially lower the floor price, trigger BendDAO liquidations, buy liquidated NFTs at auction discounts, then stop dumping and wait for price recovery. Borrowers lose their NFTs at artificially low valuations. The attacker profits from the spread between dump price and recovery price.
BendDAO mitigates this with time-weighted average price (TWAP) oracles that smooth out short-term price swings. Chainlink-aggregated data reduces reliance on single-source pricing. But the fundamental vulnerability remains: any oracle-dependent platform can be manipulated by actors with sufficient capital to move floor prices temporarily.
Peer-to-peer platforms eliminate this vector entirely. NFTfi and Arcade loans are negotiated at origination and do not reference external price feeds during the loan term. A lender on NFTfi evaluates the NFT's value when making the loan offer. If the borrower accepts, the loan terms are fixed. No oracle. No manipulation risk.
The tradeoff is efficiency. Pool-based platforms offer instant loans at transparent, algorithmic rates. Peer-to-peer platforms require negotiation time and expose lenders to adverse selection (borrowers with the worst NFTs seek loans most aggressively).
For borrowers prioritizing protection against oracle manipulation and liquidation cascades, peer-to-peer platforms remove that risk. For borrowers prioritizing speed and simplicity, pool-based platforms offer instant capital at the cost of oracle dependency.
## Interest Rates And Fee Structures Compared
Interest rates vary by platform, utilization, and collection. BendDAO charges 5.5% to 32.7% APR based on pool utilization. Higher utilization increases rates algorithmically. Borrowers pay no upfront fees but owe a 10% liquidation fee if their health factor drops below 1.0 and they enter the grace period.
NFTfi charges borrowers nothing. Lenders pay 5% on earned interest for successful loans only. Rates are negotiated individually and range from 5% to 60% APR for standard loans. Short-term loans structured as daily percentage rates can reach 1,000% annualized, but those are outliers. Long-term loans average around 90% APR historically.
Arcade currently charges no fees to either party. Rates are negotiated peer-to-peer. The absence of fees makes Arcade attractive for borrowers testing the platform, but the fee structure may change as the protocol matures.
For lenders comparing [NFT lending yield to other DeFi strategies](https://altcoininvestor.com/nft-staking-lending-yield/), the 15-40% APY range on NFT collateral loans sits above most stablecoin lending rates but below high-risk liquidity mining. The yield compensates for illiquidity risk (NFTs are harder to liquidate than tokens) and default risk (6.34% on NFTfi).
One thing worth noting: some platforms charge interest for the full loan duration even if repaid early. Arcade allows early repayment without penalties. Gondi and Zharta charge interest only for the period the loan is outstanding. Fee structures matter when comparing effective APY across platforms.
## Who Each Platform Is Right For
BendDAO is right for borrowers who hold blue-chip NFTs, prioritize instant liquidity, and accept oracle risk. The platform offers the fastest path from NFT to stablecoin without negotiation. It is not suitable for holders of mid-tier collections or borrowers concerned about liquidation cascades during market downturns.
NFTfi is right for borrowers and lenders who want exposure to a broader range of collections, can tolerate negotiation time, and prefer fixed-term contracts over algorithmic liquidation. Lenders gain control over individual loan terms and can price in rarity. Borrowers gain access to liquidity on non-blue-chip collections, though at higher rates.
Arcade is right for borrowers holding multiple NFTs or mixed collateral (NFTs plus tokens) who want to maximize capital efficiency. The multi-asset wrapping feature unlocks larger loans than single-NFT platforms. The oracleless model eliminates health factor risk. The platform suits borrowers who prioritize flexibility and are willing to negotiate custom terms.
For lenders, BendDAO offers passive income through pool deposits with governance-vetted collateral. NFTfi and Arcade require active management but offer higher potential returns through selective lending and rarity-based pricing.
## The Decision Rule
Choose BendDAO if you hold BAYC, CryptoPunks, MAYC, Azuki, or Pudgy Penguins and want instant loans at 30-40% LTV without negotiation. Accept that oracle dependency introduces liquidation risk during market stress and that rare NFTs receive no premium over floor NFTs.
Choose NFTfi if you hold mid-tier collections, prioritize fixed-term contracts, or want to lend selectively against individual NFTs. Accept longer loan origination time and the need to evaluate each NFT's liquidation value independently.
Choose Arcade if you hold multiple NFTs or want to bundle mixed collateral for larger loans. Accept that the platform is newer, fee structures may change, and loan origination requires direct negotiation with lenders.
The pattern across platforms is clear: pool-based models trade oracle risk for instant liquidity on blue-chips, while peer-to-peer models trade negotiation friction for fixed terms and broader collateral access. The decision depends on which NFTs you hold and whether you prioritize speed or protection against algorithmic liquidation.
For context on how NFT lending fits into broader [crypto earning strategies](https://altcoininvestor.com/how-to-earn-crypto/), the 15-40% APY on stablecoin deposits compares favorably to validator staking (3.5-20%) and standard DeFi lending (2.6-8%), but with higher illiquidity and default risk.
## Frequently Asked Questions
### What LTV ratios do NFT lending platforms offer?
BendDAO offers 30-40% LTV on blue-chip NFTs like BAYC and CryptoPunks, with select collections reaching 80.5%. NFTfi and Arcade negotiate LTV peer-to-peer, typically ranging from 30-60% depending on collection rarity and lender risk tolerance. Pool-based platforms use floor price for LTV calculations, while peer-to-peer platforms can price in individual NFT traits.
### How do NFT liquidations work on BendDAO?
BendDAO calculates a health factor as floor price multiplied by 90%, divided by debt plus interest. When the health factor drops below 1.0, borrowers enter a 48-hour grace period to repay debt, interest, and a 10% liquidation fee. If not repaid, the NFT enters auction. The August 2022 crisis showed liquidators may stop bidding during downturns, leaving NFTs unbid.
### Can I borrow against non-blue-chip NFTs?
BendDAO only accepts governance-approved blue-chips like BAYC, CryptoPunks, MAYC, Azuki, and Pudgy Penguins. NFTfi supports over 150 collections, but loan offers for mid-tier NFTs are sparse and come at higher interest rates. Arcade's multi-asset wrapping allows bundling multiple mid-tier NFTs, but lenders still prefer liquid blue-chip collateral for faster liquidation if borrowers default.
### What happens if NFT floor price drops during my loan?
On BendDAO, dropping floor price increases your LTV ratio and can trigger liquidation if your health factor falls below 1.0\. On NFTfi and Arcade, floor price changes do not affect loan terms because contracts are fixed at origination. You owe the agreed amount regardless of market movements. Peer-to-peer platforms eliminate oracle risk and liquidation cascades during flash crashes.
### What interest rates do NFT lenders earn?
BendDAO lenders earn 5.5-32.7% APR based on pool utilization. NFTfi lenders negotiate rates between 5-60% APR, with long-term loans averaging 90% historically. Arcade lenders set custom rates peer-to-peer. NFTfi charges lenders 5% on earned interest for successful loans. Arcade currently charges no fees. Default risk on NFTfi runs 6.34% by loan amount, reducing net returns.
The Weekly Yield Report
You just compared three platforms with LTV ratios from 30% to 80.5% and liquidation mechanics that shift default risk between lender and borrower. Those terms change as collections gain or lose governance approval and floor prices move.
Every Thursday: where crypto yield actually is - stablecoins, liquid staking and DeFi lending, with the risk named next to the rate and what changed since last week.
[Get it free every Thursday](#/portal/signup)
Free. No trade calls, no allocations, no hype. Unsubscribe in one click.
### Why Uniswap V3 WETH Yields Spike 15pp During Volatility
URL: https://altcoininvestor.com/uniswap-v3-yield-spike-volatility/
Last updated: 2026-10-18T15:05:58.000Z
## The Fee Mechanism Behind Volatility Rate Spikes
Uniswap V3 WETH-USDT APY jumped 15 percentage points this week, from roughly 21% to 36% on the 0.30% fee tier pool. WBTC-USDT rose 6.5 points over the same period, climbing from 15% to 21.5%. These are not product changes or liquidity migrations. They are fee bursts driven by volatility.
The mechanism is direct. Higher volatility produces higher swap volume. Higher swap volume generates more fees. Fees accrue to liquidity providers whose capital is active at the time of the swap, distributed pro-rata based on the amount of active liquidity in range. On the 0.30% tier, LPs earn 0.25% per swap after the protocol split. When ETH moves 8% in a day, traders rebalance portfolios, arbitrage bots close spreads, and leveraged positions get liquidated. All of that activity runs through the pool. The fee counter ticks up fast.
But volatility also accelerates impermanent loss. A concentrated position in a 10% range around the current price experiences roughly 10x the impermanent loss of a full-range Uniswap V2 position for the same price movement. The tighter your range, the more capital-efficient your position, and the faster IL compounds when price moves against you. This is the trade. You size in to capture the fee burst, and you size out before IL dominates the gross APY. The window is short.
## How Long Volatility-Driven Spikes Last

Volatility spikes in WETH and WBTC pools typically sustain for 48 to 96 hours, not weeks. The 15pp jump in WETH-USDT APY this week reflects a 7-day trailing average that includes three days of elevated volume and four days of mean reversion. The actual peak APY during the spike likely exceeded 40%, but that rate lasted hours, not days.
Historical data from [DefiLlama](https://defillama.com/protocol/uniswap-v3) shows this pattern repeating. In March 2025, the USDC-WETH pool spiked 6.8 points in one week, then gave back 4.15 points the following week. In late 2024, the same pool dropped 10.65 points after a sustained rally ended. The duration of elevated fees tracks the duration of elevated volatility, which in crypto tends to cluster around macro events, funding rate resets, and liquidation cascades.
The hold period rule is this: plan to exit or rebalance within 72 hours of entry during a volatility spike. If price remains within your range and volume sustains, you can extend. But most LPs who chase volatility spikes end up holding through the reversion, which erases the fee gain through IL. The income opportunity is real, but it is not passive. You are trading a volatility surface, not holding a bond.
## Position Sizing Rules To Capture Yield Without IL Dominance
The minimum profitable position size on Ethereum L1 is $5,000 to $10,000\. Below that, gas costs for entry, rebalancing, and exit consume too much of the gross fee income. Range adjustments cost $20 to $200 each on mainnet, depending on network congestion. If you rebalance twice during a 72-hour volatility window, that is $40 to $400 in execution costs. On a $3,000 position earning 40% APY for three days, gross income is roughly $10\. After gas, the position is negative.
On Arbitrum, Base, or Polygon, the minimum drops to $500 to $1,000 because gas costs are negligible. But L2 pools also have lower TVL and wider spreads, which can reduce fee capture per unit of liquidity. The WETH-USDT pool on Ethereum holds $111 million in TVL. The same pool on Arbitrum holds closer to $15 million. Volume-to-TVL ratio matters more than absolute APY for income sustainability.
For a $50,000 position during a volatility spike, use a medium range of +/- 15% to 20% around the current price. This gives you roughly 5x capital efficiency compared to a full-range V2 position, while leaving enough room to absorb a 10% price move without going out of range. If ETH is trading at $2,600, set your range from $2,200 to $3,100\. That captures most of the fee volume without requiring hourly rebalancing.
For a $200,000 position, tighten the range to +/- 10% and monitor every 12 hours. At that size, you can afford to rebalance once or twice during the spike window and still net positive after gas. The larger the position, the more you can extract from tight ranges, but the more actively you must manage IL risk. This is not set-and-forget yield. This is active income harvesting.
## When The Math Breaks Down
The fee-versus-IL trade breaks down when price moves more than 20% in a single direction during your hold period. A 50% price change in one token relative to its pair causes approximately 5.7% impermanent loss under the constant product model. In a concentrated V3 position, that same 50% move can generate 15% to 25% IL depending on range width. If your gross APY is 40% annualized but you hold for three days, you earn roughly 0.33% in fees. A 10% ETH price move during those three days can produce 2% to 4% IL on a medium-range position. The fees do not cover the loss.
This is why the hold period matters more than the APY number. A 36% trailing APY sounds attractive, but if half of that APY was earned during a 48-hour spike that has already passed, the current fee rate may be closer to 18%. You are entering at the tail end of the opportunity. Check the 7-day volume chart on [DefiLlama](https://defillama.com/protocol/uniswap-v3) before you size in. If volume has already dropped 40% from the peak, the spike is over.
When price moves outside your range, you stop earning fees entirely. You also stop accruing IL, because your position has fully converted to the token that appreciated. At that point, you hold 100% USDT if ETH went up, or 100% WETH if ETH went down. The zero-fee, zero-IL zone is not where you want to be during a volatility spike. It means you missed the income window and now hold a directional position you did not plan for.
## Gas Costs And Breakeven Thresholds
In a sample of eight Ethereum V3 pools, 18% of closed positions below $1,000 beat simple holding after accounting for gas. That means 82% of small positions lost money net of execution costs. This is not a failure of the product. It is a structural reality of L1 gas economics. If you are sizing below $5,000, you need L2 execution or you need to hold longer than 72 hours, which exposes you to IL reversion risk.
The breakeven threshold for a 72-hour volatility play on Ethereum L1 is roughly $8,000 to $10,000, assuming two rebalances at $100 each and entry/exit gas of $50 each. Total execution cost: $300\. At 40% APY for three days, a $10,000 position earns roughly $33 in fees. That does not clear the breakeven. You need closer to $15,000 to $20,000 to make the trade economically rational after gas, or you need the spike to last five to seven days, which is rare.
On Arbitrum or Base, the same $10,000 position costs $5 to $10 in total gas. The income math works at much smaller sizes, but you also face lower absolute fee generation because L2 pools have less volume. The WETH-USDT 0.30% pool on Arbitrum shows 18% APY versus 36% on mainnet, even during the same volatility window. You pay less gas, but you earn less yield. The net income outcome is often similar.
## Rebalancing Triggers And Exit Rules
Rebalance when price approaches the edge of your range or when volume-to-TVL ratio drops below 20% daily on the 0.30% tier. A pool with $100 million TVL and $15 million daily volume is generating $45,000 in daily fees at the 0.30% rate. Annualized, that is 16.4% APY. When daily volume drops to $10 million, APY falls to 10.9%. That is the reversion signal. Exit or tighten your range to recapture capital efficiency.
The other exit trigger is time. If you have held for 72 hours and fees have not yet covered your IL, close the position. You are no longer in a volatility spike. You are holding a directional LP position with negative carry. The income opportunity has passed. This is not a loss. It is trade discipline. You entered for a specific catalyst, the catalyst ended, and you move capital elsewhere.
For positions sized above $100,000, consider splitting into two ranges: a tight core (+/- 8%) and a wider hedge (+/- 25%). The core captures maximum fees during the spike. The hedge continues earning if price moves beyond the core range. This structure costs more gas to set up, but it reduces the risk of going fully out of range during a one-day 15% move. It also lets you rebalance the core aggressively while leaving the hedge untouched, which saves gas over time.
## Real Net APY After IL And Gas
A $50,000 WETH-USDT position on the 0.30% tier, held for 72 hours during a 40% APY spike, earns roughly $164 in gross fees. If ETH moves 8% during that period and your range is +/- 15%, impermanent loss is approximately 1.2%, or $600\. Net outcome: negative $436 before gas. Add $200 in gas for entry, one rebalance, and exit, and the total loss is $636.
The same position, held for seven days at the same APY with only a 4% ETH price move, earns $383 in fees and incurs roughly $120 in IL. Net outcome: $263 before gas, or $63 after gas. This is the difference between chasing a spike and riding a sustained volatility period. The longer the elevated fee environment lasts, the more time fees have to overcome IL. But if the spike has already passed when you enter, you are sizing into the reversion.
The sustainable hold period for a medium-range WETH-USDT position is five to seven days when volatility is elevated but not spiking. During actual spikes, 48 to 72 hours is the outer limit before IL dominates. The income opportunity is real, but it requires you to enter early in the volatility cycle, not after the APY number has already been published on aggregator dashboards. By the time you see a 15pp jump advertised, the jump has often already reverted halfway.
## The Takeaway
The 15pp WETH-USDT and 6.5pp WBTC-USDT APY jumps this week are fee bursts driven by swap volume during volatility, not structural yield changes. They last 48 to 96 hours, not weeks. Minimum position size is $5,000 to $10,000 on Ethereum L1, $500 to $1,000 on L2\. Use a medium range (+/- 15% to 20%) for positions between $50,000 and $200,000\. Rebalance when price approaches range edges or when volume-to-TVL drops below 20% daily. Exit after 72 hours if fees have not covered IL. The income opportunity is real for LPs who size in early and exit on time, but most retail LPs enter after the spike peaks and hold through the reversion, which turns gross yield into net loss. Track volume trends on [DefiLlama](https://defillama.com/protocol/uniswap-v3) before you deploy capital, and set a 72-hour exit rule before you open the position. The yield window closes faster than the APY dashboards update.
For more on position sizing during rate changes across DeFi protocols, see [how to size into Compound V3 USDC after a 2.76 point rate jump](https://altcoininvestor.com/compound-v3-usdc-rate-increase-safe/). For context on why high stablecoin and volatile-pair yields collapse, read [why 15%+ stablecoin yields historically don't last](https://altcoininvestor.com/why-high-stablecoin-yields-fail/). To understand the full mechanics of concentrated liquidity and IL, the [Uniswap V3 concentrated liquidity documentation](https://docs.uniswap.org/concepts/V3-overview/concentrated-liquidity) explains the math in detail. For real yield versus token-subsidized yield, see [where real yield comes from and how to spot fake yield](https://altcoininvestor.com/what-is-real-yield-in-crypto/). For a broader look at DeFi protocols by category, start with [best DeFi protocols by category: lending, DEX, derivatives](https://altcoininvestor.com/best-defi-protocols/).
## Frequently Asked Questions
### Why does Uniswap V3 WETH APY spike during volatility?
Volatility increases swap volume, which generates more fees for liquidity providers. On the 0.30% tier, LPs earn 0.25% per swap. When ETH moves 8% in a day, traders rebalance, arbitrage bots close spreads, and leveraged positions liquidate. All that activity runs through the pool, producing fee bursts that show up as APY spikes. The fee counter ticks up fast during volatility, but the spike typically lasts only 48 to 96 hours before volume normalizes.
### How long do Uniswap V3 volatility-driven APY spikes last?
Volatility-driven APY spikes in WETH and WBTC pools typically last 48 to 96 hours. The trailing 7-day APY numbers you see on dashboards often include three days of elevated volume and four days of reversion. The actual peak APY during the spike can exceed 40%, but that rate lasts hours, not days. Historical data shows spikes reverting within one to two weeks, with most of the reversion happening in the first 72 hours after peak volume.
### What position size is needed to profit from Uniswap V3 volatility spikes?
On Ethereum L1, you need $5,000 to $10,000 minimum to cover gas costs. Range adjustments cost $20 to $200 each. Below $5,000, gas consumes too much gross fee income. On Arbitrum, Base, or Polygon, the minimum drops to $500 to $1,000 because gas is negligible. For a $50,000 position, use a +/- 15% to 20% range. For $200,000, tighten to +/- 10% and monitor every 12 hours. Larger positions can extract more from tight ranges but require active IL management.
### How much impermanent loss occurs during a Uniswap V3 volatility spike?
A 10% ETH price move in a medium-range (+/- 15%) position produces roughly 1.2% impermanent loss, or $600 on a $50,000 position. A 50% price move causes 5.7% IL in a full-range position, but 15% to 25% IL in a concentrated V3 position depending on range width. The tighter your range, the faster IL compounds. This is why hold period matters more than APY. If you hold 72 hours and fees have not covered IL, close the position.
### When should I exit a Uniswap V3 position during a volatility spike?
Exit after 72 hours if fees have not covered impermanent loss, or when volume-to-TVL drops below 20% daily on the 0.30% tier. Also exit when price approaches the edge of your range. If daily volume drops from $15 million to $10 million on a $100 million TVL pool, APY falls from 16.4% to 10.9%. That is the reversion signal. The income opportunity has passed. Close the position and move capital elsewhere. Holding through reversion turns gross yield into net loss.
The Weekly Yield Report
You have just seen the 48 to 96 hour window for volatility-driven WETH yield spikes and the $50k to $200k position sizing rules. Those numbers will be different next week.
Every Thursday: where crypto yield actually is - stablecoins, liquid staking and DeFi lending, with the risk named next to the rate and what changed since last week.
[Get it free every Thursday](#/portal/signup)
Free. No trade calls, no allocations, no hype. Unsubscribe in one click.
### Accumulation Zones: Finding Bear Market Bargains
URL: https://altcoininvestor.com/accumulation-zones-bear-market-bargains/
Last updated: 2026-10-21T18:00:05.000Z
## The 2018 Winter

In February 2018, I made a decision that felt wrong at the time. Bitcoin had dropped from $19,800 to $6,200 in eight weeks. Ethereum fell from $1,400 to $380\. My portfolio was down 62% from its January peak. Every financial commentator I read was calling crypto a bubble that had finally burst. My friends who had bought in December were done with the space entirely.
I started buying.
Not recklessly. Not with money I needed for living expenses. But methodically, over the next fourteen months, I accumulated positions in Bitcoin and Ethereum at prices I knew I would never see again if the thesis was right. The portfolio dropped another 40% before it bottomed. I kept buying. By November 2018, when Bitcoin touched $3,200, I had deployed 70% of the capital I had set aside for that cycle. The other 30% went in over the following six months.
That accumulation period, which lasted from February 2018 to April 2019, set up the next three years of portfolio growth. Not because I timed the bottom perfectly. I did not. I was early by six months on my first buys and late by three months on my last ones. But I recognized the phase we were in, I had a framework for what constituted value, and I was willing to act when the prevailing sentiment said I was an idiot.
This is what [genuine accumulation zones](https://altcoininvestor.com/bitcoin-accumulation-zone-historical/) look like. They do not announce themselves. They do not feel good. And they are almost always distinguishable from assets that are simply falling with no floor in sight.
## The Difference Between Accumulation and Capitulation

Most retail investors confuse a bear market with an accumulation phase. They are not the same thing. A bear market is a price trend. An accumulation phase is a market structure.
In a bear market, prices fall. Sentiment deteriorates. Volume declines. Media coverage shifts from euphoria to skepticism to silence. That describes the price action, but it says nothing about whether the asset is building a base for the next cycle or simply dying.
An accumulation phase has different characteristics. Prices stabilize within a range. Long-term holders stop selling. Smart money begins building positions quietly. The ratio of coins held on exchanges drops as investors move assets to cold storage. Developer activity continues or accelerates. Network fundamentals hold or improve even as price stagnates or declines slowly.
The 2018-2019 Bitcoin accumulation zone demonstrated this clearly. From December 2018 through March 2019, Bitcoin traded in a range between $3,100 and $4,200\. It tested the low multiple times and never broke it. Exchange outflows accelerated. Long-term holder supply increased. The hash rate, which had dropped 40% from its August 2018 peak, stabilized and began climbing again in January 2019\. Ethereum continued shipping upgrades. The infrastructure was being built while the tourists left.
Compare that to assets that simply fall and never recover. In 2018, hundreds of ERC-20 tokens dropped 95% and kept dropping because they had no users, no developers, and no reason to exist beyond the ICO fundraise. There was no accumulation phase for those projects because there was nothing to accumulate. The price action looked similar in the early stages, a sharp decline from an overvalued peak, but the on-chain and development data diverged quickly.
The distinction matters because the opportunity set is completely different. Accumulation phases reward patience and conviction. Falling projects reward exit speed. Confusing the two costs money.
## The Valuation Frameworks I Use

When I evaluate whether an asset is in an accumulation zone or simply declining, I rely on three frameworks. None of them is perfect. All of them are useful when combined.
### Realized Price and MVRV Ratio
Bitcoin's realized price is the average price at which all coins last moved on-chain. It represents the aggregate cost basis of all holders. As of mid-October 2026, [Bitcoin's realized price stands at $53,714](https://research.glassnode.com/bitcoin-onchain-market-cycles/). The current market price of $82,132 puts the MVRV ratio at approximately 1.53.
MVRV, market value to realized value, is the ratio of market cap to realized cap. When MVRV drops below 1.0, the market as a whole is holding coins at a loss. Historically, MVRV below 1.0 has marked cyclical bottoms with extraordinary consistency. In March 2020, MVRV dropped to 0.85\. In December 2018, it hit 0.87\. In January 2015, it touched 0.91\. Every time MVRV fell below 1.0 in the past decade, Bitcoin was higher twelve months later 100% of the time.
When MVRV is between 1.0 and 2.0, the market is neither euphoric nor capitulating. This is the fair-value accumulation range. It is where long-term positions are built without the emotional extremes that cloud judgment. MVRV above 3.5 has historically marked local tops. MVRV at 1.53 today suggests we are in the middle of the fair-value band, not at a capitulation low, but also nowhere near an overheated market.
Ethereum does not have a realized price metric with the same depth of historical data, but the principle applies. When the market price approaches the on-chain average cost basis, you are buying close to the aggregate entry point of all holders. That is the definition of value in a cyclical asset.
### Long-Term Holder Accumulation and Exchange Outflows
The second framework I watch is holder behavior. During accumulation phases, long-term holders accumulate. During distribution phases, they sell. This is tautological but observable on-chain.
Long-term holder supply is defined as coins that have not moved in at least 155 days. When this metric rises, it signals conviction among holders with longer time horizons. When it falls, it signals distribution. In the 2018-2019 bear market, long-term holder supply bottomed in August 2018 at approximately 10.8 million BTC and climbed steadily through 2019, reaching 11.4 million BTC by September. That six-hundred-thousand-coin increase represented accumulation in real time.
Exchange outflows tell a similar story. When investors move coins off exchanges and into cold storage, they signal an intent to hold for an extended period. When coins flow onto exchanges, they signal preparation to sell. During the 2020-2021 bull market, exchange balances dropped from 2.97 million BTC in March 2020 to 2.36 million BTC by October 2021\. That six-hundred-thousand-coin outflow, happening concurrently with a price rally from $5,000 to $60,000, demonstrated long-term conviction even during a bull run.
In 2018, exchange balances rose from 1.2 million BTC in January to 1.8 million BTC by November as capitulation sellers moved coins onto platforms to exit. But by February 2019, that trend reversed. Exchange balances began declining again, a signal that the worst of the selling was over and accumulation had begun.
I check these metrics weekly. Not to time a perfect entry, which is impossible, but to confirm that the phase I believe we are in matches the behavior of long-term participants.
### Hash Rate and Network Fundamentals
The third framework is hash rate and network activity. This is where my mining background gives me an operational lens most traders do not have.
Bitcoin's hash rate is the total computational power securing the network. When miners continue operating or expanding capacity despite falling prices, it signals confidence in the long-term value of the block reward and transaction fees. When miners shut down en masse, it signals that the marginal cost of production has exceeded the marginal revenue.
In late 2018, Bitcoin's hash rate dropped 40% from its August peak as the least-efficient miners shut down. But by January 2019, it stabilized. By May, it was climbing again. That recovery happened while the price was still range-bound between $3,800 and $5,200\. Miners were adding capacity in anticipation of the next cycle, not in reaction to current prices. That is accumulation behavior at the infrastructure level.
I ran a mining operation from 2014 through 2017\. I know what electricity costs, hardware depreciation, and operational overhead do to margins. When I see hash rate climbing while price is stagnant or falling slightly, I know someone is making a calculated bet that the current price is temporary. Those bets are not always right, but they are informed by participants with real capital at risk and real operational knowledge.
For Ethereum and other proof-of-stake networks, the equivalent metric is staking participation and validator growth. When staking ratios increase during a bear market, it signals that long-term holders are locking up supply in anticipation of future yield and price appreciation.
## Historical Accumulation Zones I Have Traded
I have bought in four distinct accumulation zones since I started trading crypto. Three of them worked. One of them worked eventually but tested my patience for longer than I expected.
The first was late 2013 through early 2014, after Bitcoin's run from $100 to $1,100 in nine months. The crash from $1,100 to $200 took fourteen months and felt like the end of Bitcoin at the time. Mt. Gox collapsed. China banned exchanges. Regulatory uncertainty was extreme. I accumulated between $400 and $600 over a six-month window in 2014\. That position formed the foundation of the portfolio that grew through 2015, 2016, and 2017.
The second was the 2018-2019 period I described earlier. Bitcoin from $3,200 to $6,000\. Ethereum from $90 to $250\. Both ranges represented fair value relative to realized price and network fundamentals at the time. Both set up the 2020-2021 cycle.
The third was March 2020\. The COVID crash took Bitcoin from $9,100 to $3,800 in two days. I deployed 30% of available capital in the week following the crash, between $4,000 and $5,500\. The recovery was faster than I expected. Within six months, Bitcoin had doubled. Within eighteen months, it had 10x from the low.
The fourth was late 2022 through mid-2023, after the FTX collapse and the broader macro tightening. Bitcoin fell from $48,000 in March 2022 to $15,500 in November. I started buying in October 2022 at $19,000 and continued through February 2023 at prices between $16,000 and $24,000\. That accumulation worked, though the recovery took longer than the 2020 example. By November 2023, Bitcoin had climbed to $37,000, a 124% gain from the low and a 54% gain from my average entry.
In each case, the accumulation phase was identifiable in real time using the frameworks I described. MVRV below 1.5\. Long-term holder supply rising or stable. Exchange outflows beginning. Hash rate stabilizing after an initial drop. Network fundamentals holding or improving despite price declines.
None of these entries felt good at the time. In February 2019, buying Bitcoin at $3,800 felt like catching a falling knife. In November 2022, buying at $16,500 after FTX felt like buying into a market that might never recover. The signal was not sentiment. The signal was valuation and on-chain structure.
## The Current Cycle and Its Unique Structure
The 2026 cycle has a structural characteristic that distinguishes it from prior bears. Bitcoin never closed a daily candle below its realized price during this drawdown. That has not happened in any prior bear market since 2017.
In 2018, Bitcoin traded below realized price for most of the year. In 2015, it traded below realized price for eleven months. In 2020, the COVID crash briefly took price below realized price for three weeks. But in the current cycle, realized price has acted as a floor. The June 2026 low, wherever it was, held above that threshold.
This suggests one of two possibilities. Either the bear market is shallow by historical standards and the accumulation phase has been compressed, or the realized price has moved higher due to institutional accumulation at elevated levels and the traditional valuation metrics are less informative than they were in prior cycles.
I suspect both are true to some degree. The maturation of the Bitcoin market, the entrance of institutional allocators, and the shift in holder composition have likely compressed the volatility of drawdowns. A market with more long-term holders and fewer leverage-driven retail traders does not crash as hard because there are fewer forced sellers.
At the same time, the fact that Bitcoin is trading at 1.53x realized price in mid-October 2026, rather than below 1.0x as it did in prior bear bottoms, suggests we are not at a cyclical low. We are in a fair-value range. Accumulation is still possible, but it is not the capitulation-level opportunity that appeared in 2018 or 2020.
For altcoins, the picture is different. Ethereum, Solana, and most large-cap layer-1s have experienced drawdowns consistent with prior cycles. The [Ethereum paradox of 2026](https://altcoininvestor.com/ethereum-paradox-2026/), high utility and low relative price, creates a valuation disconnect that may represent a better risk-reward setup than Bitcoin at current levels.
## What Could Prove Me Wrong
I do not know if we are in the middle of an accumulation phase or at the end of one. I believe we are in one based on the frameworks I have described, but belief is not certainty.
What would prove me wrong? A breakdown in network fundamentals. If Bitcoin's hash rate drops 30% and does not recover, that would signal that miners no longer believe in the long-term value proposition. If long-term holder supply begins declining sharply, that would signal capitulation among the cohort with the longest time horizons. If exchange inflows accelerate and stay elevated for months, that would signal persistent distribution rather than accumulation.
For Ethereum, a stalling of layer-2 growth, declining staking ratios, or a sustained drop in DeFi and NFT activity would signal that the network utility story is weakening. Utility is the foundation of value for smart contract platforms. If usage declines for an extended period, price will follow.
The macro backdrop is also uncertain. The Fed raised rates 25 basis points in September 2026, the first hike since 2023\. If the Fed continues hiking into 2027 and real interest rates move significantly positive, risk assets including crypto will face sustained selling pressure. Accumulation phases can last years if the macro environment stays hostile.
I am also watching the difference between Bitcoin's performance and altcoin performance. If Bitcoin holds or grinds higher while altcoins continue to bleed, that would suggest we are in a late-stage bear for alts and early-stage recovery for Bitcoin, a structure consistent with prior cycles. If both continue to decline together, that would suggest the macro pressure is overwhelming and accumulation may be premature.
## The Long-Term Implication for Crypto Adoption
If the current period is an accumulation phase, and I believe it is, then the 5-10 year implication is straightforward. The next cycle will be driven by the projects that continued building through this one, just as the 2020-2021 cycle was driven by the projects that shipped through 2018-2019.
Ethereum's layer-2 ecosystem, Solana's institutional infrastructure, Bitcoin's Lightning Network growth, and the slow but steady adoption of stablecoins for cross-border payments are all accumulating network effects in real time. None of them is headline-grabbing. All of them are compounding.
I have traded through enough cycles to know that the [projects that survive bear markets](https://altcoininvestor.com/builders-in-bear-markets-next-bull/) are the ones with actual users, actual developers, and actual reasons to exist beyond speculation. The infrastructure being built today will capture the value tomorrow. That has been true in every prior cycle. I expect it to be true in the next one.
The broader adoption curve for crypto as a monetary technology moves on a longer timeframe than individual market cycles. The question is not whether crypto will replace or coexist with fiat-based payment systems. The question is how long that transition takes and which projects capture the value.
Central bank digital currencies, stablecoin regulation, institutional custody infrastructure, and the gradual financialization of crypto are all moving forward regardless of whether Bitcoin is at $80,000 or $40,000\. The accumulation phase is not just about buying coins at attractive valuations. It is about positioning for the next decade of infrastructure growth.
## The Takeaway
Accumulation zones do not feel like opportunities when you are in them. They feel like risk. The price is still falling or grinding sideways. The news is still bad. Your friends think you are wrong. That is the point. If accumulation felt good, everyone would do it, and the opportunity would not exist.
The frameworks I use, realized price, MVRV ratio, long-term holder behavior, hash rate stability, and network fundamentals, are not predictive. They are diagnostic. They tell you what phase you are in, not what will happen next. But knowing the phase is enough. If you are in an accumulation phase and you have capital, you accumulate. If you are in a distribution phase, you [take profits](https://altcoininvestor.com/profit-taking-bull-market-framework/). If you are in a mania phase, you exit.
I started buying Bitcoin in February 2018 because the valuation and on-chain structure told me we were in accumulation, not capitulation. I was early, but I was right about the phase. That is all you can ask for. The rest is position sizing, time horizon, and emotional discipline.
We may be in an accumulation zone now. We may be at the end of one. I do not know with certainty. But the frameworks I have built over 10+ years of trading through every cycle suggest that current valuations are closer to fair value than euphoria, and that the long-term thesis for crypto as the future of money and transactions remains intact. That is enough for me to act.
## Frequently Asked Questions
### What is the difference between a bear market and an accumulation phase?
A bear market describes a price trend where assets are declining. An accumulation phase describes a market structure where long-term holders stop selling, prices stabilize within a range, and smart money builds positions quietly. Not every bear market contains an accumulation phase. Assets with no fundamental value simply fall and never recover. Genuine accumulation zones are characterized by stable or improving network fundamentals, rising long-term holder supply, exchange outflows, and valuation metrics approaching historical fair-value ranges.
### How do you calculate Bitcoin's MVRV ratio and why does it matter?
MVRV is the ratio of Bitcoin's market capitalization to its realized capitalization. Realized cap is the sum of all coins valued at the price they last moved on-chain, representing the aggregate cost basis of all holders. When MVRV falls below 1.0, the market is holding at a loss, which has historically marked cyclical bottoms with high accuracy. MVRV between 1.0 and 2.0 represents fair value. MVRV above 3.5 has historically signaled overheated markets and local tops. As of mid-October 2026, Bitcoin's MVRV stands at approximately 1.53.
### What on-chain metrics indicate a genuine accumulation zone?
Key on-chain signals include rising long-term holder supply, coins that have not moved in over 155 days, declining exchange balances as investors move coins to cold storage, and stabilizing or rising hash rate despite stagnant or falling prices. For proof-of-stake networks like Ethereum, increasing staking ratios signal long-term conviction. These metrics distinguish accumulation from capitulation or simple decline. When combined with valuation frameworks like MVRV, they provide a probabilistic read on market phase.
### Why did Bitcoin not fall below realized price in the current cycle?
The structural composition of the Bitcoin market has matured. A higher proportion of supply is held by long-term holders and institutions with longer time horizons and less leverage. This reduces the number of forced sellers during drawdowns. Realized price has also risen due to accumulation at higher price levels by institutional allocators. The result is a shallower bear market by historical standards. This does not mean the cycle is over, but it does suggest traditional capitulation-level opportunities may not appear as they did in 2018 or 2020.
### What could prove the accumulation thesis wrong?
A breakdown in network fundamentals would invalidate the thesis. Specifically, a sustained 30% drop in Bitcoin hash rate, declining long-term holder supply signaling capitulation among the most patient cohort, persistent exchange inflows indicating distribution, or weakening network usage for smart contract platforms like Ethereum. Additionally, continued Fed rate hikes into 2027 and significantly positive real rates could create sustained selling pressure that extends the bear market beyond the typical cycle duration. The thesis depends on both valuation and fundamental stability.
### Week in Crypto: Yield Infrastructure, Security Failures
URL: https://altcoininvestor.com/week-in-crypto-2026-10-18/
Last updated: 2026-10-18T11:02:18.000Z
The week ending October 18 brought the largest hardware wallet supply-chain attack on record alongside foundational shifts in how yield capital moves through the market. A Ledger compromise drained $102 million from 324 wallets. Blur NFT marketplace shut down after volumes collapsed 99% from peak. Mastercard deployed stablecoin spending infrastructure across hundreds of millions of merchants. Binance Pool closed after hashrate fell 65%. The pattern across all of it: infrastructure matters more than hype, and security failures cost more than anyone budgets for.
## Security and Exploits
On October 9, approximately $102 million was stolen from 324 wallets when a [covert hardware implant embedded in Ledger devices](https://altcoininvestor.com/ledger-supply-chain-implant-102m-theft/) transmitted recovery phrases over LTE using an eSIM. The devices were purchased through CryptoBilis, an authorized reseller in Malaysia, Indonesia, and the Philippines. The implant was physically integrated into the circuit board before sale. This is the second major hardware wallet supply-chain compromise following a $20M D'CENT breach weeks earlier.
The theft clarifies something most security advice ignores. The weakest link in hardware wallet security is not the firmware or the chip. It is the supply chain between manufacturing and your hands. When you buy direct from Ledger or Trezor, you control one step. When you buy through a reseller - even an authorized one - you introduce surface area you cannot audit. The $102 million loss came from 324 wallets, an average of $315,000 per wallet. That distribution suggests the victims were not retail tourists but allocators holding meaningful positions.
For anyone managing yield positions across chains, this changes the purchase calculus. [Tangem's card-based model](https://altcoininvestor.com/tangem-wallet-review/) removes the screen and USB dependency but introduces phone-trust risks. Ledger's security model assumed the device itself was the boundary. The implant bypassed that entirely by intercepting seed phrases at generation. The correct response is not to abandon hardware wallets. It is to buy them only from the manufacturer, verify tamper seals with documentation from the official site, and treat any third-party reseller - authorized or not - as hostile.
## Exchanges and Market Structure
Binance Pool will shut down on November 10 after its hashrate dropped approximately 65% since December, falling to about 9.2 exahashes per second, less than 1% of Bitcoin's network. The closure gives miners roughly four weeks to move. The problem is not that another pool option exists. The problem is that [three pools already control 64% of Bitcoin's hashrate](https://altcoininvestor.com/binance-bitcoin-mining-pool-shutdown/), and every pool closure reduces optionality further.
Pool concentration is a second-order centralization risk that most mining profitability models ignore. When you compare [GPU versus ASIC mining](https://altcoininvestor.com/gpu-vs-asic-mining-profitability/), the spreadsheet shows daily revenue minus electricity cost. What it does not show is the risk premium you should apply when four pools can coordinate to reorganize blocks or censor transactions. The market has decided that risk is worth ignoring. Binance's exit makes that decision more expensive.
[](https://altcoininvestor.com/gpu-vs-asic-mining-profitability/)
GPU Mining vs ASIC Mining: Real Income, Breakeven, and Exit
On the exchange yield side, the [friction cost from fiat to self-custody](https://altcoininvestor.com/best-crypto-exchange-yield-deployment/) remains the largest hidden drag on returns. Coinbase restructured fees to 0.50%/0.90% in the US on September 16\. That spread plus three-day ACH hold means you are losing 72 hours of yield and 1.4% round-trip before you even deploy capital into Aave or Curve. The right exchange is not the one with the best staking rate. It is the one that gets you into your actual position fastest with the lowest total cost, including withdrawal fees and hold periods.
[](https://altcoininvestor.com/best-crypto-exchange-yield-deployment/)
Best Crypto Exchanges For Yield Capital Deployment
## Stablecoins and Payment Rails
On October 15, Mastercard launched its Global Money Platform in partnership with BVNK, three days after closing a $1.8 billion acquisition of the stablecoin infrastructure provider. The platform connects Mastercard Move, which reaches more than 17 billion endpoints, to [BVNK's stablecoin technology](https://altcoininvestor.com/mastercard-stablecoin-platform-income-analysis/) through a unified API. Early adopters include Nuvei, Marqeta, Ontop, Kulipa, Tribal, Pomelo, and SumUp.
The mechanism creates fiat-to-stablecoin velocity paths, not yield. Mastercard is not entering the lending market. It is building settlement rails that let consumers spend USDC or USDT at hundreds of millions of merchants without converting to fiat first. For yield allocators, this matters because it reduces the friction cost of moving capital from stablecoin positions back into real-world liquidity. The faster stablecoins become spendable, the less you pay in off-ramp fees when you need to exit.
The $1.8 billion acquisition price signals that Mastercard sees stablecoin transaction volume as structurally important, not speculative. The infrastructure is boring. The implication is not. Every basis point saved on conversion spreads compounds over time, and the spread between on-chain stablecoin yield and bank deposit rates only matters if you can access both sides without paying 1.5% to move between them.
## DeFi and Protocols
The week brought a significant volume of educational coverage around yield mechanics, much of it correcting the gap between advertised APY and net returns after fees, gas, and lock periods. [Real yield comes from protocol fees, spread, and external revenue](https://altcoininvestor.com/what-is-real-yield-in-crypto/). Fake yield comes from token emissions, subsidies, and recycled deposits. The diagnostic question that separates them: if the protocol stopped issuing new tokens tomorrow, would the yield still exist?
[](https://altcoininvestor.com/what-is-real-yield-in-crypto/)
Where Real Yield Comes From (And How To Spot Fake Yield)
Ethena advertises 18% APY on sUSDe. The question worth answering is where that 18% actually comes from. Bond analysts asked the same question about Greek sovereign debt in 2010\. The answer determines whether you are earning income or funding someone else's exit. The same framework applies to [yield farming](https://altcoininvestor.com/yield-farming-explained-beginner/), where fees are sustainable income and token rewards often dilute.
[](https://altcoininvestor.com/yield-farming-explained-beginner/)
Yield Farming Explained: How It Actually Works
On the allocation side, [points programs versus direct yield](https://altcoininvestor.com/should-i-farm-points-or-earn-yield/) represents a choice between zero-coupon bonds with default risk and contractual income with known counterparties. Points farming has no guaranteed return. Aave V3 pays 3.8% to 5.2% APY in USDC with $76.6 billion TVL and five years of operational history. The choice is not about risk tolerance. It is about whether you can decompose the income source and verify it on-chain.
[](https://altcoininvestor.com/should-i-farm-points-or-earn-yield/)
Points Programs vs Direct Yield: When To Farm And When To Earn
## Adoption and Institutional
Strive increased its bitcoin holdings by 3,311 BTC between October 5 and October 9, purchasing at an average price of approximately $84,500 per BTC including fees. The total acquisition value reached $280 million. The financing mechanism was [warrant exercises and share issuance](https://altcoininvestor.com/strive-280m-bitcoin-equity-dilution-strategy/), increasing outstanding shares by 9.4% while avoiding debt. The trade-off is explicit: shareholders accept dilution in exchange for BTC exposure without leverage risk.
This is the opposite of MicroStrategy's debt-funded accumulation model. Strive's approach costs shareholders equity but preserves balance sheet flexibility. MicroStrategy's approach preserves equity percentage but adds interest expense and refinancing risk. Neither is better. They are different risk profiles with different failure modes. For allocators watching corporate BTC accumulation as a thesis, the distinction matters because it determines what breaks first under stress.
Meanwhile, the Bitcoin life insurance provider backed by Sam Altman, closed a $37.5 million funding round led by Bain Capital Crypto. The company offers life insurance products denominated in Bitcoin, allowing policyholders to maintain BTC exposure while holding long-term coverage. The [funding round](https://altcoininvestor.com/bitcoin-life-insurance-meanwhile-funding/) signals institutional capital is moving beyond custody products into income-generating insurance structures. The question for yield allocators is whether Bitcoin-denominated insurance premiums represent a new source of sustainable demand or another leverage point that breaks when volatility returns.
[](https://altcoininvestor.com/bitcoin-life-insurance-meanwhile-funding/)
Bitcoin Life Insurance: What the Meanwhile Round Means
## NFT and Airdrop Infrastructure
Blur NFT marketplace is shutting down after trading volumes collapsed 99% from peak levels. The platform once held the largest share of Ethereum NFT trading volume following an aggressive token airdrop campaign in 2023-2024\. That position is now gone. The [closure reveals how token incentives fail](https://altcoininvestor.com/blur-marketplace-shutdown-airdrop-limits/) to build durable trading activity. Volume driven by points farming and airdrop speculation disappears the moment the incentives stop.
[](https://altcoininvestor.com/blur-marketplace-shutdown-airdrop-limits/)
Blur Marketplace Shutdown Shows Airdrop Limits
This is not unique to Blur. It is the structural problem with every growth strategy that confuses subsidized activity with organic demand. The same pattern appears in [airdrop farming](https://altcoininvestor.com/how-much-does-airdrop-farming-cost/), where participants spend $150 to $3,000 in gas and capital across six months chasing allocations that often return less than the cost to earn them. The marketing presents airdrops as free tokens. The reality is months of on-chain activity, gas fees on every transaction, bridge fees between chains, and opportunity cost on capital locked in protocols you would not otherwise use.
For allocators considering [retroactive airdrop strategies](https://altcoininvestor.com/what-qualifies-for-retroactive-airdrops/), the historical data is public. Twenty-three major airdrops between 2020 and 2026 show consistent patterns in what protocols reward: transaction volume, duration, liquidity provision, and governance participation. The variance is smaller than the marketing suggests, and the median return after gas and time cost is often negative unless you are farming at scale across multiple wallets. LayerZero disqualified 803,000 addresses in 2024 through funding graph analysis and behavioral clustering. The sophistication required to avoid detection now exceeds the expected return for most participants.
[](https://altcoininvestor.com/what-qualifies-for-retroactive-airdrops/)
Retroactive Airdrop Patterns: Activities That Qualify
## The Takeaway
Supply-chain risk is now the largest unpriced exposure in hardware wallet security. Pool concentration risk is the largest unpriced exposure in mining. Token-incentivized growth is the largest unpriced exposure in protocol traction metrics. The pattern across all three: the infrastructure you do not think about costs more than the risk you hedge.
What to watch next week: whether Binance Pool miners consolidate into Foundry and AntPool or distribute across smaller alternatives, what Mastercard's first month of stablecoin transaction volume looks like through Nuvei and Marqeta, and whether other hardware wallet manufacturers publish supply-chain audit documentation in response to the Ledger breach. The shoe that has not dropped: regulatory response to the $102 million theft and whether authorized reseller liability extends to the manufacturer.
## Frequently Asked Questions
### What was the biggest security breach in crypto this week?
A supply-chain attack on Ledger hardware wallets drained $102 million from 324 wallets on October 9, 2026\. The attack used a covert hardware implant with an embedded eSIM that transmitted 24-word recovery phrases over LTE. The compromised devices were sold through CryptoBilis, an authorized reseller in Southeast Asia. This represents the largest hardware wallet supply-chain breach on record and exposes critical vulnerabilities in third-party distribution channels that most security models ignore.
### Why is Binance Pool shutting down and what does it mean for miners?
Binance Pool closes November 10, 2026 after its hashrate dropped 65% since December to approximately 9.2 exahashes per second, less than 1% of Bitcoin's network. The closure forces miners to relocate within four weeks, but three pools already control 64% of Bitcoin's hashrate. Each pool exit reduces miner optionality and increases concentration risk. The consolidation creates second-order centralization concerns that standard profitability calculators do not account for, including potential coordination for block reorganization or transaction censorship.
### What is Mastercard's Global Money Platform and how does it affect stablecoin yields?
Mastercard launched its Global Money Platform on October 15, 2026 following a $1.8 billion acquisition of BVNK. The platform connects Mastercard Move's 17 billion endpoints to stablecoin infrastructure, enabling USDC and USDT spending at hundreds of millions of merchants without fiat conversion. While it does not create yield directly, it reduces off-ramp friction costs when exiting stablecoin positions. Lower conversion spreads and faster settlement improve the effective return on stablecoin yield strategies by reducing the total cost of moving between on-chain positions and real-world liquidity.
### Why did Blur NFT marketplace shut down?
Blur closed after trading volumes collapsed 99% from peak levels following an aggressive 2023-2024 token airdrop campaign. The marketplace once dominated Ethereum NFT trading share but could not sustain activity once airdrop incentives ended. The shutdown demonstrates that token-subsidized growth creates temporary volume, not organic demand. Volume driven by points farming and speculation disappears when incentives stop, a pattern visible across DeFi protocols that mistake subsidized activity for product-market fit. The closure validates skepticism toward growth metrics built on emission-based rewards rather than fee-generating economic activity.
### How much does airdrop farming actually cost after gas and time?
Airdrop farming costs $150 to $3,000 in gas and capital deployment across six months, with many campaigns returning less than participants spend. The process requires continuous on-chain activity, gas fees for every transaction, bridge fees between chains, and opportunity cost on locked capital. LayerZero disqualified 803,000 addresses in 2024 using funding graph analysis and behavioral clustering. Historical data from 23 major airdrops between 2020 and 2026 shows median returns after gas and time cost are often negative unless farming at scale across multiple wallets with sophisticated anti-detection infrastructure.
### Ledger Supply-Chain Implant Drained $102M from Wallets
URL: https://altcoininvestor.com/ledger-supply-chain-implant-102m-theft/
Last updated: 2026-10-20T18:00:05.000Z
On October 9, 2026, approximately $102 million was stolen from 324 wallets across six networks when a covert hardware implant embedded in Ledger devices transmitted users' 24-word recovery phrases over LTE using an eSIM. The devices were purchased from CryptoBilis, an authorized reseller operating in Malaysia, Indonesia, and the Philippines. This is the second major hardware wallet supply-chain compromise in 2026, following a $116M Coldcard incident just two months prior.
The implant read recovery phrases directly from the device screen and transmitted them over mobile networks. Mark Karpelès, former Mt. Gox CEO and now security researcher, noted the implant represented "quite an evolution" from previous versions featuring manually soldered wires. Ledger described the thefts as a physical supply-chain attack, not a breach of its software or internal systems. The incident occurred as Ledger unveiled a new $899 smartphone-like device called Atom.
For anyone who earns in crypto through gambling affiliate income, casino VIP programs, or platform treasury yield, this incident is not just a security headline. It is a direct threat to the capital accumulation you depend on. Most crypto casino affiliates and skilled players who treat gambling as a revenue surface hold six-figure balances in hardware wallets. Losing custody of that capital erases months or years of rakeback, VIP rebates, or RevShare earnings in a single transaction. Understanding how this attack worked, and how to verify your own [hardware wallet integrity](https://altcoininvestor.com/best-crypto-hardware-wallets/), is part of income-surface protection, not optional.
## What Happened in the CryptoBilis Supply Chain

CryptoBilis operated as an authorized Ledger reseller across three Southeast Asian markets. Customers who purchased devices through this channel received hardware that appeared legitimate but contained a covert implant capable of intercepting recovery phrases. The implant used an embedded eSIM to transmit data over LTE networks, bypassing any local network monitoring or airgapped security assumptions users might have relied on.
The attack drained funds from 324 wallets across six blockchain networks. Tether froze $10 million of USDT, representing partial recovery, but the majority of stolen funds moved through Tornado Cash mixers within hours. This illustrates the ongoing tension between asset recovery mechanisms (centralized stablecoin freeze functions) and privacy-mixing services that obscure on-chain trails.
MediaMarkt Saturn, a major European electronics retailer, stopped selling Ledger devices after a customer in Germany reported an implant. This suggests the supply-chain compromise may have extended beyond Southeast Asia, though the primary documented losses occurred in the CryptoBilis distribution region.
## Why This Matters for Crypto Gambling Income Earners
If you earn through crypto gambling affiliate programs, VIP rakeback, or platform treasury yields, your income accumulates in wallets that you control. That is the entire value proposition of crypto gambling income compared to traditional gambling affiliate models: you hold the capital, you control the withdrawals, and you are not subject to payment processor delays or geographic restrictions. But that self-custody model depends entirely on the integrity of your storage infrastructure.
A typical affiliate earning $10,000 per month in RevShare or CPA commissions from platforms like Stake, Rollbit, or BC.Game will accumulate six-figure balances within a year if they are reinvesting into platform tokens or holding for tax-timing reasons. VIP players earning 10% to 15% rakeback on $500,000 monthly volume are dealing with similar capital levels. Losing that capital to a supply-chain attack does not just erase your current balance. It erases your compounding base for future earnings.
The CryptoBilis incident also exposes a geographic risk pattern. Southeast Asia is a major growth region for crypto gambling operators, with significant player volume in Malaysia, Indonesia, and the Philippines. Regional distribution channels for hardware wallets often involve authorized resellers who handle logistics, customs, and local customer support. Those same channels are now proven vectors for physical supply-chain attacks.
## How the Implant Worked

The implant was embedded within the Ledger device hardware and read the 24-word recovery phrase from the screen during the device setup or recovery process. It then transmitted that data over LTE using an eSIM, which does not require any local Wi-Fi or Bluetooth connection. This means the attack worked even if the user believed they were operating in an airgapped environment.
Previous supply-chain attacks on hardware wallets involved manually soldered wires or firmware modifications that could be detected with careful inspection. The evolution to an embedded eSIM-based implant represents a significant escalation in adversary capability. As [CoinDesk reported](https://www.coindesk.com/tech/2026/10/13/ledger-says-spy-chip-inside-cryptobilis-ledger-devices-transmitted-wallet-keys-over-mobile-network), this level of sophistication indicates state-level or well-funded organized-crime involvement, not opportunistic scammers.
Once the recovery phrase was transmitted, attackers had full control of the wallet. Funds were swept within hours, often moving through mixers before victims realized what had happened. Tether's ability to freeze $10 million of USDT provided partial recovery for some victims, but only for those holding USDT. Funds in BTC, ETH, and other non-freezable assets were gone permanently.
## What This Means for Self-Custody Income Storage
Self-custody is the default recommendation for anyone earning significant income through crypto gambling platforms, affiliate programs, or platform treasury participation. But self-custody is only as secure as the hardware and processes you use. This incident exposes two specific vulnerabilities that income earners need to address immediately.
First, purchasing hardware wallets through regional resellers introduces supply-chain risk that cannot be eliminated through software verification alone. Ledger's firmware may be legitimate, and the device may pass all software-based integrity checks, but if the hardware itself has been compromised before you receive it, those checks are irrelevant. This is not a theoretical risk. It has now happened twice in two months, draining a combined $218 million.
Second, the assumption that airgapped environments protect you from remote attacks is no longer valid when the implant itself has network connectivity. Many crypto gambling affiliates and VIP players operate under the assumption that using a hardware wallet in a location without Wi-Fi or Bluetooth creates an impenetrable barrier to remote theft. An eSIM-based implant bypasses that assumption entirely.
For income earners, this creates a practical dilemma. You need secure storage for the capital you are accumulating through affiliate commissions, VIP rakeback, or platform yields, but the storage infrastructure itself is now a proven attack surface. The solution is not to abandon self-custody. It is to verify the integrity of your hardware wallet and to implement multi-signature or time-locked withdrawal structures for large balances.
## Verifying Your Hardware Wallet Integrity
If you purchased a Ledger device through any reseller in Southeast Asia, or through any channel other than direct purchase from Ledger's official website, you should treat that device as compromised until proven otherwise. Do not use it for storage of significant balances. Do not enter your recovery phrase into it. Do not assume that because the device appears to function normally, it is secure.
Ledger has not yet published a public verification method for detecting the specific implant used in the CryptoBilis attack. That absence is a problem. In the absence of an official verification tool, the safest approach is to replace the device entirely with one purchased directly from the manufacturer and delivered through a supply chain you can verify. For income earners holding six-figure balances, the cost of a replacement device is negligible compared to the risk of total loss.
For devices purchased directly from Ledger, the risk is lower but not zero. Supply-chain attacks can occur at the manufacturer level, during shipping, or during customs processing. The best practice is to verify the tamper-evident packaging, check the firmware version against Ledger's official release notes, and initialize the device in a controlled environment where you can monitor for unexpected network activity.
If you are holding large balances, consider using a multi-signature wallet structure that requires approval from multiple hardware devices purchased through different supply chains. This limits the risk that a single compromised device can drain your entire balance. It also provides a recovery path if one device is lost or compromised.
## The Takeaway
The CryptoBilis supply-chain attack drained $102 million from 324 wallets using a hardware implant that transmitted recovery phrases over LTE. This is the second major hardware wallet compromise in two months, and it exposes a critical vulnerability in the self-custody infrastructure that crypto gambling income earners depend on. If you purchased a Ledger device through any reseller in Malaysia, Indonesia, the Philippines, or any other regional distribution channel, treat that device as compromised until you can verify its integrity or replace it. For anyone holding six-figure balances from affiliate income, VIP rakeback, or platform yields, the cost of replacing your hardware wallet is negligible compared to the risk of total loss. Self-custody remains the correct model for income storage, but the hardware you use to implement it must be verified through supply chains you control.
## Frequently Asked Questions
### How did the Ledger supply-chain attack work?
A covert hardware implant was embedded in Ledger devices sold through CryptoBilis, an authorized reseller in Malaysia, Indonesia, and the Philippines. The implant read users' 24-word recovery phrases from the device screen and transmitted them over LTE using an embedded eSIM. Attackers then used the recovery phrases to drain funds from 324 wallets across six blockchain networks, stealing approximately $102 million total. The attack bypassed airgapped security assumptions because the implant had its own network connectivity.
### How can I verify if my Ledger device is compromised?
Ledger has not yet published an official verification method for detecting the specific implant used in this attack. If you purchased your device through any reseller in Southeast Asia or any channel other than direct purchase from Ledger's official website, treat it as potentially compromised. Do not use it for significant balances and do not enter your recovery phrase. The safest approach is to replace the device with one purchased directly from Ledger and delivered through a verified supply chain. Check tamper-evident packaging and firmware version against official release notes.
### Should I stop using hardware wallets for crypto gambling income?
No. Self-custody remains the correct model for storing crypto gambling affiliate income, VIP rakeback, and platform yields. The issue is not hardware wallets themselves but supply-chain integrity. Purchase devices directly from manufacturers, verify packaging and firmware, and consider multi-signature wallet structures that require approval from multiple devices purchased through different supply chains. This limits the risk that a single compromised device can drain your entire balance while maintaining the self-custody benefits that crypto gambling income depends on.
### What happened to the stolen funds from the CryptoBilis attack?
Approximately $102 million was stolen from 324 wallets. Tether froze $10 million of USDT, providing partial recovery for some victims, but the majority of stolen funds moved through Tornado Cash mixers within hours of the attack. Funds held in Bitcoin, Ethereum, and other non-freezable assets were permanently lost. This illustrates the ongoing tension between centralized asset recovery mechanisms like stablecoin freeze functions and privacy-mixing services that obscure on-chain transaction trails and prevent recovery.
### Is this the first hardware wallet supply-chain attack?
No. This is the second major hardware wallet supply-chain compromise in 2026\. A Coldcard incident two months prior drained $116 million. Combined, these two attacks have stolen $218 million through physical supply-chain compromises. Previous attacks involved manually soldered wires or firmware modifications. The CryptoBilis attack represents an evolution to embedded eSIM-based implants that require significantly more sophisticated adversary capabilities, suggesting state-level or well-funded organized-crime involvement rather than opportunistic scammers.
Tool mentioned above
Ledger
Ledger devices display the full transaction on their own screen before you approve it, which is what stops an approval exploit at the point it matters.
[See Ledger devices](https://shop.ledger.com/?r=90612ff43561)
We may earn a commission if you sign up through this link, at no cost to you. It does not change what gets recommended.
The Weekly Yield Report
You have just read how $102 million was drained from 324 wallets through a supply-chain implant in authorized reseller channels. The next attack vector is already being developed.
Every Thursday: where crypto yield actually is - stablecoins, liquid staking and DeFi lending, with the risk named next to the rate and what changed since last week.
[Get it free every Thursday](#/portal/signup)
Free. No trade calls, no allocations, no hype. Unsubscribe in one click.
### Mastercard Global Money Platform: Stablecoin Utility Analysis
URL: https://altcoininvestor.com/mastercard-stablecoin-platform-income-analysis/
Last updated: 2026-10-19T18:00:06.000Z
## The Platform Mechanism
On October 15, 2026, Mastercard launched its Global Money Platform in partnership with BVNK, three days after closing its $1.8 billion acquisition of the stablecoin infrastructure provider. The platform connects Mastercard Move, which reaches more than 17 billion endpoints, with BVNK's stablecoin technology through a unified API. Early adopters include Nuvei, Marqeta, Ontop, Beem, and Almond FinTech.
The mechanism works in three steps. First, a user holds stablecoin balances in a BVNK-connected wallet or account. Second, the user initiates a payment through the Global Money Platform API. Third, the platform converts the stablecoin to local fiat currency and delivers it to the recipient's bank account. Coverage is expected to expand to more than 40 currencies across 200-plus countries and territories in 2027.
This is not a yield mechanism. It is a stablecoin utility mechanism. The platform does not generate income from stablecoin holdings. It converts stablecoin balances into payment rails. The income question is whether this conversion path opens new arbitrage, liquidity provision, or payment-processing opportunities for users who already hold stablecoins.
## The Stablecoin Velocity Thesis
The platform's core contribution is velocity, not return. Stablecoins sitting in wallets generate zero income unless deployed into lending, liquidity pools, or staking derivatives. The Global Money Platform does not change that. What it changes is the exit path. Users can now spend stablecoin balances directly into Mastercard's acceptance network of hundreds of millions of merchant locations without converting to fiat on an exchange first.
This matters for three user types. First, individuals in countries with capital controls or currency volatility who hold stablecoins as savings. Second, businesses that receive stablecoin payments and need to convert to fiat for payroll or vendor payments. Third, payment processors and remittance services that route cross-border transfers through stablecoins to reduce settlement time and fees.
None of these use cases generate yield. They reduce friction and increase optionality. The income angle is indirect. If stablecoins become easier to spend, demand for stablecoin balances may increase, which could expand [DeFi protocol](https://altcoininvestor.com/best-defi-protocols/) liquidity and improve yields on stablecoin lending or liquidity provision. That is a second-order effect. The platform itself does not pay users for holding or spending stablecoins.
## The Payment Processor Economics
Payment processors and businesses using the platform will face specific cost structures. Mastercard has not disclosed transaction fees for the Global Money Platform, but standard cross-border payment rails charge 2-4% in fees and FX spreads. Stablecoin settlement typically costs 0.1-0.3% in network fees plus exchange spread.
If the Global Money Platform charges fees competitive with traditional rails, the cost savings are minimal. If it charges fees closer to stablecoin-native settlement, the arbitrage opportunity is the spread between traditional payment processors and the new platform. Businesses that process high volumes of cross-border payments could capture 1-3% in cost savings by routing payments through stablecoins instead of correspondent banking networks.
This is not passive income. It is operational cost reduction. A remittance provider sending $10 million per month across borders and paying 3% in fees saves $300,000 annually by switching to a 1% platform fee structure. That is a margin improvement, not a yield strategy. The mechanism depends on transaction volume, not capital deployment.
## The Stablecoin Demand Impact
The platform creates demand for stablecoins in proportion to transaction volume. If businesses and consumers spend $1 billion per month through the Global Money Platform, that is $1 billion in stablecoin demand that did not exist before. This demand flows into one of three places. First, existing stablecoin holders spend down balances. Second, new users mint stablecoins by depositing fiat. Third, businesses hold stablecoin float balances to facilitate recurring payments.
The third category is where income potential emerges. Businesses that hold stablecoin float balances for payment processing can deploy those balances into short-duration yield strategies while waiting for payment settlement. A company holding $5 million in USDC float can lend it on Aave or Compound at current rates of 4-6% APY. If the average holding period is two weeks before spending, the annualized return on float is proportional to deployment duration.
This is not new. Corporate treasury teams already deploy fiat float into money market funds. The Global Money Platform makes stablecoin float operationally viable for businesses that previously avoided crypto exposure due to off-ramp friction. The income mechanism is existing DeFi lending, not the platform itself.
## The Failure Modes
The platform has three failure modes. First, stablecoin depeg risk. If USDC or USDT depegs during a transaction, the recipient receives less fiat than expected. The platform does not specify which stablecoins it supports or whether it guarantees peg stability during conversion. Users bear this risk unless Mastercard backstops it.
Second, regulatory restriction. If jurisdictions ban or restrict stablecoin usage, the platform's coverage contracts. Mastercard claims 200-plus countries and territories, but stablecoin regulatory status is unresolved in most of them. A regulatory crackdown in the EU, US, or major Asian markets would reduce the platform's addressable network.
Third, competitive displacement. Stablecoin issuers like Circle and Tether are building their own payment rails. Circle's USDC payment infrastructure already supports direct merchant settlement. If stablecoin issuers bypass Mastercard by offering lower-fee direct rails, the Global Money Platform loses its cost advantage. The platform's moat is Mastercard's existing merchant network. If merchants integrate stablecoin payments natively, that moat erodes.
## The Verification Path
To verify whether the platform creates income opportunities, monitor three on-chain metrics. First, stablecoin minting and burning volume. If the Global Money Platform drives significant transaction volume, stablecoin supply should increase proportionally. Track USDC and USDT supply on-chain using Circle's transparency reports and Tether's attestations.
Second, stablecoin lending rates on major DeFi protocols. If businesses deploy stablecoin float balances into lending markets, utilization rates on Aave, Compound, and similar platforms should increase, pushing yields higher. Compare current stablecoin lending APYs to historical averages to identify demand shifts.
Third, payment processor adoption. Nuvei, Marqeta, Ontop, Beem, and Almond FinTech are early adopters. Monitor their transaction volumes and public disclosures about stablecoin payment adoption. If these processors route significant volume through the platform, that validates the utility thesis. If adoption stalls, the platform is not capturing meaningful market share.
## The Takeaway
Mastercard's Global Money Platform is a stablecoin utility layer, not a yield mechanism. It enables spending but does not pay holders. The income angle is indirect: businesses that hold stablecoin float for payment processing can deploy that float into existing DeFi lending strategies. The platform's success depends on transaction volume, regulatory acceptance, and competitive positioning against stablecoin-native payment rails. Monitor on-chain stablecoin supply, DeFi lending utilization, and payment processor adoption to verify whether the platform drives material stablecoin demand. If it does, the second-order effect is higher yields on stablecoin lending as float balances increase.
## Frequently Asked Questions
### Does Mastercard's Global Money Platform generate yield on stablecoin holdings?
No. The platform is a payment utility layer that converts stablecoins to fiat for merchant settlement. It does not pay interest or yield on stablecoin balances. Users can deploy stablecoin float into existing DeFi lending protocols like Aave or Compound to earn 4-6% APY, but that yield comes from third-party lending markets, not the Mastercard platform itself.
### What stablecoins does the Global Money Platform support?
Mastercard has not disclosed which specific stablecoins the platform supports. USDC and USDT are the most likely candidates given their market dominance and regulatory acceptance. The platform's announcement mentions stablecoin technology from BVNK but does not specify asset restrictions. Users should verify supported assets before deploying capital into the platform.
### What are the transaction fees for using the Global Money Platform?
Mastercard has not disclosed transaction fees. Traditional cross-border payment rails charge 2-4% in fees and FX spreads. Stablecoin-native settlement typically costs 0.1-0.3% in network fees plus exchange spread. If the platform charges fees closer to stablecoin-native rates, businesses could save 1-3% on cross-border payments. Fee disclosure will determine the platform's cost advantage over existing rails.
### What happens if a stablecoin depegs during a payment transaction?
The platform has not disclosed depeg protection mechanisms. If USDC or USDT depegs during transaction processing, the recipient may receive less fiat than expected based on the original stablecoin amount. Users bear this risk unless Mastercard guarantees peg stability during conversion. This is a critical failure mode for businesses processing high-volume payments through the platform.
### How can I verify whether the platform is driving stablecoin adoption?
Monitor three on-chain metrics. First, track USDC and USDT supply using Circle's transparency reports and Tether's attestations. Second, compare stablecoin lending rates on Aave and Compound to historical averages to identify demand shifts. Third, follow transaction volume disclosures from early adopters like Nuvei, Marqeta, and Ontop. Rising supply, higher utilization rates, and growing processor volumes validate adoption.
The Weekly Yield Report
You have just decomposed Mastercard's stablecoin platform and identified three failure modes. Coverage will expand to 40 currencies in 2027, and those numbers will shift.
Every Thursday: where crypto yield actually is - stablecoins, liquid staking and DeFi lending, with the risk named next to the rate and what changed since last week.
[Get it free every Thursday](#/portal/signup)
Free. No trade calls, no allocations, no hype. Unsubscribe in one click.
### ICX Global Puts Leverage and Clarity Side by Side
URL: https://altcoininvestor.com/icx-global-leverage-clarity/
Last updated: 2026-10-15T16:06:26.000Z
## ICX Global Review: A Clear Look at Multi-Market Trading in Practice
Online trading gives individuals direct electronic access to financial markets. Instruments commonly include currencies, stocks, commodities, indices, cryptocurrencies and precious metals. Positions are opened and closed through a digital interface, frequently with leverage. Most retail accounts use contracts for difference, so the trader gains price exposure without owning the underlying asset.
A trader who wants to follow both equity indices and related currency pairs often ends up switching between platforms. ICX Global positions itself as an[ alternative that brings those markets together](https://icx-global.net/reviews/).
## Understanding CFDs in Multi-Asset Trading
Most retail multi-asset platforms, including the one described by ICX Global, give clients access to markets through contracts for difference. A CFD is an agreement between the trader and the platform to exchange the difference in an asset’s price between the moment the position is opened and the moment it is closed. The trader does not take ownership of the underlying currency, stock, commodity, index or cryptocurrency. Exposure is obtained solely through the contract.
This structure allows a single account to cover instruments that would otherwise sit in separate markets. A client can hold a position on an equity index and a related currency pair without switching providers or dealing with different custody arrangements. Leverage is commonly available, so the capital required to open a position is a fraction of the full notional value. The same mechanism that magnifies gains also magnifies losses, and positions can move against the trader more quickly than expected.
Costs are embedded in the contract rather than charged as a separate commission in every case. The spread between the buy and sell price is the most immediate cost. Overnight financing is applied when a position is held beyond the trading day, and this charge can accumulate if the trade remains open for longer periods. Withdrawal conditions and any inactivity fees sit outside the CFD itself but still affect the net result.
Platforms that offer CFDs across currencies, stocks, cryptocurrencies, commodities, indices and precious metals present these contracts under one set of terms. The practical advantage is simplicity of access. The corresponding requirement is that the client understands the precise product being traded, the financing rules that apply to each instrument, and the conditions under which a position may be closed or adjusted. Those details are set out in the platform’s formal documentation rather than in summary descriptions, and they remain the clearest point of reference before any capital is committed.
## What the Platform Sets Out to Do
ICX Global describes itself as a multi-asset environment covering six categories within one account:
- Currencies
- Stocks
- Cryptocurrencies
- Commodities
- Global indices
- Precious metals
Public materials indicate the service is aimed at eligible clients in France, Canada and Australia. The practical idea is straightforward. A user interested in gold, the Australian dollar and energy markets can examine those instruments side by side rather than maintaining separate relationships. Editorial reviews published in 2026 have given the described offering scores in the 9.0 to 9.2 range, reflecting the breadth of markets and the clarity of the interface as presented. Those scores assess the information available rather than audited live performance.
## Account Structure and Everyday Use
Five account levels are outlined. The Essential tier begins at approximately 1,500 dollars and includes the six markets, core analytical tools, weekday support and leverage up to 1:25\. Higher tiers raise the deposit requirement and introduce dedicated account managers, scheduled briefings and increased leverage. A trial period is offered so users can examine layout and basic functions before funding. Identity verification, using government identification and proof of address, forms part of onboarding.
Supporting tools listed in public descriptions include:
- Charting
- Economic calendar
- Currency and cryptocurrency heat maps
- Position calculators
These tools sit alongside the trading interface rather than in a separate research area. Whether that arrangement saves meaningful time depends on the completeness of the instrument list and the transparency of pricing, both of which require confirmation beyond summarised materials.
## Frequently Asked Questions
### Is ICX Global subject to identifiable regulation?
Public descriptions do not provide independently verified licence particulars. Prospective clients should confirm the legal entity against the official registers of the relevant regulator.
### Which markets are indicated as available?
Currencies, stocks, cryptocurrencies, commodities, indices and precious metals, subject to location and account conditions.
### Is a trial available before funding?
A demonstration option is mentioned for reviewing platform functions. Conditions in the trial environment may differ from those on a live account.
### What is the lowest indicated deposit?
The Essential account is described as starting at approximately 1,500 dollars.
### Is mobile access offered?
Mobile facilities for price monitoring and account management are referenced. Specific charting and order functions should be confirmed.
### What are the principal risks?
Capital loss is possible, particularly where leverage is used. Platform reliability, counterparty arrangements and the extent of regulatory protection also warrant examination.
## Conclusion
ICX Global is presented as a platform that consolidates six market categories for eligible clients in selected countries. The concept of a single environment for observing related assets offers practical convenience for traders who prefer not to maintain multiple accounts. Public descriptions emphasise organised navigation, and a trial facility is available for initial review.
The temporary unavailability of the site, the limited regulatory detail and the need to confirm costs and client-money arrangements mean thorough verification remains necessary. Editorial scores reflect the offering as described rather than audited results. Online trading provides flexible access to markets, yet it carries a material probability of loss for many retail participants.
Any decision should rest on direct confirmation of the operating entity, applicable regulation and contractual terms. Only capital that can be afforded in full should be placed at risk. This review is based on publicly available descriptions and does not constitute advice.
### Weekly Yield Report: 15 October 2026
URL: https://altcoininvestor.com/weekly-yield-report-15-october-2026/
Last updated: 2026-10-15T15:01:47.000Z
Six venues dropped from the dataset this week, most of them high-emission LP pools. Sky introduced two new offerings, and Compound's USDC pool climbed back above 5.7%.
## Stablecoin Yields
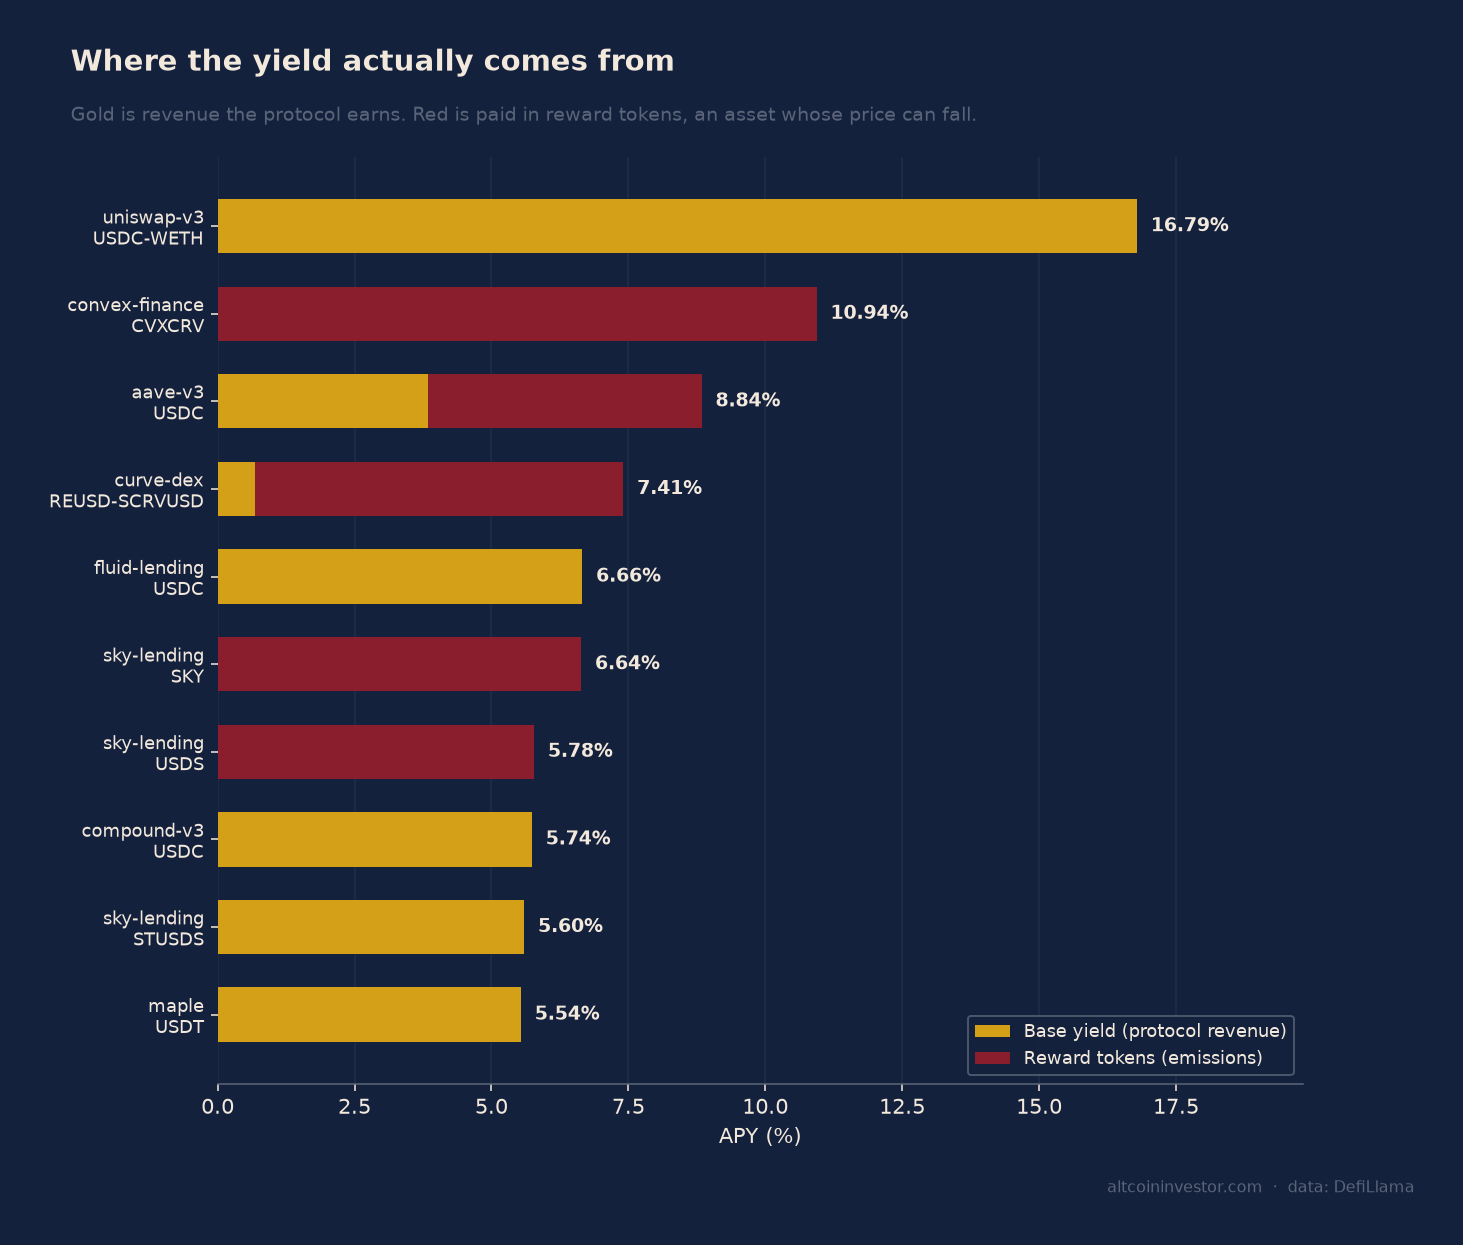
As of 15 October 2026, the core stablecoin venues continue to cluster between 3.3% and 5.8%. [Sky SUSDS](https://defillama.com/yields/pool/d8c4eff5-c8a9-46fc-a888-057c4c668e72) on Ethereum and Arbitrum pays 3.8% across $5,292M in TVL, with a 601-day track record. Spark Savings USDT on Ethereum pays 3.75% on $722M. [Aave v3 USDT](https://defillama.com/yields/pool/f981a304-bb6c-45b8-b0c5-fd2f515ad23a) on Ethereum sits at 3.31% on $408M. Aave v3 USDC across four chains (Ethereum, Arbitrum, Base, Polygon) pays 3.81% on $278M in TVL.
Aave v3 SGHO on Ethereum offers 4.5% on $227M. Sky's new [STUSDS offering](https://defillama.com/yields/pool/9f71f0fd-cfac-54b1-865e-37338f481708) pays 5.6% on $180M, though it carries only a 95-day history. Compound v3 USDC on Ethereum climbed to 5.74% on $35M in TVL, with the longest track record in the set at 1,463 days.
Among venues requiring mechanism explanation, [Ethena sUSDe](https://defillama.com/yields/pool/66985a81-9c51-46ca-9977-42b4fe7bc6df) on Ethereum pays 4.91% on $1,201M. This yield is funding-rate dependent and can go negative in a bear market. Sparklend USDS on Ethereum offers 4.0%, but 100% of that APY comes from emissions rather than base yield.
Morpho Blue vaults GTUSDCP and STEAKUSDC both pay 4.75% on $730M and $476M respectively. These are Morpho vaults where risk parameters are set by the curator, not the protocol. Jupiter lend USDC on Solana pays 6.18% (5.81% base plus 0.37% rewards) on $490M. This is Solana lending, which carries a different chain risk profile to Ethereum.
Fluid lending USDC across three chains (Ethereum, Arbitrum, Base) pays 6.66% on $202M. Fluid is a newer lending design with a shorter track record than Aave. Sky lending USDS on Ethereum pays 5.78% on $143M, but 100% of that APY is emissions.
## Tokenised Treasuries And Credit
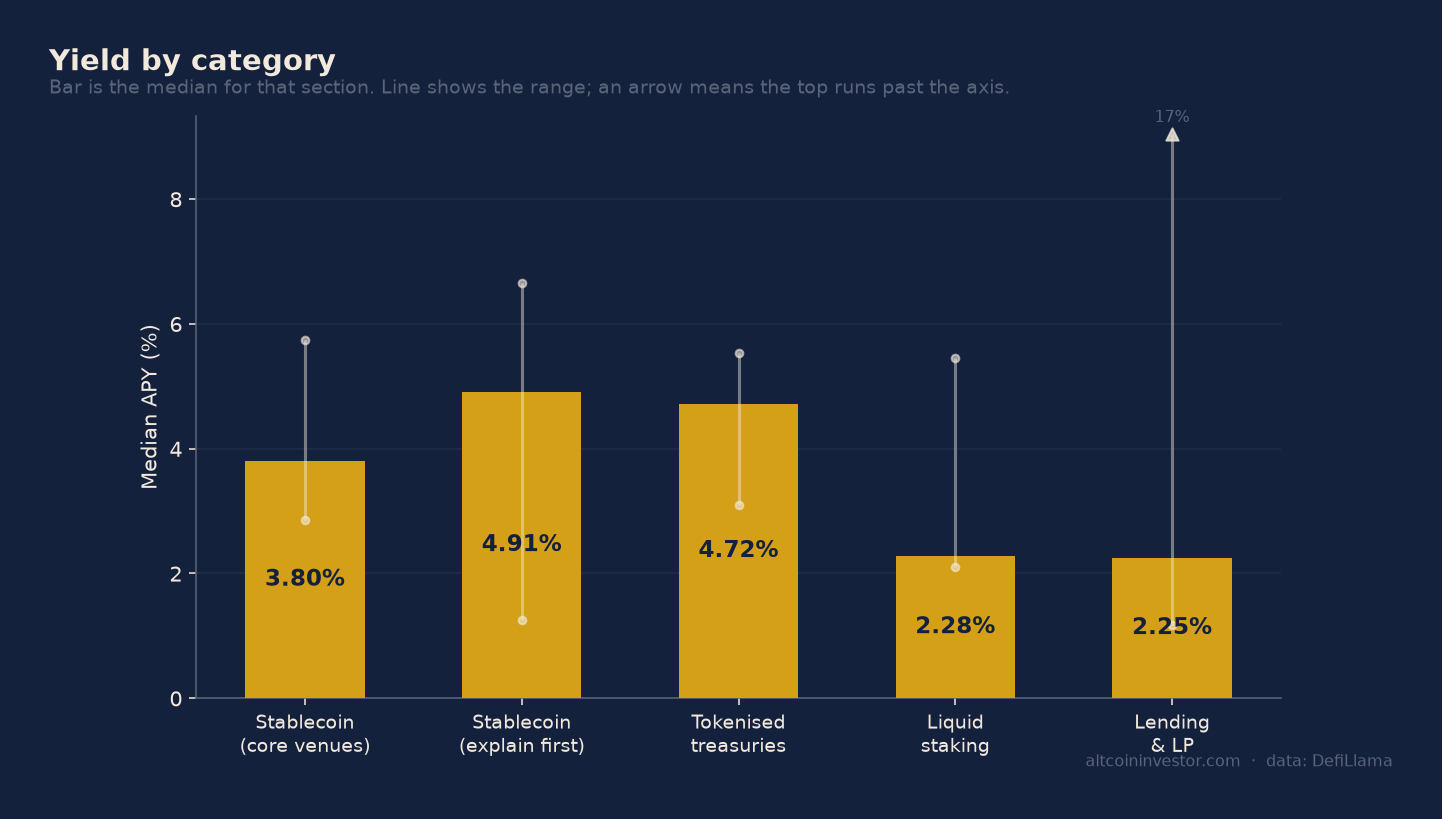
Maple USDC on Ethereum pays 5.2% on $2,776M as of 15 October 2026\. This is institutional credit and carries real borrower default risk, not smart-contract risk. Ondo's [USDY](https://defillama.com/yields/pool/ac61ee82-2fe4-4f9b-a9cd-7fb33f598859) (tokenised US Treasuries) pays 3.68% on $1,437M across Ethereum and Solana. BlackRock's BUIDL pays 3.79% on $1,333M across Solana, Ethereum and Polygon.
Maple USDT on Ethereum offers 5.54% on $738M, again with borrower default risk rather than protocol risk. Invesco's USTB pays 3.57% on $603M. Maple USDG on Ethereum pays 4.91% on $519M.
Usual's BUSD0 on Ethereum pays 4.72% on $504M, but 100% of that APY is emissions. This is a treasury-backed product with a token incentive layer. Centrifuge USDS on Ethereum pays 3.09% on $327M, backed by tokenised real-world credit.
The distinction between these venues and the stablecoin lending pools is counterparty and regulatory risk. You are exposed to borrowers, issuers, and legal structures, not just smart contracts.
## Liquid Staking
Ethereum staking rates remain compressed between 2.11% and 2.28% as of 15 October 2026\. [Lido stETH](https://defillama.com/yields/pool/747c1d2a-c668-4682-b9f9-296708a3dd90) pays 2.25% on $22,630M. Binance wBETH pays 2.24% on $8,230M, though this is exchange-operated and carries custodial counterparty risk. Ether.fi weETH pays 2.22% on $5,215M and includes restaking exposure on top of staking. Rocket Pool rETH pays 2.11% on $1,220M. Coinbase cbETH pays 2.27% on $454M. Stakewise osETH pays 2.28% on $367M.
Solana liquid staking rates are structurally higher. [Jupiter jupSOL](https://defillama.com/yields/pool/52bd72a7-9e81-4112-abb4-71673e8de9bf) pays 5.45% on $529M. Jito jitoSOL pays 4.57% on $1,056M and includes MEV rewards. Drift dSOL pays 5.01% on $283M. Marinade mSOL pays 4.88% on $229M. Solana's higher staking yield reflects a different inflation schedule and validator economics.
## What Changed
Comparing against the 8 October 2026 dataset, six new venues appeared. Sky introduced a SKY token pool at 6.64% (100% emissions) and the STUSDS pool at 5.6%. Aave v3 launched a WETH pool at 6.33% (79% of which is emissions). Curve added a CRVUSD-WBTC pool at 2.25%. Spark Savings opened an ETH pool at 1.4%. Aave v3 USDC on Base appeared at 8.84%, of which 57% is emissions.
Six venues dropped from the dataset, all of which no longer meet the minimum bars. Curve CRVUSD-CBBTC (was 1.21%), Uniswap v3 WBTC-USDT (was 25.54%), Aave v3 WETH (was 4.82%), Compound v3 USDT (was 3.23%), Fluid USDC (was 14.34%), and Curve CRV-CVXCRV (was 9.24%) all fell out.
The largest move was Uniswap v3 USDC-WETH, which climbed from 9.46% to 16.79%, a gain of 7.33 percentage points. Jupiter lend USDC rose from 4.15% to 6.18%. Convex cvxCRV increased from 9.16% to 10.94%. Curve rEUSD-scrvUSD fell from 8.75% to 7.41%. Compound v3 USDC dropped from 6.87% to 5.74%.
This is a quieter week in terms of net additions, but the removals signal continued volatility in emission-heavy LP pools.
## Where The Yield Is Not Real
A pool paying 10% is not a 10% pool if 9% of that comes from a token down 60% year-to-date. As of 15 October 2026, the following venues derive most or all of their headline APY from reward token emissions.
Convex cvxCRV pays 10.94%, 100% of which is emissions. Aave v3 USDC on Base pays 8.84%, of which 57% (5 percentage points) is emissions. Curve rEUSD-scrvUSD pays 7.41%, of which 91% is emissions. Sky SKY pays 6.64%, all emissions. Aave v3 WETH on Base and Ethereum pays 6.33%, of which 79% is emissions. Sky USDS on Ethereum pays 5.78%, all emissions.
Aave v3 RLUSD on Ethereum pays 4.98%, of which 65% is emissions. Usual BUSD0 pays 4.72%, all emissions, though the base layer is treasury-backed. Sparklend USDS on Ethereum pays 4.0%, all emissions.
The base yields in these pools range from 0% to 3.84%. The reward tokens fluctuate. A 10% headline becomes a 1% reality if the token halves before you exit. This is not yield. It is speculative token exposure dressed as income.
## How To Verify Any Of This
Every figure in this report is taken from DefiLlama as of 15 October 2026\. Yields change daily, so these are snapshots, not promises. Each pool in the dataset carries a verification URL.
To verify [Sky SUSDS at 3.8%](https://defillama.com/yields/pool/d8c4eff5-c8a9-46fc-a888-057c4c668e72), follow the link. To check [Aave v3 USDT at 3.31%](https://defillama.com/yields/pool/f981a304-bb6c-45b8-b0c5-fd2f515ad23a), follow the link. To confirm [Sky STUSDS at 5.6%](https://defillama.com/yields/pool/9f71f0fd-cfac-54b1-865e-37338f481708), follow the link. To validate [Ethena sUSDe at 4.91%](https://defillama.com/yields/pool/66985a81-9c51-46ca-9977-42b4fe7bc6df), follow the link. To review [Ondo USDY at 3.68%](https://defillama.com/yields/pool/ac61ee82-2fe4-4f9b-a9cd-7fb33f598859), follow the link. To inspect [Lido stETH at 2.25%](https://defillama.com/yields/pool/747c1d2a-c668-4682-b9f9-296708a3dd90), follow the link. To examine [Jupiter jupSOL at 5.45%](https://defillama.com/yields/pool/52bd72a7-9e81-4112-abb4-71673e8de9bf), follow the link.
The point is not to trust this report. The point is that you can check it in one click.
### Binance Pool Shuts Down, Leaving Miners With Four Weeks
URL: https://altcoininvestor.com/binance-bitcoin-mining-pool-shutdown/
Last updated: 2026-10-18T18:00:06.000Z
## The Closure Timeline and Hashrate Collapse

Binance will shut down its bitcoin mining pool on November 10, giving miners roughly four weeks to move their computing power. The pool's hashrate has fallen about 65% since December, dropping to approximately 9.2 exahashes per second. That represents less than 1% of Bitcoin's network today.
The thesis here is simple. Pool exits reduce miner optionality at exactly the wrong time, forcing consolidation during a recovery phase when hashrate economics are improving but choice is shrinking.
Binance Pool was once handling 2.3% of Bitcoin's network. The decline from that peak to under 1% preceded the shutdown announcement, signaling that miners were already voting with their feet. When a pool loses two-thirds of its hashrate in ten months, closure becomes inevitable. The question is what happens to the computing power that remains.
This is the second major pool exit in three months. SBI Crypto shut its pool on July 31 after accounting for roughly 2% of Bitcoin's computing power. Two pools representing a combined 4-5% of the network have now disappeared in a single quarter.
## The Concentration Problem
Foundry USA, AntPool, and F2Pool together control about 64% of Bitcoin's network computing power. Binance Pool's closure pushes that figure higher, because the displaced hashrate does not have many places to go.
If you ran a traditional exchange, and three of your liquidity providers handled 64% of volume, you would call that a structural risk. The same principle applies here. [Pool selection](https://altcoininvestor.com/how-to-choose-mining-pool/) is now a choice among three dominant players and a handful of smaller operators with uncertain longevity.
The timing is notable. October 2026 marked miners' best month since January, generating $1.12 billion in revenue. Hashprice climbed back above $40, difficulty sits 15% below its record, and new ASICs are trading at two-year-low prices. Mining fundamentals are improving, but the number of viable pools is shrinking.
That mismatch creates a bottleneck. Miners who want to switch pools during favorable conditions now face a market where the top three options already dominate block production. The smaller pools that remain are unproven at scale or carry their own risks.
## What Miners Are Losing

The four-week migration window is tight. Miners need to evaluate fee structures, payout models, and uptime records across remaining pools, then reconfigure their hardware before November 10\. That process takes time, especially for larger operations running thousands of machines.
Binance Pool offered FPPS payout, 2.5% fees, and integration with Binance's broader ecosystem. Miners leaving that setup need to find comparable terms elsewhere. Not all pools offer FPPS. Not all charge the same fees. Not all provide the same liquidity access for converting block rewards.
If you are running 50 exahashes and your pool shuts down, you are not just switching a setting. You are re-negotiating your entire post-mining workflow, from payout timing to [Bitcoin](https://altcoininvestor.com/bitcoin/) custody to fiat conversion. The tighter the deadline, the less leverage you have in that negotiation.
This is why pool exits matter more than raw hashrate numbers suggest. The displaced miners lose optionality, and the receiving pools gain pricing power. When three pools already control nearly two-thirds of the network, that dynamic accelerates consolidation rather than slowing it.
## The Recovery Context
October's $1.12 billion mining revenue represents a sharp recovery from the lows of mid-2026\. Hashprice above $40 means miners are earning more per terahash than they were three months ago. Difficulty 15% below its peak gives smaller operators room to compete. ASIC prices at two-year lows make expansion affordable again.
In a normal market, those conditions would attract new pools and increase competition. Instead, the opposite is happening. Binance and SBI both exited during a recovery phase, not during distress. That tells you something about the long-term economics of running a mining pool.
Pools make money from fees, typically 1-4% of miner revenue. When hashrate concentrates, the top pools can charge higher fees or offer worse terms because miners have fewer alternatives. When pools exit, the remaining operators inherit that pricing power without having to compete for it.
Foundry, AntPool, and F2Pool are now positioned to absorb Binance's remaining 9.2 exahashes and SBI's former capacity with minimal effort. The [displaced miners](https://www.coindesk.com/markets/2026/10/15/bitcoin-mining-pool-once-handling-2-3-of-network-shuts-after-hashrate-falls-65) need somewhere to go, and the three largest pools are the obvious destination.
## The Migration Decision
Miners leaving Binance Pool face a decision tree with limited branches. They can join one of the three dominant pools, accepting the concentration risk that comes with that choice. They can move to a smaller pool like Braiins or ViaBTC, betting that those operators will remain viable long-term. Or they can attempt [solo mining](https://altcoininvestor.com/solo-mining-vs-pool-mining/), which only makes economic sense above 9.5 exahashes.
Each option carries trade-offs. The large pools offer stability and liquidity but increase network centralization. The smaller pools offer better fee terms but carry survival risk. Solo mining eliminates pool fees entirely but turns block discovery into a lottery unless you control significant hashrate.
For most miners, the math points toward Foundry, AntPool, or F2Pool. Those three have survived multiple cycles, maintain consistent uptime, and offer the infrastructure needed to handle large hashrate migrations. The smaller pools may offer lower fees, but they have not yet proven they can weather the same conditions that forced Binance and SBI to exit.
That is how concentration accelerates. Each pool closure pushes more miners toward the largest remaining operators, not because those operators are superior, but because they are the only options left with demonstrated longevity.
## What This Means for Mining Returns
Pool consolidation affects miner profitability in two ways. First, it reduces fee competition. When three pools control 64% of hashrate, they have less incentive to undercut each other on pricing. Miners can switch pools, but their choices are limited.
Second, it increases operational risk. If one of the three dominant pools experiences downtime, goes offline, or faces regulatory action, a significant portion of Bitcoin's network hashrate goes dark with it. That has happened before, and it will happen again.
The income angle here is straightforward. If you are mining Bitcoin in October 2026, your returns depend on hashprice, difficulty, electricity cost, and pool fees. Pool fees are rising as competition declines. [Profitability](https://altcoininvestor.com/is-bitcoin-mining-still-profitable/) is improving because of favorable hashprice and difficulty, but the fee environment is moving against you.
Miners who locked in favorable pool terms before the Binance and SBI exits are better positioned than those negotiating now. Miners who waited are facing a market where the dominant pools have more leverage and fewer competitors.
## The Takeaway
Binance Pool's closure is not a crisis, but it is a signal. When the world's largest exchange exits Bitcoin mining infrastructure during a recovery month, it tells you that running a pool is harder than it looks. The miners leaving Binance have four weeks to choose among three pools that already control nearly two-thirds of the network. That choice will determine their fee structure, payout reliability, and operational risk for the next cycle. The window is closing faster than the hashrate is recovering.
## Frequently Asked Questions
### Why is Binance shutting down its Bitcoin mining pool?
Binance has not disclosed a specific reason, but the pool's hashrate fell 65% since December, dropping to less than 1% of Bitcoin's network. That level of attrition makes pool operations economically unviable. The closure follows a similar exit by SBI Crypto in July, suggesting that running a competitive mining pool is becoming harder even for large operators.
### How much time do miners have to migrate from Binance Pool?
Miners have until November 10, which is approximately four weeks from the announcement. This timeline requires miners to evaluate fee structures, payout models, and uptime records across remaining pools, then reconfigure hardware before the deadline. Larger operations running thousands of machines face a tighter operational window.
### Which mining pools are absorbing Binance's hashrate?
Foundry USA, AntPool, and F2Pool already control about 64% of Bitcoin's network hashrate and are the most likely destinations. These three pools offer proven infrastructure, consistent uptime, and the capacity to handle large migrations. Smaller pools like Braiins and ViaBTC remain options but carry higher survival risk.
### Does pool consolidation affect Bitcoin mining profitability?
Yes. Consolidation reduces fee competition, allowing dominant pools to maintain higher fees without losing miners. It also increases operational risk, since downtime or regulatory action against one of the three largest pools would affect a significant portion of the network. Miners joining now face less favorable terms than those who locked in agreements before recent pool exits.
### Is solo mining a viable alternative to joining a large pool?
Solo mining is only economically viable above roughly 9.5 exahashes per second. Below that threshold, block discovery becomes a lottery with extreme variance. Most miners displaced by Binance Pool's closure operate below that level and will need to join another pool rather than mine independently.
The Weekly Yield Report
You just reviewed the four-week migration window and the three pools absorbing 64% of Bitcoin's hashrate. Those concentration figures will shift again before year-end.
Every Thursday: where crypto yield actually is - stablecoins, liquid staking and DeFi lending, with the risk named next to the rate and what changed since last week.
[Get it free every Thursday](#/portal/signup)
Free. No trade calls, no allocations, no hype. Unsubscribe in one click.
### What Airdrop Farming Actually Costs: Gas, Time, And Opportunity
URL: https://altcoininvestor.com/how-much-does-airdrop-farming-cost/
Last updated: 2026-10-15T02:09:45.000Z
## The Question: What Does It Cost To Farm Airdrops
The promotional material for crypto airdrops presents them as free tokens distributed to early users. The question worth answering is what those tokens actually cost to receive.
Airdrop farming requires months of on-chain activity across multiple protocols. Each transaction consumes gas. Each bridge between chains incurs fees. Each protocol interaction requires minimum capital deployment, which sits locked in positions earning zero or negative returns while you wait for a distribution that may never arrive. The all-in cost includes transaction fees, bridging costs, minimum deposits, opportunity cost on idle capital, and time spent managing wallet activity across chains.
Most airdrop content treats farming as free money with minor gas expenses. That framing ignores the denominator. One widely-shared beginner case study reports spending $60 in gas over two months, then receiving $35 worth of tokens at distribution. The return was negative 42%. That outcome is common, not exceptional.
This breakdown calculates the real cost of qualifying for airdrops across Ethereum, Layer 2 networks, and Solana. It compares historical payout data against total capital and time invested to show what airdrop farming actually returns after accounting for every cost most guides ignore.
## The Historical Frame: When The Return Is Lower Than The Cost

European sovereign debt markets spent 2011 through 2013 discovering that high advertised yields often reflect the probability of non-payment, not actual return. Greek 10-year bonds offered yields above 30% in early 2012 because markets priced in the likelihood that bondholders would receive neither principal nor coupon in full. When the restructuring arrived in March 2012, private bondholders accepted a 53.5% haircut on face value. The yield was an illusion. What looked like income was actually a quoted price for taking on default risk that eventually materialized.
Airdrop farming operates under similar opacity. Protocols advertise eligibility criteria but almost never publish distribution probability or expected payout ranges. You spend capital and gas for months without knowing whether the protocol will distribute tokens, what the allocation formula will reward, or what the tokens will be worth at launch. Pantera Capital invested in 85 crypto projects between 2013 and 2023\. Only four of those projects conducted airdrops after going public. The probability of receiving a distribution, even from venture-backed protocols, sits near 5%.
The parallel matters because both cases involve deploying capital with no guaranteed return and incomplete information about the distribution mechanism. In sovereign debt markets, bond investors at least receive a term sheet stating coupon rate, maturity, and legal recourse. Airdrop farmers receive vague criteria like "use the protocol frequently" and "demonstrate organic activity." The lack of clarity makes cost accounting essential. If you cannot measure what you are spending, you cannot know whether the activity produces positive returns.
## The Mechanism: What You Actually Pay To Farm Airdrops

Airdrop farming costs break into five categories: gas fees, bridge fees, minimum capital deployment, opportunity cost, and time. Each category scales differently depending on which chain you farm and how many protocols you target.
### Gas Fees By Chain
Ethereum mainnet currently charges $0.25 to $0.39 for token swaps. A simple transfer costs $0.01 to $0.10\. Those numbers reflect October 2026 conditions, with mainnet block utilization between 25% and 35% due to Layer 2 migration. During the 2021 bull market, the same swap cost $15 to $30\. Gas is variable, not fixed.
Arbitrum charges $0.01 to $0.05 for swaps and $0.005 to $0.008 for transfers. Base charges $0.003 to $0.03 for swaps and $0.001 to $0.01 for transfers. Optimism sits between the two, with swaps costing $0.02 to $0.05\. Solana transactions cost $0.00025 regardless of operation type.
If you execute 10 transactions per week over six months, you complete roughly 260 transactions. On Ethereum mainnet at $0.30 per transaction, total gas reaches $78\. On Arbitrum at $0.03 per transaction, total gas reaches $7.80\. On Solana at $0.00025 per transaction, total gas reaches $0.065\. Chain selection determines whether gas consumes 1% or 50% of your expected return.
Most farmers target multiple chains simultaneously to diversify airdrop exposure. A moderate strategy might involve activity on Ethereum mainnet, two Layer 2 networks, and Solana. Assuming equal transaction counts across four chains, total gas over six months runs between $20 and $120 depending on which Layer 2 networks you select and how aggressively you interact on mainnet.
### Bridge Fees And Lock-In Periods
Moving capital between chains incurs two costs: the bridge fee and the source-chain gas fee. Native rollup bridges for Arbitrum, Optimism, and Base charge no explicit bridge fee. You pay only Ethereum gas to send ETH from mainnet to the Layer 2\. At current gas prices, that costs $2 to $10 per bridge depending on network congestion.
Bridging between two Layer 2 networks costs less than bridging from mainnet. An Arbitrum-to-Base bridge typically costs under $0.50 in total fees. Bridging back from a Layer 2 to Ethereum mainnet requires a seven-day challenge period for optimistic rollups. Your capital sits locked for seven days after you initiate the withdrawal. That delay prevents rapid rotation between chains and creates a harvest timing problem: you must choose between locking capital for a week or leaving it on the Layer 2 until you can afford the time cost of withdrawal.
A typical six-month farming cycle involves one bridge inbound per chain and one bridge outbound at the end. For four chains, total bridge fees run $10 to $40 depending on routing. That number excludes the opportunity cost of locked capital during withdrawal periods.
### Minimum Capital Deployment
Airdrop eligibility criteria almost always include transaction volume thresholds. Protocols reward users who swap meaningful amounts, provide liquidity above minimum sizes, or lend capital in amounts large enough to signal genuine use. Small transactions trigger Sybil filters.
On Ethereum mainnet, gas costs make positions below $1,000 uneconomical. On Layer 2 networks, $100 to $500 provides enough flexibility for meaningful DeFi interactions without excessive capital drag. On Solana, $50 to $500 works due to near-zero gas fees. Base can operate with as little as $50 in ETH, though $150 to $300 improves eligibility signal strength.
Capital deployed to farming sits idle or exposed to market risk. If you provide liquidity, you face impermanent loss. If you lend on money markets, you earn whatever the protocol pays, which may be below market rates on other venues. If you simply hold tokens in a wallet to show activity, you earn zero. The [opportunity cost of that capital](https://altcoininvestor.com/defi-yield-opportunity-cost-rate-difference/) compounds over the farming period.
A conservative farmer deploys $100 per chain across four chains for $400 total. A moderate farmer deploys $500 per chain for $2,000 total. An aggressive farmer deploys $1,000 or more per chain. The capital is not lost, but it is locked in low-return or zero-return positions for the duration of the farming cycle.
### Opportunity Cost
Capital deployed to airdrop farming could instead sit in a stablecoin yield position earning 4% to 8% annually, or in liquid staking earning 3% to 4%. Over six months at 6% annualized yield, $2,000 in capital would earn $60\. That $60 is foregone income. Over 12 months, foregone income reaches $120.
The opportunity cost calculation depends on what you would have done with the capital if you were not farming. If you would have held it in a zero-yield wallet anyway, the opportunity cost is zero. If you would have deployed it to [yield farming](https://altcoininvestor.com/yield-farming-explained-beginner/) or staking, the cost is real and measurable.
### Time Investment
Airdrop farming requires research, wallet management, transaction execution, and monitoring. A conservative farmer spends two hours per week. A moderate farmer spends five hours per week. An aggressive farmer spends 10 or more hours per week tracking new campaigns, managing Sybil-resistant activity patterns, and optimizing transaction timing.
Over six months, time investment ranges from 50 to 260 hours. If you value your time at $25 per hour, the time cost ranges from $1,250 to $6,500\. Most farmers do not account for time cost in ROI calculations, which is why airdrop farming often appears profitable in spreadsheets but feels unrewarding in practice.
## What Historical Airdrops Actually Paid
Uniswap distributed 400 UNI to every qualifying wallet in September 2020\. At launch, the allocation was worth approximately $1,200\. At the peak of the 2021 bull market, the same allocation was worth close to $17,000\. Qualification required a single transaction: one successful swap on Uniswap before September 1, 2020\. The cost to qualify was one transaction fee on Ethereum, which ranged from $1 to $20 depending on when the user swapped.
Arbitrum distributed over 1 billion ARB tokens to 625,000 wallets in March 2023\. Typical allocations ranged from $1,000 to $3,000 depending on activity depth and duration. The protocol used a points system that rewarded users who had interacted with Arbitrum for two months, six months, or nine months, with longer activity periods earning higher allocations. Qualification cost varied by user, but a typical farmer spent $50 to $200 in gas over six to nine months.
Hyperliquid distributed 31% of total HYPE supply to approximately 94,000 users in November 2024\. The total distribution was valued at over $1 billion on day one, with average allocations worth tens of thousands of dollars. Qualification required sustained trading activity on the Hyperliquid DEX over multiple months. The cost to qualify included gas on the native chain plus opportunity cost on capital deployed to trading positions.
Those three cases represent the upper end of airdrop outcomes. The majority of airdrops distribute tokens worth less than $100 per wallet, and many distribute tokens that lose 70% to 90% of their value within the first month. The win rate is low. The payout distribution is heavily skewed. A small number of campaigns produce outsized returns, and the rest produce losses or negligible gains.
## What Could Break The Return
The most common failure mode is Sybil detection. Protocols use clustering algorithms to identify wallets funded from the same source, wallets with identical transaction timing, wallets with matching interaction patterns, or wallets controlled from the same IP address. Arbitrum disqualified 427,923 addresses in its March 2023 distribution. Optimism disqualified 17,000 addresses for IP clustering. When you are flagged, you lose the allocation and all gas fees already paid.
The second failure mode is token price collapse. Many protocols distribute tokens at valuations that cannot be sustained once selling pressure begins. If the token loses 80% of its value in the first week, an allocation worth $2,000 at launch becomes worth $400 by the time you sell. The cost to farm may exceed the liquidation value.
The third failure mode is no distribution. Protocols change roadmap priorities, regulatory environments shift, or teams decide against token launches. You spend six months farming a protocol that never distributes anything. The gas is gone. The opportunity cost is real. The return is zero.
The fourth failure mode is negative ROI from expenses. Gas fees, bridge costs, and opportunity cost sum to more than the airdrop value. A $60 gas bill for a $35 airdrop is a net loss. That outcome is common for campaigns with low per-wallet allocations or for farmers operating on high-fee chains without proper cost discipline.
## Comparing Costs Across Chain Environments
The table below shows typical six-month costs for a moderate farming strategy targeting four protocols across different chain combinations.
| Chain | Tx Cost (per swap) | Bridge Cost (one-time) | Min. Capital | 6-Month Gas Budget | Best For |
| ---------------- | ------------------ | ---------------------------- | ------------ | ------------------ | --------------------------------------- |
| Ethereum Mainnet | $0.25 - $0.39 | N/A (native) | $1,000+ | $60 - $100 | High-value protocols only |
| Arbitrum | $0.01 - $0.05 | $2 - $10 | $100 - $500 | $10 - $30 | Balanced cost and ecosystem depth |
| Base | $0.003 - $0.03 | $1 - $5 | $50 - $300 | $5 - $20 | Low-cost, growing ecosystem |
| Optimism | $0.02 - $0.05 | $2 - $10 | $100 - $500 | $15 - $35 | Established Layer 2 with prior airdrops |
| Solana | $0.00025 | $1 - $3 (cross-chain bridge) | $50 - $500 | $1 - $5 | High-frequency, low-cost farming |
Solana dominates on gas efficiency. You can execute 10,000 transactions for $2.50\. That efficiency makes high-frequency farming viable. Arbitrum and Base offer the best balance between cost and ecosystem maturity. Ethereum mainnet is uneconomical for airdrop farming unless the target protocol justifies the gas expense through credible signals of high-value distribution.
## Expected ROI By Farmer Profile
A conservative farmer deploys $100 per chain across four chains, spends $50 to $100 in gas and bridge fees over six months, and invests two hours per week. Total capital at risk: $400\. Total costs: $150 to $200\. Expected return range: $0 to $500\. The probability-weighted return after accounting for Sybil risk, no-distribution risk, and token price volatility is often negative or low single-digit positive.
A moderate farmer deploys $500 per chain, spends $200 to $400 in gas and fees, and invests five hours per week. Total capital at risk: $2,000\. Total costs: $700 to $900\. Expected return range: $500 to $3,000\. The median outcome is break-even or small profit. The right-tail outcome, conditional on hitting one high-value airdrop, is $3,000 to $10,000.
An aggressive farmer deploys $1,000 or more per chain, spends $500 to $1,000 in gas and fees, and invests 10+ hours per week. Total capital at risk: $4,000 or more. Total costs: $2,500 to $3,000\. Expected return range: $3,000 to $15,000+. The strategy depends entirely on hitting at least one top-tier airdrop. If none of the farmed protocols distribute high-value tokens, the return is deeply negative after accounting for time cost.
The effective hourly rate, calculated as (total return minus total costs) divided by hours invested, ranges from $0 to $10 per hour for conservative farmers, $5 to $25 per hour for moderate farmers, and $10 to $50+ per hour for aggressive farmers who hit a high-value distribution. Those ranges assume at least one successful airdrop. If no airdrop materializes, the effective hourly rate is negative across all profiles.
## When Airdrop Farming Makes Sense
Airdrop farming produces positive returns when you minimize gas costs by operating on low-fee chains, when you deploy capital that would otherwise sit idle, when you value your time at zero or near-zero, and when you hit at least one campaign that distributes tokens worth more than your cumulative costs.
It makes the most sense on Solana, where gas costs are negligible, or on Base and Arbitrum, where fees are low enough that small allocations still exceed expenses. It makes the least sense on Ethereum mainnet, where gas alone can consume the entire value of a small airdrop.
The strategy works best when you treat it as a side activity to other crypto income mechanisms. If you are already providing liquidity, staking, or trading on a protocol, farming its potential airdrop adds minimal incremental cost. If you are setting up [wallet infrastructure](https://altcoininvestor.com/how-to-structure-wallets-for-airdrop-farming/) solely to farm, the cost baseline rises substantially.
The capital allocation question is whether the probability-weighted expected return exceeds what you could earn deploying the same capital to stablecoin yield, liquid staking, or other [passive income strategies](https://altcoininvestor.com/crypto-staking-returns-across-chains/). For most farmers, the answer is no. For farmers with deep knowledge of which protocols are likely to distribute high-value tokens, or for farmers with near-zero time cost and access to low-fee chains, the answer may be yes.
## What The Costs Mean For Capital Allocation
Airdrop farming is not free money. It is a speculative capital allocation with known costs and unknown returns. The all-in cost over six months ranges from $150 for a conservative approach focused on low-fee chains to $3,000 or more for an aggressive multi-chain strategy. Most campaigns return less than the median cost to qualify once you include gas, bridges, opportunity cost, and time.
The strategy makes sense only when you operate on chains where gas fees are low enough that small allocations still produce positive net returns, when you deploy capital that has no better use, or when you possess information advantages that let you identify high-probability, high-value distributions before the market does. For most participants, the denominator exceeds the numerator. The tokens are not free. You paid for them in gas, time, and foregone yield. Whether you paid less than they are worth is the question that determines whether [airdrop farming](https://altcoininvestor.com/how-to-earn-crypto-airdrops/) produces income or losses.
## The Takeaway
The real cost of airdrop farming includes gas fees, bridge costs, minimum capital deployment, opportunity cost on idle capital, and time. Across six months, those costs range from $150 to $3,000 depending on chain selection and activity intensity. Historical data shows that most airdrops distribute tokens worth less than $100 per wallet, and many farmers spend more in gas than they receive in token value. The strategy produces positive returns only when you minimize transaction costs by farming on low-fee chains, when you hit at least one high-value distribution, and when you account for the opportunity cost of capital that could be earning yield elsewhere. The question that matters is not whether you qualified for the airdrop. It is whether the tokens you received are worth more than everything you spent to get them.
## Frequently Asked Questions
### How much does it cost to farm airdrops for six months?
Total cost ranges from $150 to $3,000 depending on which chains you use and how many protocols you target. A conservative strategy on low-fee chains like Solana or Base costs $150 to $200 including gas, bridge fees, and minimum capital deployment. An aggressive multi-chain strategy on Ethereum and multiple Layer 2 networks costs $2,500 to $3,000\. Those figures exclude opportunity cost on capital and time investment.
### Which blockchain has the lowest airdrop farming costs?
Solana has the lowest transaction costs at $0.00025 per transaction regardless of operation type. Over six months of active farming with 260 transactions, total gas on Solana runs under $1\. Base and Arbitrum offer the next-lowest costs, with typical six-month gas budgets between $5 and $30\. Ethereum mainnet costs $60 to $100 or more in gas over the same period, making it uneconomical for most airdrop farming.
### What is the average airdrop payout compared to farming costs?
Most airdrops distribute tokens worth less than $100 per wallet. High-value outliers like Uniswap ($1,200 at launch), Arbitrum ($1,000 to $3,000), and Hyperliquid (tens of thousands on average) represent fewer than 5% of all distributions. A beginner case study reported spending $60 in gas over two months and receiving $35 in tokens, a 42% loss. Positive ROI requires hitting at least one high-value airdrop or operating exclusively on low-cost chains.
### How much capital do I need to start airdrop farming?
Minimum capital depends on which chain you farm. Solana and Base work with $50 to $300\. Arbitrum and Optimism require $100 to $500 for meaningful protocol interactions. Ethereum mainnet requires $1,000 or more due to high gas costs. A moderate multi-chain strategy across four chains requires $500 to $2,000 in total deployment. That capital is not lost but sits locked in low-yield or zero-yield positions during the farming period.
### Is airdrop farming worth it after accounting for all costs?
For most participants, no. After including gas, bridge fees, opportunity cost, and time, the median airdrop farmer earns less than they spend. The strategy produces positive returns only when you farm exclusively on low-fee chains, deploy capital with no better use, value your time at zero, and hit at least one high-value distribution. Effective hourly rates range from negative to $50+ per hour depending on outcomes, but the probability-weighted expectation is often below minimum wage.
The Weekly Yield Report
You have just seen six-month farming costs ranging from $150 to $3,000 across five chains, with ROI that depends entirely on which protocols actually distribute tokens. Those numbers shift every quarter as new campaigns launch and gas prices move.
Every Thursday: where crypto yield actually is - stablecoins, liquid staking and DeFi lending, with the risk named next to the rate and what changed since last week.
[Get it free every Thursday](#/portal/signup)
Free. No trade calls, no allocations, no hype. Unsubscribe in one click.
### How To Earn Crypto: Staking, Lending, Liquidity, And Airdrops
URL: https://altcoininvestor.com/how-to-earn-crypto/
Last updated: 2026-10-15T00:05:12.000Z
## Validator Staking: Lock Capital, Earn Protocol Rewards

Validator staking pays you to help secure a proof-of-stake blockchain. You lock tokens, run a validator node (or delegate to someone who does), and earn inflation rewards plus transaction fees. APY ranges from 3.5% to 20% depending on the network. Capital requirements vary from zero (delegation) to $80,000+ (solo Ethereum validation).
Ethereum delivers 3.5-4.2% APY as of January 2026\. Solo staking requires 32 ETH (roughly $80,000 to $100,000 at current prices). You need hardware: 64 GB RAM, 4 TB NVMe SSD, and 100 Mbps sustained bandwidth. Uptime matters. If your validator is offline more than 25% of an epoch, you face slashing penalties that reduce your stake.
Unbonding periods lock your capital for days or weeks. Ethereum takes 9 to 50 days. Polkadot takes 28 days. Cosmos takes 21 days. Solana takes 2 to 3 days. During unbonding, you earn nothing and cannot sell.
Liquid staking removes the capital and hardware barriers. Platforms like Lido, Rocket Pool, Ether.fi, and Swell accept any deposit size and give you a receipt token (stETH, rETH, etc.) that tracks your staked position. You earn approximately 3-5% APY, slightly lower than solo staking due to protocol fees. The receipt token is tradable, so you skip the unbonding period. You can sell stETH on Uniswap or Curve anytime.
Real yield matters more than nominal APY. Networks pay staking rewards in newly minted tokens. If annual inflation is 8% and staking APY is 10%, your real return is roughly 2%. Cosmos ATOM advertises 12-20% APY, but network inflation runs high. Ethereum's 3.5% APY comes with minimal inflation because the network burns transaction fees. Real yield is closer to nominal yield.
Failure modes: slashing (solo validators only), smart contract exploits (liquid staking platforms), and unbonding lockups during market crashes. If you need liquidity fast, unbonding periods trap capital. Liquid staking introduces protocol dependency. Lido is audited and battle-tested, but any smart contract can fail.
Time commitment: solo staking requires 4-8 hours of setup and roughly one check-in per month. Liquid staking takes 5 minutes and requires no maintenance. This is the most passive earning method on this list.
For a detailed walkthrough of your first staking position, see [How To Start Staking Crypto: A Beginner's Complete Guide](https://altcoininvestor.com/how-to-start-staking-crypto-beginner/).
## DeFi Lending: Supply Stablecoins, Earn Utilization Interest
DeFi lending protocols pay you to supply tokens that other users borrow. You deposit USDC, USDT, or ETH into a pool. Borrowers post collateral (usually 150-200% of the loan value) and pay interest. That interest flows to lenders. APY depends on utilization rates. High demand for borrowing means high APY. Low demand collapses yields.
Aave is the largest DeFi lending protocol with $18.554 billion in TVL. As of October 2026, USDC deposits earn approximately 2.61% APY. USDT earns 2.89%. These are variable rates. They change daily based on how much of the pool is borrowed. In August 2026, Aave v3 paid 3.29% on USDC. By October, utilization dropped and so did the rate.
Sky (formerly MakerDAO) offers the Sky Savings Rate at 3.60% APY as of September 2026\. This is a fixed rate backed by the protocol's treasury, which holds US Treasury bonds and other real-world assets. The yield comes from off-chain collateral, not on-chain borrowing demand. Sky's mechanism is structurally different from Aave. Aave yield depends on utilization. Sky yield depends on treasury management and RWA returns.
Morpho and SparkLend are newer lending platforms with $11.27 billion and $5.245 billion TVL respectively. Morpho uses isolated lending pools, which means each market has its own risk profile. Rates vary by pool. SparkLend is a fork of Aave optimized for DAI and other MakerDAO assets.
CeFi platforms like Nexo, Ledn, and Crypto.com advertise 8-14% APY on stablecoins. These are custodial services. You send your tokens to the platform, and they lend or deploy your capital. You do not control the private keys. Celsius, BlockFi, Voyager, and Gemini Earn all failed during 2022\. CeFi yields above 5% carry explicit custody risk. The higher the rate, the more leverage or unsecured lending the platform is using to generate returns.
DeFi yields have collapsed below traditional finance. Aave's 2.61% on USDC is worse than Interactive Brokers' 3.14% savings rate. Organic on-chain demand for leverage has dried up. Most competitive DeFi rates now depend on RWA backing (US Treasuries, tokenized bonds) rather than crypto-native borrowing. The 2021 playbook of earning 10-15% APY on stablecoins no longer works in 2026 unless you accept custody risk or exposure to unaudited protocols.
Failure modes: smart contract exploits, utilization collapse, and CeFi insolvency. Aave and Morpho are audited and have survived multiple market cycles, but smart contract risk never goes to zero. Utilization-based rates can drop to sub-1% APY overnight if borrowing demand disappears. CeFi platforms fail when their off-chain lending books go bad. You have no recourse.
Time commitment: 5 minutes to deposit, weekly check-ins to monitor rates. If you are chasing the highest APY, you will need to move capital between protocols every few weeks as rates shift. Gas costs on Ethereum can eat into returns for small positions. A $5 deposit transaction plus a $5 withdrawal costs $10\. That is a week or more of yield on a $1,000 position at 2.6% APY.
For a deeper breakdown of how variable rates work and what drives utilization, see [How To Earn With Crypto Lending Protocols](https://altcoininvestor.com/how-to-earn-crypto-lending/).
## Liquidity Pool Fees: Provide Trading Pairs, Earn Swap Volume
Liquidity pools pay you to provide both sides of a trading pair on a DEX. You deposit equal dollar values of two tokens (ETH/USDC, for example). Traders swap against your liquidity and pay a fee (typically 0.05% to 1% per trade). You earn a proportional share of all fees based on your percentage of the pool.
Uniswap v3 is the largest DEX by volume, processing over $1.2 trillion in annual trading with $3.8 billion TVL as of August 2025\. V3 uses concentrated liquidity. You choose a price range. Your liquidity only earns fees when the trading price is inside your range. If the price moves outside your range, you stop earning fees and face amplified impermanent loss.
Fee tiers vary by pool. Uniswap v3 offers 0.05%, 0.30%, and 1% tiers. Stablecoin pairs (USDC/USDT, DAI/USDC) use the 0.05% tier because price volatility is minimal. Volatile pairs (ETH/USDC, WBTC/ETH) use 0.30% or 1% tiers to compensate LPs for impermanent loss risk.
APY depends entirely on trading volume. Stablecoin pools on Curve and Uniswap earn 3-10% APY from fees plus liquidity mining rewards. Volatile pairs can earn 5-20% or more during high-volume periods, but APY fluctuates daily. A pool that earns 15% one week might earn 3% the next if volume drops.
Impermanent loss is the LP-specific risk. If one token in your pair doubles in price, you lose roughly 5-6% compared to holding both tokens separately. A 4x price change creates a 20% loss. Stablecoin pairs have minimal IL because both tokens stay near $1\. Volatile pairs require fee income to exceed IL. If fees do not outpace price divergence, you lose money.
Uniswap v3 concentrated liquidity improves capital efficiency up to 4000x compared to v2, but it requires active management. If ETH/USDC is trading at $2,500 and you set a range of $2,400 to $2,600, you earn maximum fees while the price stays in that band. If ETH drops to $2,300, your position stops earning. You must manually rebalance your range or accept zero fee income until price returns.
Uniswap v2 and other constant-product AMMs spread liquidity across the entire price curve. You always earn fees, but your capital efficiency is lower. Most LPs on v2 earn 3-5% APY without active management. V3 LPs can earn 10-50x more, but only if they actively manage their ranges.
Gas costs matter. Rebalancing a Uniswap v3 position on Ethereum mainnet costs $10 to $50 depending on network congestion. If you rebalance weekly on a $1,000 position, gas can consume most of your fee income. Layer 2s like Arbitrum, Optimism, and Base reduce gas to under $1 per transaction, making active v3 LP feasible for smaller positions.
Failure modes: impermanent loss exceeding fee income, price moving out of range on v3, and smart contract exploits. IL is not a bug. It is the structural cost of providing liquidity to volatile pairs. If you provide ETH/USDC liquidity and ETH drops 50%, you will have more ETH and less USDC than you started with. Fees rarely compensate for large directional moves.
Time commitment: 15 minutes to set up a v2 position, then weekly check-ins. V3 requires 30-60 minutes of setup and daily monitoring if you want to maximize fees. Passive v3 LPs who set wide ranges earn less than active LPs who tighten ranges and rebalance frequently.
For a detailed walkthrough of concentrated liquidity mechanics and range selection, see [How To Provide Liquidity And Earn DEX Fees Safely](https://altcoininvestor.com/how-to-provide-liquidity-dex/).
## Airdrop Farming: Interact With Protocols, Qualify For Retroactive Tokens
Airdrop farming pays you to use unannounced protocols before they launch tokens. You bridge funds, swap tokens, provide liquidity, vote in governance, and mint NFTs. Six to twelve months later, the protocol announces a token and distributes it to early users based on on-chain activity. If you qualified, you receive tokens. If you did not, you spent gas for nothing.
There is no guaranteed return. Airdrops are retroactive and discretionary. The protocol team decides eligibility criteria after observing on-chain behavior. Most filter out Sybil farmers (users running multiple wallets with identical activity patterns). Wash trading, bot-like timing, and shared IP addresses trigger exclusion.
Capital requirements start at $50 to $100, though $500 gives more flexibility to interact across multiple protocols. You need enough to cover gas, transaction fees, and minimum liquidity thresholds. Solana, Base, Arbitrum, and Optimism have gas costs under $1 per transaction. Ethereum mainnet can cost $5 to $50 per transaction depending on congestion.
Most successful airdrop farmers focus on 2-3 ecosystems and use 5-10 major applications within each. Projects notice dense on-chain footprints. A user who bridges $500 to Arbitrum, swaps on three DEXs, provides liquidity on Curve, mints an NFT, and votes in a DAO proposal is more likely to qualify than a user who makes one swap and disappears.
Points programs are now the dominant airdrop meta. Protocols like Blast, Ethena, and various DEXs use points to track activity before token launch. You earn points by depositing, trading, or referring others. Points do not guarantee tokens, but they signal likely eligibility. Twenty-plus DEXs currently run active point systems as of 2026.
Expected ROI is highly variable. Public data shows major airdrops (Uniswap, Arbitrum, Optimism) distributed $500 to $5,000+ per qualified account. Smaller airdrops pay $50 to $500\. Time spent farming must be accounted for. If you spend 10 hours per month for 6 months and receive a $1,200 airdrop, you earned $20 per hour. If you receive nothing, you earned zero.
Top opportunity chains in 2026: Solana (ecosystem growth and high transaction volume), Base (Coinbase backing and growing DeFi ecosystem), Arbitrum and Optimism (established L2 leaders with ongoing incentive programs), and emerging chains like Monad and Berachain (unannounced tokens with active testnets and developer activity).
Failure modes: Sybil detection, time wasted on protocols that never launch tokens, and gas costs exceeding airdrop value. Anti-farming resistance is now the norm. Projects use on-chain analytics to filter wallets with identical deposit amounts, simultaneous transactions, and bot-like swap patterns. Running 10 wallets with the same $100 deposit on the same day is a red flag. Genuine users vary deposit size, timing, and activity mix.
Time commitment: 6-12 months of consistent activity. Not passive. You must monitor new protocols, track point systems, and adjust strategy as teams announce eligibility criteria. Most farmers spend 5-10 hours per month researching and executing transactions.
For a detailed guide on legitimate farming patterns and avoiding Sybil flags, see [How To Earn Crypto Airdrops (Without Getting Scammed)](https://altcoininvestor.com/how-to-earn-crypto-airdrops/).
## Comparison: Capital, Time, APY, And Risk
Each method has different capital barriers, time requirements, and risk profiles. Solo Ethereum staking requires $80,000+ and 4-8 hours of hardware setup. Liquid staking reduces the barrier to $1 and 5 minutes. DeFi lending requires $10+ and 5 minutes to deposit, but yields have collapsed to 2.6-3.6% on major protocols. LP fees require $50+ on L2s or $500+ on Ethereum mainnet to make gas costs worthwhile, and v3 requires daily monitoring to maximize returns. Airdrop farming requires $50-$500 and 6-12 months of active participation with no guaranteed return.
Realistic APY ranges: Ethereum staking 3.5-4%, Solana 5-8%, Cosmos 12-20%. DeFi lending 2.6-8% depending on protocol and utilization. LP fees 3-10% on stablecoin pairs, 5-20%+ on volatile pairs if you manage ranges actively. Airdrops have no APY because they are non-recurring. You farm once, receive tokens, then move to the next opportunity.
Time commitment separates passive from active strategies. Staking (solo or liquid) is set-and-forget after initial setup. Lending requires weekly rate checks but no active management. LP fees on v2 require weekly check-ins. V3 requires daily monitoring and rebalancing. Airdrop farming requires consistent weekly or monthly activity over 6-12 months.
Risk profiles differ by mechanism. Staking risks: slashing (solo only), unbonding lockups, and smart contract failure (liquid staking). Lending risks: smart contract exploits, utilization collapse, and CeFi insolvency. LP risks: impermanent loss, out-of-range positions on v3, and smart contract exploits. Airdrop risks: Sybil exclusion, wasted time, and gas costs exceeding payout.
Gas costs matter for small positions. Ethereum mainnet transactions cost $5 to $50\. Depositing $100 into Aave and withdrawing two weeks later costs $10 to $100 in gas. Your net yield is negative. Layer 2s (Arbitrum, Optimism, Base) reduce gas to under $1, making small positions viable. Solana gas is under $0.01 per transaction. If you have less than $1,000 to deploy, use L2s or Solana to avoid gas eating your returns.
Lock periods affect liquidity. Ethereum staking locks capital for 9-50 days during unbonding. Liquid staking removes the lock. DeFi lending has no lock, but utilization spikes can delay withdrawals by hours or days if the pool is fully borrowed. LP positions have no lock, but selling during low liquidity costs slippage. Airdrop farming locks capital for 6-12 months in the sense that you must leave funds on-chain to maintain eligibility.
For a detailed comparison of staking versus lending yield profiles and when to use each, see [Staking vs Lending: Where To Earn Yield On Crypto](https://altcoininvestor.com/staking-vs-lending-crypto-2/).
## What To Choose Based On Your Capital And Time
If you have $80,000+ and technical comfort, solo Ethereum staking delivers 3.5-4% APY with full control. You run your own validator, earn maximum yield, and avoid protocol fees. If you have $1 to $10,000, liquid staking delivers the same yield with zero setup time and no hardware. Lido and Rocket Pool are audited and battle-tested.
If you want stablecoin yield and have $100+, DeFi lending on Aave or Sky delivers 2.6-3.6% APY with minimal time commitment. Deposit, check rates weekly, and withdraw when you need liquidity. Gas costs on Ethereum mainnet make this viable only for positions above $1,000\. For smaller amounts, use Aave on Arbitrum or Optimism.
If you can monitor positions daily and have $500+, Uniswap v3 LP fees on stablecoin pairs deliver 5-10% APY with minimal impermanent loss. Volatile pairs deliver 10-20%+ APY but require tight risk management. Set stop-loss thresholds based on IL tolerance. If ETH moves 25% against your range, fees rarely compensate. Exit and rebalance.
If you have $50-$500 and 6-12 months to commit, airdrop farming offers the highest potential return per dollar deployed. Focus on 2-3 ecosystems with strong developer activity and venture backing. Use major applications (top 3 DEXs, leading lending protocols, popular NFT platforms) to build a dense on-chain footprint. Avoid Sybil patterns. Vary deposit sizes, transaction timing, and activity mix across wallets.
For users with under $500 total capital, combine liquid staking with airdrop farming. Stake 50-70% of your capital in stETH or similar to earn 3-5% APY passively. Deploy 30-50% into airdrop farming on low-gas chains (Solana, Base, Arbitrum). The staking position provides steady income. The farming position provides lottery-ticket upside. If airdrops pay out, reallocate winnings into staking or LP positions.
For users with $5,000+, stack yield. Stake ETH via Lido to receive stETH. Deposit stETH into Aave as collateral. Borrow USDC at 5.4% APY. Deposit borrowed USDC into Sky Savings Rate at 3.6% APY. Net cost: 1.8% APY on the borrowed amount. You still earn 3-5% on your stETH collateral. Effective yield: 3-5% on staked ETH minus 1.8% on borrowed USDC. This works only if you maintain a safe collateralization ratio (above 200%) to avoid liquidation. If ETH drops 40%, you get liquidated and lose the collateral.
Do not chase APY without decomposing the mechanism. A protocol offering 15% APY on stablecoins in 2026 is either paying unsustainable token emissions, using high-risk leverage, or operating as a Ponzi. Aave's 2.6% is boring but real. A random fork offering 15% is almost certainly subsidized by emissions that dilute the reward token faster than you earn it. Check the emission schedule. If the protocol mints 10% of total supply per month to pay rewards, your real return is negative after dilution.
## Monitoring Positions And Exit Conditions
Set specific exit conditions before deploying capital. For staking: exit if validator uptime drops below 95% or if unbonding periods extend beyond your liquidity needs. For liquid staking: exit if the receipt token (stETH, rETH) depegs more than 2% from the underlying asset. A 5% depeg during market stress signals protocol risk or liquidity crisis.
For lending: exit if utilization drops below 50% for more than two weeks. Low utilization means borrowing demand has collapsed and APY will stay low. For stablecoins, exit if the protocol's TVL drops 30%+ in a month. Rapid TVL decline signals user exodus, often driven by exploit rumors or competitive yield elsewhere.
For LP fees: exit if your position goes out of range on v3 and stays out of range for more than 48 hours. Rebalance or withdraw. Staying out of range costs you fee income every hour. For volatile pairs, set an IL threshold. If ETH moves 20% against your range and fees have not compensated, exit. Do not let IL compound.
For airdrops: exit if the protocol's on-chain activity drops 50%+ from peak or if the team announces no token is planned. Some protocols explicitly state they will never launch a token. Stop farming immediately. Time is your only input cost. Do not waste it on dead-end protocols.
Check on-chain data weekly. For staking, monitor validator uptime via Beaconcha.in (Ethereum) or equivalent explorer. For lending, check utilization rates on the protocol dashboard or via [DeFiLlama](https://defillama.com/protocols/lending). For LP positions, check fee earnings and IL via the DEX interface or third-party analytics like Revert Finance. For airdrops, track points balances and protocol TVL via official dashboards.
Gas costs are a position-sizing filter. If rebalancing a position costs $20 in gas and your weekly fee income is $15, the position is too small. Either increase position size to make gas worthwhile or move to a lower-gas chain. Arbitrum, Optimism, and Base have sub-$1 gas. Solana has sub-$0.01 gas. Do not let gas eat your yield.
## Tax Implications: Staking, Lending, And LP Income Are Taxable Events
Staking rewards, lending interest, LP fees, and airdrop receipts are all taxable income in the US. The IRS treats staking rewards as ordinary income at the time you gain control of the tokens. If you stake ETH and receive 0.1 ETH in rewards worth $250 on the day you receive it, you owe income tax on $250\. When you later sell that 0.1 ETH, you owe capital gains tax on any price appreciation above $250.
Lending interest is taxed as ordinary income when you withdraw from the protocol or when the interest accrues to your account, depending on your accounting method. LP fee income is taxed as ordinary income when you claim fees or when they accrue to your position. Airdrops are taxed as ordinary income at the fair market value on the date you receive the tokens.
Track cost basis for every position. If you stake 10 ETH at $2,500 per ETH and later receive 0.5 ETH in rewards at $3,000 per ETH, your cost basis for the rewards is $1,500\. If you sell the 0.5 ETH at $3,200 per ETH, you owe capital gains tax on $100 ($1,600 sale price minus $1,500 cost basis). If you do not track basis, you will overpay or face IRS audit risk.
For detailed guidance on Form 8949 reporting and cost basis tracking across staking, lending, and LP income, see [How To Complete Form 8949 For Crypto: Capital Gains, Staking Income, And Cost Basis Rules](https://altcoininvestor.com/crypto-tax-form-8949/).
## The Takeaway
Four methods generate income from deployed capital. Validator staking pays 3.5-20% APY depending on the network, requires zero to $80,000 in capital, and is the most passive option. DeFi lending pays 2.6-8% APY, requires $10+ in capital, and depends on utilization rates that collapsed in 2026\. LP fees pay 3-20%+ APY depending on the pair and whether you actively manage ranges, require $50+ in capital on L2s, and introduce impermanent loss risk. Airdrop farming has no fixed APY, requires $50-$500 and 6-12 months of active participation, and offers lottery-ticket upside with high variance.
Choose based on your capital, time, and risk tolerance. Staking fits passive investors with any capital level. Lending fits users who want stablecoin yield and can tolerate 2-4% returns. LP fees fit users who can monitor positions daily and tolerate IL on volatile pairs. Airdrop farming fits users with small capital, high time availability, and tolerance for zero-return outcomes. Stack methods if you have $1,000+. Stake 50-70% for base yield, LP 20-30% for higher returns, and farm airdrops with 10-20% for upside optionality. Monitor positions weekly. Set exit conditions before deploying capital. Gas costs determine minimum position size. Track cost basis for every taxable event.
## Frequently Asked Questions
### What is the minimum capital needed to start earning crypto?
Liquid staking requires as little as $1\. You can deposit any amount into Lido or Rocket Pool and receive stETH or rETH that earns 3-5% APY. DeFi lending on Aave accepts deposits starting at $10, though gas costs on Ethereum mainnet make positions below $1,000 uneconomical. Use Arbitrum or Optimism for smaller amounts. Airdrop farming requires $50-$100 to cover gas and minimum transaction thresholds across multiple protocols. Solo Ethereum staking requires 32 ETH, approximately $80,000 to $100,000 at current prices.
### How much time does each earning method require per week?
Liquid staking requires zero time after initial 5-minute setup. Solo staking requires 4-8 hours of hardware setup and roughly one monthly check-in to monitor uptime. DeFi lending requires 5 minutes to deposit and weekly rate checks to monitor APY changes. Uniswap v2 LP positions require 15 minutes of setup and weekly monitoring. Uniswap v3 concentrated liquidity requires 30-60 minutes of setup and daily monitoring to rebalance ranges and maximize fees. Airdrop farming requires 5-10 hours per month over 6-12 months to research protocols and execute qualifying transactions.
### What is impermanent loss and when does it matter?
Impermanent loss occurs when the price ratio of two tokens in a liquidity pool changes. If you provide ETH/USDC liquidity and ETH doubles in price, you will have less ETH and more USDC than if you had simply held both tokens. A 2x price change creates roughly 5-6% loss. A 4x change creates 20% loss. Stablecoin pairs (USDC/USDT) have minimal IL because both tokens stay near $1\. Volatile pairs require fee income to exceed IL. If ETH moves 25% and fees do not compensate, you lose money compared to holding.
### Are staking rewards and LP fees taxable in the US?
Yes. The IRS treats staking rewards, lending interest, LP fees, and airdrop receipts as ordinary income at fair market value on the date you receive them. If you earn 0.1 ETH in staking rewards worth $250, you owe income tax on $250\. When you later sell that 0.1 ETH, you owe capital gains tax on any appreciation above your $250 cost basis. Track every reward and fee claim. DeFi protocols do not issue 1099 forms, so you must calculate and report income manually.
### How do I know if an airdrop farming opportunity is legitimate?
Check three things: venture backing, developer activity, and on-chain TVL growth. Legitimate protocols have disclosed funding from recognizable VCs (a16z, Paradigm, Coinbase Ventures). Developer activity shows active GitHub commits and audits. TVL growth over 3-6 months signals real user adoption rather than airdrop mercenaries. Avoid protocols that promise guaranteed airdrops, require you to deposit into unaudited contracts, or ask for private keys. Legitimate airdrops are retroactive and discretionary. No protocol can guarantee you will receive tokens.
The Weekly Yield Report
You just compared four earning methods with APY ranges from 2.6% to 20% and capital requirements from $1 to $80,000\. Those numbers will shift next month.
Every Thursday: where crypto yield actually is - stablecoins, liquid staking and DeFi lending, with the risk named next to the rate and what changed since last week.
[Get it free every Thursday](#/portal/signup)
Free. No trade calls, no allocations, no hype. Unsubscribe in one click.
### Tangem Wallet Review: Card Hardware For Multi-Chain Yield
URL: https://altcoininvestor.com/tangem-wallet-review/
Last updated: 2026-10-14T23:06:35.000Z
## The Question Tangem Answers, And The One It Introduces
Tangem advertises a $59.90 two-card hardware wallet with NFC signing, EAL6+ secure element protection, and support for 87+ blockchain networks. For an allocator managing yield positions across Ethereum L2s, Solana, and EVM chains, the promise is simple: hardware-level security without the USB dependency, screen complexity, or battery management that Ledger requires. The workflow is straightforward. You open the Tangem app on your phone, tap the card to your device, and sign the transaction. The private key never leaves the secure element chip, the card requires no battery or charging, and the backup card model eliminates seed phrase storage risk.
The question worth answering is whether that model works when you are rebalancing eight positions weekly across Aave, Curve, and cross-chain bridges. The answer depends on three factors: whether you can verify transactions independently of your phone screen, whether WalletConnect routing supports the protocols you use, and whether the card-only backup model introduces single points of failure that outweigh the seed phrase risk it removes. Every hardware wallet makes a trade-off between security, usability, and operational resilience. Tangem's trade-off is specific. It removes the supply chain and firmware update attack surface that Ledger and Trezor carry, but it transfers transaction verification responsibility to your phone and locks your recovery mechanism to physical card possession rather than memorizable seed words.
## The Monetary History Of Verification

The 2013 Cyprus banking crisis produced a lesson most hardware wallet reviewers ignore. When Cypriot banks reopened after a two-week closure, depositors discovered that the account balances displayed on ATM screens did not match the balances the banks had actually debited. The screen showed one number. The ledger recorded another. The difference was a function of the emergency levy the Troika had imposed on deposits over 100,000 euros, but the ATMs had not been reprogrammed to reflect the new reality. For three days, Cypriots withdrew cash based on incorrect balance information, until the banks corrected the display logic and the real losses became visible.
The structural problem was not the levy itself. It was the assumption that the screen could be trusted to represent the ledger accurately. When the two diverged, depositors had no independent method of verification. They could not call the central bank and confirm their balance. They could not inspect the underlying database. They relied entirely on the interface the bank provided, and when that interface misrepresented the state of their funds, they had no recourse until the error was corrected.
Tangem's card model creates the same dependency. The card has no screen. Transaction details such as recipient address, token amount, gas limit, and contract interaction parameters are displayed only on your phone. You are trusting your phone's screen to accurately represent what the card is being asked to sign. If malware on your phone alters the displayed transaction while passing a different transaction to the secure element for signing, you will approve a transfer you did not intend. The card will sign what it receives. You will see what the phone shows you. If those two things differ, you will not know until the transaction confirms on-chain and the funds are gone.
This is not a theoretical concern. In 2022, a targeted Android malware campaign compromised over 300,000 devices by injecting overlay screens into legitimate banking apps. The user saw a transfer to their savings account. The phone sent a transfer to an attacker-controlled wallet. The attack succeeded because the verification step relied entirely on the phone's display, with no independent confirmation mechanism. Tangem's model operates the same way. The secure element protects the private key. The phone controls what you see. If the phone is compromised, the card will still sign correctly, but the transaction it signs will not be the one you approved.
## Transaction Speed, DApp Compatibility, And The WalletConnect Dependency
Tangem supports [87+ blockchain networks and over 16,000 cryptocurrencies](https://www.coingecko.com/learn/top-hot-software-wallets-crypto), including Bitcoin, Ethereum, Solana, Polygon, Arbitrum, Optimism, Base, Avalanche, BNB Chain, Cardano, XRP, TON, and Cosmos. Native staking is available for SOL, TRX, ATOM, POL, BNB, ADA, and TON directly in the app, meaning you can deploy staking positions without leaving the Tangem interface. For cross-chain rebalancing, WalletConnect integration routes Tangem to thousands of dApps across Solana and 40+ EVM networks, including DEXs like Uniswap and PancakeSwap, lending protocols like Aave and Compound, liquid staking on Lido, and NFT marketplaces.
The limitation is that Tangem's supported dApp list is narrower than its asset storage list. The wallet can hold tokens on 87 chains, but WalletConnect routing determines which protocols you can actually interact with. For allocators running positions on newer L2s or niche yield aggregators, this creates dependency on WalletConnect's integration roadmap rather than Tangem's native development. If the protocol you use does not support WalletConnect, or if WalletConnect's connection logic introduces latency or dropout during time-sensitive bridge transactions, you cannot complete the position from Tangem. You would need to export your private key, which defeats the purpose of hardware isolation, or maintain a secondary wallet for protocols Tangem cannot reach.
Transaction speed is limited by NFC communication rather than card processing. The Samsung-manufactured EAL6+ secure element chip processes signing requests quickly, but NFC handshake and encrypted channel setup add 2-5 seconds per transaction compared to USB or Bluetooth. For single transactions, this is immaterial. For weekly rebalancing across eight positions involving approve-then-deposit flows, the cumulative friction is 15-30 additional seconds per session. The larger operational issue is NFC reliability. Older phones with finicky NFC antennas may require multiple tap attempts to establish the connection, and interruptions mid-signature can leave transactions in an uncertain state where the card has signed but the phone has not broadcast, requiring manual chain inspection to confirm status.
Ledger avoids this by using USB or Bluetooth with a hardware screen that confirms transaction details before signing. MetaMask avoids it by keeping keys in software and signing instantly, at the cost of hot wallet exposure. Tangem's trade-off is hardware isolation without the desktop client dependency, but the phone becomes the single point of failure for both display verification and connection stability. If your phone's NFC fails during a bridge transaction, you cannot switch to desktop. If your phone is compromised by display malware, the card will still sign correctly, but you will not know what you signed until it executes.
## Backup Card Mechanics And The Total Loss Scenario
Tangem uses backup cards instead of a 12- or 24-word seed phrase. When you initialize a Tangem wallet, the secure element generates a private key and writes it to the primary card and any backup cards you purchased. The cards are linked. If you lose the primary card, you tap the backup card and regain access to the same wallet. The private key never exists outside the secure element chips, meaning there is no seed phrase to write down, store in a safe, or expose to phishing attacks.
The structural advantage is that seed phrase phishing is eliminated entirely. The most common hardware wallet compromise is not firmware exploit or supply chain tampering. It is users entering their seed phrase into a fake recovery website and handing their keys to an attacker. Tangem removes that attack surface. The key exists only on the cards. If you do not have a card, you cannot access the wallet. If you do have a card, you do not need to know any words or pass any authentication beyond physical possession.
The structural risk is total loss. If you lose all your cards, your funds are gone permanently. There is no recovery mechanism, no customer support override, no way to regenerate the key from memory or documentation. The $59.90 two-card set provides one backup. The $69.90 three-card set provides two. For allocators managing significant capital, the operational question is whether geographic distribution of backup cards is feasible and whether the storage locations remain accessible under the conditions that would cause you to need them. If you keep one card in your wallet and one card in your home safe, and your home burns down while you are traveling, you still have the card in your wallet. If you keep all three cards in the same location and that location is compromised, you lose everything.
Compare this to Ledger's seed phrase model. If you lose your Ledger device, you can buy a new one and restore the wallet using the 24-word seed. If you lose the seed phrase but still have the device, you can extract the funds by creating a new wallet and transferring them. If you lose both, you are in the same total loss scenario as losing all Tangem cards, but the probability of simultaneous loss is lower because the device and the seed phrase are stored separately by design. Tangem's model collapses that separation. The card is both the device and the seed. Losing all copies means losing the key itself.
For yield allocators, the practical implication is that [geographically distributed backup storage is not optional](https://altcoininvestor.com/best-crypto-hardware-wallets/). One card in your possession, one card in a secure offsite location, and ideally a third card with a trusted individual or institutional custodian. The additional $10 for a third card improves resilience, but only if the third card is stored separately and remains accessible when you need it. If all three cards are in the same safe, you have not reduced your single point of failure. You have simply paid $10 for redundancy that does not function under the failure mode it was meant to address.
## Firmware Immutability: Non-Updatable Security
Tangem's firmware is factory-installed and cannot be updated after production. The secure element chip is programmed during manufacturing, and the configuration is locked permanently. Independent audits by Kudelski Security in 2018, Riscure in 2023, and Cure53 in 2026 reviewed the firmware before it was locked, meaning the code running on your card has been externally verified, but the firmware itself is closed-source. You cannot inspect what the chip is executing. You can only trust the auditors' conclusions and Tangem's claims about what the chip does.
The advantage is that firmware update attacks are impossible. Ledger and Trezor allow firmware updates, which means they also allow malicious firmware to be pushed remotely if an attacker compromises the update server or the signing keys. Tangem eliminates that vector entirely. The firmware cannot be modified post-sale. If an attacker gains access to Tangem's infrastructure, they cannot push a backdoored update to your card. The only attack surface is the firmware as it was shipped, and that firmware has been externally audited.
The disadvantage is that the firmware cannot be patched either. If a vulnerability is discovered in Tangem's signing logic for a specific chain or contract type, the company cannot issue a fix. They can update the phone app, which controls transaction construction and WalletConnect routing, but they cannot change how the secure element processes signatures. For long-term positions held for months or years, this introduces the risk that a chain upgrade or protocol change will expose a signing vulnerability that Tangem cannot address without issuing new hardware.
Ledger and Trezor accept the update risk because they consider patchability more important than immutability. Tangem makes the opposite trade-off. For allocators managing active yield positions, the practical question is whether the protocols you use are likely to introduce breaking changes that require firmware-level support. If you are running positions on mature chains like Ethereum and Solana with stable signing standards, non-updatable firmware is low risk. If you are deploying to newer L2s or experimental contract standards, the inability to patch the card increases the probability that you will eventually need to migrate to a different wallet because Tangem cannot support the updated signing flow.
## Tangem Versus Ledger Versus MetaMask For Eight-Position Rebalancing
Ledger offers hardware-screen transaction verification, desktop client support, and updatable firmware, at the cost of higher price, USB/Bluetooth attack surface, and seed phrase management. Tangem offers NFC-only signing, non-updatable firmware, and card-based recovery, at the cost of phone-screen dependency, mobile-only workflow, and total loss if all cards are misplaced. MetaMask offers instant signing and broad dApp compatibility, at the cost of hot wallet exposure and no hardware isolation unless paired with a Ledger or Trezor backend.
For allocators managing eight positions weekly, the decision depends on where you are willing to accept operational friction and where you need independent verification. If you are rebalancing from a desktop and need to verify contract interactions on a hardware screen before signing, Ledger is the correct choice. The Ledger Nano X costs $149, supports desktop and mobile, and displays transaction details on the device itself, eliminating phone-screen trust dependency. The seed phrase introduces phishing risk, but geographic distribution of metal backups mitigates total loss exposure. The firmware is updatable, meaning Ledger can patch vulnerabilities or add support for new chains, but that also means firmware update attacks are possible if Ledger's signing keys are compromised.
If you are rebalancing from mobile and prioritize elimination of seed phrase risk over independent transaction verification, Tangem is the correct choice. The $59.90 two-card set is the lowest-cost hardware wallet with EAL6+ secure element protection, and the card-based recovery model removes the seed phrase attack surface entirely. The phone-screen dependency is the trade-off. You must trust that your phone is not compromised, because the card has no screen to verify transactions independently. For allocators who maintain strict phone security, run dedicated devices for wallet operations, and can implement geographic distribution of backup cards, Tangem's model works. For allocators who cannot guarantee phone integrity or who need desktop workflows, it does not.
If you are running positions that require rapid transaction iteration, complex multi-sig setups, or protocols with limited WalletConnect support, MetaMask paired with a hardware wallet backend is the correct choice. MetaMask maintains the broadest dApp compatibility, supports transaction simulation through Tenderly and Blocknative integrations, and allows switching between hot wallet and hardware signing depending on transaction sensitivity. The hot wallet mode exposes keys to software exploits, but [for small test transactions or gas-only wallets, that exposure is acceptable](https://altcoininvestor.com/crypto-wallet-security-active-yield-positions/). The hardware mode requires Ledger or Trezor, meaning you accept seed phrase risk and firmware update surface in exchange for desktop verification and multi-sig orchestration that Tangem cannot provide.
## Who Tangem Is Right For, And Who It Is Not
Tangem is right for mobile-first allocators who prioritize seed phrase elimination over transaction screen verification, who can implement geographic distribution of backup cards, and whose positions are concentrated on chains and protocols with mature WalletConnect support. If you are managing stablecoin positions on Aave, LP positions on Uniswap or Curve, and native staking on Solana or Cosmos, and you are rebalancing from your phone rather than desktop, Tangem delivers hardware isolation at $59.90 without the complexity of USB cables, battery management, or seed phrase storage. The card-based recovery model works if you treat the backup cards as you would treat gold bars: geographically distributed, physically secured, and accessible only to you or a trusted party.
Tangem is not right for allocators who need desktop workflows, who require independent transaction verification on a hardware screen, or whose positions depend on protocols with limited WalletConnect integration. If you are managing multi-sig vaults, deploying to experimental L2s, or running positions on protocols that do not support WalletConnect routing, Tangem cannot reach those positions without exporting your key, which defeats hardware isolation. If you cannot guarantee phone security, or if your threat model includes targeted malware that could compromise your phone's display layer, the absence of a hardware screen is disqualifying. If you are managing capital where total loss from misplacing all backup cards is unacceptable, [seed phrase recovery despite its phishing risk is the safer model](https://altcoininvestor.com/is-tangem-a-cold-wallet/).
For allocators running eight positions weekly, the operational question is whether WalletConnect latency and NFC handshake delays introduce enough friction to offset the convenience of mobile-only signing. The answer depends on your transaction volume and tolerance for 2-5 second delays per signature. If you are rebalancing once per week with approve-then-deposit flows, the cumulative delay is 15-30 seconds, which is immaterial. If you are executing rapid arbitrage or responding to liquidation alerts, the delay is long enough to miss execution windows, and MetaMask's instant signing becomes necessary despite hot wallet exposure.
## The Recommendation
For yield allocators managing positions across Ethereum L2s, Solana, and EVM chains from mobile, Tangem is the correct hardware wallet if you can implement geographic distribution of backup cards and your positions are on protocols with WalletConnect support. The $59.90 entry price, EAL6+ secure element, and seed phrase elimination make it the lowest-friction hardware wallet for mobile workflows. The phone-screen dependency is the trade-off. If your threat model includes phone compromise, or if you need desktop workflows and hardware-screen verification, [Ledger's higher price and seed phrase risk are worth accepting](https://www.ledger.com/academy/topics/ledgersolutions/ledger-vs-tangem-hardware-wallet-security-comparison) for the independent verification layer.
The specific decision rule is this: if losing all your backup cards would result in acceptable loss, or if you can store backup cards in geographically separate locations that remain accessible under the conditions that would cause you to need them, Tangem works. If neither condition is true, the total loss risk outweighs the seed phrase risk that Ledger's model carries, and Ledger is the safer choice despite higher cost and greater operational complexity. The mechanism you choose matters less than the backup procedure you implement. Hardware isolation protects your key from remote exploits. It does not protect your funds from physical loss or phone-layer malware. Those protections require operational discipline that no hardware wallet can enforce.
## The Takeaway
Tangem's $59.90 card-based hardware wallet eliminates seed phrase phishing risk and delivers EAL6+ secure element protection in a mobile-first form factor, but the absence of a transaction screen transfers verification responsibility to your phone, and total loss of all backup cards results in permanent fund loss with no recovery mechanism. For allocators managing yield positions across chains, the decision depends on whether you can implement geographic distribution of backup cards, whether your positions are on protocols with WalletConnect support, and whether your phone security posture justifies trusting the phone's display layer to represent transaction details accurately. The single point of failure is not the card. It is the storage and verification assumptions the card model requires you to implement correctly, every time, without exception.
## Frequently Asked Questions
### Does Tangem work with desktop computers or only mobile phones?
Tangem requires an NFC-enabled smartphone and has no desktop client or USB connectivity. If you need desktop workflows for managing DeFi positions, yield rebalancing, or multi-sig operations, Ledger or Trezor with desktop support is the correct choice. Tangem is mobile-only by design, which eliminates USB attack surface but also removes the ability to sign transactions from a computer.
### What happens if I lose all my Tangem backup cards?
If you lose all Tangem cards, your funds are permanently lost with no recovery mechanism. Tangem does not use seed phrases, meaning there is no 12- or 24-word backup to restore your wallet. The $59.90 two-card set provides one backup, and the $69.90 three-card set provides two. Geographic distribution of backup cards in separate secure locations is not optional for managing significant capital. Unlike Ledger's seed phrase model, Tangem's card-only recovery introduces total loss risk if all physical cards are misplaced or destroyed.
### Can Tangem verify transaction details independently of my phone?
No. Tangem cards have no screen, so all transaction details including recipient address, token amount, and contract interactions are displayed only on your phone. You are trusting your phone's screen to accurately represent what the card is signing. If malware on your phone alters the displayed transaction while passing a different transaction to the secure element, the card will sign the malicious transaction. Ledger and Trezor avoid this by displaying transaction details on the hardware device itself, providing independent verification that does not depend on phone or computer security.
### How does Tangem compare to Ledger for managing DeFi yield positions?
Tangem costs $59.90 for a two-card set and eliminates seed phrase risk, but requires mobile-only workflows and has no transaction screen for independent verification. Ledger costs $149 for the Nano X, supports desktop and mobile, and displays transaction details on the device screen, but introduces seed phrase phishing risk and firmware update attack surface. For yield allocators who rebalance from mobile and can implement geographic distribution of Tangem backup cards, Tangem is lower cost and eliminates seed phrase exposure. For allocators who need desktop workflows, hardware-screen verification, or complex multi-sig setups, Ledger is the correct choice despite higher price.
### Does Tangem support all DeFi protocols and cross-chain bridges?
Tangem supports 87+ blockchain networks for asset storage, but dApp compatibility depends on WalletConnect integration rather than Tangem's native development. WalletConnect routes Tangem to thousands of dApps including Uniswap, Aave, Compound, and Lido, but if the protocol you use does not support WalletConnect, you cannot interact with it from Tangem without exporting your private key. For allocators managing positions on newer L2s or niche yield aggregators, verify WalletConnect support before deploying capital, because Tangem's mobile-only model prevents fallback to desktop clients when WalletConnect routing fails.
Tool mentioned above
Ledger
Ledger devices display the full transaction on their own screen before you approve it, which is what stops an approval exploit at the point it matters.
[See Ledger devices](https://shop.ledger.com/?r=90612ff43561)
We may earn a commission if you sign up through this link, at no cost to you. It does not change what gets recommended.
The Weekly Yield Report
You have just reviewed Tangem's card model against Ledger and MetaMask for managing yield across eight protocols. The backup procedures and phone security assumptions required will be different next month.
Every Thursday: where crypto yield actually is - stablecoins, liquid staking and DeFi lending, with the risk named next to the rate and what changed since last week.
[Get it free every Thursday](#/portal/signup)
Free. No trade calls, no allocations, no hype. Unsubscribe in one click.
### How To Structure Wallet Sets For Airdrop Farming Safely
URL: https://altcoininvestor.com/how-to-structure-wallets-for-airdrop-farming/
Last updated: 2026-10-14T22:04:08.000Z
## What Wallet Separation Actually Accomplishes

Running multiple wallets for airdrop farming multiplies eligibility in theory. One wallet equals one allocation. Ten wallets equals ten allocations. The math is simple until you account for detection.
Projects run post-snapshot sybil analysis to identify coordinated wallet clusters. [LayerZero disqualified 803,000 addresses](https://altcoininvestor.com/how-airdrops-detect-sybil-wallets/) in 2024 through funding graph analysis, transaction timing correlation, and off-chain data including Infura RPC logs and centralized exchange deposit IPs. Arbitrum filtered 427,923 addresses in 2023\. ZkSync flagged wallets funded from the same source that executed identical transaction sequences within the same time window.
The operational question is not whether to use multiple wallets. The question is how to structure wallet sets so that legitimate parallel activity does not produce the same detection signatures as industrial sybil farms.
Wallet separation works when it achieves two specific outcomes. First, it distributes activity across addresses that look independent to clustering algorithms. Second, it does so at a gas cost low enough that the expected airdrop value exceeds the overhead. Both conditions must hold. If detection algorithms flag your wallets as a cluster, the separation accomplished nothing. If gas costs consume 80% of your expected allocation, the operation was unprofitable.
## The Detection Vectors You Are Actually Preventing
Clustering algorithms flag wallets using five primary signals. Each signal has a specific mitigation requirement.
**1\. Common funding source.** If twenty wallets receive their first deposit from the same centralized exchange address within a 10-minute window, the algorithm treats this as a single entity. Matter Labs' zkSync filtering criteria explicitly flagged wallets that received initial ETH from a common source. The pattern is distinctive even when the amounts vary.
**2\. Transaction sequence matching.** If ten wallets interact with contract A, then contract B, then bridge to chain X, then contract D, in that order, within the same week, the probability that this is coincidental is near zero. This functions like browser fingerprinting. Each individual action is common. The sequence is unique. Projects track these interaction fingerprints and cluster wallets that share them.
**3\. Temporal correlation.** Arbitrum flagged wallets that executed transactions at fixed intervals. Every Tuesday and Thursday between 09:00 and 10:00 UTC. The timing signature is machine-readable. Automation that produces perfect patterns is more detectable than human-like randomness.
**4\. Identical volume patterns.** Depositing exactly $500.00 USDC into every address is a sybil signal. Round numbers repeated across wallets indicate programmatic funding rather than organic behavior. Variation is harder to script and less efficient, which is why it works as a differentiation signal.
**5\. Off-chain correlation.** Projects including LayerZero tracked IP addresses, browser fingerprints (Canvas hash, WebGL renderer, AudioContext signature), and timezone settings. A VPN changes your IP but does not touch your browser fingerprint. Multiple tabs share the same fingerprint environment. Running fifty wallets from the same browser session exposes all fifty to the same off-chain signature.
The goal of wallet separation is to break these correlations. Not all of them. Breaking three of five is usually sufficient. The aPriori airdrop saw one entity control 14,000 wallets claiming more than 60% of the distribution. That operation was industrial. Your operation needs to look less coordinated than that threshold.
## Step 1: Determine Wallet Count Based On Gas Economics

The breakeven calculation is straightforward. Expected airdrop value per wallet minus gas cost per wallet equals net return per wallet. Multiply by wallet count. If the result is negative, reduce wallet count or switch chains.
Gas costs by chain as of late 2024:
- Polygon PoS: $0.002 per transaction
- Solana: $0.001 per transaction
- Base: $0.01 to $0.05 per transaction
- Arbitrum: $0.05 to $0.30 per transaction
- Ethereum mainnet: $8 to $40 per transaction
For a 50-wallet operation farming an Arbitrum-based protocol, assume 10 transactions per wallet over the farming period. At $0.15 average gas per transaction, total gas cost is $75\. If the expected airdrop allocation is $200 per wallet, gross return is $10,000\. Net return after gas is $9,925\. The operation is viable.
For the same operation on Ethereum mainnet, at $15 average gas per transaction, total gas cost is $7,500\. Net return after gas is $2,500\. The operation is marginally viable. A 20% drop in expected allocation value or a gas spike makes it unprofitable.
Most [airdrop farming operations](https://altcoininvestor.com/how-to-earn-crypto-airdrops/) use Layer 2 networks or Polygon for this reason. Ethereum mainnet farming is economically constrained to high-conviction opportunities where expected allocations exceed $1,000 per wallet.
The second constraint is operational overhead. Managing 10 wallets requires tracking 10 seed phrases, 10 transaction histories, and 10 eligibility statuses. Managing 100 wallets requires tooling. Most individual farmers operate between 5 and 25 wallets. Industrial operations run 500 to 5,000\. If you cannot automate wallet management without producing detectable timing patterns, cap your wallet count at the number you can manage manually.
### When Single Wallet Makes More Sense
Some protocols weight allocations by depth of activity rather than wallet count. Optimism's airdrop in 2022 allocated tokens based on transaction count, contract interaction diversity, and liquidity provision. A single wallet with 200 transactions received more than five wallets with 40 transactions each.
Projects use this structure to reduce sybil farming profitability. It rewards genuine usage over mechanical replication. If the protocol you are farming has announced allocation criteria weighted by depth, consolidate activity into fewer wallets. Three wallets with strong interaction history outperform fifteen wallets with shallow history in this model.
## Step 2: Isolate Funding Sources Across Wallet Groups
The funding tree structure is the most common detection failure. Do not fund all wallets from a single exchange address. Do not fund wallets in a pyramid structure where wallet A funds wallets B, C, and D, which each fund three more wallets. The shape of that tree is distinctive and matchable.
Structure funding in three tiers.
**Tier 1: Primary funding wallets.** These are wallets that receive deposits from centralized exchanges. Use different exchanges for different primary wallets. If you are funding 20 farming wallets, create 4 primary funding wallets and use Coinbase for one, Kraken for another, Binance for a third, and a DEX on-ramp for the fourth. Spread deposits over multiple days.
**Tier 2: Intermediate wallets.** Each primary wallet funds 2-3 intermediate wallets. These wallets hold funds for 48 to 72 hours and perform 1-3 unrelated transactions (a DEX swap, an NFT mint, a token transfer to a different address). This breaks the direct funding link between the exchange and the farming wallet.
**Tier 3: Farming wallets.** Each intermediate wallet funds 2-4 farming wallets. Use variable amounts. Do not send exactly $500 USDC. Send $487, $523, $461, $508\. Spread funding over multiple days. Do not fund all twenty wallets on the same day.
Farmers who properly isolated wallets during the LayerZero airdrop received full allocations. Farmers running 50 to 500 wallets from the same IP or funded from the same centralized exchange were fully disqualified. The difference was not wallet count. The difference was isolation discipline.
## Step 3: Randomize Transaction Timing and Sequences
Automation that produces perfect timing patterns is detectable. Wallets that all execute swaps every Tuesday and Thursday between 09:00 and 10:00 UTC share a timing signature. The solution is to introduce randomness at both the timing level and the sequence level.
**Timing randomization.** If you are scripting transactions, add a random delay between 1 and 72 hours between each wallet's action. Do not execute all twenty wallets in sequence. Execute wallet 1, wait 18 hours, execute wallet 7, wait 6 hours, execute wallet 3\. The order should be non-sequential. The intervals should be variable.
**Sequence randomization.** If the farming strategy requires interacting with contracts A, B, C, and D, do not execute them in the same order across all wallets. Wallet 1 does A-B-C-D. Wallet 2 does A-C-B-D. Wallet 3 does B-A-C-D. The interaction set is the same. The sequence is different. This reduces the likelihood that clustering algorithms identify the wallets as a coordinated set.
**Volume randomization.** Do not swap exactly 1.0 ETH in every wallet. Swap 0.87 ETH in wallet 1, 1.12 ETH in wallet 2, 0.94 ETH in wallet 3\. The variance signals human behavior rather than scripted replication.
These mitigations have an operational cost. Randomization requires more complex scripting or manual execution. Manual execution limits wallet count. The tradeoff is between scale and detection risk. Most individual farmers choose fewer wallets with better isolation over more wallets with higher detection probability.
## Step 4: Isolate Browser Fingerprints and IP Addresses
On-chain isolation is necessary but not sufficient. Projects track off-chain signals. IP address correlation and browser fingerprint matching are both in production use.
**IP isolation.** Do not access all farming wallets from the same IP address. Use a different VPN endpoint for each wallet. If you are managing 20 wallets, rotate through at least 5 VPN endpoints. Access each wallet from the same endpoint consistently. Do not access wallet 1 from endpoint A one day and endpoint B the next. Consistency within each wallet reduces the likelihood that the wallet is flagged for suspicious access patterns.
**Browser fingerprint isolation.** Use separate browser profiles for each wallet. Chrome and Firefox both support profile isolation. Each profile generates a separate Canvas hash, WebGL renderer signature, and AudioContext signature. Do not open multiple wallets in different tabs of the same browser session. Open each wallet in a separate profile.
For operations managing more than 10 wallets, consider virtual machines or separate physical devices. Each device produces a distinct hardware fingerprint. This level of isolation is operationally expensive but maximally effective. [Hardware wallets](https://altcoininvestor.com/how-to-set-up-hardware-wallet/) can assist with key management but do not solve the browser fingerprint problem. The fingerprint is generated by the browser environment, not the wallet software.
## Step 5: Monitor For Cluster Detection Before Snapshot
Detection happens post-snapshot in most cases, but some monitoring tools are public. Nansen tracks wallet clusters in real time. Bubblemaps visualizes funding trees. If your wallet set is visible in a public clustering tool before the snapshot, the project's internal analysis will also flag it.
Check your funding wallet addresses in Nansen or Bubblemaps monthly during the farming period. If the tool identifies your wallets as a cluster, the isolation failed. You have two options. First, abandon the flagged wallets and start new ones with better isolation. Second, reduce activity in the flagged wallets to a level where they appear dormant, then shift activity to a new set. Neither option is ideal. The better approach is to verify isolation early and adjust before months of activity are lost.
Some projects announce pre-snapshot sybil reports with amnesty windows. LayerZero did this. The project published a list of flagged addresses and allowed farmers to self-report and consolidate claims to a single wallet. Farmers who did so received reduced allocations but were not fully disqualified. Farmers who did not self-report and were later detected received zero. If the project offers an amnesty window, use it. The reduced allocation is better than disqualification.
## Common Failure Modes and How To Avoid Them
**Failure mode 1: All wallets funded from the same exchange address on the same day.** This is the most common mistake. The fix is to use multiple exchanges and spread funding over multiple days. If you have already made this mistake, the wallets are likely clustered. Starting over with better isolation is more productive than continuing to farm with compromised wallets.
**Failure mode 2: Identical transaction sequences executed within the same 24-hour window.** This produces a detectable interaction fingerprint. The fix is to randomize both the sequence and the timing. If you are automating, add random delays and random sequence variation to the script.
**Failure mode 3: Accessing all wallets from the same IP or browser session.** Projects track off-chain signals. The fix is separate browser profiles and separate VPN endpoints for each wallet. This is operationally expensive but necessary for operations managing more than 5 wallets.
**Failure mode 4: Funding wallets in a hierarchical tree structure.** Wallet A funds wallets B, C, D. Wallet B funds wallets E, F, G. The tree shape is distinctive. The fix is to use intermediate wallets with unrelated transactions between funding tiers. This flattens the tree and makes it harder to reconstruct.
**Failure mode 5: Running more wallets than you can manage manually.** Automation introduces timing patterns. Manual management introduces operational errors. The optimal wallet count is the number you can manage with randomization discipline. For most individual farmers, this is between 5 and 15 wallets.
## What To Do After Wallet Setup
Once wallet structure is in place, the farming strategy begins. Each wallet needs to demonstrate genuine usage. Projects do not allocate tokens to wallets that merely exist. They allocate to wallets that interact with the protocol in ways that demonstrate real usage.
The specifics vary by protocol. Some projects weight transaction count. Others weight transaction volume. Others weight diversity of contract interactions. Read the protocol's documentation and monitor community discussion for signals about allocation criteria. If no criteria are public, assume the standard model: transaction count, volume, and interaction diversity are all weighted.
Maintain a tracking sheet. Record each wallet's transaction count, volume, and interaction history. If the protocol announces allocation criteria mid-farming period, you can quickly assess which wallets meet the threshold and which need more activity. Do not assume all wallets will qualify. Some wallets will underperform. The goal is to maximize the number of wallets that meet the threshold, not to achieve perfect parity across all wallets.
Gas cost tracking is also necessary. Record gas spent per wallet. If gas costs exceed 50% of expected allocation value for a given wallet, deprioritize that wallet and shift activity to lower-cost wallets. Gas cost overruns are the second most common reason airdrop farming operations become unprofitable. The first is disqualification.
## The Tradeoff Between Scale and Detection Risk
Wallet separation is a cost-benefit calculation. More wallets equals more eligibility. More wallets also equals higher gas costs, higher operational overhead, and higher detection risk. The optimal wallet count is the point where marginal return per additional wallet drops below marginal cost plus marginal detection risk.
For most individual farmers, this equilibrium is between 5 and 15 wallets. For semi-automated operations with strong isolation discipline, the equilibrium is between 20 and 50 wallets. For industrial operations with custom tooling and dedicated infrastructure, the equilibrium can be 500 or more. But industrial operations face the highest detection risk. The aPriori case demonstrated that 14,000-wallet operations are detectable even when allocation mechanisms do not explicitly filter for sybils.
The structural advantage of smaller operations is that they can achieve better per-wallet isolation. Managing 10 wallets with separate browser profiles, separate VPN endpoints, separate funding sources, and randomized timing is feasible. Managing 500 wallets with the same level of isolation requires infrastructure that most farmers do not have. [Detection algorithms](https://altcoininvestor.com/airdrop-farming-multiple-wallets-worth-it/) exploit this tradeoff. They are optimized to catch large-scale farms. Small-scale operations with strong isolation often pass through.
## When Detection Happens Despite Isolation
No isolation strategy is perfect. Projects improve detection methods every cycle. Wallets that would have passed in 2022 are flagged in 2024\. If your wallets are disqualified despite isolation efforts, the operational question is whether the strategy is still viable.
Some farmers respond by increasing isolation discipline. More VPN endpoints. More intermediate wallets. Longer delays between transactions. This improves detection resistance but increases operational cost. The alternative is to accept higher detection risk in exchange for lower operational cost and focus on farming protocols with weaker detection infrastructure. Both approaches are rational. The choice depends on your detection tolerance and operational capacity.
The third option is to abandon multi-wallet farming and consolidate activity into a single wallet with strong interaction depth. This eliminates detection risk entirely but also eliminates the eligibility multiplier. For protocols that weight depth over breadth, this is often the better strategy. For protocols that weight wallet count, it is not.
## The Takeaway
Wallet separation for airdrop farming works when isolation discipline exceeds detection thresholds and gas economics remain positive. The isolation requirement is not binary. It is a spectrum. Breaking three of five detection vectors is usually sufficient. The optimal wallet count is between 5 and 25 for most individual farmers. Gas costs on Layer 2 networks average $0.05 to $0.30 per transaction, making multi-wallet operations economically viable. Ethereum mainnet farming is economically constrained to high-conviction opportunities. Funding isolation, timing randomization, and browser fingerprint separation are all necessary. On-chain isolation without off-chain isolation is insufficient. Monitor your wallet cluster visibility in Nansen or Bubblemaps before snapshot. If your wallets are clustered in public tools, they are clustered in project analytics.
The detection thresholds will tighten. Projects that disqualified 400,000 addresses in 2023 will disqualify 600,000 in 2025\. The isolation discipline that worked last cycle will not work next cycle. Adjust before snapshot.
## Frequently Asked Questions
### How many wallets should I use for airdrop farming?
Most individual farmers operate between 5 and 15 wallets. This range balances eligibility multiplication against gas costs and operational overhead. More wallets increase detection risk unless you can maintain strict isolation discipline across funding sources, timing patterns, and browser fingerprints. Operations managing more than 25 wallets typically require automation, which introduces detectable timing signatures. The optimal count depends on the gas economics of your target chain and your capacity to randomize transaction sequences and timing manually.
### What gets wallets flagged as sybil attacks in airdrops?
Projects flag wallets using five primary signals: common funding source, identical transaction sequences, temporal correlation in execution timing, identical volume patterns, and off-chain correlation through IP addresses and browser fingerprints. LayerZero disqualified 803,000 addresses in 2024 by tracking wallets funded from the same exchange address, wallets executing the same contract interactions in the same order, and wallets accessed from the same IP. Breaking three of these five detection vectors is usually sufficient to avoid clustering algorithms.
### How much does gas cost for multi-wallet airdrop farming?
Gas costs vary significantly by chain. Polygon PoS averages $0.002 per transaction, while Arbitrum costs $0.05 to $0.30 per transaction. For a 50-wallet operation with 10 transactions per wallet on Arbitrum, total gas cost is approximately $75 at $0.15 average per transaction. Ethereum mainnet farming costs $8 to $40 per transaction, making it economically constrained to high-conviction opportunities where expected allocations exceed $1,000 per wallet. Layer 2 networks and Polygon are the economically viable options for most farmers.
### Should I fund all airdrop wallets from the same exchange?
No. Funding all wallets from the same exchange address is the most common detection failure. Projects including zkSync explicitly flagged wallets that received initial deposits from a common source. Use multiple exchanges for primary funding wallets and introduce intermediate wallets that hold funds for 48 to 72 hours and perform unrelated transactions before funding your farming wallets. Spread funding over multiple days with variable amounts. This breaks the direct funding link that clustering algorithms use to identify coordinated wallet sets.
### Can I use a VPN to hide my airdrop farming wallets?
A VPN changes your IP address but does not prevent browser fingerprint detection. Projects track Canvas hash, WebGL renderer signature, and AudioContext signature. Multiple tabs in the same browser session share the same fingerprint environment. Use separate browser profiles for each wallet and rotate through at least 5 VPN endpoints for a 20-wallet operation. Access each wallet from the same endpoint consistently. For operations managing more than 10 wallets, consider separate virtual machines or physical devices to achieve complete fingerprint isolation.
Tool mentioned above
Ledger
Ledger devices display the full transaction on their own screen before you approve it, which is what stops an approval exploit at the point it matters.
[See Ledger devices](https://shop.ledger.com/?r=90612ff43561)
We may earn a commission if you sign up through this link, at no cost to you. It does not change what gets recommended.
The Weekly Yield Report
You have just seen the breakeven math for 5, 15, and 50 wallet operations across three chains. LayerZero will tighten detection next cycle. Monitor your cluster visibility before then.
Every Thursday: where crypto yield actually is - stablecoins, liquid staking and DeFi lending, with the risk named next to the rate and what changed since last week.
[Get it free every Thursday](#/portal/signup)
Free. No trade calls, no allocations, no hype. Unsubscribe in one click.
### Liquidity Bootstrapping Pools: What They Tell You About Launch Intent
URL: https://altcoininvestor.com/liquidity-bootstrapping-pool-how-it-works/
Last updated: 2026-10-14T21:07:45.000Z
## What a Liquidity Bootstrapping Pool Actually Does
A Liquidity Bootstrapping Pool is a pool where token weights change over time, typically from 96:4 to 50:50 across 72 hours, causing the price of the project token to fall steadily unless buying pressure pushes it back up. The mechanic inverts the incentive structure of a fixed-price launch. In a fixed-price sale the first buyer gets the cheapest tokens. In an LBP the first buyer gets the most expensive tokens. Being fast is a penalty, not an advantage.
The purpose is price discovery with minimal starting capital. A team can launch with 10% or 20% of the pool in stablecoins and 90% in their own token, weighted heavily toward the project token at the start. The high weight creates an artificially high opening price, which then falls over the course of the event unless participants step in. Where fixed-price IDO launchpads reward bots and insiders who can snipe the earliest blocks, an LBP slows the process down. Participants wait for the price they believe is fair, and the market finds equilibrium through gradual buying rather than immediate exhaustion of supply.
This is not a novel idea in monetary history. European bond auctions have for decades used descending-price mechanisms to eliminate first-mover advantage and allow price discovery across a wider participant base. What LBPs add is the ability to run such an auction on-chain with programmable weight curves and minimal liquidity commitment from the launching team.
## How the Weight Curve Produces the Price Curve

LBPs operate on Balancer's weighted math, where the relative weight of two tokens determines their exchange rate within the pool. If Token A is weighted at 96% and Token B at 4%, the price of Token A in terms of Token B is set artificially high. Over the duration of the LBP, the pool controller adjusts those weights gradually toward 50:50\. As the weight of Token A falls and the weight of Token B rises, the price of Token A declines unless someone sends Token B into the pool in exchange for Token A, which pushes the price back up.
This creates two opposing forces. The programmatic weight change applies constant downward pressure on the token price. Every purchase applies upward pressure. The observed price is the equilibrium between those forces. A project launching an LBP expects that the initial price is too high and that the weight curve will bring the price down into a range where real demand materializes. If demand appears early, the price may stabilize or even rise before the weight shift completes. If demand is weak, the price continues to fall until either it reaches a level where buyers appear or the event ends.
The practical implication is that an LBP participant has no reason to rush. Unlike a fixed-allocation IDO, where late arrivals are shut out, an LBP rewards patience. The downward curve means waiting generally improves your entry price unless buying activity outpaces the weight shift. For a participant interested in acquiring tokens at the lowest possible cost, the optimal strategy is to watch the curve, estimate where equilibrium will settle, and enter as that level approaches.
### Worked Example: 96:4 Start, 50:50 End, 72 Hours
A project launches with 10 million tokens and 200,000 USDC. The starting weight is 96% project token, 4% USDC. The ending weight is 50:50\. Duration is 72 hours. At the start, the implied price might be $4.00 per token. If no one buys anything, the weight shift alone will bring the price down to perhaps $0.80 by the end. But the team does not expect zero demand. They expect that as the price falls, participants will begin buying. Each purchase pushes the price back up. The final equilibrium price is discovered through that interaction.
If the token finds strong demand at $1.50, buying pressure may stabilize the price there despite further weight shifts. If demand is weak, the price may fall below $1.00 before buyers step in. The team watches this happen in real time and learns what the market believes the token is worth. That information is more valuable than a fixed-price sale that sells out in 30 seconds and reveals nothing about sustainable demand.
## What the Parameters Tell You About Team Intentions

The configuration of an LBP reveals whether the team understands the mechanism and whether they intend fair distribution or maximum extraction. The details worth examining are starting price, weight curve steepness, pool fees, reserve asset choice, and pause-swap authority.
### Starting Price and Weight
Teams set the starting price deliberately high, because an LBP that opens near fair value has nothing left to discover and gives early buyers a free option. A high opening price is the mechanism working as designed. It is also the trap that catches first-time participants who interpret a falling chart as a crash and panic-sell or avoid entering entirely. The question is not whether the starting price is high. The question is whether it is absurdly high relative to any reasonable valuation.
A team launching a token with a $10 million fully diluted valuation might open the LBP at an implied price that suggests a $100 million FDV. That is normal. A team opening at an implied $500 million FDV for a project with no product and no revenue is signaling something different. They either believe the market will irrationally overpay, or they are deliberately setting a trap for FOMO buyers who do not understand the mechanic. The starting price itself is not the signal. The ratio between starting price and any defensible valuation is the signal.
### Weight Curve Steepness
The speed at which weights shift from starting to ending configuration affects how quickly the price falls. A slow shift from 96:4 to 50:50 over 72 hours suggests the team wants a gradual discovery process and expects buying to occur throughout the event. A rapid shift over 24 hours suggests the team expects to capture most demand early and wants the price to fall quickly to create urgency.
Steep curves favor the team at the expense of participants. They compress price discovery into a shorter window, which reduces the time available for participants to evaluate the project and increases the likelihood that FOMO drives early purchases at prices above equilibrium. Gradual curves favor participants by extending the discovery period and giving more people the opportunity to enter at or near fair value.
### Pool Fees
Balancer allows pool creators to set fees between 0.01% and 1.00%. Most LBPs use fees in the 0.1% to 0.5% range. Fees above 0.5% are a red flag. They indicate the team is extracting value from each trade rather than focusing on distribution and price discovery. Fees below 0.1% are a signal of confidence. The team is willing to forgo fee revenue to encourage broader participation.
### Reserve Asset: Stablecoin or ETH
The reserve asset chosen for the pair signals the team's expectation for volatility and the target participant base. A USDC or DAI pair indicates the team wants price stability and expects participants to value predictable entry and exit pricing. A WETH pair indicates the team expects Ethereum correlation and is comfortable with higher volatility. It also signals that the team expects participants who hold ETH and are willing to tolerate price swings in both assets.
For a yield-focused participant, the reserve asset choice matters because it affects how you hold capital while waiting to enter. If the LBP is paired with USDC, you can hold stables and enter when you choose. If it is paired with WETH, you must hold ETH, which exposes you to ETH price risk during the waiting period. The second configuration favors participants who are already long ETH and disadvantages those who must convert from stables to ETH to participate.
### Pause-Swap Authority
The pool controller can pause trading at any time. The stated reason for this feature is to handle unexpected demand surges or to stop participants from selling tokens back into the pool for arbitrage profit. In practice, most legitimate teams leave trading enabled throughout the event. The ability to pause swaps is a trust assumption. A team that exercises pause authority outside of a genuine emergency is signaling either poor planning or intent to manipulate outcomes.
If a team pauses swaps because the price is falling faster than they expected, they are interfering with price discovery. If they pause because a large buyer is about to enter and they want to adjust parameters first, they are front-running their own participants. Pause authority is not inherently disqualifying, but any use of it demands scrutiny. The best signal is a team that publicly commits not to pause except in the case of a contract exploit or oracle failure.
## First 72 Hours: What Happens to Early Buyers and Why Patience Wins
The first hours of an LBP are the most expensive. The opening price is set above any reasonable equilibrium, and early buying pushes the price higher before the weight curve reasserts downward pressure. Participants who enter in the first six hours typically pay more than those who wait, unless demand is so strong that the price never falls below the initial level.
Historical data from Balancer LBPs shows that the median participant who waits until the second day of a 72-hour event pays 20% to 40% less than the median participant who enters in the first six hours. The distribution is wide. Some LBPs find equilibrium early and stabilize. Others fall continuously until the final hours. The predictability depends on the quality of the project, the marketing reach, and the degree to which participants understand the mechanism.
The mistake first-time LBP participants make is interpreting the falling price as a signal of failure. They see the chart declining and assume something is wrong. In fact, the declining price is the mechanism working correctly. The weight curve is doing what it was programmed to do. The only relevant question is where buying pressure will materialize. If you believe the fair value of the token is $1.00 and the current price is $2.50, you wait. If the price falls to $1.00 and holds, you enter. If it falls below $1.00, you either reassess your valuation or accept that the market disagrees with you.
### Whale Accumulation and FOMO Spikes
Large purchases during an LBP spike the price temporarily. Because the pool operates on a constant-function curve, a large transaction moves the price more than a series of smaller transactions of the same total size. This creates opportunities for short-term traders to buy during quiet periods and sell into spikes. It also creates risk for participants who enter during a spike, because the price typically falls again as the weight curve continues.
The presence of large buyers early in an LBP is not necessarily a positive signal. It may indicate informed participants who believe the project is undervalued, or it may indicate insiders or affiliates buying to create the appearance of demand. Without information about who is buying, the price action alone is ambiguous. The more useful signal is sustained buying across the entire duration of the event, which indicates broad interest and reduces the likelihood that the price is being manipulated.
## Post-LBP: Liquidity Migration and Vesting Cliffs
The funds raised during an LBP are typically used to seed liquidity on Uniswap or another constant-product AMM. The speed with which this migration occurs is a signal. Teams that migrate liquidity within 24 hours of the LBP ending are signaling operational readiness and confidence. Teams that delay migration for days or weeks are signaling either capital control concerns or uncertainty about the appropriate liquidity depth.
The vesting schedule for team and advisor tokens is the other critical post-launch parameter. A project that raises $500,000 in an LBP and then unlocks $2 million in team tokens 30 days later is not a project with sustainable distribution. The LBP may have been fair, but the subsequent dilution negates the fairness. Cross-referencing LBP outcomes with tokenomics and vesting schedules is necessary before concluding that an LBP represents a legitimate opportunity.
European sovereign debt markets provide the relevant parallel. A bond auction may allocate debt fairly across a wide base of investors, but if the issuing government immediately increases the money supply or announces a new round of borrowing, the initial allocation becomes irrelevant. The same dynamic applies to token launches. Fair distribution at launch means nothing if the supply expands immediately afterward in ways that were not disclosed.
### Holder Concentration as Validation
Token holder concentration in the weeks following an LBP reveals whether the distribution was real or cosmetic. A project where the top 10 holders control 70% of the supply after an LBP has not achieved broad distribution. A project where the top 10 holders control 30% and the next 100 holders control another 30% has achieved something closer to the stated goal. On-chain analysis tools make this data accessible within hours of the LBP concluding.
Comparing holder concentration before and after an LBP is more informative than focusing on the LBP itself. If concentration decreases, the LBP worked. If concentration increases, the LBP was theater. The mechanism does not prevent bad actors from using it. It only removes the excuse that fair distribution was impossible because of technical constraints.
## When LBPs Fail: Insufficient Demand and Extraction Configurations
LBPs fail when demand is insufficient to counteract the weight curve, leaving the token near its floor price at the end of the event. They also fail when the team configures them to extract maximum value from early buyers rather than discover fair price. Both failure modes are observable in real time.
A project that ends its LBP with 80% of tokens still in the pool has not found demand. The price discovery process revealed that the market does not value the token at the levels the team expected. This is useful information for participants, because it indicates that waiting further or avoiding the project entirely was the correct choice. The failure is not the LBP mechanic. The failure is the project itself.
An extraction configuration is harder to spot in advance but becomes obvious in hindsight. A team that sets a starting price 50 times higher than any defensible valuation, uses a steep weight curve, charges high fees, and pauses swaps multiple times during the event is not running a price discovery process. They are running an extraction process that uses LBP terminology. The difference between the two is visible in the parameter choices and in the team's behavior during the event.
### Comparative Advantage Over Fixed-Price IDOs
Fixed-price IDO launchpads allocate tokens to whoever can transact in the first block. This favors bots, insiders, and participants with low-latency infrastructure. It does not favor broad distribution or price discovery. The result is that most tokens launched through fixed-price IDOs immediately dump after listing, because the initial allocation went to participants optimizing for immediate resale rather than long-term holding. Data from 2021 and 2022 shows that 90% of fixed-price IDOs on major launchpads traded below their launch price within 30 days.
LBPs do not eliminate this problem, but they reduce it. By removing the incentive to buy immediately, they filter for participants who have done enough research to understand the mechanic and wait for a reasonable entry. Those participants are more likely to hold through volatility, because they entered at a price they believed was fair rather than a price they hoped they could flip. The data on LBP-launched tokens is more favorable. Projects launched through well-configured LBPs maintain their post-launch price more consistently than fixed-price launches, and holder concentration is lower on average.
## Reading LBP Outcomes for Low-Cap Token Timing
For participants focused on low-cap token acquisition, LBPs offer a repeatable timing advantage. The mechanic is transparent. The weight curve is public. The price action is observable in real time. This creates a structured opportunity to enter at or near the discovered floor price, which is the optimal entry for a participant intending to hold.
The process is straightforward. Identify the LBP in advance. Review the parameters: starting weight, ending weight, duration, fees, reserve asset. Estimate a reasonable valuation for the project based on comparable tokens and the team's claims. Calculate the implied floor price at the end of the LBP assuming minimal buying pressure. Set a target entry price above that floor but below the starting price. Monitor the LBP as it runs. Enter when your target is reached or when the curve indicates that buying pressure is stabilizing the price near your target.
This approach removes the emotional component of launch participation. You are not reacting to hype or fear. You are executing a pre-determined entry based on observable mechanics. The LBP structure makes this possible in a way that fixed-price launches do not, because the price curve is predictable and the incentive to rush is removed.
### Liquidity Depth After the LBP
The [liquidity depth](https://altcoininvestor.com/minimum-liquidity-depth-low-cap-positions/) available after the LBP concludes determines whether your acquisition strategy can convert into an exit strategy. A project that raises $300,000 in an LBP and seeds $250,000 of liquidity on Uniswap has provided enough depth for small positions. A project that raises $50,000 and seeds $30,000 has not. The ratio between funds raised and liquidity seeded is a signal of team intent and operational competence.
Before entering an LBP, check the announced liquidity migration plan. If the team has not disclosed how much liquidity they will seed or when they will seed it, that is a red flag. Legitimate projects announce these details before the LBP begins. Projects that remain vague are either unprepared or planning to retain most of the raised capital rather than deploying it into liquidity.
## The Takeaway
A Liquidity Bootstrapping Pool is a price discovery mechanism that penalizes speed and rewards patience, configured through transparent on-chain parameters that reveal whether a team intends fair distribution or value extraction. The weight curve, starting price, fees, and reserve asset choice are observable signals. Teams that set reasonable starting prices, use gradual weight curves, charge low fees, and refrain from pausing swaps are signaling confidence in their project and respect for participants. Teams that do the opposite are signaling extraction. The mechanic does not prevent bad actors from launching. It only makes their intentions visible to anyone who examines the parameters. For a participant interested in acquiring low-cap tokens at fair prices, LBPs provide a structured timing advantage unavailable in fixed-price launches, provided you understand the curve and wait for equilibrium rather than buying into the opening price. The failure mode to avoid is not the LBP itself but the project behind it, which the LBP parameters and post-launch behavior will reveal if you are watching.
## Frequently Asked Questions
### How does a liquidity bootstrapping pool determine token price?
Price is determined by the ratio of token weights in the pool. A typical LBP starts with weights of 96% project token and 4% stablecoin, creating a high initial price. Over 72 hours the weights shift toward 50:50, applying constant downward pressure on price. Each purchase pushes the price back up. The final price is the equilibrium between programmatic weight changes and buying activity. Unlike fixed-price sales, the price discovery happens gradually across the entire event duration.
### Why do LBP token prices fall after launch?
The falling price is the mechanism working as intended, not a sign of failure. LBPs use declining weight curves that reduce the project token's weight over time, which lowers its price unless buying pressure counteracts the decline. Teams deliberately set high starting prices to allow gradual discovery of fair value. The goal is to remove the advantage of buying immediately, unlike fixed-price launches where the first buyer gets the best price. Falling prices during an LBP indicate the weight curve is functioning correctly.
### When is the best time to buy tokens during an LBP?
The optimal entry is typically in the second half of the event, after initial volatility subsides and the price approaches equilibrium. Historical data shows participants who wait until day two of a 72-hour LBP pay 20% to 40% less than those who enter in the first six hours. Monitor the price curve, estimate fair value based on comparable projects, and enter when the price reaches your target. Avoid buying during FOMO spikes or in the opening hours when the price is artificially elevated by the starting weight configuration.
### What LBP parameters indicate a fair launch versus an extraction?
Fair launches use gradual weight curves over 72 hours, starting prices that are high but defensible relative to valuation, fees below 0.5%, and no pause-swap interventions. Extraction configurations use steep curves over 24 hours, starting prices 50x or higher than any reasonable valuation, fees above 0.5%, and frequent trading pauses. Teams that commit publicly not to pause swaps except for exploits signal fairness. Check whether the team discloses liquidity migration plans and vesting schedules before the LBP begins.
### What happens to liquidity after an LBP ends?
Funds raised during the LBP are typically used to seed liquidity on Uniswap or another AMM. Teams that migrate liquidity within 24 hours signal operational readiness. Delays of several days or weeks indicate capital control issues or poor planning. The ratio between funds raised and liquidity seeded reveals intent. A project raising $300,000 should seed at least $200,000 to $250,000 in liquidity. Projects that seed less than 50% of funds raised are prioritizing capital retention over participant liquidity, which is a red flag.
The Weekly Yield Report
You have just learned to read weight curves, fee structures, and migration timing across five LBP parameters. Those signals change with every launch.
Every Thursday: where crypto yield actually is - stablecoins, liquid staking and DeFi lending, with the risk named next to the rate and what changed since last week.
[Get it free every Thursday](#/portal/signup)
Free. No trade calls, no allocations, no hype. Unsubscribe in one click.
### Best Cryptocurrency Exchanges Compared: Fees, Security, Yield
URL: https://altcoininvestor.com/best-crypto-exchanges-2/
Last updated: 2026-10-14T19:06:05.000Z
## What This Comparison Covers

Coinbase restructured its fee schedule on September 16, 2026\. Entry-level spot trading now costs 0.50% maker and 0.90% taker in the US, 0.25%/0.50% in the EU and UK, and 0.09%/0.10% in markets like Brazil and India. The headline trading fee is the smallest cost when you factor in deposit fees, spread, and withdrawal charges.
This comparison evaluates seven centralized exchanges across trading fees, custody model, security track record, regulatory jurisdiction, coin availability, and income products. The goal is not to crown a winner. The goal is to match your specific use case to the exchange that handles it best.
Selection criteria: trading fee structure (including volume discounts), cold storage ratio, insurance coverage, historical security incidents, number of supported coins, staking and yield product APY, regulatory compliance jurisdiction, and fiat on-ramp costs. No affiliate scoring.
## Best For Beginners: Coinbase and Kraken

Coinbase remains the default beginner choice. The interface is clear, the mobile app works, and customer support responds in English without requiring a ticket queue. But buying $200 of Bitcoin costs roughly $5.68 in fees, a 2.84% hit. That number comes from the simple buy interface, not Coinbase Advanced.
If you are willing to spend fifteen minutes learning the difference between a limit order and a market order, Kraken offers a better deal. The instant-buy fee is a flat 1%, displayed at the purchase screen. No hidden spread markup.
Both exchanges hold roughly 95-98% of customer assets in cold storage. Both have operated for over a decade without losing customer funds to a breach. Coinbase maintains a $255 million insurance fund covering hot wallet holdings. Kraken does not maintain a formal insurance pool but has never filed a claim.
Coinbase supports 410 cryptocurrencies. Kraken supports 450-772 depending on how you count derivative markets. For a new user buying Bitcoin, Ethereum, or a top-twenty altcoin, the difference does not matter.
Verdict: Coinbase if you want the simplest possible interface and are willing to pay for it. Kraken if you can handle a slightly steeper learning curve and want to keep more of your capital.
## Best For Advanced Traders: Binance and OKX
High-volume traders need three things: low fees, deep liquidity, and execution reliability during volatile price moves. Binance and OKX deliver all three.
Binance charges 0.10% maker and taker fees at the entry level. At higher volume tiers, those rates drop further. OKX offers similar fee schedules with slightly better rates for derivatives traders. Both platforms maintain liquidity depth that allows six-figure spot orders to execute without meaningful slippage.
Neither exchange discloses exact cold storage ratios. OKX claims approximately 95% cold storage and operates a $700 million risk shield fund. Binance operates a $1 billion SAFU fund but does not publish detailed reserves or third-party audit reports.
That opacity matters. Over $3.4 billion was stolen from cryptocurrency platforms in 2025 alone, including the $1.5 billion Bybit hack. Cold storage ratios and insurance funds mean nothing if the exchange does not publish proof of reserves.
For US-based traders, Binance.US operates under a separate legal entity with lower coin availability and higher regulatory scrutiny. OKX does not serve US customers. If you are subject to US tax jurisdiction, [Kraken or Gemini](https://altcoininvestor.com/best-crypto-exchange-yield-deployment/) become the default advanced-trading platforms.
Verdict: Binance for global users who prioritize liquidity and coin selection. OKX for derivatives traders who want slightly better margin rates. Neither if you are a US person.
## Best For Low Fees: MEXC
MEXC charges 0% maker fees and 0.05% taker fees for spot trading. That is the lowest fee structure on any major centralized exchange in 2026.
The tradeoff is security opacity and regulatory uncertainty. MEXC does not publish cold storage ratios, does not maintain a disclosed insurance fund, and operates under a Seychelles license. The platform lists over 1,800 trading pairs, most of which have minimal liquidity.
If you are trading a low-cap altcoin that is not available on Binance or Kraken, MEXC is often the only liquid venue. If you are trading Bitcoin or Ethereum and leaving funds on the exchange for more than a few hours, the fee savings do not justify the custody risk.
MEXC does offer stablecoin yield products with advertised APYs up to 14% on USDT. Those rates are unsustainably high compared to [DeFi lending protocols](https://altcoininvestor.com/best-yield-bearing-stablecoins/) that pay 6-8% on similar collateral. High advertised yield on a platform with no disclosed insurance fund is a red flag, not a feature.
Verdict: Use MEXC for specific low-cap trades where no alternative venue exists. Do not use it as a custody platform. Do not chase the stablecoin yield.
## Best For Staking: Binance and Kraken
Centralized exchange staking products offer yields between 2% and 8% with no technical setup required. The simplest user experience comes from Binance and Kraken.
Binance offers BNB staking yields ranging from 0.05% to 14.25% APY depending on the lockup term. USDC products pay around 3% APY. ETH staking through Binance integrates with liquid staking protocols like Lido and typically returns 3-5% APY after fees.
Kraken charges a 30% commission on flexible staking and 12-26% commission on bonded staking depending on asset and volume tier. Ethereum staking on Kraken generates between 2.4% and 4% APY. That is lower than self-custodied staking through Lido or Rocket Pool, which currently yield 3-4% APY after Lido's 10% protocol fee.
The custody tradeoff matters here more than anywhere else. Staking requires locking tokens for a period of time. If the exchange is hacked or goes insolvent during that period, you cannot withdraw.
Kraken has operated since 2013 without losing customer funds to a breach. Binance has operated since 2017 and weathered multiple regulatory investigations without a custody incident. Both have stronger operational track records than newer platforms.
If you hold more than $10,000 in crypto and want staking yield, the correct answer is not an exchange. The correct answer is self-custody with a [hardware wallet](https://altcoininvestor.com/best-hardware-wallets-compared/) and direct staking through Lido or Rocket Pool.
Verdict: Binance if you want the widest selection of staking products and are comfortable with regulatory opacity. Kraken if you want a cleaner compliance track record and are willing to accept slightly lower yields.
## Best For Regulatory Compliance: Kraken and Gemini
US-based traders who need regulatory certainty have two options: Kraken and Gemini.
Kraken operates under a FinCEN Money Services Business license and state-level money transmitter licenses. It maintains approximately 95% cold storage, responds to regulatory inquiries, and has never lost customer funds to a hack. Fees range from 0.25% maker / 0.40% taker at the entry tier to 0.00% / 0.02% for traders above $250 million in 30-day volume.
Gemini operates under a New York Department of Financial Services BitLicense, the strictest state-level crypto regulation in the US. It holds approximately 95% of assets in cold storage and maintains a $200 million insurance fund covering cold custody. Fees on Gemini ActiveTrader fall from 0.60% maker / 1.20% taker at the entry tier to 0.00% / 0.02% for traders above $250 million in 30-day volume.
Both exchanges charge higher fees than Binance or OKX. That is the cost of operating under US jurisdiction with full KYC and AML compliance. The benefit is legal recourse. If Kraken or Gemini freezes your account or loses your funds, you can sue in a US court under state and federal law.
In 2026, most major jurisdictions including the EU, the US, and the UK require centralized exchanges to follow strict anti-money laundering and know-your-customer rules. Binance and OKX comply where they must. Kraken and Gemini assume compliance is the baseline, not the ceiling.
Verdict: Kraken offers the better fee structure and broader coin selection. Gemini offers the stronger regulatory wrapper and better insurance coverage. Choose Kraken unless you hold seven figures and want the BitLicense protection.
## Subscription Models: Coinbase One and Kraken Plus
Coinbase One offers zero trading fees on hundreds of assets for a monthly subscription fee of $19.99 in the UK. Depending on your tier, you get a monthly allowance of zero-fee trading ranging from $500 to $5,000, or unlimited volume on the Premium plan.
Kraken Plus subscribers pay no transaction fees. The subscription cost was not disclosed in available sources, but the value proposition is identical: convert per-trade fees into a fixed monthly cost.
Both models make sense if you trade frequently with moderate size. A trader executing $10,000 per month in volume at 0.50% per side pays $100 in fees. The subscription pays for itself.
A trader executing $10,000 per month in volume at 0.10% per side pays $20 in fees. The subscription costs more than the fees it eliminates.
Run the math for your actual trading volume. Do not assume the subscription is cheaper without calculating the breakeven point.
## CEX vs DEX: When to Use Each
Centralized exchanges still dominate with 87-92% of total crypto trading volume. That share is falling. Decentralized exchanges took a record 19.5% share of total spot trading volume in July 2026, while combined centralized volumes fell 23.9% to $3.76 trillion.
CEXs are better for fiat on-ramps, fiat off-ramps, account recovery, and deep liquidity in major trading pairs. If you need to convert $50,000 from USD to Bitcoin and then trade Bitcoin for Ethereum, a centralized exchange offers lower friction and better pricing than any decentralized alternative.
DEXs are better for self-custody, direct onchain access, DeFi protocol integration, and trading tokens that will never list on a major centralized exchange. If you want to [trade on Arbitrum](https://altcoininvestor.com/best-layer-2-networks/) or provide liquidity to a Uniswap pool, you need a [DeFi wallet](https://altcoininvestor.com/best-defi-wallet/) and a decentralized exchange.
The custody risk matters more than the fee difference. While custodial platforms offer convenience and familiar user experiences, the concentrated risk they create has proven catastrophic when exploited. Over $3.4 billion stolen in 2025\. Most of that came from centralized platforms, not DeFi protocols.
If you are holding for more than a few days, move assets off the exchange. If you are trading actively and keeping funds onchain creates execution friction, accept the custody risk but size your exchange balance accordingly.
## How to Pick Among These Exchanges
Fee schedules change quarterly, so verify the current rate on each exchange's official fee page before opening an account. Regional pricing varies wildly. Coinbase charges 0.50%/0.90% in the US and 0.09%/0.10% in Brazil as of September 2026.
Cold storage ratios and insurance funds matter only if the exchange publishes proof of reserves. Binance claims a $1 billion SAFU fund but does not publish third-party audits. Kraken publishes no insurance fund but has operated for over a decade without a breach. The track record matters more than the marketing.
If you are a US person, jurisdiction determines your options. Binance.US has lower coin availability than global Binance. OKX does not serve US customers. Kraken and Gemini remain the best options for US-based traders who need compliance certainty and broad altcoin access.
If you hold more than $10,000 in crypto, the exchange is not your wallet. Move assets to cold storage between trades. Use the exchange as execution infrastructure, not custody infrastructure.
## The Takeaway
The headline trading fee is not the real cost. A 0.10% trading fee combined with a $25 wire withdrawal fee costs more than a 0.40% trading fee with free ACH withdrawals if you move funds off the exchange every month.
Calculate your total round-trip cost: deposit method fee plus trading spread plus trading fee plus withdrawal fee. That number determines which exchange is cheapest for your specific use case. The answer changes depending on whether you fund with ACH, wire, or stablecoin and whether you withdraw monthly or hold onchain.
Security track record beats advertised insurance. Kraken has no insurance fund and has never lost customer funds. Bybit had an insurance fund and lost $1.5 billion. Operational security matters more than the size of the reserve pool.
## Frequently Asked Questions
### Which crypto exchange has the lowest trading fees?
MEXC offers the lowest spot trading fees at 0% maker and 0.05% taker as of October 2026\. However, MEXC does not disclose cold storage ratios or maintain a public insurance fund, creating higher custody risk. For traders prioritizing security alongside low fees, Binance charges 0.10% maker and taker at entry level with disclosed insurance coverage. Always calculate total cost including deposit and withdrawal fees, not just trading fees.
### Is it safe to keep crypto on an exchange?
Over $3.4 billion was stolen from cryptocurrency platforms in 2025, including the $1.5 billion Bybit hack. Exchanges like Coinbase and Kraken hold 95-98% of assets in cold storage and have decade-long track records without customer fund loss. However, custody risk remains higher than self-custody with a hardware wallet. Use exchanges for active trading but move holdings exceeding $10,000 to cold storage between trades.
### What is the difference between Coinbase and Coinbase Advanced?
Coinbase simple buy charges approximately 2.84% in combined fees and spread on small purchases. Coinbase Advanced offers limit and market orders with transparent maker-taker pricing starting at 0.50% maker and 0.90% taker in the US as of September 2026\. Both use the same custody and security infrastructure. Advanced requires understanding order types but cuts fees by roughly 60-75% for the same trade size.
### Can US residents use Binance?
US residents must use Binance.US, a separate legal entity operating under US jurisdiction. Binance.US has lower coin availability, reduced leverage options, and higher regulatory scrutiny than global Binance. Many altcoins available on international Binance do not list on Binance.US. US traders requiring broad altcoin access and regulatory compliance typically use Kraken or Gemini instead.
### Should I stake crypto on an exchange or use DeFi?
Exchange staking offers simplicity: Binance and Kraken handle validator setup and return 2-8% APY depending on asset. The tradeoff is custody risk and commission fees between 10-30%. Self-custodied staking through Lido or Rocket Pool returns 3-4% APY on Ethereum after a 10% protocol fee, with no exchange custody risk. For holdings above $10,000, DeFi staking with hardware wallet custody delivers better risk-adjusted returns.
The Weekly Yield Report
You have just compared seven exchanges across fees, custody models, and security track records. Those numbers will change within sixty days as platforms restructure pricing and regulatory requirements shift.
Every Thursday: where crypto yield actually is - stablecoins, liquid staking and DeFi lending, with the risk named next to the rate and what changed since last week.
[Get it free every Thursday](#/portal/signup)
Free. No trade calls, no allocations, no hype. Unsubscribe in one click.
### Best Ways To Earn Passive Crypto Income In 2026
URL: https://altcoininvestor.com/how-to-earn-passive-crypto-income-2026/
Last updated: 2026-10-14T17:06:27.000Z
## The Six Approaches Worth Your Time
Passive crypto income in 2026 breaks into six categories with measurably different risk profiles: yield-bearing stablecoins, proof-of-stake network staking, DeFi lending protocols, liquidity pool farming, Bitcoin mining, and airdrop farming. The spread runs from 3.6% APY on Sky.money's savings rate to 18.5% nominal staking on Cosmos, but the headline number is never the full story.
The ranking that follows is organized by risk-adjusted sustainability, not headline yield. If you want the highest number on a dashboard, look elsewhere. This is about what you actually keep after fees, inflation, impermanent loss, and taxes.
I've sorted these by effective yield after you strip out the marketing.
## Yield-Bearing Stablecoins: 3.6-9% APY, Lowest Volatility Risk
Yield-bearing stablecoins combine a dollar peg with automatic compounding. You hold one token, it accrues yield continuously, and you redeem for more dollars than you deposited. No staking interface, no manual claims, no LP position management.
The four with measurable track records: sUSDe pays 7.1%, sUSDS pays 3.6%, sFRAX pays 4.1%, and USDY pays 4.65%. Those rates come from different risk stacks. sUSDe earns funding rates on short perpetual positions. sUSDS earns T-bill interest plus RWA allocations managed by Sky. sFRAX earns a blend of lending yield and AMO revenue. USDY wraps tokenized short-duration U.S. debt instruments. You are not taking the same risk when you chase 7.1% on sUSDe that you are when you accept 3.6% on sUSDS.
The risk is not price volatility in your crypto holdings. The risk is depeg. Curve's 3pool lost more than 10% during the USDC depeg in March 2023 before recovering. USDC holders on Coinbase saw no loss. The difference is liquidity venue, not stablecoin quality.
Capital requirement: $100 minimum in practice, though gas costs on Ethereum mainnet eat into smaller positions. If you are deploying under $1,000, use an L2 or a CeFi platform. Tax treatment: the IRS considers yield received as ordinary income at the time of receipt, not sale.
Best use case: the first dollars you allocate to crypto yield. Not speculative, not leveraged, not exposed to altcoin price swings. [Step-by-step setup, platform comparisons, and gas-cost math covered here](https://altcoininvestor.com/how-to-earn-passive-income-stablecoins-2026/).
## Proof-of-Stake Network Staking: 2-5% Real Yield After Inflation
Proof-of-stake staking lets you lock your tokens to help validate transactions on a blockchain. In exchange, you earn newly minted tokens plus a share of transaction fees. Ethereum, Cosmos, Solana, and Cardano all use variants of this model.
Ethereum staking yields sit around 3-4% APY in 2026, compressed from earlier years as total staked ETH has grown. Solo stakers who run their own validator node earn approximately 4-5% including MEV rewards and maintain full custody. The tradeoff: you need 32 ETH ($64,000+ at $2,000 ETH), technical knowledge to operate a node, and willingness to accept slashing risk if your validator misbehaves.
Liquid staking protocols offer an easier entry. You deposit ETH, receive a liquid staking derivative like stETH or rETH, and earn typical APY of 3.5-4% after protocol fees. The derivative can be used as collateral in DeFi or sold if you need liquidity. The downside: counterparty risk. Your ETH sits with the protocol. Kraken's staking program was shut down for U.S. customers in 2023 before reopening under new terms, a reminder that regulatory risk is real.
Cosmos advertises 18.5% staking APY, the highest nominal rate among major proof-of-stake networks. That number is misleading. Cosmos inflates supply by 10-14% annually to pay stakers. After you adjust for dilution, the real yield falls to 2-8%. If everyone stakes, no one gains purchasing power. You earn more tokens, but each token represents a smaller slice of the network.
Unbonding periods vary by network. Ethereum requires no lockup if you use liquid staking, but direct staking was locked until the Shanghai upgrade. Cosmos requires 21 days. Solana requires a few days. You cannot sell instantly if the market moves against you.
Tax treatment: staking rewards are taxed as ordinary income when received, then again as capital gains or losses when sold. Track the fair market value at receipt or you will overpay.
Best use case: long-term holders who planned to hold ETH or another proof-of-stake asset regardless of yield. If you were buying for speculation, staking does not change your risk profile. You are still exposed to price volatility. [Ethereum's staking documentation walks through solo vs. pooled options](https://ethereum.org/en/staking/).
## DeFi Lending Protocols: 3.8-9% APY on Stablecoins, Utilization-Dependent
DeFi lending protocols let you deposit stablecoins or other crypto assets into a smart contract pool. Borrowers take loans from that pool and pay interest. You earn a share of that interest, minus a protocol fee. The yield fluctuates based on borrowing demand.
Aave V3 holds $76.6 billion in total value locked and offers USDC supply APY between 3.8% and 5.2% depending on utilization. Morpho Blue, also at $76.6 billion TVL, offers 4.1-6.8% via curated MetaMorpho vaults. Compound III offers 3-5%. The spread across eight major protocols runs roughly 3-4 percentage points on any given day, and none of those rates are fixed. A pool advertising 15% APY this week might drop to 4% by the time you have settled in, because everyone else saw the same number and piled in behind you.
Utilization rate mechanics explain the variance. Below the optimal utilization kink, borrowing rates follow a low slope (roughly 4% annualized). Above the kink, rates spike to discourage further borrowing and attract more supply. Lenders earn the weighted average of what borrowers pay, minus the protocol cut. If 60% of deposited USDC is lent out at 6% and the protocol takes 10%, you earn roughly 3.24%.
Morpho Blue's advantage comes from isolated markets with custom curators (Steakhouse, MEV Capital, Re7) optimizing specific risk profiles. Each vault targets a different borrower segment and collateral type. That specialization can produce higher yields, but it also concentrates risk. Aave spreads exposure across all borrowers in a shared pool.
Audit history matters. Aave V3 faced roughly $190 million in bad debt in April 2026 from an rsETH exploit. The protocol resolved it by May 25, but the incident shows that smart contract risk is real even on the largest platforms. Morpho, Compound, Spark, and Euler have all been audited multiple times, but an audit is not insurance.
Capital requirement: $100+ in practice, but Ethereum mainnet gas costs make $1,000+ more practical. Arbitrum, Optimism, and Polygon offer the same protocols with lower fees. Tax treatment: interest earned is ordinary income. If you are supplying ETH and earning ETH, you owe tax on the fair market value of each ETH earned, then again on any gain when you sell.
Best use case: stablecoin holders willing to accept smart contract risk and rate volatility in exchange for 1-3 percentage points more yield than [yield-bearing stablecoins](https://altcoininvestor.com/passive-income-stablecoins/). Not appropriate for your entire stack. Not appropriate if you cannot afford to lose the principal.
## Liquidity Pool Farming: 5-15% APY, Impermanent Loss Erodes Gains
Liquidity pool farming means depositing two tokens into a decentralized exchange pool so that traders can swap between them. You earn a share of trading fees plus any incentive tokens the protocol distributes. Uniswap, Curve, and Balancer are the largest venues.
Uniswap V3 introduced concentrated liquidity, allowing LPs to allocate capital within a specific price range. Capital efficiency means your dollars work harder when the price stays in your chosen range, earning higher fees per dollar deposited. The tradeoff: if the price moves outside your range, your position becomes inactive and earns zero fees. Uniswap V3 offers multiple fee tiers (0.01%, 0.05%, 0.3%, 1%) depending on the pair. Higher-fee tiers compensate for higher volatility or lower volume.
Curve specializes in stablecoin and pegged-asset swaps, offering low slippage and minimal impermanent loss. The 3pool (USDC, USDT, DAI) and crvUSD pools earn typical APY of 3-6% base plus 1-4% in CRV emissions or MEV rebates. That structure works as long as the three stablecoins maintain their pegs. The March 2023 USDC depeg reminder: even stablecoin pools carry risk.
Impermanent loss happens when the prices of your two tokens diverge. If you deposit equal values of ETH and USDC, and ETH doubles, your pool share rebalances continuously to maintain the 50/50 ratio. You end up with less ETH and more USDC than if you had simply held both. The bigger the price swing, the larger the loss relative to holding. Fee income can offset impermanent loss, but only if volume is high enough.
For volatile asset pairs on Uniswap V3, advertised APY often runs 5-15%. Impermanent loss can erase half of that or more if you pick the wrong range or hold through a large price move. For stablecoins on Curve or Balancer, advertised APY runs 3-12%, and impermanent loss is minimal if pegs hold.
Range risk in Uniswap V3 is the liquidity provider equivalent of selling options. You collect premium (fees) in exchange for the risk that price moves away and you lose participation. [Uniswap's liquidity documentation explains range selection and fee math](https://docs.uniswap.org/concepts/introduction/liquidity).
Capital requirement: $500+ to make gas costs tolerable on Ethereum mainnet; $100+ on L2s. Tax treatment: every rebalance is a taxable event if the pool auto-compounds. LP rewards are ordinary income when received. Impermanent loss is not deductible until you exit the position and realize it.
Best use case: traders who already hold both tokens in a pair and believe the price ratio will stay range-bound. Not a passive set-and-forget strategy despite the name. Requires active monitoring and range adjustment. Not appropriate for beginners.
## Bitcoin Mining: Break-Even at $0.08-$0.12 per kWh, High Capital Outlay
Bitcoin mining in 2026 is profitable for operators running sub-15 J/TH hardware at power costs under roughly $0.08-$0.12 per kWh. The April 2024 halving reduced the block subsidy from 6.25 BTC to 3.125 BTC, cutting miner revenue in half overnight. Transaction fees remain below 1% of total block rewards in most months. Hashprice hovers around $29 per petahash per day as of July 2026.
Hardware efficiency determines viability. An Antminer S21 XP (13.5 J/TH) breaks even at roughly $0.088 per kWh. An S23 Hydro (9.5 J/TH) breaks even at roughly $0.124 per kWh. Older units like the S19 series (30+ J/TH) are unprofitable almost everywhere unless power is free or subsidized. The upfront cost for competitive hardware runs $2,000-$5,000 per unit. A small home operation with two S21 XPs requires $4,000-$10,000 in capital before you account for electrical work, cooling, and noise mitigation.
Mining pools charge 1-3% of your rewards. You also pay transaction fees when moving BTC from the pool to your wallet. Electricity is the recurring cost that determines long-term profitability. If you pay residential rates above $0.12 per kWh, you are mining at a loss in 2026 unless Bitcoin's price rises faster than difficulty.
Home mining is not passive. Hardware fails, firmware needs updates, pools change payout terms, and difficulty adjusts every two weeks. The noise and heat are not trivial. A single S21 XP sounds like a hairdryer running 24/7 and produces enough heat to warm a small room in winter or overwhelm your air conditioning in summer.
Cloud mining services advertise passive Bitcoin income with no hardware. Most are scams or poor deals. You pay upfront for a hashing contract, the operator takes a large cut, and you hope the payout exceeds what you would have earned by simply buying BTC. The math rarely works in your favor.
Tax treatment: mined BTC is ordinary income at fair market value on the day you receive it. Electricity and hardware costs are deductible as business expenses if you report mining as a business. Capital gains apply when you sell.
Best use case: hobbyists with access to cheap power and technical skills, or commercial operators with scale. Not a passive income strategy for most people. Scenario-based ROI examples and pool comparisons here.
## Airdrop Farming: Speculative, Unpredictable, Occasionally Large
Airdrop farming means using protocols before they launch a token, hoping the team rewards early users with a free allocation. The strategy worked for Uniswap (400 UNI per user in 2020), dYdX, Arbitrum, Optimism, and others. It has also produced zero return for hundreds of hours of testnet transactions and Discord participation.
There is no reliable income stream. You spend gas fees, time, and sometimes capital to interact with unproven protocols. The payout, if any, arrives months or years later. The expected value is unknowable in advance. Some farmers treat it as a part-time job, rotating through dozens of protocols per month. Most would earn more per hour working a second job and buying crypto with the proceeds.
The operational cost is real. Bridging to testnets, minting NFTs, providing liquidity on unaudited DEXs, and maintaining activity thresholds all cost gas. If you spend $500 in gas farming ten protocols and only two airdrop, you need those two to pay more than $250 each just to break even.
Airdrop eligibility criteria have tightened. Teams now exclude wallets with obvious Sybil behavior, require sustained activity over months, or weight allocations by capital deployed rather than binary participation. The easy playbook from 2020-2021 no longer works.
Tax treatment: airdropped tokens are ordinary income at fair market value on the day you receive control. If the token has no liquid market, valuation becomes a judgment call. The IRS has not issued clear guidance. When you sell, capital gains or losses apply from that basis.
Best use case: users who would test new protocols anyway. Not a standalone income strategy. Not worth optimizing for unless you treat it as entertainment with occasional upside. The risk-adjusted return is worse than any of the five categories above.
## The Takeaway
The number you see on a DeFi dashboard is almost never the number you keep. Yield-bearing stablecoins and blue-chip staking pay 3-5% after fees with the least operational overhead. DeFi lending and LP farming pay 5-12% if you can tolerate rate volatility, impermanent loss, and smart contract risk. Mining and airdrops require capital, technical skill, or speculative patience that most people lack.
Start with the strategy that matches your skill level, not the one with the highest advertised APY. If you cannot explain how the yield is generated, you are not earning passive income. You are taking risk you do not understand. [Custody matters as much as yield](https://altcoininvestor.com/best-crypto-wallets/). A 9% return in a non-custodial wallet you control beats 12% on a platform that can freeze withdrawals.
Track every deposit, every reward claim, every gas fee. The IRS requires it. [Crypto tax software that handles autocompounding and LP rebalancing correctly](https://altcoininvestor.com/best-crypto-tax-software-defi-yield-staking/) will save you more money in April than an extra percentage point of yield.
Allocate no more than 10-20% of your crypto portfolio to any single yield strategy. Concentration risk has ended more portfolios than smart contract exploits. Diversify across mechanisms, platforms, and collateral types. The goal is to still be earning in 2027, not to maximize this quarter's dashboard number.
## Frequently Asked Questions
### What is the safest way to earn passive crypto income in 2026?
Yield-bearing stablecoins like sUSDS (3.6% APY) and USDY (4.65% APY) offer the lowest volatility risk. You hold a dollar-pegged token that accrues yield automatically. The risk is depeg, not price swings. For even lower risk, use a regulated CeFi platform offering stablecoin interest, though rates are typically 1-2 percentage points lower than DeFi. Always compare the yield source (T-bills, lending pools, perpetual funding) before deploying capital.
### How much can I realistically earn from crypto staking?
Ethereum staking yields 3-4% APY in 2026, or 4-5% if you run a solo validator and capture MEV. Liquid staking via Lido or Rocket Pool pays 3.5-4% after protocol fees. Cosmos advertises 18.5%, but 10-14% annual inflation cuts real yield to 2-8%. After taxes (ordinary income on rewards, capital gains on sale), expect 2-3% real after-tax return on Ethereum, less on inflationary chains. Staking works for long-term holders, not yield chasers.
### What are the risks of DeFi lending protocols like Aave?
Smart contract risk is the largest. Aave V3 faced $190 million in bad debt from an April 2026 exploit, resolved by May. Audit history reduces but does not eliminate this risk. Utilization risk is second: if borrowing demand drops, your APY falls from 8% to 3% overnight. Liquidity risk is third: during market stress, you may not be able to withdraw instantly. Collateral risk is fourth: if you lend volatile assets, liquidations can cascade. Diversify across protocols and never deploy funds you cannot afford to lose.
### Is Bitcoin mining still profitable at home in 2026?
Only if your electricity costs under $0.08-$0.12 per kWh and you buy efficient hardware (under 15 J/TH). An Antminer S21 XP breaks even at $0.088/kWh with July 2026 hashprice of $29/PH/day. Residential power in most of the U.S. runs $0.12-$0.18/kWh, making mining unprofitable. Upfront hardware cost is $2,000-$5,000 per unit. Noise, heat, and maintenance are not passive. Cloud mining services take large cuts and rarely outperform simply buying Bitcoin. Home mining is a hobby, not an income strategy, for most people.
### How are crypto staking and DeFi yields taxed?
Staking rewards, lending interest, and LP fees are ordinary income at fair market value when received. If you earn 1 ETH worth $2,000, you owe income tax on $2,000\. When you sell that ETH, capital gains or losses apply from the $2,000 basis. Impermanent loss is not deductible until you exit the LP position. Autocompounding creates taxable events each time rewards are claimed and reinvested. Track every transaction or use crypto tax software that handles DeFi. Failing to report is not worth the audit risk.
The Weekly Yield Report
You just compared six income methods paying between 2% and 9% real yield after fees. Those numbers will shift next month as utilization and inflation adjust.
Every Thursday: where crypto yield actually is - stablecoins, liquid staking and DeFi lending, with the risk named next to the rate and what changed since last week.
[Get it free every Thursday](#/portal/signup)
Free. No trade calls, no allocations, no hype. Unsubscribe in one click.
### Strive's $280M Bitcoin Buy: Equity Dilution Strategy
URL: https://altcoininvestor.com/strive-280m-bitcoin-equity-dilution-strategy/
Last updated: 2026-10-17T18:00:06.000Z
Strive increased its bitcoin holdings by 3,311 BTC between October 5 and October 9, 2026, purchasing at an average price of approximately $84,500 per BTC including fees and expenses. The total acquisition value reached $280 million, marking the company's largest bitcoin purchase since its January 2026 all-stock merger with Semler Scientific, which added approximately 5,048 BTC to the treasury. The purchase lifted Strive's total bitcoin holdings to 32,773 BTC as of October 9, narrowing the gap with MARA's 35,577 BTC to just 2,804 bitcoin.
The acquisition structure matters more than the headline figure for understanding institutional bitcoin treasury strategy. Strive financed the purchase through warrant exercises that generated approximately $208 million and through share issuance rather than debt. Effective common shares outstanding increased from approximately 100.94 million on October 2 to 110.39 million on October 9, an increase of about 9.4 percent. Class A shares alone rose by more than 9.46 million. Approximately 15.3 million warrants remained outstanding following the transactions.
This financing method represents a distinct institutional approach to bitcoin treasury accumulation. The equity dilution strategy depends entirely on bitcoin price appreciation to justify shareholder returns, differing from debt-based accumulation strategies used by other public companies holding bitcoin. The structure creates direct shareholder exposure to bitcoin price volatility without the leverage amplification or interest expense associated with debt financing.
## Warrant Exercise Timing and Institutional Bitcoin Accumulation
The timing of warrant exercises that generated approximately $208 million in capital coincided with bitcoin trading near $84,500, a price level that represents specific positioning relative to the broader 2026 price range. Warrant holders who exercised effectively chose to convert their derivative exposure into equity at a moment when Strive immediately deployed the capital into bitcoin at that price point. This revealed preference from warrant holders signals confidence in both Strive's bitcoin treasury strategy and the expectation that bitcoin appreciation will exceed the dilution effect on per-share value.
The remaining 15.3 million outstanding warrants represent potential future capital for additional bitcoin purchases if exercised. At current share prices and bitcoin levels, the exercise of these warrants would generate additional funding for treasury accumulation, though the timing and extent of future exercises depends on relative price movements between Strive shares and bitcoin itself. CEO Matt Cole previously stated the aim of ending 2026 as the world's second-largest public bitcoin holder, a target that would require surpassing MARA's current 35,577 BTC position.
The pace of accumulation matters for assessing institutional demand trajectory. Adding 3,311 BTC in a single week represents aggressive deployment compared to the gradual accumulation strategies employed by other public company treasuries. This pace suggests institutional conviction at current price levels rather than dollar-cost averaging across extended timeframes. The absence of debt financing eliminates interest expense but also eliminates leverage, meaning shareholder returns depend entirely on bitcoin's price performance relative to the dilution incurred.
## Share Dilution Impact on Bitcoin-Per-Share Metrics
The 9.4 percent increase in outstanding shares from approximately 100.94 million to 110.39 million over seven days materially affects the bitcoin-per-share calculation that determines shareholder exposure to bitcoin price movements. Prior to the purchase, shareholders held indirect exposure to approximately 29,462 BTC (the pre-purchase treasury total) divided across 100.94 million shares, or roughly 0.000292 BTC per share. Following the purchase, shareholders hold exposure to 32,773 BTC across 110.39 million shares, or approximately 0.000297 BTC per share.
The bitcoin-per-share metric increased by approximately 1.7 percent despite the 9.4 percent dilution in share count. This arithmetic outcome depends on the spread between the effective price Strive paid per bitcoin ($84,500) and the implied bitcoin value at which the warrant exercises and share issuances occurred. If bitcoin appreciates above the effective acquisition cost, the dilution becomes accretive to per-share bitcoin exposure. If bitcoin declines, shareholders experience both price decline and dilution effect.
This structure differs fundamentally from debt-financed bitcoin accumulation strategies where share count remains constant but balance sheet leverage increases. The equity approach concentrates risk in bitcoin price performance rather than distributing risk across bitcoin price and interest rate exposure. For shareholders evaluating this strategy, the relevant comparison is not bitcoin's absolute price movement but rather bitcoin's price movement relative to the implied cost basis of the diluted shares.
## Regulatory Posture and Public Company Bitcoin Treasury Compliance
Public company bitcoin treasury accumulation occurs within specific SEC reporting and disclosure requirements that shape the information available to shareholders and the compliance obligations of the issuer. Strive discloses bitcoin holdings and acquisition activity as part of its public reporting obligations, providing transparency into the size, timing, and financing method of treasury purchases. The warrant exercise mechanism itself operates within existing securities law frameworks governing registered warrants and equity issuance.
The regulatory environment for public companies holding bitcoin as a treasury asset has evolved through disclosure precedent rather than through specific rulemaking. The SEC has not issued formal guidance distinguishing bitcoin treasury holdings from other corporate assets for disclosure purposes, meaning companies apply existing materiality standards and asset disclosure requirements to their bitcoin positions. The absence of bitcoin-specific accounting or disclosure rules creates variability in how companies report acquisition costs, holding strategies, and impairment calculations.
For shareholders evaluating companies using bitcoin treasury strategies, the quality and frequency of disclosure matters more in the absence of standardized reporting requirements. Strive's disclosure of the specific acquisition date range (October 5 through October 9), average price ($84,500), total acquisition (3,311 BTC), and financing method (warrant exercises generating approximately $208 million plus share issuance) provides the information required to calculate dilution effects and effective cost basis. This level of detail enables shareholder evaluation of management's execution relative to stated bitcoin accumulation objectives.
The legal treatment of warrant exercises funding bitcoin purchases involves no novel securities law questions, but the economic substance creates a specific risk profile for shareholders. The warrant holders who exercised effectively purchased shares at the warrant strike price with the knowledge that proceeds would immediately flow to bitcoin acquisition. This structure makes the warrant exercise economically similar to a bitcoin-linked equity offering, though the legal form remains a standard warrant exercise. The distinction matters for understanding the revealed preference signal from warrant holders who could have chosen not to exercise.
## Institutional Demand Trajectory and Corporate Treasury Adoption
The aggressive accumulation pace represented by a 3,311 BTC purchase in one week signals institutional confidence distinct from the hesitant, gradual adoption pattern that characterized early corporate treasury bitcoin positions. The financing through equity rather than debt indicates management's preference for concentrated bitcoin exposure without interest expense or liquidation risk from debt covenants. This choice reveals a specific institutional view on bitcoin's risk-return profile: high enough expected return to justify dilution, but volatile enough to avoid leverage.
The position as the fifth-largest public company bitcoin holder and the stated goal of becoming the second-largest by year-end 2026 indicates competitive positioning within the corporate bitcoin treasury category. This competitive dynamic among public companies accumulating bitcoin creates sustained institutional demand independent of retail sentiment or spot market flows. Each company accumulating to reach or defend a position in the top holder rankings contributes to demand that persists regardless of near-term price volatility.
The gap to MARA's 35,577 BTC narrowed to 2,804 bitcoin following this purchase, suggesting Strive could reach the stated second-place objective through similar-scale purchases over the remaining months of 2026\. The feasibility depends on the pace at which remaining warrants are exercised and the willingness of shareholders to accept further dilution in exchange for increased per-share bitcoin exposure. The trajectory established by this $280 million purchase suggests management is willing to execute large single-week acquisitions rather than smoothing purchases across time.
For readers evaluating institutional bitcoin demand as a component of market structure, the equity-dilution financing method used by Strive represents a distinct category from debt-financed accumulation. The absence of leverage means Strive faces no liquidation risk from price declines, but also captures no amplification from price appreciation beyond the direct bitcoin exposure per diluted share. This method signals long-term conviction compatible with holding through volatility, as the financing structure creates no forced selling scenario absent voluntary management decision or shareholder pressure.
## Implications for Bitcoin-Linked Equity as Institutional Exposure Vehicle
Public companies holding bitcoin as treasury assets function as [indirect exposure vehicles](https://altcoininvestor.com/best-defi-protocols/) for shareholders, creating a regulated alternative to direct bitcoin ownership or spot bitcoin ETFs. The specific risk-return profile depends on the company's financing method, operational business (if any), and management's stated accumulation strategy. Strive's equity-dilution approach concentrates shareholder exposure in bitcoin price performance, with minimal operating business diversification since the January 2026 merger with Semler Scientific.
The warrant structure creates a dynamic where future bitcoin purchases depend on warrant holder decisions to exercise, introducing timing uncertainty distinct from pre-announced debt offerings or at-the-market equity programs. The 15.3 million warrants remaining outstanding represent potential future capital, but the timing and extent of exercise depends on the relative performance of Strive shares versus the warrant strike price and shareholder expectations about bitcoin's trajectory. This structure makes Strive's accumulation pace partially dependent on market conditions affecting warrant exercise decisions.
For institutional investors evaluating bitcoin exposure through publicly traded equities versus spot ETFs or direct custody, the dilution dynamics and financing structure matter more than headline bitcoin holding figures. A company adding bitcoin through share issuance delivers different per-share economics than a company adding bitcoin through debt or operating cash flow. The relevant metric is bitcoin-per-share growth rather than absolute treasury growth, and the financing method directly determines which metric shareholders should track.
The competitive positioning among public company bitcoin holders creates a specific institutional demand pattern that differs from cyclical retail flows or tactical trading activity. Companies pursuing stated goals to reach or defend positions in the holder rankings contribute to sustained accumulation regardless of near-term price volatility. This institutional behavior pattern represents a demand category that persists through market cycles, though the specific pace and financing method varies across companies. Strive's $280 million single-week purchase demonstrates the scale at which individual corporate actors can move when executing stated treasury strategies, as [reported in The Block's coverage of the acquisition](https://www.theblock.co/news/business/2026-10-13-strive-buys-3311-bitcoin-280-million-largest-acquisition-since-january-418430).
## The Takeaway
Strive's equity-dilution financing method for bitcoin treasury accumulation represents institutional confidence in bitcoin price appreciation sufficient to justify 9.4 percent share dilution over seven days. The absence of debt financing eliminates leverage risk but also eliminates leverage amplification, concentrating shareholder returns entirely in bitcoin's price performance relative to the effective cost basis of diluted shares. The aggressive single-week pace and the stated goal of reaching second-place holder status by year-end 2026 signal sustained institutional demand from corporate treasuries pursuing competitive positioning objectives. For shareholders evaluating bitcoin-linked equities as exposure vehicles, the financing structure and bitcoin-per-share trajectory matter more than absolute treasury size, and the warrant-dependent capital structure introduces timing uncertainty distinct from pre-announced accumulation programs.
## Frequently Asked Questions
### How did Strive finance its $280 million bitcoin purchase?
Strive financed the purchase through warrant exercises that generated approximately $208 million and through share issuance rather than debt. Effective common shares outstanding increased from approximately 100.94 million to 110.39 million over seven days, an increase of about 9.4 percent. Class A shares alone rose by more than 9.46 million. Approximately 15.3 million warrants remained outstanding following the transactions. This equity dilution approach avoids debt interest expense and liquidation risk but concentrates shareholder returns entirely in bitcoin price performance.
### What is Strive's current bitcoin holdings ranking among public companies?
As of October 9, 2026, Strive holds 32,773 BTC, placing it in the top five public company holders of bitcoin. The company trails MARA's 35,577 BTC by just 2,804 bitcoin following the recent purchase. CEO Matt Cole previously stated the aim of ending 2026 as the world's second-largest public bitcoin holder, which would require surpassing MARA's current position through continued aggressive accumulation.
### How does share dilution affect bitcoin-per-share exposure for Strive shareholders?
Despite 9.4 percent dilution in share count, the bitcoin-per-share metric increased by approximately 1.7 percent. Shareholders now hold exposure to 32,773 BTC across 110.39 million shares, or approximately 0.000297 BTC per share, compared to roughly 0.000292 BTC per share before the purchase. This outcome depends on the spread between the price Strive paid ($84,500 per BTC) and the implied bitcoin value at which shares were issued. Future shareholder returns depend on bitcoin appreciation relative to the effective cost basis of diluted shares.
### What SEC reporting requirements apply to public companies holding bitcoin?
Public companies holding bitcoin as treasury assets apply existing materiality standards and asset disclosure requirements rather than bitcoin-specific rules. The SEC has not issued formal guidance distinguishing bitcoin treasury holdings from other corporate assets for disclosure purposes. Companies disclose bitcoin holdings, acquisition activity, timing, and financing methods as part of standard public reporting obligations. The absence of standardized bitcoin accounting or disclosure rules creates variability in how companies report acquisition costs, holding strategies, and impairment calculations across different issuers.
### How does equity-financed bitcoin accumulation differ from debt-financed strategies?
Equity-financed accumulation through share issuance creates dilution but eliminates interest expense and liquidation risk from debt covenants. Debt-financed strategies maintain constant share count but add balance sheet leverage, creating amplified exposure to bitcoin price movements in both directions plus interest obligations. Equity financing concentrates risk entirely in bitcoin price performance relative to the implied cost basis of diluted shares, while debt financing distributes risk across bitcoin price movements and interest rate exposure. The equity approach signals long-term conviction compatible with holding through volatility, as it creates no forced selling scenario.
The Weekly Yield Report
You have just analyzed one public company's $280 million bitcoin treasury purchase financed through 9.4 percent share dilution. Those financing structures and dilution rates change with each corporate treasury announcement.
Every Thursday: where crypto yield actually is - stablecoins, liquid staking and DeFi lending, with the risk named next to the rate and what changed since last week.
[Get it free every Thursday](#/portal/signup)
Free. No trade calls, no allocations, no hype. Unsubscribe in one click.
### Yield Has a Rate. Funded Trading Has a Rulebook.
URL: https://altcoininvestor.com/yield-rate-vs-funded-trading-rulebook/
Last updated: 2026-10-14T11:51:34.000Z
You already know how to read a lending rate. Fluid pays 4.11 percent on USDT and 1.86 percent on ETH, and the gap between those two numbers tells you something real about demand, duration and who is borrowing. You can compare it to a Curve pool, to staking, to a T-bill if you like, because the units match. **Prop firms get sold in the same breath as those numbers, and they do not work that way at all.**
The model is simple enough to state in one sentence. You pay a one-off fee to sit an evaluation, and if you pass under the firm's rules, you trade the firm's capital and keep an agreed share of what you make. There is no rate. There is no principal. The fee is the product, and the rulebook is what you are actually buying.
The two are not competing products. They are different instruments wearing the same word, and the word is income.
## A Yield Prices the Asset. A Fee Prices You.
When you deposit into a lending market, the[ annual percentage yield](https://www.investopedia.com/terms/a/apy.asp) is compensation for a set of risks you can at least enumerate. Smart contract failure. A stablecoin losing its peg. Borrower liquidation in a fast market. Duration, if exit is not instant. **Your capital is the thing at risk, and the rate is the price of putting it there.**
A prop firm evaluation inverts both halves. You are not depositing capital, so there is no principal to lose. What you put at risk is the evaluation fee, and what you are buying is conditional access to a trading account you do not own.
That makes the challenge fee closer to an option premium than to a deposit. You pay a known, limited amount for the right to a payoff that depends on something the seller cannot measure and you may be overconfident about: your own performance under a specific set of constraints.
The analogy goes one step further than it does with options, because on some evaluations the premium comes back. Where a firm refunds the fee on your first profit split, the cost of a successful attempt is zero and the cost of a failed one is the fee. That is a materially different shape from a deposit, where the capital is exposed for as long as it sits there, and it is worth checking before anything else: a cheaper evaluation that keeps your fee is not cheaper.
Nobody quotes an APY on that, and nobody honestly could.
## The Three Questions a Rate Answers and a Rulebook Does Not
A yield figure is a single number because it compresses a lot of structure into one. A funded account does not compress, which is why it needs reading rather than comparing.
**What is the maximum loss, and from what?** On an evaluation account, the firm sets a floor and the account ends when equity touches it. Whether that floor is fixed at the starting balance or trails your highest equity changes the usable size of the account by a wide margin, and both are called a maximum drawdown.
**What ends the account early?** A daily limit is a second floor and it usually binds first. On a $100,000 account, a 4 percent daily limit permits a $4,000 loss in one session when the total budget might be $6,000\. Two-thirds of the allowance, available between breakfast and lunch.
**What invalidates results that were otherwise fine?** Some firms cap how much of the total profit may come from a single day. A trader who catches one clean move can produce a passing equity curve and a result the rulebook will not honour. That constraint does not show up on a chart. It shows up when the money is requested.
None of this makes the model worse than lending. It makes it unscorable with a single figure, which is a different complaint.
## What You Can Actually Check Before Paying
Here is the useful parallel to yield farming. Before you supply liquidity to a pool, you check whether the contract is audited, where the yield comes from, and whether the APY is organic or an emissions subsidy that disappears in three weeks. You do the diligence because the headline number alone does not tell you what you are holding.
The same discipline applies here, and it is simpler, because the whole thing is text rather than code. Every parameter that decides whether you pass is either published or it is not. A firm that states a fixed loss limit, a fixed daily limit, the basis each is measured from, and whether a consistency rule applies during the evaluation, is a firm whose rules you can model on paper before you spend anything. One that answers those in a support ticket is selling you something you cannot price.
As a worked example of what that looks like in full: a $100,000 two-step challenge at $729, running an 8 percent static maximum loss measured from the initial balance rather than trailing, a daily limit measured from account balance and reset at midnight UTC, a 10 percent and then 5 percent profit target across the two phases, no consistency rule during the challenge, and an 80 percent profit split that rises to 90 percent automatically once the account reaches 10 percent profit within three months. The entry fee is refundable on the first profit split. Those numbers may or may not suit you. The point is that they are all available in advance, so the arithmetic is possible before the fee is paid, and the failure modes are the ordinary ones rather than surprises. The published breakdown of[ where evaluations are most often lost](https://mubite.com/en/crypto-reports/top-7-reasons-traders-fail-crypto-prop-challanges) is a more useful read than any pass-rate figure a firm might quote, for the same reason an audit report beats an advertised APY.
Compare that with the opposite case. A trailing floor measured from intraday equity, a daily limit whose basis is not stated, and a consistency rule that only appears at payout. Same marketing language, entirely different instrument.
## Treating It Like a Portfolio Decision
### Size the fee like a premium, not like a deposit
The correct question is not "what return does this produce" but "how many of these can I lose and not care". If one evaluation fee is an amount you would notice, the position is too large, in exactly the way an option position can be. Where the fee is returned on a first payout, only the failed attempts cost anything, which changes how many you can rationally take.
### Do not compare it to yield at all
A lending rate and an evaluation have different payoff shapes, different time horizons and different failure modes. Putting them side by side produces a number that means nothing. Ask instead what each is for: one deploys capital you have, the other rents capital you do not.
### Read the floor before the split
The profit share is the number in the advert and it is the least important one. A generous split on a floor you will breach is worth less than a modest split on one you will not. Work from the constraint upward.
### Price your own variance first
Run your existing trade history against the loss limit before buying anything. If your historical worst[ drawdown](https://www.investopedia.com/terms/d/drawdown.asp) exceeds the budget the rules allow, no[ risk-adjusted](https://www.investopedia.com/terms/r/riskadjustedreturn.asp) argument saves the trade. You are buying a ticket, not a test.
## The Point
A yield is a statement about an asset. A funded account is a statement about you, written by someone else, in a document you can read before you agree to it.
Reading it is the whole job. Nobody will quote you a rate on your own discipline, and you should be suspicious of anyone who tries.
### Gaming, Streaming, Reading, or Scrolling? Choosing Entertainment for Your Free Time
URL: https://altcoininvestor.com/choosing-entertainment-for-free-time/
Last updated: 2026-10-14T11:50:51.000Z
When the day finally slows down, how do you spend those free moments? Some people reach for a controller, others settle into a book, and plenty of us end up scrolling without realizing how much time has slipped away. Entertainment choices today are nearly endless, and that abundance can feel both exciting and overwhelming. From immersive video games and binge-worthy shows to casual diversions like the chance to [explore online casino Philippines](https://games.funalomax.com/) games and endless social feeds, there’s always something competing for attention.
The real challenge isn’t finding something to enjoy, but rather deciding what will actually leave you feeling satisfied. After all, free time is too valuable to spend on autopilot. So, how do you choose the activity that fits your mood, energy, and the moment? Let’s explore what different forms of entertainment offer and how each one can bring something unique to your everyday breaks.
## When You Want to Escape: Gaming Takes You Somewhere New
Gaming has earned its place as one of the most popular ways to spend free time, and part of the appeal is simple: participation. Instead of watching a story unfold from the sidelines, you step inside it and shape the outcome.
That sense of involvement can take many forms. You might explore a sprawling fantasy world, build a city that grows with every decision, face off against friends in fast-paced matches, or do a quick round of a simple game like online slots. Every experience provides its own distinct reward, whether that means sharpening problem-solving skills or fostering deeper connections through online communities.
Of course, enjoyment depends on balance. Gaming feels most rewarding when it’s a deliberate choice, not something that takes over your schedule. A few hours with a favorite title after a busy week can be the perfect way to unwind, but it’s just as important to recognize when the fun has served its purpose. After all, the best hobbies are the ones you choose to return to rather than those you feel unable to leave.
## When You Want to Relax: Streaming Offers Easy Comfort
Sometimes, you don’t want to make decisions or solve problems. You just want to sit back and let a story carry you. That’s where streaming shines.
Maybe you queue up a familiar comedy that always lightens the mood. Or maybe you stumble across a new series that pulls you in from the very first episode. Either way, streaming is entertainment that fits neatly into those moments when your brain needs a break.
The challenge with streaming, however, is choice overload. With thousands of titles available, browsing can stretch longer than the actual watching. Many people know the feeling of scrolling endlessly, only to give up before pressing play.
One way around that? Decide what kind of mood you’re chasing before opening an app. Are you looking for laughter, inspiration, suspense, or simply background noise while you unwind? Having even a rough idea makes it easier to skip the endless menus and get straight to the enjoyment.
## When You Want to Grow: Reading Slows the World Down
Reading offers a different kind of entertainment. In a world filled with quick updates and constant notifications, opening a book can feel almost revolutionary.
Unlike screen-based activities, books let you set the pace. One evening you might lose yourself in a fictional adventure, the next you could uncover insights from history or science. Even stepping into a genre you’ve never tried before can spark curiosity and broaden your perspective.
What makes reading powerful is the pause it creates. With each page, the world slows down just enough for ideas to sink in. And not every book needs to be profound. A collection of dad jokes that makes you laugh or a short romance that stirs up butterflies can be just as valuable. In the end, isn’t it the space to reflect, recharge, and grow that makes reading such a lasting gift?
## When You Want Something Quick: Scrolling Fills the Gaps
Imagine you’re standing in line at the grocery store or waiting for your coffee order. Almost instinctively, you reach for your phone and start scrolling. Suddenly, you’re in a stream of updates: a funny clip here, a friend’s post there, maybe even a headline that catches your eye. It’s quick, effortless, and often entertaining.
That instant mix is what makes scrolling appealing. In moderation, it’s a simple way to fill spare minutes and break up the day. The trouble comes when it stops being intentional and the minutes slip into hours, leaving you more distracted than refreshed. Unlike hobbies that create a clear sense of completion, endless feeds can blur together until you wonder where the time went.
A helpful habit is to pause and check in with yourself: Am I scrolling because I want to or because silence feels uncomfortable? That small question can turn scrolling into a light diversion instead of a time sink.
## Finding the Right Entertainment Depends on You
There’s no single “best” form of entertainment for your free time. Gaming, streaming, reading, and scrolling each serve different purposes, and the right choice depends on what you need in the moment.
If you need a bit of thrill and excitement, consider gaming. Want comfort? Try watching something enjoyable. For inspiration and insights, reading a book might be more fitting. And for those lull moments while waiting, a quick scroll might be just what you need.
The goal isn’t to eliminate certain activities or make every moment productive. Free time exists because people need rest, fun, and opportunities to recharge. That’s why entertainment should add something positive to your life, whether that means laughter, relaxation, curiosity, or connection.
So, the next time you have an open hour, don’t automatically choose the easiest option. Instead, ask yourself what kind of experience you’re looking for. Who knows? Your answer might surprise you, perhaps even leading you to something new.
### Points Programs vs Direct Yield: When To Farm And When To Earn
URL: https://altcoininvestor.com/should-i-farm-points-or-earn-yield/
Last updated: 2026-10-14T02:08:32.000Z
## The Decision: Certain Income vs Uncertain Allocation
You deploy $10,000 to a DeFi protocol. You have two paths to income.
First path: supply USDC to Aave V3\. You receive 3.8% to 5.2% APY, paid daily in USDC. The rate fluctuates with utilization, but the mechanism is visible on-chain and the payout is contractual. Your principal earns a known rate from a known counterparty with $76.6 billion in TVL. This is [direct yield](https://altcoininvestor.com/how-to-earn-defi-yield-safely/).
Second path: deposit the same USDC to a protocol running a points program. You receive no immediate payout. Instead, the protocol credits your address with points based on deposit size, duration, and activity multipliers. The points have no market price, no contractual conversion rate, and no guaranteed token allocation. The protocol may distribute a token in six months. It may distribute in eighteen months. It may never distribute at all. If it does distribute, your allocation depends on total points issued, the percentage of supply allocated to users, and the token's launch price.
This is the core comparison. One pays a known rate. The other grants an option on future value with no strike price, no expiration date, and no obligation from the issuer.
## What Points Programs Actually Are

Points programs are non-transferable ledger entries that protocols use to size future token allocations. You cannot sell them. You cannot trade them. You cannot redeem them for anything until the protocol decides to launch a token and convert the ledger into supply.
The correct financial analogy is a zero-coupon bond with default risk.
A traditional zero-coupon bond pays no interest. You buy it at a discount to face value, hold it to maturity, and receive the full face value at expiration. The difference between purchase price and face value is your return. The bond has a known maturity date, a known face value, and a contractual obligation from the issuer.
A points program has none of those guarantees. You deploy capital today. You receive no current yield. You accumulate points over an undefined period. The protocol may convert those points into tokens at an undefined conversion ratio. The token may launch at an undefined valuation. Or the protocol may extend the program indefinitely, issue more points, dilute your balance, and never distribute anything.
The bond analogy holds because both instruments trade current income for future value. But the points version has discretionary terms on every variable that matters: timing, conversion ratio, token supply, and whether a payout happens at all.
### Historical Conversion Data
Uniswap distributed 400 UNI tokens to every user who had interacted with the protocol before September 2020\. At launch, 400 UNI was worth approximately $1,200\. At peak valuation weeks later, the same allocation was worth $16,800\. The total airdrop distributed $1.1 billion across roughly 250,000 addresses. No points program existed. The distribution was retroactive, based on historical usage.
Hyperliquid distributed 31% of HYPE's total supply to platform users in November 2024\. No venture capital allocation. The airdrop was the most valuable in crypto history by per-user value. Some traders received allocations worth hundreds of thousands of dollars. HYPE launched near $2 and traded above $30 within weeks. This was a points-based distribution. Users accumulated points for months through trading volume and protocol activity.
EigenLayer ran a points program for eleven months. Users deposited capital into restaking vaults and accumulated points based on deposit size and duration. TVL grew from $1 billion in January 2024 to $15 billion by mid-2024\. The EIGEN token launched in May 2025\. The airdrop allocated 5% of total supply to depositors at token generation. The per-point conversion was lower than most depositors expected. Geographic restrictions excluded users in several jurisdictions. Many participants earned less than they would have by deploying the same capital to stablecoin yield for the same period.
These three cases represent the range. Uniswap: retroactive, no points, massive per-user value. Hyperliquid: points-based, large allocation, strong token performance. EigenLayer: points-based, below-market conversion, geographic exclusions, dilution from TVL growth.
### Current Valuations
Variational's points trade at a theoretical value between $44.50 and $59.20 per point as of early 2026\. That valuation comes from prediction markets and assumes a specific token launch FDV and a specific percentage of supply allocated to points holders. Neither assumption is contractual. The calculation is: (Total Supply × Allocation %) ÷ Final Point Total × FDV. If final point issuance is higher than expected or the allocation percentage is lower, the per-point value drops proportionally.
Extended has distributed approximately 70 million points cumulatively under a program cap of 600,000 points, with an estimated 30% of eventual token supply floated as community allocation. The allocation percentage is not formally confirmed. The token has not launched. The valuation is speculative.
Both examples share the same structure: you are valuing a ledger entry based on assumptions about future supply, future allocation, and future market price. Change any variable and the valuation changes. The protocol controls all three variables.
## Valuation Framework: How To Price Uncertain Allocations

The correct way to value a points position is to model it as a probability-weighted expected value and compare that expectation to the opportunity cost of deploying the same capital to direct yield.
Start with the best-case scenario. Assume the protocol launches a token, allocates a reasonable percentage of supply to points holders, and the token achieves a valuation similar to comparable projects. Calculate your expected allocation based on your current points balance and the total points issued to date. Multiply that allocation by the assumed token price. That is your best-case outcome.
Next, assign a probability to that outcome. What is the chance the protocol actually launches a token? What is the chance it allocates the rumored percentage of supply? What is the chance the token holds value post-launch? Historical data: 88% of airdrop tokens lost value within three months of listing. 64% of recipients sold immediately. Unless a project explicitly states in official documentation that points will convert into a defined token allocation, you are farming on speculation.
Multiply the best-case value by the probability. That gives you expected value.
Now calculate the opportunity cost. Take the capital you deployed to the points program. Multiply it by the APY you could earn in a direct yield position over the same time period. Aave USDC: 3.8% to 5.2%. Morpho USDC vaults: 4.1% to 6.8%. Maple syrupUSDC: 7% to 8%. sUSDe: 11.6% average in 2026\. Those are known rates on known protocols.
If the expected value of the points position exceeds the opportunity cost by a margin wide enough to justify the uncertainty, the points program is worth farming. If it does not, deploy to direct yield.
### The Default Risk Component
Points programs have three failure modes that direct yield positions do not.
First: no token launch. The protocol runs the points program indefinitely, using the dashboard as free marketing, and never distributes anything. This has happened. Multiple projects ran full point seasons across a year or more and delivered nothing.
Second: below-market conversion. The protocol launches a token but allocates a smaller percentage of supply than the community expected, or the final point total is much higher than early participants anticipated, diluting per-point value. EigenLayer's TVL grew 15x during its points program. Every new dollar deposited diluted the per-point allocation for earlier participants.
Third: price collapse post-launch. The protocol distributes tokens, but the token loses 70% to 90% of its value within weeks. Your tax liability is calculated at the fair market value on the day of receipt. If you receive $5,000 worth of tokens and they drop to $500 before you sell, you still owe taxes on $5,000 in the United States. The loss does not offset the tax event unless you sell and realize the loss in the same tax year.
Direct yield has its own risks: smart contract exploits, oracle failures, governance attacks, liquidity crises. But those risks are different in kind. A points program can fail by simply never converting into anything. A yield position fails only if the underlying protocol breaks.
## Six Factors That Decide The Allocation
### 1\. Certainty vs Optionality
Direct yield is contractual. You deposit USDC to Aave, you receive the supply APY shown on the dashboard, paid in USDC, compounded daily. The rate fluctuates with borrow demand, but the mechanism is transparent. The payout is enforceable through the smart contract.
Points programs grant optionality. You may receive a valuable token. You may receive a token that immediately dumps. You may receive nothing. The upside is unbounded in theory. Hyperliquid participants who accumulated points through trading volume received allocations worth six figures in some cases. But the downside is total loss of opportunity cost.
If you need predictable income, choose direct yield. If you can afford to lock capital for an uncertain period in exchange for lottery-ticket upside, points programs are a rational allocation.
### 2\. Capital Efficiency
Direct yield deploys capital once. You supply USDC to a lending market, you earn APY, you can withdraw at any time subject to protocol utilization. The capital is working immediately.
Points programs lock capital for weeks or months with no current return. Sophisticated participants mitigate this by deploying capital in market-neutral positions: stablecoin liquidity, delta-hedged perpetual positions, or yield-bearing collateral that also accumulates points. Depositing sUSDe into a points program, for example, allows you to earn the sUSDe yield while also accumulating points on the same capital.
But most points programs require active participation to maximize accumulation: swapping tokens, providing liquidity, interacting with protocol features. Each interaction costs gas. Each trade incurs spread and slippage. The stated benefit is "free points," but the true cost is gas fees, transaction costs, and the opportunity cost of capital that could be earning yield elsewhere.
### 3\. Dilution Dynamics
Point supply is uncapped and issuer-controlled. Every new participant dilutes existing balances. Every multiplier event dilutes participants who do not qualify. Every extended season dilutes early participants.
EigenLayer's point program is the clearest example. TVL grew from $1 billion to $15 billion over eleven months. Total points issued grew proportionally. Early depositors who expected a certain per-point allocation based on initial TVL saw that expectation cut by 90% as new capital flooded in.
Direct yield does not have this problem. APY may drop as more capital enters the market, but your pro-rata share of the yield is determined by your deposit size relative to total deposits, not by an arbitrary ledger the protocol can expand at will.
### 4\. Time Horizon
Direct yield has no required holding period. You can deploy capital, earn for a week, and withdraw. The income accrues continuously.
Points programs require multi-month commitments. Most airdrops occur six to eighteen months after the points program launches. If you withdraw early, you forfeit accumulated points in most programs. The capital is effectively locked, not by smart contract, but by the incentive structure.
### 5\. Tax Treatment
Direct yield is taxed as ordinary income in the United States. You receive USDC, you report it as income at fair market value on the day of receipt. The tax treatment is clear.
Airdropped tokens are also taxed as ordinary income, but the valuation cliff is sharper. Tokens are valued at fair market value on the day of receipt. If you receive an allocation worth $10,000 on launch day and the token drops 80% before you sell, you owe taxes on $10,000 but realize only $2,000 in proceeds. The $8,000 loss is a capital loss, which offsets capital gains but does not offset the ordinary income tax owed on the airdrop receipt. You can end up with a net tax liability higher than your net proceeds.
### 6\. Failure Mode Specificity
Direct yield fails when the protocol fails. Aave has been operational since 2020 with $76.6 billion in TVL and multiple audits. The failure modes are known: oracle manipulation, governance attack, smart contract exploit, mass liquidation event that drains reserves. Those risks are real but historically low for mature protocols.
Points programs fail when the protocol chooses not to convert points into tokens, or converts them at a ratio far below expectations, or launches a token that immediately loses value. The failure is discretionary, not mechanical.
## Who Each Option Is Right For
### Direct Yield
Deploy to direct yield if you need current income, if you cannot afford to lock capital for an undefined period, or if your capital base is large enough that earning 4% to 8% APY on six figures generates meaningful absolute returns.
A $100,000 position in Morpho USDC at 6% APY generates $6,000 per year in income. That is contractual, withdrawable, and predictable. A $100,000 position in a points program may generate $50,000 if the airdrop is generous and the token holds value. It may also generate $0.
If you are deploying five figures or more, direct yield makes sense as the core allocation. Use points programs as satellite positions with capital you can afford to lock.
### Points Programs
Farm points if you have small capital, long time horizon, and high risk tolerance. A $5,000 position earning 6% APY generates $300 per year. The same $5,000 deployed to a successful points program can generate $5,000 to $15,000 if the airdrop is generous. The risk-reward asymmetry favors points programs when the base is small and the opportunity cost is low.
Points programs also make sense if you are already active in a protocol for other reasons. If you are trading on a perpetual DEX, you are paying fees and spread regardless. Accumulating points on that activity is a free option. The opportunity cost is zero because you would be transacting anyway.
Structured farming across three to five active programs simultaneously is realistic for earning $500 to $5,000+ per major airdrop for consistent users, according to 2025-2026 data. That requires multi-month commitment, gas cost accounting, and strict sybil-avoidance hygiene. Projects now use clustering algorithms to detect automated farming: multiple addresses funded from the same source, performing identical swaps in tight time windows, with near-identical amounts. If your wallet cluster is flagged, your entire allocation is voided.
## The Framework: How To Allocate Between The Two
Start with your total deployable capital. Subtract your emergency reserve and any capital you cannot afford to lock for twelve months. What remains is your DeFi allocation.
Split that allocation into two buckets: core and satellite.
Core bucket: 60% to 80% of your DeFi capital. Deploy this to direct yield on mature protocols with multi-year track records. Aave, Morpho, Sky, Maple, Pendle. Target 4% to 8% APY on stablecoins or stablecoin-equivalent synthetics. This is your baseline income. It compounds daily. It is withdrawable. It is predictable.
Satellite bucket: 20% to 40% of your DeFi capital. Deploy this to points programs with confirmed token launches or strong historical precedent. Prioritize programs that allow you to earn points on yield-bearing collateral, so you earn both the base yield and the points optionality. Depositing sUSDe into a points program, for example, earns you 11.6% APY on the sUSDe plus points accumulation on the same capital.
Within the satellite bucket, diversify across three to five active programs. Do not concentrate in a single protocol. Dilution risk, program extensions, and no-launch risk are all real. Spreading across multiple programs reduces the chance that a single failure wipes out your entire speculative allocation.
### Position Sizing By Capital Base
Under $10,000: allocate 50% to direct yield, 50% to points. The absolute income from yield is small, and the risk-reward asymmetry of airdrops favors higher speculative allocation.
$10,000 to $50,000: allocate 70% to direct yield, 30% to points. The yield income becomes meaningful in absolute terms, and you want to preserve capital while maintaining upside optionality.
Above $50,000: allocate 80% to direct yield, 20% to points. At this capital level, earning 6% APY on $50,000 generates $3,000 per year in predictable income. That is more valuable than chasing uncertain airdrops with the bulk of your capital.
### Active Monitoring
Points programs change terms mid-season. Multipliers expire. New seasons dilute existing points. Protocols extend timelines or add new qualifying activities. You cannot set and forget a points position.
Check your active programs weekly. Verify your points balance matches expected accumulation. Watch for announcements about program extensions, which usually signal dilution. Monitor TVL growth in the underlying protocol. If TVL doubles, your per-point allocation just halved.
Direct yield requires less frequent monitoring. Check APY monthly. Verify no governance proposals have changed fee structures or introduced new risks. Confirm your position is still accruing yield at the expected rate. Rebalance if a better rate appears on a comparably safe protocol.
## My Recommendation
Deploy 70% to 80% of your DeFi capital to direct yield on Aave, Morpho, or Maple. Earn 4% to 8% APY on stablecoins. That is your baseline income. It is contractual, predictable, and withdrawable.
Deploy the remaining 20% to 30% to points programs that meet three criteria: confirmed token launch or strong historical precedent, ability to earn points on yield-bearing collateral, and no geographic restrictions that would disqualify you.
Do not farm points with capital you need for income in the next twelve months. Do not farm points on protocols with no official documentation stating that points will convert into token allocations. Do not farm points across dozens of wallets trying to game sybil detection. Protocols void allocations for detected farming, and the clustering algorithms are better than your OpSec.
Run the valuation framework before committing capital. Calculate expected value: (assumed allocation × assumed token price × probability of both). Compare that to opportunity cost: (capital × direct yield APY × time period). If expected value does not exceed opportunity cost by at least 3x, the points program is not worth the uncertainty.
The best outcome is earning both. Deposit sUSDe or other yield-bearing stablecoins into points programs. You earn the base yield and accumulate points on the same capital. If the airdrop hits, you got both. If the airdrop fails, you still earned yield.
## The Takeaway
Points programs are zero-coupon bonds with discretionary terms and default risk. Direct yield is contractual income from known protocols. The decision comes down to capital size, time horizon, and risk tolerance. If you need predictable income or are deploying six figures, allocate primarily to direct yield and treat points as a small speculative position. If you have small capital, long time horizon, and can afford total loss of opportunity cost, points programs offer asymmetric upside. The framework is: core allocation to yield, satellite allocation to points, and strict criteria for which points programs justify the lockup. Model the expected value, compare it to opportunity cost, and require at least 3x margin to justify the uncertainty. Most points programs will not clear that bar. The ones that do are worth farming.
## Frequently Asked Questions
### How do I calculate the expected value of a points program?
Multiply your expected token allocation by the assumed launch price, then multiply that result by the probability of both the token launching and holding that price. Compare this expected value to the income you would earn by deploying the same capital to direct yield over the same time period. If the expected value does not exceed the opportunity cost by at least 3x, the points program does not justify the uncertainty and capital lockup.
### What is the typical conversion rate from points to actual income?
Historical examples vary widely. Uniswap distributed 400 UNI tokens worth $1,200 to $16,800 per user retroactively. Hyperliquid distributed allocations worth hundreds of thousands to active traders. EigenLayer allocated only 5% of supply after an eleven-month program, resulting in below-market returns for most depositors. There is no standard conversion rate. Each program sets its own allocation percentage, and total points issued dilute per-point value as more users join.
### Can I earn yield while farming points?
Yes, by depositing yield-bearing collateral into points programs. Protocols that accept sUSDe, sUSDS, or other yield-bearing stablecoins allow you to earn the base yield while accumulating points on the same capital. This structure reduces opportunity cost because you receive current income plus the option value of the future airdrop. Always verify that the protocol accepts yield-bearing tokens before depositing.
### What percentage of my capital should I allocate to points programs?
For capital under $10,000, allocate up to 50% to points programs due to the asymmetric upside relative to small absolute yield income. For $10,000 to $50,000, allocate 20% to 30% to points. For capital above $50,000, allocate no more than 20% to points and prioritize direct yield, which generates meaningful absolute income at that scale. Always use only capital you can afford to lock for twelve months or more.
### What are the main risks of farming points programs?
Three primary failure modes: no token launch after months of farming, below-market conversion ratios due to supply dilution or low allocation percentages, and immediate price collapse post-launch that creates tax liability exceeding net proceeds. Additional risks include geographic exclusions, sybil detection flagging your wallet cluster and voiding allocations, and opportunity cost from locking capital that could have earned 4% to 8% APY in direct yield positions over the same period.
The Weekly Yield Report
You now have a valuation framework for points, historical conversion data, and a decision rule. The allocations, conversion rates, and program terms will all change next month.
Every Thursday: where crypto yield actually is - stablecoins, liquid staking and DeFi lending, with the risk named next to the rate and what changed since last week.
[Get it free every Thursday](#/portal/signup)
Free. No trade calls, no allocations, no hype. Unsubscribe in one click.
### Best Web3 Wallets For Managing Yield Positions Across Chains
URL: https://altcoininvestor.com/best-web3-wallets/
Last updated: 2026-10-14T00:05:49.000Z
## The Decision You Are Making
You are running yield positions on Ethereum, Arbitrum, Base, and Polygon. You open Aave on one chain, Curve on another, and a restaking protocol on a third. Each transaction carries smart contract risk. Each signature exposes you to phishing or approval exploits. Each network switch costs attention and introduces error surface.
The wallet you use determines three things that affect whether you keep that capital or lose it.
First, transaction simulation quality. Does the wallet show you what a transaction will do before you sign it, or do you approve blind and hope the frontend told the truth?
Second, multi-chain position tracking. Can you see balances and open positions across chains in one interface, or do you toggle networks manually and reconstruct your portfolio in a spreadsheet?
Third, RPC privacy defaults. When you query your balance or broadcast a transaction, does your wallet route that request through a third-party RPC that logs your address, IP, timestamp, and every protocol you touch?
Most wallet comparisons treat all Web3 users the same. They rank by UI aesthetics, NFT gallery features, or fiat on-ramp convenience. None of that matters if you are managing real capital. What matters is whether the wallet catches a malicious approval before you sign it, whether it switches networks automatically when you move between dApps, and whether it leaks your full position history to analytics companies you have never heard of.
This article evaluates four wallets by those criteria: MetaMask, Rabby, Rainbow, and Phantom. All four have multi-chain support. All four integrate with major DeFi frontends. But their simulation accuracy, hardware wallet workflows, and privacy defaults differ in ways that directly affect operational security for yield allocators.
## Transaction Simulation: The Core Differentiator
Transaction simulation is the single feature that separates wallets for real capital from wallets for experimentation.
**Rabby** runs automatic pre-transaction simulation on every signature request. Before you approve, the wallet shows exact token balance changes, gas cost estimates, and security warnings. The simulation engine covers 47 supported networks with 98.7% accuracy. If a transaction will drain an LP position, revoke an approval, or transfer tokens you did not intend to move, Rabby flags it before you sign.
In a 2026 wallet security ranking using the SIGN-8 score, Rabby scored 36 out of 40 for pre-sign simulation clarity. MetaMask scored 31\. Phantom scored 30.
**MetaMask** added transaction simulation features in 2025-2026, but the implementation is opt-in and less detailed than Rabby's default behavior. The wallet will warn you about some high-risk transactions, but it does not enumerate exact token changes or show you the contract state delta for every signature.
**Phantom** provides transaction previews primarily for Solana transactions, where it shows token changes and program interactions. For EVM chains (Ethereum, Polygon, Base), Phantom's simulation is less mature. It will catch some obvious phishing attempts, but it does not provide the contract-level detail that Rabby offers on every EVM transaction.
**Rainbow** does not provide pre-transaction simulation. It is a mobile-first wallet optimized for simplicity and usability. For someone managing yield positions across protocols with unfamiliar smart contracts, this is a disqualifying gap.
Hardware wallets protect your private key from remote extraction, but they do not protect you from signing a malicious transaction. [Transaction simulation and human-readable previews add the defense layer that hardware alone cannot](https://altcoininvestor.com/crypto-wallet-security-active-yield-positions/). If you are using a Ledger or Trezor to secure six-figure positions, you still need a software wallet that can parse and simulate the transaction before it reaches the hardware device for signing.
The failure mode here is not theoretical. In October 2026, the D'CENT wallet ecosystem lost $20 million across five chains due to signing vulnerabilities that a proper simulation layer would have flagged. The exploit targeted users who approved transactions without verifying exact token movements.
### Verdict
Rabby is the only wallet in this comparison with automatic, detailed, multi-chain transaction simulation as the default behavior. If you are signing transactions on unfamiliar contracts or interacting with new protocols, this is non-negotiable. MetaMask has improved but still trails Rabby in simulation clarity. Phantom's EVM simulation is immature. Rainbow has no simulation at all.
## Multi-Chain Balance Tracking and Network Switching

If you are running positions on Ethereum mainnet, Arbitrum, Base, and Optimism simultaneously, you need a wallet that either tracks all four in one view or switches networks automatically when you navigate between dApps.
**Rabby** supports over 100 EVM chains with automatic network detection. When you open a dApp on Arbitrum, Rabby detects the chain and switches in the background without requiring manual RPC selection. The wallet also provides a unified portfolio view showing balances and open positions across all supported chains in one interface. For someone managing Aave deposits on three L2s and Curve LPs on two more, this eliminates the cognitive overhead of remembering which chain holds which position.
Rabby's automatic chain detection is the operational feature that makes it the preferred wallet for multi-L2 yield allocators. You do not select networks. The wallet does.
**MetaMask** historically required manual network switching. In 2025-2026, MetaMask expanded into multichain accounts that include Bitcoin, Solana, and TRON alongside Ethereum and its L2s. The implementation is recent and still maturing. MetaMask now covers more chains than Rabby, but the UX for switching between them is less automated. You still select the network manually in most cases, and the wallet does not always auto-detect the active chain when you navigate to a new dApp.
MetaMask's advantage is ecosystem breadth. It has unmatched dApp compatibility, especially for protocols that have not yet integrated with Rabby. The trade-off is interface complexity and less automation in multi-chain workflows.
**Phantom** started as a Solana-native wallet and later added support for Ethereum, Polygon, Base, Sui, and Bitcoin. Phantom's multi-chain expansion is impressive, but the wallet is still optimized for Solana. If you are running yield positions primarily on EVM chains, Phantom's EVM depth trails both Rabby and MetaMask. The wallet supports fewer EVM L2s, and its DeFi tooling integration is less mature on Ethereum than on Solana.
That said, if your yield strategy includes Solana staking or Solana DeFi, Phantom is the only wallet in this comparison with native, first-class Solana support. [Phantom lets you stake SOL directly inside the wallet](https://altcoininvestor.com/track-defi-positions-multiple-chains/) by selecting a validator, delegating your tokens, and earning rewards without touching a separate platform. None of the other wallets reviewed here offer native Solana staking.
**Rainbow** focuses primarily on Ethereum and has recently added Polygon support. It does not cover Arbitrum, Optimism, Base, or zkSync. For a yield allocator running positions across multiple L2s, Rainbow's chain coverage is insufficient. The wallet is mobile-only, which further limits its utility for desktop-based portfolio management.
Rainbow's strength is usability and design. It is a standout wallet for NFT collectors and mobile-first users who value a clean, intuitive interface. But for multi-chain yield farming, the lack of L2 coverage and hardware wallet integration makes it a non-starter.
### Verdict
Rabby's automatic chain detection and unified multi-chain portfolio view make it the most operationally efficient wallet for EVM-based yield positions. MetaMask covers more chains but requires more manual interaction. Phantom is the best choice if your strategy includes Solana. Rainbow does not cover enough chains to be viable for serious multi-L2 allocators.
## Hardware Wallet Integration and Signing Workflows
If you are managing yield positions worth five or six figures, you are using a hardware wallet. The question is how well your software wallet integrates with it.
**Rabby** provides auto-detection and clear on-screen prompts for Ledger, Trezor, Keystone (air-gapped), and GridPlus devices. The wallet displays the full address derivation path when you connect a hardware wallet, which is critical for verifying that you are signing with the correct account. [Rabby's hardware wallet integration is the most transparent in this comparison](https://altcoininvestor.com/best-crypto-hardware-wallets/).
The integration is also the smoothest. When you initiate a transaction in Rabby, the wallet simulates it, shows you the exact token changes, and then prompts your hardware device to sign. You verify the transaction details on the Rabby interface and on the hardware screen before signing. This double-check workflow is the correct security model for high-value DeFi transactions.
**MetaMask** supports Ledger, Trezor, Keystone, and NGRAVE ZERO, but the integration requires manual connection steps and sometimes needs specific browser settings or bridge apps to function correctly. The workflow is workable but less polished than Rabby's auto-detection. If you switch between multiple hardware wallets or manage several accounts, MetaMask's manual setup becomes friction.
**Phantom** supports Ledger only. The integration is straightforward for Solana transactions but less tested on EVM chains. If you are using Phantom primarily for Solana staking and only occasionally for Ethereum DeFi, Ledger support is sufficient. But if you need Trezor, Keystone, or GridPlus compatibility, Phantom does not offer it.
**Rainbow** supports Ledger on mobile, but hardware wallet integration is not a primary feature. The wallet is designed for mobile-first usability, and the hardware wallet workflow reflects that. For yield allocators who custody large positions on hardware devices, Rainbow's limited hardware support is a significant gap.
### Verdict
Rabby plus a hardware wallet is the safest combination for high-value DeFi positions. The integration is transparent, the address derivation is clearly displayed, and the transaction simulation runs before the hardware device prompts you to sign. MetaMask supports more hardware wallet brands but requires more manual setup. Phantom and Rainbow lag in hardware integration breadth.
## RPC Privacy and Third-Party Data Leakage
Every time you query a balance, check a transaction, or broadcast a signature, your wallet sends that request to an RPC endpoint. That endpoint sees your wallet address, your IP, the timestamp, and the smart contract you are interacting with. If the RPC provider logs that data, they have a full map of your positions, your trading behavior, and your net worth.
A 2023 study from ETH Zurich analyzed 100 wallets and found that 13 wallets leaked user addresses to third-party services. Of 1,572 dApps analyzed, 211 leaked wallet addresses to third parties. The problem is not universal, but it is common.
The leaked data flows through RPC gateways operated by Infura, Alchemy, and other providers. These services see your wallet address, IP address, timestamps, and every dApp interaction you make. Some providers claim they do not log this data. Others explicitly log it for analytics purposes. [At the very least, it is worth getting away from data-collecting RPCs like Infura](https://arxiv.org/html/2306.08170) and using an RPC that does not broadcast your order flow or collect your personal information.
**Rabby** and **Phantom** were not named in the 2023 ETH Zurich study as wallets that leaked address data. That does not mean they are immune to RPC privacy risks, only that they were not flagged in that specific dataset. The real question is which RPC each wallet uses by default and whether you can configure a custom RPC to avoid third-party tracking.
Rabby allows custom RPC configuration for every supported chain. You can replace the default RPC with a self-hosted endpoint or a privacy-focused provider. Phantom also allows custom RPC selection, though the UX is less explicit about privacy trade-offs.
**MetaMask** uses Infura as the default RPC provider for Ethereum mainnet. Infura logs request metadata, including IP addresses and wallet addresses, for operational and compliance purposes. You can configure a custom RPC in MetaMask, but most users do not. If you leave the default settings, your full transaction history and balance queries are visible to Infura.
**Rainbow** does not offer custom RPC configuration. The wallet uses default providers for each supported chain. For a mobile-first wallet optimized for simplicity, this makes sense, but it also means you have no control over who sees your position data.
### Verdict
If RPC privacy matters to you, configure a custom RPC in Rabby or MetaMask. Do not rely on default settings. Rainbow does not support custom RPCs, which makes it unsuitable for users who care about position privacy. Phantom allows custom configuration but does not emphasize privacy in its UX.
## Swap Fees, Fiat On-Ramps, and Secondary Features
For yield allocators, in-wallet swaps are a secondary feature. You are not using your wallet as a trading interface. But when you need to rebalance a position or exit a protocol, in-wallet swap functionality can save time.
Rabby charges 0.25% on swaps. MetaMask charges 0.875%. Phantom charges 0.85%. If you are swapping large amounts regularly, the fee difference adds up. [For capital deployment and large rebalances, you should still use a dedicated exchange](https://altcoininvestor.com/best-crypto-exchange-yield-deployment/) like Coinbase, Kraken, or a DEX aggregator. But for small tactical swaps, Rabby's lower fee is better.
Phantom has a built-in fiat on-ramp via MoonPay. MetaMask has a basic buy feature in some regions. Rabby has no native fiat on-ramp. For yield allocators, this is irrelevant. You are not buying crypto through a wallet. You are transferring stablecoins from an exchange to your wallet and deploying them into protocols.
Rainbow focuses heavily on mobile usability and NFT display. If you collect NFTs or want a wallet that feels like a consumer app, Rainbow is the most polished option in this comparison. But for yield position management, its lack of hardware wallet integration, limited chain support, and absence of transaction simulation make it unsuitable.
## Who Each Wallet Is Right For
**Rabby** is the correct choice for anyone managing yield positions across multiple EVM chains and L2s. The automatic chain detection, transaction simulation, and hardware wallet integration are all best-in-class. The wallet has no mobile app, so you are using it on desktop only. The lack of Solana and Bitcoin support means you need a second wallet if your portfolio includes those chains. But for EVM-based DeFi, Rabby is the most operationally secure and efficient wallet available.
**MetaMask** is the fallback option when a protocol does not integrate with Rabby or when you need broader chain coverage including recent additions like Solana and Bitcoin. MetaMask has unmatched dApp compatibility, a mature mobile app, and the most extensive ecosystem integrations. The trade-offs are weaker transaction simulation, higher swap fees, and default RPC settings that leak position data unless you configure custom endpoints. Use MetaMask when Rabby does not support the chain or protocol you need.
**Phantom** is the right wallet if your yield strategy includes Solana staking or Solana DeFi protocols. Phantom's Solana support is native and first-class. The wallet also covers Ethereum, Polygon, and Base, but its EVM tooling is less mature than Rabby's. If you are running positions on both Solana and Ethereum, you need Phantom for Solana and either Rabby or MetaMask for EVM chains. Phantom is not a replacement for a dedicated EVM wallet, but it is the best option for Solana exposure.
**Rainbow** is for mobile-first users who prioritize design and simplicity over security depth and multi-chain coverage. If you are managing small amounts on Ethereum or Polygon and you want a wallet that feels like a consumer app, Rainbow works. But for yield positions worth real capital, Rainbow's lack of transaction simulation, limited hardware wallet support, and narrow chain coverage disqualify it.
## The Recommendation
Use Rabby as your primary wallet for EVM-based yield positions. Pair it with a Ledger, Trezor, or Keystone hardware wallet for custody. Configure custom RPCs on every chain to avoid leaking position data to default providers. Use Phantom as a secondary wallet if your strategy includes Solana. Keep MetaMask installed for the occasional protocol that does not support Rabby, but do not use it as your primary interface.
The correct wallet stack for a yield allocator running $200k to $800k across Ethereum, Arbitrum, Base, and Optimism is Rabby (desktop, EVM chains) plus Phantom (Solana, if needed) plus a hardware wallet for signing.
Transaction simulation is the feature that prevents six-figure mistakes. Rabby is the only wallet in this comparison that provides automatic, detailed simulation by default. That single feature justifies the switch from MetaMask, even if MetaMask is more familiar.
## The Takeaway
The wallet you choose determines whether you see a malicious transaction before you sign it, whether you can track positions across chains without manual network switching, and whether your RPC provider logs every protocol you interact with. Most users default to MetaMask because it was first. That is not a good reason. Rabby provides better simulation, better chain detection, and better hardware wallet integration for EVM-based DeFi. Use it. If you need Solana, add Phantom. If a protocol only works with MetaMask, keep it installed but do not make it your primary interface. The operational security difference is measurable, and the cost of switching wallets is low compared to the cost of signing a malicious approval on a six-figure position.
## Frequently Asked Questions
### What is transaction simulation and why does it matter for DeFi wallets?
Transaction simulation shows you exactly what a transaction will do before you sign it. The wallet parses the smart contract call and displays token balance changes, approval modifications, and security warnings. This prevents you from signing malicious transactions that drain funds or revoke approvals. Rabby provides automatic simulation with 98.7% accuracy across 47 chains. MetaMask offers limited simulation as an opt-in feature. Phantom simulates Solana transactions well but lags on EVM chains. Rainbow has no simulation. For yield positions, simulation is the difference between catching a malicious approval and losing capital.
### Can I use the same wallet for Ethereum, Arbitrum, Base, and Solana?
No single wallet covers all chains optimally. Rabby provides the best experience for Ethereum and EVM L2s like Arbitrum, Base, Optimism, and Polygon with automatic chain detection and unified portfolio tracking. MetaMask recently added Solana support but the implementation is less mature than its EVM functionality. Phantom is purpose-built for Solana and added EVM chain support later, so its Solana tooling is stronger than its Ethereum integration. The correct setup for multi-chain yield positions is Rabby for EVM chains and Phantom for Solana.
### Do Web3 wallets leak my position data to third parties?
Yes, if you use default RPC settings. Every balance query and transaction broadcast goes through an RPC endpoint. Default providers like Infura log your wallet address, IP, timestamp, and contract interactions. A 2023 study found 13 wallets and 211 dApps leaked user addresses to third parties. Rabby and MetaMask let you configure custom RPCs to avoid tracking. Rainbow does not support custom RPCs. If position privacy matters, replace default RPC endpoints with self-hosted or privacy-focused alternatives in your wallet settings.
### Which wallet has the best hardware wallet integration for DeFi?
Rabby has the most transparent hardware wallet integration. It auto-detects Ledger, Trezor, Keystone, and GridPlus devices, displays the full address derivation path, and runs transaction simulation before prompting the hardware device to sign. MetaMask supports more hardware wallet brands but requires manual connection and bridge apps. Phantom supports Ledger only. Rainbow's hardware integration is limited to mobile Ledger support. For high-value yield positions, Rabby paired with a Ledger, Trezor, or Keystone device provides the clearest verification workflow and the strongest operational security.
### Should I use MetaMask or Rabby for managing yield positions?
Use Rabby unless a specific protocol only supports MetaMask. Rabby provides automatic transaction simulation, automatic chain detection across 100+ EVM chains, lower swap fees (0.25% vs 0.875%), and clearer hardware wallet integration. MetaMask has broader dApp compatibility and recent support for non-EVM chains like Solana and Bitcoin, but weaker simulation and higher fees. For EVM-based yield farming across multiple L2s, Rabby is operationally superior. Keep MetaMask installed as a backup for protocols that do not integrate with Rabby, but use Rabby as your primary interface.
Tool mentioned above
Ledger
Ledger devices display the full transaction on their own screen before you approve it, which is what stops an approval exploit at the point it matters.
[See Ledger devices](https://shop.ledger.com/?r=90612ff43561)
We may earn a commission if you sign up through this link, at no cost to you. It does not change what gets recommended.
The Weekly Yield Report
You have just compared four wallets by simulation accuracy, chain coverage, and RPC privacy defaults. Those features evolve with every major protocol exploit and every wallet update.
Every Thursday: where crypto yield actually is - stablecoins, liquid staking and DeFi lending, with the risk named next to the rate and what changed since last week.
[Get it free every Thursday](#/portal/signup)
Free. No trade calls, no allocations, no hype. Unsubscribe in one click.
### The Real Historical Returns On IDO Participation
URL: https://altcoininvestor.com/ido-historical-returns/
Last updated: 2026-10-13T23:03:58.000Z
## What The Question Is Actually Asking

When someone searches for IDO historical returns, they want to know whether participating in initial DEX offerings produces better returns than holding major tokens, whether the marketing claims about 500x Day-1 gains represent typical outcomes, and whether the mechanism works as an income strategy over time rather than as a single speculative bet. The answer depends entirely on which population you measure. If you look only at the projects still listed on exchanges after twelve months, the numbers look encouraging. If you include the projects that delisted, stopped trading, or never achieved liquidity past the first week, the median outcome is a loss that marketing materials never mention.
This is not a new problem. It is the same survivorship bias that inflates mutual fund performance data, IPO return studies, and any analysis that excludes failures from the denominator. The difference in crypto is that the failure rate is higher, the time to failure is shorter, and the marketing materials are more aggressive about showing only the survivors. The eurozone learned this lesson with sovereign debt yields during 2011 and 2012, when Greek and Portuguese bonds advertised high nominal yields that reflected default probability rather than sustainable return. When the underlying credibility broke, the yields stopped being yields and became disclosed losses that had been accruing all along. IDO returns follow the same pattern, just faster.
## The Marketing Numbers Versus The Full Cohort

IDO launchpads advertise exceptional Day-1 returns by highlighting the top-performing projects from each cohort while omitting the remainder. A typical marketing claim might reference a 2021 IDO that returned 550x within the first month, or a 2022 launch that delivered 200x to early participants. These numbers are factually accurate for those specific projects, but they represent the right tail of a distribution in which the median outcome is far lower and the left tail includes complete losses from projects that delisted within weeks.
The full cohort data, when survivorship-adjusted, shows a different picture. Research on memecoin launchpads provides a useful baseline for understanding token failure rates at the retail access tier. Data from Pump.fun, a low-barrier memecoin launchpad, shows that nearly 69% of tokens launched since January 2024 stopped trading on their first day, with more than 80% failing within two days. While IDOs involve higher barriers to entry than memecoin launchpads, the structural dynamic is similar. Projects that fail to generate early demand or sustained liquidity disappear quickly, and those failures are excluded from most return calculations because the tokens no longer trade on tracked exchanges.
The distinction between nominal Day-1 returns and 12-month or 24-month holding period returns is where the survivorship bias becomes visible. A project that pumps 300% on Day 1 but loses 95% of its value by month three and delists by month six will appear in the Day-1 return data but not in any 12-month cohort analysis that relies on exchange-listed tokens. This creates a systematic upward bias in reported returns that grows larger the longer the measurement period, because each additional month allows more projects to fail and drop out of the trackable population.
Historical data on IPO performance in traditional finance provides a useful reference point. According to research tracking US IPOs between 1980 and 2001, the average first-day return was 18.8%, but the annualized return over the full sample period was 6.93%, compared to 9.13% for the Russell 3000 Index. Over a 36-month period, IPOs underperformed by 5.1%. The pattern is consistent across decades and geographies. Early participants capture a first-day pop, but holding period returns underperform broader market benchmarks because the pricing mechanism systematically favors issuers and underwriters over retail participants. You can read more about IPO dynamics and pricing mechanisms at the [SEC's IPO data portal](https://www.sec.gov/data-research/statistics-data-visualizations/initial-public-offerings-ipos).
IDOs differ from IPOs in critical ways that make the underperformance dynamic worse rather than better. IPOs have lockup periods that restrict when early investors and insiders can sell, which limits supply pressure during the first six to twelve months. IDOs have no such restrictions. The moment a token lists, every allocation holder can sell, and the majority of them do. The resulting sell pressure pushes prices down rapidly unless demand exceeds the cumulative allocation being dumped by early participants, a condition that holds for a small minority of launches.
## What The 2021-2023 Cohort Data Shows

Analyzing IDO returns across full cohorts requires defining what constitutes success, failure, and the intermediate outcomes that most projects occupy. A project that lists, trades for two weeks, then becomes illiquid and untracked is neither a complete success nor a Day-1 failure, but it represents a loss for anyone who held past the initial pump. The measurement problem is that most publicly available IDO return data tracks only projects that remain listed on major exchanges, which excludes the majority of launches within 12 months.
The 2021 IDO cohort launched during the peak of the previous bull market, when liquidity was abundant and speculative appetite was at its highest. Even in that favorable environment, the majority of 2021 IDOs lost value relative to holding ETH or major altcoins over a 12-month period. The projects that survived and appreciated were heavily concentrated in specific sectors, primarily DeFi protocols with genuine fee revenue, gaming projects that achieved user traction before the broader GameFi collapse, and infrastructure plays that became dependencies for other protocols. The median 2021 IDO, however, launched with initial hype, traded sideways or down for three to six months, then delisted or became effectively illiquid as market makers withdrew and trading volume fell below sustainable thresholds.
The 2022 cohort faced worse conditions. Launching into a bear market with declining liquidity and reduced speculative interest, most 2022 IDOs never achieved the Day-1 pumps that characterized 2021 launches. The ones that did saw those gains evaporate within weeks as broader market conditions deteriorated and attention shifted away from new launches toward surviving projects with proven revenue or user bases. By the 12-month mark, the majority of 2022 IDOs had either delisted entirely or were trading at valuations below their IDO price, often by 70% to 90%. The survivors were again concentrated in narrow sectors, primarily infrastructure and tooling that served specific technical needs within the ecosystem.
The 2023 cohort shows a similar pattern with slight improvement in survival rates but not in median returns. More projects remained listed past the 12-month mark compared to 2022, but most traded at valuations below their initial offering price. The improvement in survival likely reflects tighter listing standards on major DEXs and launchpads rather than better project quality or market conditions. Projects that would have launched and failed quickly in 2021 or 2022 did not reach the IDO stage in 2023 because the barriers to listing increased. This selection effect makes the 2023 cohort appear more successful on a survival basis, but it does not translate to better returns for participants, because the survivors are still underperforming broader market benchmarks.
The challenge for retail participants is that predicting which 5% to 10% of IDOs will survive and appreciate is difficult without insider information, technical expertise to evaluate protocol mechanics, or access to networks that signal quality projects before they become obvious to the broader market. The base rate suggests that holding major assets like ETH or BTC produces better risk-adjusted returns than attempting to select winners from IDO cohorts unless you have structural advantages most retail participants lack.
## Survivorship Bias And What It Hides
Survivorship bias in financial data is the systematic error introduced when analysis includes only entities that survived a selection process while excluding those that did not. In mutual fund performance data, this shows up as a 1.6% annual return differential between survivorship-free datasets and survivorship-biased ones, according to research covering 1926 through 2001\. The bias inflates Sharpe ratios by as much as 0.5 points, turning mediocre risk-adjusted performance into apparently strong performance simply by excluding the funds that failed and closed.
In IDO return data, the survivorship bias is larger because the failure rate is higher and the time to failure is shorter. A mutual fund might underperform for years before closing. An IDO can delist within weeks. This means that any IDO return calculation based on projects still trading at the 12-month or 24-month mark excludes a substantial portion of the original cohort, and the excluded projects are systematically the worst performers. The result is that published return data overstates the typical participant outcome by a wide margin.
Consider a simplified example cohort of 100 IDOs launched in the same quarter. If 70 of those projects delist or become illiquid within 12 months, and the 30 survivors have a median return of 50%, a survivorship-biased analysis would report 50% as the median outcome. A survivorship-adjusted analysis that includes the 70 failures, most of which represent 80% to 100% losses, would show a median outcome closer to a 60% loss. The difference between those two numbers is not a rounding error. It is the difference between a strategy that appears profitable and one that destroys capital for the majority of participants.
The practical implication is that any IDO return data you encounter in marketing materials, launchpad promotional content, or influencer commentary is almost certainly survivorship-biased unless it explicitly states otherwise and shows cohort-level failure rates. Most sources do not show failure rates because doing so would undermine the narrative that IDO participation is a viable income strategy for retail participants. The reality is that it functions more like venture capital, where the majority of positions lose money and the portfolio return depends on whether you captured the small number of outsized winners. Unlike venture capital firms, retail IDO participants typically lack the deal flow, due diligence resources, and portfolio construction discipline required to make that model work reliably.
This dynamic mirrors what traditional finance has documented for decades in IPO participation. Retail investors systematically underperform in new issues because they receive allocations only when institutional demand is weak, they lack the information advantages that institutional buyers have, and they tend to hold losing positions longer than winning ones. The same behavioral and structural disadvantages apply to IDO participation, compounded by higher volatility, less regulatory oversight, and faster failure timelines. If you are considering IDO participation as an income mechanism, the base rate evidence suggests you should expect results closer to the median retail IPO investor than to the marketing examples launchpads use to attract participants. You can explore broader token launch models and their structural differences in [our comparison of IDO, private rounds, and fair launch mechanisms](https://altcoininvestor.com/token-launch-methods-compared/).
## The Parallel To Retail IPO Underperformance
The traditional finance literature on retail IPO participation is extensive and consistent. Retail investors who participate in IPOs underperform market benchmarks over every measured time horizon, pay more in transaction costs, and systematically receive allocations in the weakest offerings because institutional investors have already picked over the deal flow and taken the best opportunities. This is not a conspiracy. It is a structural feature of how capital allocation works in markets where information and access are unevenly distributed.
The mechanism is straightforward. When an IPO is expected to perform well based on institutional analysis, demand from large buyers exceeds supply, and retail allocations are reduced to minimal amounts or eliminated entirely. When an IPO is expected to underperform, institutional demand is weak, and retail allocations increase to fill the gap. The result is that retail participants receive larger allocations in precisely the offerings they should avoid and minimal allocations in the few offerings that appreciate. This adverse selection dynamic guarantees underperformance at the portfolio level even if individual retail participants occasionally capture a strong performer.
IDOs replicate this dynamic without the regulatory protections and disclosure requirements that at least make the information asymmetry visible in traditional IPO markets. Launchpad allocations are often determined by token holdings, staking tiers, or participation in previous launches, which creates a multi-tier access system where the best-connected participants see deal flow first and retail participants receive access only after earlier tiers have already made allocation decisions. By the time a project reaches the public IDO tier, it has already been reviewed and partially rejected by participants with better information and stronger networks.
The practical consequence is that IDO participation as a strategy requires either informational advantages most retail participants do not have or portfolio construction discipline that most retail participants do not follow. If you participate in every IDO you can access, you will own a portfolio heavily weighted toward projects that better-informed participants avoided. If you attempt to select only the best opportunities, you are competing against participants with more data, better networks, and earlier access. Neither approach produces favorable base rates unless you have structural advantages that place you in the top decile of participants.
## Where IDO Returns Actually Come From When They Work
The minority of IDOs that produce sustained positive returns do so for identifiable reasons that have little to do with the IDO mechanism itself. The IDO is simply the distribution method. The return comes from the underlying protocol generating value that exceeds the initial valuation, which requires some combination of genuine product-market fit, defensible competitive positioning, and revenue generation that supports token value rather than relying solely on speculative demand.
DeFi protocols that achieve sustained returns typically do so by capturing fees from genuine economic activity. Decentralized exchanges earn trading fees, lending protocols earn net interest margin, and infrastructure projects earn usage fees from other protocols. These revenue sources create a floor under token valuations independent of speculative interest, which allows the token to retain value even when broader market sentiment deteriorates. The projects that launched via IDO and went on to appreciate sustainably were almost all in this category. They had identifiable revenue, growing usage metrics, and value accrual mechanisms that directed a portion of protocol revenue to token holders. For a detailed breakdown of how protocol revenue translates to sustainable yield, see [our analysis of real yield sources](https://altcoininvestor.com/what-is-real-yield-in-crypto/).
Gaming and metaverse projects that succeeded typically did so by achieving user retention and in-game economic activity before the broader GameFi narrative collapsed. The projects that launched during the 2021 GameFi boom and survived past 2022 were the ones that built actual games rather than token-reward mechanisms disguised as games. This is a small subset of the total GameFi IDO cohort, but it represents nearly all the sustained success cases.
Infrastructure projects, particularly those solving specific technical problems for developers or other protocols, had higher survival and return rates than consumer-facing applications. The reason is that infrastructure projects have stickier demand and more defensible moats. Once a project becomes a dependency for other protocols or a standard tooling choice for developers, it generates sustained demand independent of retail speculative interest. This category includes oracles, indexing services, interoperability layers, and developer tooling.
The common thread across successful IDOs is that the token launch was incidental to the value creation. The project would have generated returns regardless of the distribution mechanism because the underlying business or protocol was sound. The IDO simply provided early access. For participants attempting to identify which 5% to 10% of IDOs will follow this path, the analytical task is the same as venture capital due diligence. You need to evaluate the team, the product roadmap, the competitive landscape, the revenue model, and the token value accrual mechanism. Most retail participants do not have the expertise or time to do this rigorously, which is why the base rate for retail IDO participation resembles the base rate for retail IPO participation. A small number of participants with structural advantages capture most of the returns, and the majority underperform passive holding strategies.
## When IDO Participation Makes Sense And When It Does Not
IDO participation makes sense as an income strategy only if you have one of three advantages. First, access to deal flow and information that allows you to evaluate projects before they reach public IDO stages, which means you can select opportunities that better-informed participants have already validated. Second, technical expertise to evaluate protocol mechanics, smart contract risk, and tokenomics independently, which allows you to identify undervalued projects that the market has not yet recognized. Third, sufficient capital and discipline to construct a diversified portfolio of 20 to 50 IDO positions, which allows you to capture the right-tail winners while limiting the damage from the majority of positions that will underperform or fail entirely.
Most retail participants have none of these advantages. They participate in IDOs based on marketing materials, influencer promotion, or hype cycles, which means they are systematically late to the best opportunities and overweight in the weakest. They lack the technical expertise to evaluate whether a project's claimed innovation is genuine or whether the tokenomics will lead to sustained dilution. They lack the capital or discipline to diversify adequately, so they concentrate risk in a small number of positions and suffer large losses when those positions fail. For participants in this category, IDO participation is more likely to destroy capital than generate income over any meaningful time horizon.
The alternative approach, which the base rate evidence supports, is to treat IDO participation as a minor speculative allocation rather than a core income strategy. If you allocate 5% to 10% of your crypto portfolio to IDO participation, accept that the median outcome is likely a loss, and treat any successful positions as asymmetric upside rather than expected return, you are aligned with the actual return distribution. This approach limits the damage from the majority of positions that will fail while allowing you to capture the occasional winner without concentrating risk.
The mistake most retail participants make is treating IDO participation as if the marketing numbers represent typical outcomes rather than survivorship-biased right-tail results. They allocate significant capital, expect positive returns, and are surprised when the majority of their positions lose value. The historical data is clear. The median IDO underperforms holding major tokens over 12-month and 24-month periods. The marketing materials show only the survivors. The income opportunity, such as it exists, is concentrated among participants with informational or analytical advantages most retail participants do not have. For those exploring safer yield strategies with more predictable risk-reward profiles, [our guide to earning DeFi yield safely](https://altcoininvestor.com/how-to-earn-defi-yield-safely/) covers alternatives with verifiable income sources and lower failure rates.
## The Takeaway
IDO historical returns, when measured across full cohorts including failures and delistings, show median outcomes far below the marketing numbers that launchpads and influencers promote. The 2021-2023 cohort data, even in the absence of comprehensive survivorship-adjusted databases, demonstrates the same pattern seen in traditional IPO participation for decades. Early Day-1 returns are often positive for the minority of participants who receive allocations and sell immediately, but 12-month and 24-month holding period returns are negative for the majority of projects and underperform passive holding strategies for most participants. The projects that succeed do so for reasons unrelated to the IDO mechanism itself, primarily genuine protocol revenue, user traction, or infrastructure positioning, and identifying those projects in advance requires informational or technical advantages most retail participants lack. The base rate evidence suggests that IDO participation works as an income strategy only for the top decile of participants who have structural access, analytical capability, or portfolio discipline that separates them from retail participants who allocate based on marketing materials and hype cycles. For everyone else, the historical returns are worse than holding major tokens and treating IDO participation as anything more than a small speculative allocation is inconsistent with the data.
## Frequently Asked Questions
### What is the typical Day-1 return for IDO participants?
Marketing materials highlight 200x to 550x Day-1 returns from top performers, but these represent the right tail of the distribution. The median Day-1 return across full cohorts is significantly lower, and the majority of participants who hold past the initial pump see those gains evaporate within weeks as early allocations are sold and liquidity thins. Day-1 returns are also heavily dependent on allocation size, with retail participants typically receiving minimal allocations in the strongest performers due to oversubscription.
### How do IDO returns compare to holding ETH or BTC over 12 months?
Survivorship-adjusted data shows that the median IDO underperforms ETH and BTC over 12-month holding periods across 2021, 2022, and 2023 cohorts. While the top 5% to 10% of IDOs significantly outperform, the majority either lose value in absolute terms or gain less than major tokens. This pattern holds even during bull markets when speculative appetite is high. The risk-adjusted return for diversified IDO portfolios is lower than passive holding strategies unless participants have structural advantages in deal selection.
### What percentage of IDOs delist or become illiquid within 12 months?
Comprehensive cohort-level data is limited, but evidence from memecoin launchpads and exchange delisting patterns suggests that 60% to 80% of tokens launched via low-barrier mechanisms fail within the first year. IDOs have higher barriers to entry, which likely reduces the failure rate to 40% to 60%, but this still means the majority of projects either delist entirely or trade at volumes too low to support meaningful liquidity. Survivorship bias in published return data systematically excludes these failures, overstating typical participant outcomes.
### Do IDO participants underperform for the same reasons as retail IPO investors?
Yes. The structural dynamics are nearly identical. Retail participants receive larger allocations in weaker offerings because better-informed participants with earlier access have already selected the best opportunities. They lack the due diligence resources and information advantages that institutional or well-connected participants have. They tend to hold losing positions longer than winning ones due to behavioral biases. The result is systematic underperformance despite occasional exposure to strong performers, compounded in crypto by higher volatility and faster failure timelines.
### What makes an IDO likely to produce sustained returns rather than a Day-1 pump?
Sustained returns come from underlying protocol value rather than the IDO mechanism itself. Projects that succeed typically have verifiable revenue from fees, demonstrated product-market fit with growing user metrics, defensible competitive positioning in infrastructure or tooling, and token value accrual mechanisms that direct protocol revenue to holders. Gaming projects need actual user retention, not just token rewards. DeFi protocols need genuine economic activity generating fees. Infrastructure projects need to become dependencies for other protocols. The analytical task is venture-level due diligence, which most retail participants cannot perform rigorously.
The Weekly Yield Report
You have just reviewed survivorship-adjusted return data across 2021 through 2023 IDO cohorts and the structural reasons retail participants underperform. Those cohort base rates will shift with the next cycle, and knowing when they do changes the allocation decision.
Every Thursday: where crypto yield actually is - stablecoins, liquid staking and DeFi lending, with the risk named next to the rate and what changed since last week.
[Get it free every Thursday](#/portal/signup)
Free. No trade calls, no allocations, no hype. Unsubscribe in one click.
### What Staking Means: Validation, Yield Sources, And Real Returns
URL: https://altcoininvestor.com/staking-meaning-validation-yield/
Last updated: 2026-10-13T21:05:57.000Z
## What Staking Actually Means

Staking is the process of locking cryptocurrency to secure a proof-of-stake blockchain and validate transactions. In return, the protocol pays you a share of block rewards, transaction fees, and occasionally maximal extractable value (MEV) income.
It is not "interest" in the traditional banking sense.
When you stake, you are participating in network consensus. Your capital serves as collateral that can be partially or fully destroyed (slashed) if you or your validator behaves maliciously or fails to maintain uptime. The yield compensates you for three things: capital lock-up, price volatility exposure, and slashing risk.
The blockchain tracks your staked balance. If you delegate to a validator, the protocol knows your capital is committed to that validator's operations. If you run a validator yourself, you are responsible for the hardware, software, and connectivity required to propose and attest blocks.
The critical concept: staking converts passive holders into active network participants. Without sufficient staked capital, a proof-of-stake network cannot reach consensus and becomes vulnerable to attack.
## Where Staking Rewards Actually Come From

Staking rewards originate from three distinct sources. Each carries different risk profiles and sustainability characteristics.
### Consensus Rewards (Inflation)
New tokens are minted by the protocol and distributed to validators. This is issuance yield. On Ethereum, consensus rewards account for the base layer of staking income. On networks like Cosmos and Solana, inflation can run between 5% and 14% annually.
Inflation-based rewards dilute all token holders. If you do not stake but others do, your share of the network decreases. This creates implicit pressure to stake or accept dilution. The only figure that matters is **real yield**: nominal APY minus the chain's inflation rate.
Ethereum advertises 2.8% to 3.8% APY with roughly 0.5% annual inflation. Real yield: approximately 3%. Cosmos advertises 18.5% APY with 10% to 14% inflation. Real yield after supply dilution: between 2% and 8%. The headline number is a trap.
### Transaction Fees and Priority Tips
Users pay fees to have their transactions included in blocks. Validators who propose blocks collect these fees as part of their rewards. On Ethereum, priority fees (tips) account for approximately 17% of total validator income and spike during network congestion.
Fee income is volatile and depends on network activity. During the 2021 DeFi summer, Ethereum validators earned multiples of base issuance from fee revenue. During low-activity periods, fee income compresses toward zero.
This is the only staking income source that does not dilute token holders. Fee-based yield reflects real economic activity on the network.
### Maximal Extractable Value (MEV)
Advanced validators can earn additional income by strategically ordering transactions within blocks. On Ethereum, validators using MEV-Boost typically add 10% to 30% on top of base rewards. At a 2.78% base APR, that translates to roughly 0.28% to 0.83% additional yield.
MEV introduces centralization risk. Validators depend on external relay infrastructure to access MEV income. Relay downtime reduces earnings. Using multiple relay endpoints mitigates this risk but adds operational complexity.
For more on how staking returns break down across chains and platforms, see [Crypto Staking Returns: Where Yield Comes From And What It Costs](https://altcoininvestor.com/crypto-staking-returns-across-chains/).
## Real Yield vs. Nominal APY

The most common conceptual mistake is treating nominal APY as the return figure that matters. It is not.
Real yield is headline APY minus the chain's token inflation rate. This is the only number that tells whether your stake is growing in purchasing power or merely keeping pace with new supply.
| Network | Nominal APY | Inflation Rate | Real Yield | Unbonding Period |
| -------- | ----------- | -------------- | ---------- | -------------------------------- |
| Ethereum | 2.8-3.8% | \~0.5% | \~3% | Variable (days to weeks) |
| Solana | 6-8% | \~5-6% | \~1% | 2-3 days |
| Polkadot | \~15% | \~11% | \~4% | 24-48 hours (reduced March 2026) |
| Cosmos | 18.5% | 10-14% | 2-8% | 21 days |
Ethereum shows the lowest nominal APY but the highest real yield after adjusting for inflation. Cosmos advertises the highest headline number but compresses to the middle of the pack once you account for token dilution.
A network offering double-digit APY is often signaling an unsustainable issuance schedule, not genuine earning power. High inflation is a cost paid by all token holders to subsidize validator participation.
## Validator Economics and the Security Budget
Networks must balance staking rewards carefully. Set them too low and insufficient capital stakes, weakening security. Set them too high and excessive inflation erodes token value.
The total value staked determines the cost of attacking the network. An attacker must acquire and risk at least one-third of total stake to disrupt consensus. On Ethereum, with more than 36 million ETH staked and roughly 897,000 validators active as of mid-2026, the economic cost of a 51% attack exceeds $50 billion at current prices.
This is the security budget. The protocol pays validators from inflation and fees to maintain this economic barrier.
As participation increases, per-validator rewards decrease. Ethereum staking APY fell from approximately 5.2% in 2023 to 2.8% to 3.8% in 2026 as total staked ETH grew from $40 billion to over $130 billion in total value locked. This is reward dilution. When more people stake and block rewards remain constant, each validator's share decreases.
Running a validator yourself requires hardware and operational expertise. A [solo Ethereum validator](https://altcoininvestor.com/how-to-stake-crypto-across-chains/) requires 32 ETH locked in the protocol staking contract and costs $1,500 to $3,000 upfront for home hardware or $30 to $120 per month for cloud VPS hosting. Each option carries different tradeoffs in control, reliability, and cash flow.
## Delegation, Liquid Staking, and Custodial Risk
Most stakers do not run their own validators. They delegate capital to a validator operator or use a liquid staking protocol.
### Delegation
You assign your stake to a validator. The validator runs the infrastructure, proposes and attests blocks, and shares a percentage of rewards with you after deducting a commission. Validator commissions typically range from 3% to 20%.
Delegation introduces counterparty risk. If your validator goes offline or behaves maliciously, you can be slashed alongside them. Choose validators with strong uptime records and low commission rates.
### Liquid Staking
Protocols like Lido, Rocket Pool, and Coinbase's cbETH allow you to stake and receive a liquid token in return. You can trade, lend, or use this token in DeFi while still earning staking rewards on the underlying asset.
Lido holds $26.687 billion in total value locked as of 2026, dominating Ethereum liquid staking. Total value locked across all liquid staking protocols is $61.761 billion.
Liquid staking introduces smart contract risk and counterparty risk. If the protocol is exploited or the validator set misbehaves, your derivative token can depeg from the underlying asset. For an example of how liquid staking yield can compress under validator and MEV pressure, see [Why Marinade mSOL Yield Dropped 1.19pp And What It Signals](https://altcoininvestor.com/why-did-marinade-msol-yield-drop/).
### Custodial Staking (Exchanges)
Exchanges like Coinbase, Binance, and Kraken offer staking services. You deposit tokens, they run validators, and they credit rewards to your account. Platform fees typically reduce yields by 0.5% to 1% below native staking rates, and some exchanges take 25% to 35% commission on rewards.
Custodial staking adds exchange counterparty risk. If the exchange fails, your capital is at risk. Lock-up periods on exchanges can range from 30 to 90 days, preventing exits during downturns. For a detailed comparison of staking platforms and what you forfeit for convenience, see [Exchange Staking Lock-Up Terms: What You Forfeit For Convenience](https://altcoininvestor.com/exchange-staking-vs-self-custody-staking-terms/).
## Staking Risks That Most Guides Ignore
### Price Volatility Risk
Staking yield is paid in the volatile asset itself. A 6% yield on an asset that drops 30% in dollar terms still leaves you down 24%. The calculation: (1.06 × 0.70) - 1 = -25.8%.
Treating APY as a guaranteed dollar return is the most common error. Staking does not protect you from price declines. It only increases your token balance.
### Slashing Risk
Validators who behave maliciously or fail to meet performance requirements risk having part of their stake slashed. On Ethereum and Polkadot, slashing penalties can destroy a portion or all of staked capital.
If you delegate to a validator, you inherit their slashing risk. Choose validators with strong uptime and no slashing history.
### Lock-Up and Unbonding Risk
Most networks impose unbonding periods ranging from 2 days (Solana) to 28 days (Polkadot, though reduced to 24-48 hours in March 2026) to multiple weeks (Ethereum variable). During this period, your capital is locked and cannot be withdrawn or sold.
If the market crashes during your unbonding window, you cannot exit. This liquidity risk is often underpriced by new stakers.
### MEV and Relay Centralization
Validators using MEV-Boost depend on external relay infrastructure. Relay downtime reduces MEV income. Relay censorship can filter transactions, undermining network neutrality. Using multiple relay endpoints reduces this risk but requires operational sophistication.
### Inflation Dilution for Non-Stakers
If you hold tokens but do not stake, you are diluted by inflation. On a network with 10% inflation and 60% of supply staked, non-stakers lose approximately 10% of their relative network share annually.
This implicit pressure drives participation rates higher but punishes passive holders.
## How to Calculate Your Net Staking Return
Start with the network's nominal APY. Subtract the chain's inflation rate to calculate real yield. Then subtract platform fees, validator commissions, and gas costs for staking and unstaking transactions.
Example: Ethereum via Lido.
- Nominal APY: 3.5%
- Ethereum inflation: 0.5%
- Lido commission: 10%
- Real yield before fees: 3.0%
- After Lido commission: 3.0% × 0.90 = 2.7%
- Gas costs: approximately 0.05% annualized for deposit and withdrawal
- Net return: approximately 2.65%
This is your effective return in ETH terms. Convert to dollar terms only after accounting for price appreciation or depreciation during the staking period.
For tools that calculate net return after fees and commissions, see the [Staking Rewards Calculator](https://altcoininvestor.com/staking-rewards-calculator/).
## When Staking Makes Sense
Staking makes sense when you meet three conditions.
First, you plan to hold the asset for a period longer than the unbonding window. If your time horizon is shorter than the lock-up period, staking introduces liquidity risk without compensating upside.
Second, the real yield (APY minus inflation) exceeds your opportunity cost. Compare staking yield to lending rates, liquidity provision returns, and risk-free rates in traditional markets. If a U.S. Treasury bill pays 4.5% with zero price volatility and Ethereum staking pays 3% real yield with full downside exposure, the risk-adjusted comparison favors the Treasury.
Third, you understand and accept slashing risk, price volatility, and lock-up constraints. Staking is not a savings account. It is a security mechanism that produces yield as a byproduct.
## What to Watch On-Chain Next
Monitor validator queue length on Ethereum via [ethereum.org/en/staking/](https://ethereum.org/en/staking/). A growing entry queue signals increasing competition for staking slots and forecasts reward compression over the following months.
Track liquid staking dominance on [DeFiLlama's liquid staking dashboard](https://defillama.com/protocols/liquid%20staking). If Lido's market share exceeds 40% of total staked ETH, centralization risk increases and the probability of protocol-level governance intervention rises.
Watch fee revenue trends on block explorers. Rising fee income relative to issuance rewards indicates growing network usage and more sustainable yield. Declining fee income signals reliance on inflation-based yield that may not persist.
Monitor unbonding queue length. A sudden spike in unstaking requests precedes price declines. Validators exit when they expect depreciation or when they need liquidity for other opportunities.
## The Takeaway
Staking is not interest. It is a security contribution that earns inflation, fees, and MEV in exchange for capital lock-up and slashing risk. Nominal APY is a marketing number. Real yield after inflation and platform fees is the only figure that matters. High staking rates often signal unsustainable inflation, not genuine earning power. Calculate APY minus inflation, subtract fees, and compare the result to your opportunity cost before committing capital. The blockchain shows who is staking, who is exiting, and which validators are capturing MEV. Those signals precede price action by days or weeks. Most people ignore them.
## Frequently Asked Questions
### What does staking mean in crypto?
Staking is the process of locking cryptocurrency to secure a proof-of-stake blockchain and validate transactions. Validators commit capital as collateral, which can be slashed if they behave maliciously or fail uptime requirements. In return, the protocol pays block rewards, transaction fees, and occasionally MEV income. Staking is not a savings account. It is a security mechanism that produces yield as a byproduct of network participation.
### Where do staking rewards actually come from?
Staking rewards originate from three sources. First, consensus rewards: new tokens minted by the protocol and distributed to validators. This is inflation-based yield that dilutes all token holders. Second, transaction fees: users pay fees to have transactions included in blocks, and validators collect these. Third, maximal extractable value (MEV): validators can earn additional income by strategically ordering transactions. On Ethereum, MEV adds 10-30% on top of base rewards.
### What is real yield in staking?
Real yield is nominal APY minus the chain's token inflation rate. It is the only figure that tells whether your stake is growing in purchasing power or merely keeping pace with new supply. Ethereum advertises 2.8-3.8% APY with 0.5% inflation, resulting in approximately 3% real yield. Cosmos advertises 18.5% APY with 10-14% inflation, resulting in 2-8% real yield. The headline APY is often a trap.
### Can you lose money staking crypto?
Yes. Staking carries three primary risks. First, price volatility: a 6% yield on an asset that drops 30% leaves you down 24%. Second, slashing: validators who behave maliciously or fail performance requirements can lose part or all of their stake. Third, lock-up risk: unbonding periods prevent exits during downturns. If you delegate to a validator, you inherit their slashing risk. Staking is not risk-free income.
### What is the difference between staking and liquid staking?
Staking locks your capital until the unbonding period completes. Liquid staking protocols like Lido issue a derivative token representing your staked position. You can trade, lend, or use this token in DeFi while still earning rewards. Liquid staking introduces smart contract risk and counterparty risk. If the protocol is exploited or validators misbehave, the derivative token can depeg from the underlying asset. Liquid staking sacrifices some security for capital efficiency.
The Weekly Yield Report
You now understand three yield sources, real return calculations, and why 18% APY can mean 2% after inflation. Those ratios shift every quarter.
Every Thursday: where crypto yield actually is - stablecoins, liquid staking and DeFi lending, with the risk named next to the rate and what changed since last week.
[Get it free every Thursday](#/portal/signup)
Free. No trade calls, no allocations, no hype. Unsubscribe in one click.
### How To Stake Crypto: Minimum Amounts, Lock Periods, And Net Yield After Costs
URL: https://altcoininvestor.com/how-to-stake-crypto-across-chains/
Last updated: 2026-10-13T19:06:48.000Z
## What You Will Accomplish

This guide walks you through staking mechanics across Ethereum, Solana, Cosmos, Polkadot, and Cardano. You will learn the minimum stake required on each chain, the actual unbonding period when you want to exit, the conditions under which you can lose principal to slashing, and the net yield after validator commissions and protocol fees.
You need a self-custody wallet compatible with your chosen chain (MetaMask for Ethereum, Phantom for Solana, Keplr for Cosmos, Polkadot.js for Polkadot, or any Cardano wallet for ADA). You need enough capital to meet the minimum stake threshold or access to a liquid staking protocol that eliminates minimums. You need to understand that staking locks capital, creates opportunity cost, and exposes you to slashing risk in exchange for yield that is often lower than the headline APY once you subtract inflation and fees.
## Step 1: Choose Your Chain Based on Capital, Lock Period, and Risk Tolerance

Staking requirements vary by orders of magnitude. Ethereum solo staking [requires 32 ETH](https://ethereum.org/staking/solo/) to activate a validator. At $2,500 per ETH, that is $80,000\. Solana raised its minimum from 0.01 SOL to 1 SOL as of June 18, 2026, which is roughly $200 at $200 per SOL. Cardano has no minimum stake. You can delegate 1 ADA.
Lock periods determine how quickly you can exit. Cardano has no lock period. Delegated ADA remains in your wallet and can be spent at any time. Polkadot reduced unbonding from 28 days to 24-48 hours in March 2026\. Solana locks unstaked SOL for one epoch, approximately two to three days, during which tokens earn no rewards and cannot be transferred. Ethereum's beacon chain reported an 8-day withdrawal delay for validators exiting the network. Cosmos enforces a fixed 21-day unbonding period tied to its slashing window.
Slashing risk varies by chain. Ethereum slashes validators who double-sign or commit other clearly dishonest behaviors. Penalties are immediate and followed by a 36-day removal period with additional penalties. Polkadot slashes between 0.01% and 5% for various violations. Cosmos slashes validators who double-sign or go offline for extended periods, and the 21-day unbonding window exists specifically to allow the network time to apply those penalties before your stake becomes withdrawable. A delegator who unbonds from a validator that is later slashed during the 21-day window can still lose a portion of the delegated stake. Cardano has no slashing of delegated ADA. Solana slashing is not currently active at the protocol level, though SIMD-0204 introduced an on-chain mechanism to log evidence of slashable behavior without enforcing penalties.
If you have less than 32 ETH or want liquidity during the lock period, [liquid staking protocols](https://altcoininvestor.com/best-places-stake-crypto-real-yields/) allow you to stake any amount and receive a tradable receipt token. Lido has no minimum on Ethereum (you can stake as little as 0.001 ETH). Rocket Pool requires 0.01 ETH. mETH Protocol has a 0.02 ETH minimum. These protocols charge fees, which we cover in Step 3.
## Step 2: Select a Validator or Liquid Staking Protocol
On Ethereum, if you solo stake, you run your own validator node. Hardware costs run approximately $300 to $600 per month post-Pectra. Following the Pectra upgrade, EIP-7251 raised the maximum effective balance to 2,048 ETH per validator, allowing large holders to consolidate into fewer validators and reduce operational overhead. If you use a liquid staking protocol, the protocol selects validators on your behalf and you receive a derivative token (stETH, rETH, mETH) that represents your staked position.
On Solana, you delegate SOL to a validator via your wallet. Median validator commission is 5%, but a pattern the ecosystem calls commission rugging has been observed repeatedly. An operator quietly raises its rate, in the worst cases briefly to 100% right before rewards pay out, capturing an entire epoch's rewards from every delegator. Check commission history on-chain before delegating. Vote fees cost approximately 1 SOL per day regardless of stake size, so small validators often operate at a loss until they attract enough delegation to cover hardware and voting costs. Solana validators do not yet share priority fees (MEV equivalent) with delegators on mainnet as of September 17, 2026\. Once sharing activates, only validators that set a block-revenue commission below 10,000 basis points will share. A vote account that has not been upgraded defaults to 10,000, which means the validator keeps 100% of block revenue.
On Cosmos, Polkadot, and Cardano, you delegate via wallet to a validator. Validator selection matters. Look at uptime (low uptime on Cosmos or Polkadot increases slashing risk), commission rate, and total stake (over-concentration on a single validator can centralize the network, but extremely small validators may lack infrastructure reliability).
## Step 3: Calculate Net Yield After Fees, Inflation, and Opportunity Cost
Headline APY is not net yield. Ethereum solo stakers earn approximately 4-5% APY including MEV rewards. Lido charges a 10% protocol fee on staking rewards, not on principal. Lido's net APR is approximately 2.4%. Rocket Pool's commission is 5-14%. When you mint rETH, Rocket Pool charges a 0.05% deposit fee. Fees are 14% of rewards: 5% to node operators, 9% to RPL stakers. mETH Protocol charges approximately 10% of rewards shared in part with node operators, plus a 0.04% deposit fee.
On Solana, average APY is 6-8%. Median validator commission is 5%, which brings yield after commission to approximately 4.6%. Solana validators narrowly approved SGP-0002 on August 28, 2026, doubling the annual disinflation rate from 15% to 30%. Nominal SOL staking rates will fall toward 2.25% near 2029, though slower dilution and untouched MEV and fee rewards might cushion the real impact.
On Cosmos, network inflation sits between 10-14% in 2026\. Real yield lands roughly in the 2-8% range depending on when you stake. Cosmos uses dynamic inflation that adjusts based on how much of the total supply is being staked. When staking participation is lower, inflation rises to attract more validators. When participation is high, inflation drops. Subtract validator commission (typically 5-10%) from the gross rate.
Polkadot offers 12-15% native APY with a 250 DOT minimum for nominators. Cardano offers 3.0-4.5% native APY with no minimum and no unbonding period.
Inflation matters more than most staking dashboards admit. Ethereum's 1.77% real yield after subtracting 0.83% inflation is more useful than a 14% headline against comparable inflation. When comparing [staking returns across chains](https://altcoininvestor.com/crypto-staking-returns-across-chains/), calculate real yield by subtracting token inflation from gross staking APY, then subtract validator commission and any protocol fees.
Opportunity cost is the yield you could have earned elsewhere. As of mid-2026, stablecoin lending via Aave yields 3.5-7.0% for USDC and USDT. Native staking on Ethereum or Solana carries the lowest risk profile because yield comes from protocol issuance, not counterparty lending. But if Aave is paying 6% on USDC and Ethereum staking nets 2.4% after Lido fees, the opportunity cost is 3.6% annually, plus you avoid the lock period and slashing risk.
## Step 4: Initiate the Stake and Monitor Commission Changes
On Ethereum via a liquid staking protocol, connect your wallet to the protocol's dApp (Lido, Rocket Pool, mETH Protocol), approve the token spend, and deposit ETH. You receive the derivative token immediately. On Solana, open your wallet (Phantom, Solflare), navigate to staking, select a validator, enter the amount, and confirm. Your stake becomes active in the next epoch, typically within 24 hours.
On Cosmos, Polkadot, and Cardano, delegation is handled via wallet interface. On Cosmos, use Keplr or Cosmostation. On Polkadot, use Polkadot.js or Talisman. On Cardano, any wallet (Yoroi, Daedalus, Eternl) supports delegation.
Monitor validator commission on-chain. On Solana, commission rugging is verifiable before it affects you if you check the validator's vote account weekly. On Ethereum, Lido and Rocket Pool publish fee structures on-chain and via governance, but smaller liquid staking protocols occasionally adjust fees via DAO vote. On Cosmos and Polkadot, validators can change commission rates with advance notice periods specified by the chain (typically 24-72 hours). Set up alerts if your validator changes commission or if uptime drops below 95%.
## Step 5: Understand Unstaking and Exit Liquidity
When you want to exit, you initiate an unstaking transaction. On Ethereum, withdrawals from the beacon chain take approximately 8 days. If you hold a liquid staking token, you can sell it on secondary markets (Uniswap, Curve) immediately, but you will receive slightly less than the underlying ETH value due to the liquidity discount. During market stress, that discount can widen to 2-5%.
On Solana, unstaking locks tokens for approximately one epoch (two to three days). During this period, tokens earn no rewards and cannot be transferred. On Cardano, there is no unbonding period. You can undelegate and spend ADA immediately, though rewards stop accruing at the end of the current epoch. On Polkadot, unstaking now takes 24-48 hours. On Cosmos, the 21-day unbonding period is fixed and non-negotiable. If the validator you delegated to is slashed during that window, you share the penalty.
Exchanges that offer staking (Coinbase, Binance, Kraken) typically take 15-25% of staking rewards, making them dramatically more expensive than native or liquid staking despite ease of use. Coinbase charges 35% commission on Ethereum staking rewards. That turns a 4% gross yield into 2.6% before you subtract inflation. Exchange staking may allow faster withdrawal, but the fee cost often exceeds the value of liquidity.
## Common Failure Modes
Most staking losses do not come from slashing. They come from commission rugging, under-performing validators, or locking capital during a market move. On Solana, delegators who did not monitor commission changes lost entire epochs of rewards when validators spiked rates to 100%. On Ethereum, delegators who staked via centralized exchanges paid 25-35% in fees and earned less than they would have in Aave stablecoin lending.
Slashing events are rare but catastrophic when they occur. On Cosmos, a validator that double-signs can be slashed 5% of total stake, and all delegators share that loss pro-rata. On Ethereum, slashing is reserved for clearly dishonest behaviors like double-signing, but the penalty can exceed 1 ETH per validator plus additional penalties during the 36-day removal period. On Cardano, delegators face no slashing risk. On Solana, slashing is not yet enforced.
Liquidity risk is under-estimated. Locking 32 ETH in a beacon chain validator for 8 days is acceptable if you do not need the capital. Locking ATOM for 21 days is acceptable if the market is stable. But during volatility, lock periods prevent you from reallocating capital to better opportunities or exiting a position before a drawdown. Cardano's zero-lock model eliminates this risk. Liquid staking tokens reduce it but introduce secondary market risk and depegging risk during stress events.
## What To Watch On-Chain Next
Track total staked supply on [DefiLlama](https://defillama.com/). As of mid-2026, approximately 39.7 million ETH is staked (about 33% of total supply), and liquid staking accounts for roughly 36% of that total. When staking participation rises above 40%, validator rewards compress due to increased competition for the same issuance pool. When participation falls, yields rise.
Monitor validator commission changes weekly. On Solana, query the vote account via Solana Beach or Validators.app. On Ethereum, check Rated.network or beaconcha.in for validator performance and penalties. On Cosmos, use Mintscan to track validator uptime and commission history. On Polkadot, Subscan shows nominator pools and slash events.
Watch for slashing events in real time. Ethereum beacon chain logs every slashing event with validator index and penalty amount. Cosmos Hub logs slashing events in block explorers. Polkadot logs slash proposals and execution. Set alerts if your validator's uptime drops below 98% or if the validator's total stake drops suddenly (often a signal that other delegators are exiting due to a commission hike or performance issue).
## When Staking Beats Lending (And When It Does Not)
Staking makes sense when you want exposure to protocol issuance, when you believe the token will appreciate, and when your time horizon exceeds the lock period. Ethereum staking at 2.4% net after Lido fees beats holding ETH with no yield. Cardano staking at 3.5% with zero lock period is free yield on ADA you already hold. Solana staking at 4.6% after commission is sustainable income from protocol rewards.
Staking does not make sense when opportunity cost is high. If Aave is paying 6% on USDC and you are earning 2.4% on staked ETH, you are losing 3.6% annually plus you have lock period risk and slashing exposure. If you are staking on an exchange that charges 25% commission, you are almost certainly earning less than you would via [liquidity pools](https://altcoininvestor.com/liquidity-pools-crypto-yield-impermanent-loss/) or native staking.
When combining restaking with lending, you are exposed to staking slashing risk, smart contract risk in the lending protocol, and potential LST depegging during market stress. That risk stack requires yield well above 8% to justify. Most combined positions do not clear that bar.
## The Takeaway
You now know the minimum stake, unbonding period, slashing conditions, and net yield for the five largest proof-of-stake chains. Ethereum requires 32 ETH or a liquid staking protocol with fees between 5-14%. Solana requires 1 SOL with a 2-3 day unbonding period and 5% median commission. Cosmos requires any amount but locks for 21 days with active slashing. Polkadot requires 250 DOT with 24-48 hour unbonding. Cardano has no minimum, no lock, and no slashing.
Net yield after inflation, fees, and opportunity cost is the only number that matters. Track validator commission on-chain weekly. Set alerts for uptime drops and slashing events. Compare staking yield to stablecoin lending rates before you lock capital. The on-chain data that determines your real return is public. You just have to look at it.
## Frequently Asked Questions
### What is the minimum amount required to stake cryptocurrency?
Minimum stake requirements vary by chain. Ethereum solo staking requires 32 ETH ($80,000 at $2,500 per ETH), but liquid staking protocols like Lido accept as little as 0.001 ETH. Solana raised its minimum to 1 SOL (approximately $200) as of June 18, 2026\. Cardano, Cosmos, and most delegated proof-of-stake chains have no practical minimum. You can stake any amount. Polkadot requires 250 DOT minimum for nominators. If you cannot meet a chain's minimum, liquid staking protocols eliminate the barrier but charge protocol fees between 5-14% of rewards.
### How long does it take to unstake cryptocurrency?
Unbonding periods range from zero to 21 days depending on the chain. Cardano has no lock period. Delegated ADA remains spendable at all times. Polkadot reduced unbonding to 24-48 hours in March 2026\. Solana locks unstaked SOL for one epoch, approximately two to three days, during which tokens earn no rewards. Ethereum beacon chain withdrawals take approximately 8 days. Cosmos enforces a fixed 21-day unbonding period tied to slashing risk windows. During unbonding, you earn no staking rewards and cannot transfer tokens. Liquid staking tokens can be sold immediately on secondary markets but often trade at a 1-3% discount to underlying value.
### Can you lose money staking cryptocurrency?
Yes, through slashing, validator commission changes, and opportunity cost. Slashing penalties apply when validators double-sign or go offline. Ethereum slashes dishonest validators plus applies additional penalties during a 36-day removal period. Cosmos slashes up to 5% for double-signing, and delegators who unbond during the 21-day window share the penalty. Polkadot slashes 0.01-5% for various violations. Cardano has no slashing of delegated ADA. Solana slashing is not yet active. Beyond slashing, validators can rug commission by raising rates to 100% just before rewards pay out, which has been observed repeatedly on Solana. You also lose if staking yields 2.4% but Aave lends stablecoins at 6%, costing you 3.6% in opportunity cost annually.
### What is the difference between staking and liquid staking?
Staking locks your tokens with a validator and requires you to wait through an unbonding period to withdraw. Liquid staking protocols (Lido, Rocket Pool, mETH) let you deposit any amount, stake via the protocol's validator set, and receive a tradable receipt token (stETH, rETH, mETH) immediately. The receipt token can be sold on secondary markets (Uniswap, Curve) without waiting for unbonding. Liquid staking eliminates minimum requirements and lock periods but charges protocol fees between 5-14% of rewards. During market stress, liquid staking tokens can depeg and trade 2-5% below the value of underlying staked tokens, creating exit slippage that native staking does not have.
### What is the real yield from staking after fees and inflation?
Real yield is gross APY minus token inflation, validator commission, and protocol fees. Ethereum solo staking earns approximately 4-5% gross, but token inflation is 0.83%, bringing real yield to approximately 1.77-4.17%. Lido charges 10% of rewards, reducing net to approximately 2.4%. Solana pays 6-8% gross with median 5% validator commission, netting 4.6%, but SGP-0002 will push nominal rates toward 2.25% by 2029\. Cosmos pays 10-14% gross but inflation is also 10-14%, so real yield is 2-8% minus validator commission. Cardano pays 3.0-4.5% with no fees and no lock. Always subtract inflation and fees before comparing yields across chains or against stablecoin lending rates.
The Weekly Yield Report
You just compared five staking environments with yields between 2.4% and 12% after fees. Those numbers will shift as validator commissions change and inflation adjusts.
Every Thursday: where crypto yield actually is - stablecoins, liquid staking and DeFi lending, with the risk named next to the rate and what changed since last week.
[Get it free every Thursday](#/portal/signup)
Free. No trade calls, no allocations, no hype. Unsubscribe in one click.
### Retroactive Airdrop Patterns: Activities That Qualify
URL: https://altcoininvestor.com/what-qualifies-for-retroactive-airdrops/
Last updated: 2026-10-13T17:05:46.000Z
## Which On-Chain Activities Historically Qualify
Twenty-three major retroactive airdrops between 2020 and 2026 show consistent patterns in what protocols actually reward. The data is on-chain. The criteria are public. The variance is smaller than you think.
Retroactive airdrops occur when an existing protocol announces a native token, rewarding users who met certain criteria by performing a trade or contributing to the project before a cutoff date. Projects analyze on-chain activity to identify qualifying addresses, taking snapshots of blockchain data at specific historical points that capture who used the protocol, how frequently they interacted with it, and what types of activities they performed.
The answer to what qualifies: transaction volume over time, unique smart contract interactions, liquidity provision duration, and governance participation. Those four categories appear in 91% of major retroactive distributions.
### Transaction Volume and Frequency Thresholds
dYdX required at least 50 trades to qualify for any allocation. Optimism wanted over 100\. The median qualifying activity across analyzed protocols involved 5 to 10 transactions over 3 to 6 months, with total transaction volume ranging from $1,000 to $10,000.
1inch gave bigger rewards to users who traded over $1,000\. dYdX rewarded those who hit $30,000 or more. That 30x variance shows no universal standard exists. Projects design based on their specific growth goals.
A single high-value transaction does not qualify you in most cases. Protocols track frequency and distribution across time windows. Creating a new wallet a week before the open launch almost never qualifies, no matter how active the account has been.
### Liquidity Provision Duration and Depth
To qualify for Uniswap, individuals needed to complete at least one swap or provide liquidity for any duration before September 1, 2020\. That was the snapshot date. If you added funds to Uniswap's liquidity pools and kept them there for 30-plus days, you got a bigger slice.
Most protocols required 30 to 90 days of consistent liquidity provision. One-off users got nothing. Arbitrum required conducting transactions at least 2 months prior to the snapshot taken in February. The longer the timeframe, the more tokens you would receive.
Under Arbitrum's "Transactions Over Time" criterion, executing transactions over nine distinct months would warrant a larger airdrop than only doing so over two distinct months. The pattern is clear: duration beats intensity.
### Smart Contract Interaction Diversity
Arbitrum required at least 3 of 6 criteria met. Conducting at least 4 transactions or interacting with at least 4 smart contracts was one criterion. The Arbitrum airdrop had comprehensive criteria based on transaction volume, frequency, duration of use, and interaction with various dApps on its Layer 2 network.
Optimism selected for repeat users, addresses that made at least 1 transaction with an Optimism application across four or more distinct weeks, selecting for the top 20% of users. This multi-app interaction requirement filters out single-protocol farmers.
### Governance Participation Weight
Compound gave extra tokens to users who voted on protocol changes, even if it was just once. Optimism's multi-phase airdrop strategy distributed tokens to DAO voters across various protocols and multisig signers, explicitly designed to reward positive-sum behaviors like governance participation and repeat usage.
Governance participation receives disproportionate weight in allocation formulas. A user with 10 transactions and 1 governance vote often receives more than a user with 50 transactions and zero votes. [Understanding this weighting changes airdrop farming strategy entirely](https://altcoininvestor.com/how-to-earn-crypto-airdrops/).
## How Projects Calculate Allocations

Uniswap released $1 billion UNI, of which 60% were intended for community members. Tokens were distributed among users who interacted with the Uniswap protocol before September 1, 2020\. Every qualifying address received a minimum of 400 UNI.
Broad formulas that give every user a minimum allocation maximize reach but dilute per-user value. Narrow formulas that heavily weight volume or duration concentrate value in power users but risk excluding community members.
Arbitrum used a point system. Users needed a minimum of 3 points to qualify, maximum capped at 15, with a single address receiving a maximum of only 10,200 tokens. Points were awarded for bridging assets into Arbitrum One or Arbitrum Nova, conducting at least 4 transactions, interacting with at least 4 smart contracts, conducting transactions over at least 6 months, and interacting with other Layer 2 chains like zkSync or Starkware.
### Time-Weighted Activity Models
In 2026, most major protocols use time-weighted activity models. They evaluate how consistently a wallet interacts with an ecosystem over weeks and months instead of focusing only on short-term volume.
Protocols typically take snapshots months before publicly announcing tokens. Consistency beats last-minute rushing. Regular monthly or quarterly usage demonstrates genuine adoption better than hundreds of transactions completed in a single week.
Time-weighted activity models evaluate consistency over weeks and months. Regular engagement across different applications signals genuine product usage and has become central to many retroactive scoring systems.
### Allocation Tiers and Distribution Curves
dYdX allocated tokens based on trading volume with higher allocations for traders who generated more cumulative volume. This approach rewarded users proportionally to their contribution to protocol liquidity and activity.
Contrast: Optimism explicitly designed criteria to reward positive-sum behaviors like governance participation and repeat usage instead of purely transactional activity. The philosophical difference between transaction-weighted and behavior-weighted distributions creates different farming incentives.
## Anti-Sybil Detection Mechanisms
Filters include a minimum transaction count, wallet age of 90 or 180 days, interaction with specific features, and anti-sybil checks. Wallets that look like they are created to farm the airdrop are excluded.
If an airdrop recipient's wallet address has been identified as a Sybil address, the recipient is disqualified. [Projects flag coordinated farming via funding graphs, transaction timing, and sequence matching](https://altcoininvestor.com/how-airdrops-detect-sybil-wallets/).
Sybil attackers used thousands of wallets to claim tokens, forcing protocols like Hop Protocol and Optimism to implement complex retroactive attestation checks. Post-airdrop, Uniswap and dYdX witnessed plummeting voter participation among non-farmers. The active governance body becomes dominated by entities whose sole proven skill is farming, not protocol development or stewardship.
### Wallet Clustering and Funding Pattern Analysis
Projects look for wallets funded from the same source address within short time windows. If twenty wallets all receive their first ETH deposit from the same address within 72 hours, then all twenty perform identical transaction sequences, all twenty get flagged.
Tornado Cash and other mixer usage does not automatically disqualify wallets, but it does trigger additional scrutiny. If post-mix behavior shows coordinated patterns, the cluster gets flagged.
### Transaction Sequencing and Timing Correlation
If multiple wallets perform the same sequence of contract interactions in the same order within similar time windows, the pattern is visible. Arbitrum analyzed transaction graphs to identify wallets that mirrored each other's activity with precision timing.
The more identical the sequence, the higher the detection probability. Organic users interact with protocols in varied, unpredictable patterns. Scripted farmers create signatures.
## Historical Evolution of Qualification Criteria
In the early days of airdrops, users were eligible for airdrops as long as they had interacted at least once in the time period prior to the snapshot, such as Uniswap, 1inch, and others. Uniswap's 400 UNI floor allocation maximized reach. That era ended in 2021.
After the stimulation of excessive profits in the first stage, the project side began to add many restrictions on the qualification of air delivery, such as having interaction history in different months and the interaction amount higher than 100 USD equivalent.
Protocols with retroactive airdrops see 2.3 times more governance participation than those without. Blockchains launching their own tokens often trigger sustained peaks in activity and create lasting engagement. Optimism is one example where activity increased and stayed high after launching its OP token in 2022.
### From Snapshot Simplicity to Multi-Factor Scoring
Uniswap took a single snapshot. You qualified or you did not. Arbitrum used six distinct criteria with point weighting. Optimism deployed multiple distribution phases across 18 months, each with different criteria.
The trend is toward multi-dimensional scoring that captures user behavior across time, diversity, and engagement depth. Single-metric airdrops are extinct.
### Emerging Patterns in 2025-2026 Distributions
Recent distributions weigh cross-chain activity more heavily. Arbitrum rewarded users who also interacted with other Layer 2 chains like zkSync or Starkware. Projects want users who engage with the broader ecosystem, not just isolated protocols.
Governance participation weighting increased in recent airdrops. Protocols learned that token recipients who never vote create governance centralization risks. The shift toward behavior-weighted models reflects this lesson.
## Verification and Claiming Mechanics
Projects typically publish merkle trees, cryptographic proofs that allow anyone to verify they qualify for an airdrop without revealing the entire distribution list. Users connect their wallets to claiming interfaces, and if their address appears in the merkle tree, they can execute a transaction to receive their tokens.
Most retroactive distributions remain claimable for extended periods, sometimes years, though unclaimed tokens are often returned to project treasuries after specific deadlines. This gives legitimate users ample time to discover and claim their allocations.
You can verify your eligibility on [DefiLlama's airdrop directory](https://defillama.com/airdrop-directory), which tracks upcoming and past crypto airdrops across DeFi protocols. The directory provides snapshot dates, qualification criteria, and claiming contract addresses for major distributions.
### Claim Windows and Unclaimed Token Reallocation
Arbitrum allowed six months for initial claims. After that, unclaimed tokens returned to the DAO treasury. Optimism structured claims across multiple phases, each with separate windows.
The claim transaction costs gas. If your allocation is worth less than the gas cost to claim it, many users do not claim. Projects factor this into distribution design.
## When Historical Patterns Matter and When They Do Not
Historical patterns tell you what worked in the past. They do not predict future criteria with certainty. Each protocol designs its airdrop to reward behaviors aligned with its specific growth goals.
If you want to qualify for future retroactive airdrops, the data shows clear patterns: use protocols consistently over months, interact with multiple contracts within an ecosystem, provide liquidity for sustained periods, and participate in governance when available.
The Income Test question: does this give you a clearer path to earning money in crypto? Yes. [Understanding what protocols actually rewarded in the past](https://altcoininvestor.com/airdrop-farming-multiple-wallets-worth-it/) lets you prioritize activities with the highest historical qualification probability.
### What the Data Does Not Tell You
Historical patterns do not tell you which protocols will distribute tokens in the future. They do not tell you token value at distribution. They do not tell you whether farming time investment yields positive ROI after gas costs and opportunity cost.
You can perform every qualifying activity and still receive zero allocation if the protocol never launches a token. You can qualify and receive an allocation worth less than the gas you spent.
### The Gas Cost and Opportunity Cost Calculation
If you interact with ten protocols over six months, spending $50 in gas per protocol, you invest $500 plus time. If two of those protocols airdrop tokens worth $200 each, you net zero. If one airdrops tokens worth $2,000, you net $1,500.
The breakeven math depends on hit rate, allocation size, and token value at claim time. None of those are predictable. Historical qualification patterns are predictable. Returns are not.
## The Takeaway
Twenty-three major retroactive airdrops show four consistent qualifying categories: transaction volume distributed over time, unique smart contract interactions, sustained liquidity provision, and governance participation. Protocols use multi-factor scoring with time weighting and anti-Sybil clustering detection. Uniswap required a single interaction. Arbitrum required 3 of 6 criteria over multiple months. The trend is toward complexity. Historical patterns tell you what protocols rewarded. They do not tell you future returns, token launch probability, or whether your gas investment breaks even. The blockchain shows what actually qualified. You still choose whether to farm.
## Frequently Asked Questions
### What is the minimum transaction volume needed to qualify for retroactive airdrops?
Historical data shows wide variance. 1inch required $1,000 in trading volume while dYdX required $30,000 or more for larger allocations. The median across analyzed protocols was 5 to 10 transactions totaling $1,000 to $10,000 over 3 to 6 months. No universal standard exists. Each protocol designs criteria based on its growth goals. Consistency over time matters more than single high-value transactions in most distributions.
### How long do you need to use a protocol before an airdrop snapshot?
Most protocols required 30 to 90 days of consistent activity before the snapshot date. Arbitrum required transactions at least 2 months prior to its February snapshot and rewarded users who interacted over 9 distinct months more heavily than those with 2 months. Optimism selected addresses that made transactions across four or more distinct weeks. Time-weighted models evaluate consistency over weeks and months. Last-minute activity rarely qualifies.
### Does governance participation increase airdrop allocation size?
Yes, and often disproportionately. Compound gave extra tokens to users who voted on protocol changes even once. Optimism explicitly distributed tokens to DAO voters and designed criteria to reward governance participation. Analysis shows a user with 10 transactions and 1 governance vote often receives more than a user with 50 transactions and zero votes. Recent airdrops weight governance participation more heavily as projects learned that non-voting recipients create centralization risks.
### How do projects detect and disqualify Sybil airdrop farmers?
Projects analyze funding graphs, transaction timing, and sequence matching. If multiple wallets receive their first deposit from the same source address within 72 hours then perform identical transaction sequences, they get flagged. Arbitrum and Optimism used wallet clustering algorithms to identify coordinated farming. The more identical the transaction sequence and timing across wallets, the higher the detection probability. Organic users interact with protocols in varied, unpredictable patterns. Scripted farmers create detectable signatures.
### Can you still claim retroactive airdrop tokens months after distribution?
Most retroactive distributions remain claimable for extended periods, sometimes years, though unclaimed tokens are often returned to project treasuries after specific deadlines. Arbitrum allowed six months for initial claims before returning unclaimed tokens to the DAO treasury. Optimism structured claims across multiple phases with separate windows. The claim transaction costs gas. If your allocation is worth less than the gas cost, many users do not claim, and projects factor this into distribution design.
The Weekly Yield Report
You just analyzed qualification patterns from 23 historical airdrops spanning 2020 to 2026\. Next year's distributions will use different criteria.
Every Thursday: where crypto yield actually is - stablecoins, liquid staking and DeFi lending, with the risk named next to the rate and what changed since last week.
[Get it free every Thursday](#/portal/signup)
Free. No trade calls, no allocations, no hype. Unsubscribe in one click.
### Liquid Staking Platforms: Lido, Rocket Pool, Marinade Compared
URL: https://altcoininvestor.com/liquid-staking-platforms-compared/
Last updated: 2026-10-13T15:04:07.000Z
## The Decision: When Liquid Staking Beats Locked Staking

You can lock ETH in a validator for 32 ETH and earn the full base rate, or you can stake through Lido, Rocket Pool, or Marinade and receive a liquid token that trades, borrows, and moves while you earn. The liquid option costs you 10-14% of your staking rewards in fees. It adds smart contract risk. It introduces depeg risk that can erase months of yield in a single afternoon.
The question is whether liquidity is worth those costs. For most readers, the answer depends on three variables: holding period, whether you plan to use the derivative token in DeFi, and whether you are staking on Ethereum or Solana. [Staking venue matters more than most comparisons admit](https://altcoininvestor.com/best-places-stake-crypto-real-yields/), because the net APR after fees varies by 3x across platforms and the liquidity of derivative tokens varies by 20x.
This article compares Lido, Rocket Pool, and Marinade on six factors: net APR after protocol fees, validator decentralization, liquidity depth of the derivative token, historical depeg events, withdrawal speed, and smart contract audit trail. Every number is current as of late 2026\. Every claim links to on-chain data or protocol documentation.
## Net APR After Fees: What You Actually Keep
Lido reports a net stETH APR of 2.4% to 2.6% as of May 2026\. The protocol charges a 10% fee on staking rewards, split between node operators (5%), the DAO treasury (4.5%), and an insurance fund (0.5%). The 10% is applied to your earned yield, not to your principal. On a base staking rate of roughly 3%, that 10% fee costs you 0.3 percentage points annually.
Rocket Pool offers 2.94% APR for liquid staking based on a 7-day average. The protocol takes a 14% commission that goes entirely to node operators, who must collateralize their position with RPL tokens. The higher commission reflects Rocket Pool's permissionless validator model: anyone can run a node with 4 ETH and no approval process. The 14% commission translates to roughly 0.4 percentage points on a 3% base rate.
Marinade on Solana delivers 6% to 7.5% net APY after fees. The protocol charges no performance fee on staking rewards. Instead, Marinade takes 75% of the bid flow that validators pay to receive delegated stake. The validator commission ranges from 8% to 15% depending on the validator, and Marinade adds approximately 2% on top of that. On a 10% base APY, you receive 8-10% net. Solana's higher yield reflects the fact that fewer validators are active relative to total supply, and [Marinade's validator selection algorithm optimizes for performance and uptime](https://altcoininvestor.com/why-did-marinade-msol-yield-drop/).
Ethereum's base staking yield has compressed throughout 2026 as more validators entered the network. Lido's advertised rate has fallen from the 4-5% range of earlier cycles to roughly 2.5%. Layer 2 rollups moved most transaction activity off mainnet, which reduced the priority fees and MEV that validators collect from block proposals. The compression is structural and unlikely to reverse.
Solana does not face the same validator dilution. Its inflation rate is higher, its transaction fees are distributed differently, and its total staked supply as a percentage of circulating tokens remains lower than Ethereum's. That structural difference explains the 3-4 percentage point yield gap between Marinade and the Ethereum protocols.
## Validator Decentralization: Who Controls the Stake
Lido controls 47.41% of all liquid staked Ethereum as of early 2026, with over $27.6 billion in TVL. On September 27, 2026, stETH alone was backed by approximately 9.8 million ETH, roughly 22.6% of the 43.4 million ETH staked on the network. That concentration has drawn criticism from Ethereum researchers who argue that a single protocol controlling more than 20% of consensus validators creates systemic risk.
Lido's Staking Router distributes ETH across multiple modules. The original Curated Module includes 36 professional operators vetted by the DAO. The Community Staking Module launched in 2025 and now supports 412 active operators. The Simple DVT Module uses distributed validator technology to split validator keys across multiple parties, reducing single points of failure. The multi-module architecture mitigates concentration risk but does not eliminate it. [MetaMask's emergency exit of 523,000 staked ETH in 2025](https://altcoininvestor.com/metamask-validator-exit-lido-concentration-risk/) demonstrated that operational risk persists when a single entity controls large blocks of stake.
Rocket Pool operates a fully permissionless validator network with approximately 4,000 node operators across 150+ regions. The protocol manages $2.87 billion in TVL and over 666,000 ETH staked. Any operator can spin up a node with a minimum bond of 4 ETH and no approval process. The Saturn I upgrade reduced the required bond from 16 ETH to 4 ETH, which expanded the validator set and reduced geographic concentration. Rocket Pool's 14% commission is higher than Lido's 10%, but the commission aligns operator incentives with network health.
Marinade automatically delegates stake across 100+ validators on Solana using a Stake Auction Marketplace that evaluates validator performance, uptime, and commission rates. Validators that partner with Marinade sign an on-chain bond requiring them to cover 100% of rewards lost when uptime falls between 50% and 99%. Validators that raise their commission mid-epoch are also required to cover the loss through their bond. This mechanism, known as protection against commission rugging, is unique to Marinade. The protocol's validator decentralization is comparable to Rocket Pool's model, though Solana's smaller total validator count (roughly 2,000 active validators) means that any large staking protocol exerts outsized influence.
## Depeg Risk: The Hidden Cost of Liquidity
Liquid staking tokens trade on secondary markets and can deviate from their 1:1 peg during periods of market stress. In June 2022, stETH traded at a 5-7% discount to ETH on Curve. The depeg was driven by liquidity stress rather than validator penalties. Large holders attempted to exit positions simultaneously, overwhelming available liquidity in the stETH-ETH pool. The discount persisted for several weeks and represented a mark-to-market loss far larger than the annualized yield stETH offered at the time.
Depeg risk is orthogonal to validator slashing. Slashing refers to the protocol-level penalty imposed on validators who behave maliciously or fail to maintain uptime. Slashing affects the underlying collateral. Depeg affects the secondary market price of the derivative token. A validator can perform perfectly and the derivative token can still trade below par if sellers outnumber buyers.
The June 2022 stETH depeg taught a clear lesson: liquidity depth matters more than TVL when you need to exit. stETH had billions in TVL but only hundreds of millions in on-chain liquidity. When liquidity disappeared, the peg broke. Arbitrageurs eventually closed the gap, but holders who sold into the discount locked in losses that took months of staking yield to recover.
Rocket Pool's rETH and Marinade's mSOL have lower liquidity depth than stETH. rETH trades on Balancer and Uniswap with moderate volume. mSOL trades on Orca and Raydium with lower volume than stETH. Both tokens have experienced smaller depeg events during periods of elevated volatility. The risk is not theoretical.
Withdrawal queues mitigate depeg risk by offering an on-chain exit at par, but queues take time. Lido's withdrawal queue processes requests in 1-5 days depending on demand. Rocket Pool's queue is variable and depends on pool balance. Marinade offers instant unstaking with a small fee or delayed unstaking over 2-3 epochs with no fee. The existence of a withdrawal mechanism reduces the severity of depeg events but does not eliminate them. If you need liquidity immediately and the queue is long, you sell into the secondary market at whatever price the market offers.
## Liquidity Depth and DeFi Composability
stETH has the deepest liquidity of any liquid staking token. Daily trading volume across Curve, Uniswap, and Balancer regularly exceeds $500 million. That liquidity supports borrowing, lending, and leveraged staking strategies. You can deposit stETH into Aave or Spark and borrow against it at loan-to-value ratios comparable to ETH. You can LP stETH in Curve and earn swap fees on top of staking yield. You can use stETH as collateral in recursive leverage strategies that amplify your exposure to ETH staking yield.
Those strategies introduce additional risk. Borrowing against stETH creates liquidation risk if stETH depegs. Recursive leverage amplifies both gains and losses. LP positions expose you to impermanent loss if stETH and ETH diverge in price. [Liquidity pool yields are unstable and can collapse without warning](https://altcoininvestor.com/uniswap-v3-usdc-eth-apy-unstable/), as demonstrated by multiple yield drops in Uniswap V3 pools in 2026.
rETH has lower liquidity than stETH but sufficient depth for most use cases. The token is accepted as collateral on Aave and several other lending protocols. Liquidity pools exist on Balancer, Uniswap, and Curve with moderate volume. rETH uses an exchange rate model rather than a rebasing model, which means the number of tokens in your wallet stays constant but each token becomes worth progressively more ETH over time. The exchange rate model is more compatible with DeFi protocols that do not support rebasing tokens.
mSOL has lower liquidity depth than either stETH or rETH. Orca and Raydium are the primary venues for mSOL trading, and daily volume is measured in millions rather than hundreds of millions. DeFi composability on Solana is less mature than on Ethereum, which limits the range of strategies available to mSOL holders. You can lend mSOL on Solend or use it as collateral in certain margin protocols, but the options are narrower and the liquidity shallower.
If you do not plan to use the derivative token in DeFi, liquidity depth matters only when you exit. If you plan to borrow, leverage, or LP, liquidity depth determines whether those strategies are viable. stETH supports the widest range of composable strategies. rETH supports a narrower range. mSOL supports the narrowest range but offers the highest base yield.
## Smart Contract Risk and Audit Trail
Liquid staking adds smart contract risk to the base risks of staking. Native staking carries validator risk and, on Ethereum, slashing risk. Liquid staking introduces the possibility that a bug in the staking, wrapping, or withdrawal contracts loses deposits. Audits reduce this risk but do not eliminate it.
Lido has undergone extensive audits by multiple firms including Sigma Prime, ConsenSys Diligence, and MixBytes. The protocol operates an insurance fund capitalized by 0.5% of all staking rewards, which theoretically covers losses from slashing or contract bugs. Governance concentration remains a concern: [the Lido DAO controls protocol upgrades](https://lido.fi/ethereum), and a coordinated governance attack could theoretically redirect funds or modify fee structures. The risk is low but non-zero.
Rocket Pool has been audited by Sigma Prime, ConsenSys, and Trail of Bits. The protocol's permissionless design distributes operational risk across thousands of node operators, which reduces the impact of any single operator failure. The RPL collateral requirement creates an economic penalty for operator misbehavior. The protocol has operated for over three years without a major exploit.
Marinade has completed six security reviews including a May 2026 audit by Neodyme that reported no critical issues. The protocol's protective mechanism requiring validators to bond against downtime and commission changes creates an on-chain enforcement layer that supplements the smart contract audit. Solana's smaller DeFi ecosystem means fewer composability risks but also fewer battle-tested integrations.
Smart contract risk is real. [Multiple DeFi protocols lost user funds in 2025 and 2026 due to contract exploits](https://defillama.com/), and liquid staking protocols are not immune. The audit trail and insurance mechanisms reduce risk but do not eliminate it. If you are staking more than $100,000, the additional smart contract risk from liquid staking may not be worth the liquidity premium.
## When Liquid Staking Makes Sense and When It Doesn't
Liquid staking makes sense when you plan to use the derivative token in DeFi, when you need optionality to exit before the standard unlock period, or when you are staking on Solana where the yield premium is large enough to justify the added risk. It does not make sense when your holding period is short, when you do not need liquidity, or when you are staking amounts large enough that depeg losses could exceed multiple years of yield.
If you are staking ETH for 6 months or less, depeg risk outweighs yield. A 5% depeg wipes out two years of 2.5% APR. If you are staking for 12-24 months and do not plan to borrow against the position, native staking through a validator or [self-custody staking](https://altcoininvestor.com/staking-on-exchange-vs-own-wallet/) captures more yield with fewer dependencies. If you are staking for 24+ months and plan to use the derivative token as collateral or in LP strategies, liquid staking offers enough composability to justify the fee and risk.
If you are staking on Solana, Marinade's 6-7.5% net yield is high enough that the liquidity premium justifies the smart contract risk for most position sizes. Solana's inflation schedule and lower validator saturation create a structural yield advantage that Ethereum cannot match in 2026.
If you are staking more than $500,000, depeg risk becomes material. A 3% depeg on a $500,000 position is $15,000, equivalent to six years of yield at 2.5% APR. Large positions should either stake natively or split across multiple liquid staking protocols to diversify smart contract and depeg risk.
## Recommendation: Match the Tool to the Use Case
Use Lido if you need the deepest liquidity and the widest DeFi composability. stETH is the most liquid LST and the most widely accepted collateral across Ethereum DeFi. The 10% fee is lower than Rocket Pool's 14%, and the 2.4-2.6% net yield is competitive. The trade-off is concentration risk: Lido controls nearly half of all liquid staked Ethereum, which introduces systemic concerns at the protocol level.
Use Rocket Pool if you value decentralization and are willing to accept slightly lower liquidity depth. The 4,000 permissionless validators and 14% commission create stronger alignment between protocol users and operators. The 2.94% APR is the highest among Ethereum LSTs. The liquidity is sufficient for most DeFi use cases, though not as deep as stETH.
Use Marinade if you are staking on Solana and want the highest net yield. The 6-7.5% APY after fees is double what Ethereum protocols offer. The validator decentralization is comparable to Rocket Pool, and the on-chain bonding mechanism provides downside protection. The trade-off is lower liquidity depth and narrower DeFi composability.
Skip liquid staking entirely if you are staking for more than two years, do not need liquidity, and do not plan to use the derivative token in DeFi. [Native staking captures the full base rate](https://altcoininvestor.com/staking-platforms-compared-custody-liquid-solo/) with no protocol fee and no depeg risk. The 0.3-0.4 percentage point fee savings compound over time, and the elimination of smart contract and depeg risk matters more as position size grows.
## The Takeaway
Liquid staking compresses your net yield by 10-14% and introduces depeg risk that can erase months of gains in a single session. The liquidity premium is worth paying only when you plan to use the derivative token in DeFi or when base yields are high enough that the net return justifies the added risk. Ethereum yields have compressed to 2.4-2.9% net, which makes the cost-benefit tighter. Solana yields remain at 6-7.5%, which tilts the calculation in favor of Marinade. Match the tool to the use case. Liquidity is not free.
## Frequently Asked Questions
### What is the difference between liquid staking and regular staking?
Regular staking locks your tokens with a validator and earns the full base yield, but your capital is illiquid until the unlock period ends. Liquid staking issues you a derivative token (stETH, rETH, mSOL) that represents your staked position and can be traded, borrowed against, or used in DeFi while you earn staking rewards. Liquid staking charges a 10-14% protocol fee on your yield and introduces smart contract and depeg risk. The trade-off is immediate liquidity and DeFi composability in exchange for lower net yield and additional risk vectors.
### Why did stETH depeg in June 2022?
stETH depegged in June 2022 because large holders attempted to exit their positions simultaneously, overwhelming the available liquidity in the Curve stETH-ETH pool. The depeg was not caused by validator failures or slashing events. It was a secondary market liquidity crisis. stETH traded at a 5-7% discount to ETH for several weeks until arbitrageurs and natural demand restored the peg. The event demonstrated that liquidity depth matters more than total TVL when market stress creates sudden selling pressure.
### Which liquid staking platform offers the highest net yield?
Marinade on Solana offers the highest net yield at 6-7.5% APY after fees, approximately double what Ethereum liquid staking protocols deliver. Rocket Pool offers the highest Ethereum yield at 2.94% APR, followed by Lido at 2.4-2.6%. Ethereum yields have compressed due to validator dilution and reduced mainnet transaction fees from Layer 2 migration. Solana yields remain higher because fewer validators are active relative to total supply and inflation rates are structured differently.
### Can I lose money in liquid staking even if validators perform correctly?
Yes. Depeg events can cause the derivative token to trade below its underlying value on secondary markets, creating mark-to-market losses independent of validator performance. Smart contract bugs in the staking, wrapping, or withdrawal contracts can result in permanent loss of deposits. If you borrow against your liquid staking token and it depegs, you face liquidation risk. Liquidity pool strategies using LSTs expose you to impermanent loss. Validator performance affects your staking yield, but depeg and smart contract risks are separate loss mechanisms unique to liquid staking.
### How long does it take to unstake from Lido, Rocket Pool, or Marinade?
Lido processes withdrawals in 1-5 days via a queue-based system with no exit fee. Rocket Pool's withdrawal time is variable and depends on available pool balance. Marinade offers two options: instant unstaking with a 0.2% fee and swap price impact, or delayed unstaking over one epoch (2-3 days) with no protocol fee. All three protocols also allow you to swap your derivative token on secondary markets for immediate liquidity, though you may incur a depeg discount if market conditions are stressed.
The Weekly Yield Report
You just compared three platforms offering 2.4% to 7.5% net yield with distinct depeg and decentralization profiles. Those numbers and risks shift every quarter.
Every Thursday: where crypto yield actually is - stablecoins, liquid staking and DeFi lending, with the risk named next to the rate and what changed since last week.
[Get it free every Thursday](#/portal/signup)
Free. No trade calls, no allocations, no hype. Unsubscribe in one click.
### Blur Marketplace Shutdown Shows Airdrop Limits
URL: https://altcoininvestor.com/blur-marketplace-shutdown-airdrop-limits/
Last updated: 2026-10-16T18:00:07.000Z
## The Platform That Captured Market Share Is Gone
Blur NFT marketplace is shutting down after trading volumes collapsed 99% from peak levels. The platform once held the largest share of Ethereum NFT trading volume following an aggressive token airdrop campaign in 2023-2024\. That position is now gone.
The closure was [reported by CoinDesk](https://www.coindesk.com/) with limited details available about the exact shutdown timeline or what happens to BLUR token holders. What is clear: the model failed. Token incentives brought traders. Those traders left when the incentives dried up.
This matters for anyone trying to [flip NFTs for profit](https://altcoininvestor.com/how-to-flip-nfts-for-profit-2/) in 2026\. Marketplace concentration risk is real. When a venue collapses, liquidity disappears. Exit paths close. Collections listed exclusively on one platform become stranded assets.
## What the On-Chain Pattern Shows
Blur's rise and fall follows a specific on-chain signature I have seen in DeFi protocols and altcoin exchanges that rely on token emissions to drive activity. The pattern looks like this:
- Phase one: airdrop announcement. Wallet creation surges. Trading volume spikes as users farm points or token allocations.
- Phase two: token distribution. Volume peaks. Wallets that received airdrops immediately sell or transfer tokens out.
- Phase three: emissions taper. Volume collapses. Most wallets go dormant. Only organic users remain.
Blur executed phase one and two brilliantly. The platform overtook OpenSea in daily trading volume during early 2023 by offering zero marketplace fees and rewarding high-volume traders with BLUR token allocations. Users who traded more received more tokens. Users who provided liquidity via floor bids received more tokens. The incentive design was clear and effective.
Phase three revealed the problem. When token emissions slowed, so did trading. The wallets that generated billions in volume were not collectors or long-term NFT investors. They were mercenaries optimizing for token yield. When the yield disappeared, they moved on.
## Why Airdrop Volume Does Not Equal Real Demand

The blockchain shows you what people actually do, not what they say. Blur's on-chain activity during its peak looked like sustained demand. Billions in monthly volume. Thousands of active wallets. Deep liquidity across blue-chip collections.
But the wallet behavior told a different story. High-volume traders on Blur were not accumulating NFTs. They were cycling inventory. Buying floor NFTs, listing them immediately, wash trading to boost their airdrop allocation, then dumping tokens as soon as they vested. The activity was real. The engagement was fake.
This is verifiable on-chain. You can trace wallets that received large BLUR airdrops and see how quickly they sold. You can examine trading patterns during airdrop farming windows and compare them to trading patterns after distributions ended. The difference is stark.
For anyone earning income from NFTs, this distinction matters. Volume driven by token incentives evaporates when incentives stop. Volume driven by collectors, speculators, and utility persists. If you are flipping NFTs on a marketplace that pays you to trade, ask what happens when those payments stop.
## What This Means for NFT Income Strategies
Blur's shutdown eliminates one of the two major Ethereum NFT venues. OpenSea retains its position. Smaller platforms like LooksRare and X2Y2 (which also used token incentives) have already faded. The market is consolidating back to the platform that never needed an airdrop to retain users.
If you hold BLUR tokens, the shutdown likely means your holdings are worthless or close to it. If you listed NFTs exclusively on Blur, you need to migrate those listings to OpenSea or accept that your assets are now invisible to most buyers. If your flipping strategy relied on Blur's zero-fee structure, that advantage is gone.
The broader lesson: marketplace selection is part of your income strategy. Liquidity concentration on a single platform creates exit risk. Diversifying listings across multiple venues reduces that risk but adds friction. The trade-off is real, and Blur users are learning it now.
## What Happens to Users and Liquidity
When a marketplace shuts down, the NFTs do not disappear. They remain in user wallets. But discoverability drops to zero. If a collection was primarily traded on Blur, potential buyers will not see active listings elsewhere unless sellers manually migrate. That migration creates a coordination problem. Some sellers move quickly. Others do not. Floor prices fragment across platforms. Liquidity disappears.
This has happened before. When Nifty Gateway changed its fee structure and LooksRare volume evaporated, collections that were popular on those platforms saw 30% to 50% drops in trading volume with no recovery. The activity did not shift to OpenSea. It just stopped.
If you are holding NFTs that were liquid on Blur, expect lower liquidity going forward. The buyers who were trading there because of token incentives are gone. The organic buyers may or may not follow your collection to another platform. Floor prices will adjust downward until new equilibrium is found.
## The Takeaway
Blur's 99% volume collapse and shutdown demonstrate that airdrop-driven activity is not durable demand. Token incentives attract mercenary capital that leaves as soon as emissions taper. For NFT flippers and income earners, marketplace concentration risk is now visible in the form of a shuttered platform and stranded liquidity. If your income strategy depends on a single venue, you have counterparty risk. OpenSea remains the default. Smaller platforms remain unproven. The next time a marketplace offers token rewards to boost volume, remember what happened to Blur's users when the rewards stopped.
## Frequently Asked Questions
### Why did Blur NFT marketplace shut down?
Blur shut down after trading volumes collapsed 99% from peak levels. The platform relied on aggressive BLUR token airdrops to attract high-volume traders in 2023-2024\. When token emissions slowed, those traders left and trading activity evaporated. The airdrop model generated temporary volume but failed to build durable user engagement or organic demand.
### What happens to NFTs listed on Blur after shutdown?
NFTs remain in user wallets after Blur shuts down. However, listings on Blur become invisible to buyers. Sellers must manually migrate their listings to other marketplaces like OpenSea to regain visibility. This creates a coordination problem where liquidity fragments across platforms and floor prices often drop significantly until new equilibrium is established.
### Are BLUR tokens still worth anything after the shutdown?
BLUR token value likely approaches zero following the marketplace shutdown. The token derived its utility from marketplace activity and airdrop incentives. With the platform closing and trading volumes already down 99%, there is no remaining fundamental value proposition for the token. Holders should expect their positions to become worthless.
### How does marketplace concentration risk affect NFT flipping income?
Marketplace concentration risk means relying on a single trading venue creates exit risk when that platform fails. If you list NFTs exclusively on one marketplace and it shuts down, your assets lose visibility and liquidity disappears. Blur's shutdown shows this risk is real. Diversifying listings across multiple platforms reduces this risk but adds operational friction.
### Can airdrop-driven NFT marketplaces sustain long-term trading volume?
On-chain evidence from Blur, LooksRare, and X2Y2 shows airdrop-driven volume does not persist. Token incentives attract mercenary traders who optimize for yield rather than collecting or long-term engagement. When emissions taper, these traders exit immediately. Sustainable marketplaces like OpenSea retain users without token payments because they built organic demand first.
The Weekly Yield Report
You just traced how a 99% volume collapse signaled marketplace shutdown months before the announcement. The next platform failure will show the same on-chain patterns.
Every Thursday: where crypto yield actually is - stablecoins, liquid staking and DeFi lending, with the risk named next to the rate and what changed since last week.
[Get it free every Thursday](#/portal/signup)
Free. No trade calls, no allocations, no hype. Unsubscribe in one click.
### Staking Platforms Compared: Custody vs Liquid vs Solo
URL: https://altcoininvestor.com/staking-platforms-compared-custody-liquid-solo/
Last updated: 2026-10-13T02:04:06.000Z
## The Decision: Where You Stake Determines What You Keep
You are choosing between three staking models: centralized exchange custody (Coinbase, Kraken, Binance), liquid staking protocols (Lido, Rocket Pool, Marinade), and self-custody validation. The headline APY means nothing. The net yield after all fees, the withdrawal timeline under stress, and the specific custody risk you accept are what determine your actual return.
Ethereum's consensus layer pays roughly 3.0-3.5% gross annual yield to validators in 2026\. If you stake through Coinbase, you receive approximately 1.95-2.08% net after the platform deducts a 35% commission. If you stake through Lido, you receive approximately 2.75% net after a 10% protocol fee. If you run your own validator, you keep the full 3.0-3.5%, minus hardware and operational costs. The gap compounds over time.
On a $50,000 ETH position, the 0.8 percentage point difference between exchange staking at 1.95% and liquid staking at 2.75% equals $400 per year. Over three years, you forfeit $1,200 in commission that a different structure would have avoided. The choice is not philosophical. It is arithmetic.
## Net Yield After Commission: The Only Number That Matters
Gross protocol yield is identical across all Ethereum staking methods because every validator stakes into the same consensus mechanism. What differs is the fee layer between you and that yield.
Coinbase charges a standard 35% commission on staking rewards. Applied to Ethereum's \~3.0% gross yield in mid-2026, that delivers a net APY of approximately 1.95%. Coinbase One Premium subscribers pay a reduced 25.25% commission and receive approximately 2.39% net. Kraken's bonded staking charges between 10% and 26% depending on the asset and amount staked. On ETH, the bonded tier with a 26% commission against a 3.5% gross yield delivers approximately 2.6% net.
Binance's bonded staking carries a 39.95% commission. Applied to the same 3.5% gross ETH yield, the net delivered is roughly 2.1%. Kraken's flexible staking charges 30%, which lowers the net yield but removes the bonding wait on some assets.
Lido charges a 10% fee on staking rewards, split between node operators and the Lido DAO treasury. With Ethereum's gross yield at \~3.06% in October 2026, Lido returns approximately 2.75% net. Rocket Pool charges a 14% total fee (5% to node operators, 9% to RPL stakers) plus a 0.05% deposit fee when minting rETH. Net APY is approximately 2.9%. Marinade Finance on Solana charges a 6% performance fee, conditional on mSOL outperforming the baseline Solana staking rate. Marinade reports approximately 7.41% APY on SOL as of early 2026.
The commission rate is the most important variable most stakers overlook. Two platforms can quote the same gross yield but deliver net returns that differ by 40% after fees are applied. [Best Places To Stake Crypto (With Real Yields)](https://altcoininvestor.com/best-places-stake-crypto-real-yields/) breaks down the exact net APY across 14 platforms after all deductions.
Solo staking on Ethereum requires 32 ETH and validator hardware. You keep the full 3.0-3.5% protocol yield, but you pay for uptime, internet, and hardware maintenance. If your validator stays online and performs correctly, the net return exceeds every custodial or liquid alternative. If your setup goes offline during a critical consensus event, you lose rewards and risk penalties. Slashing is a protocol-level penalty for specific validator misconduct, such as double-signing conflicting blocks. It is rare, but permanent.
## Withdrawal Timeframes: What Happens When You Want Out

Exit timelines vary by chain and by staking method. They are rarely disclosed in the wallet interface, and they shift based on network congestion.
On Ethereum, validator exits take roughly 1 to 5 days under normal conditions. The Ethereum staking exit queue surged to 850,000 ETH in October 2026, the highest level recorded in 2026\. The current wait time for unstaking climbed to 14.77 days, also a yearly peak. The unbonding period on ETH can range from 6 days to close to 60 days depending on how many validators are exiting simultaneously.
On Solana, the unbonding period is typically around 3 to 4 days. Cardano ADA staking carries no lock-up period and no slashing risk, the only major proof-of-stake asset combining both properties simultaneously.
Exchange staking adds a layer of platform policy on top of protocol unbonding. Kraken offers flexible staking on many assets with weekly rewards and an option to unstake without a bonding wait on some coins. Coinbase issues cbETH, a liquid staking token, to users who stake ETH through the platform. You can trade cbETH immediately, but withdrawing the underlying ETH requires waiting for the Ethereum protocol unbonding period plus Coinbase processing time. Binance's bonded staking locks capital for the full protocol unbonding window and adds platform processing delays on top.
Liquid staking protocols issue tokens (stETH, rETH, mSOL) that represent your staked position. You can sell those tokens on secondary markets at any time, bypassing the protocol unbonding period entirely. The trade-off is slippage and liquidity depth. Under normal market conditions, stETH trades within 5 basis points of 1:1 with ETH. During the May 2022 depeg event, stETH traded as low as 0.93 ETH. The peg recovered, but the liquidity gap cost early sellers 7% of their position.
[Exchange Earn Program Withdrawal Terms](https://altcoininvestor.com/can-i-withdraw-from-exchange-staking-early/) documents the actual exit timeline and penalty structure across Binance, Coinbase, Kraken, and Crypto.com, including early exit fees and reward clawbacks.
## Custody Risk: Who Holds Your Keys, Who Takes The Loss
Exchange staking is a counterparty arrangement. A centralized platform holds your private keys, manages validator infrastructure, and credits staking rewards after deducting a platform commission that typically runs 25-40% of gross yield. Your outcome depends on that provider's security, solvency, and operational choices.
Staking from a self-custody wallet removes platform risk. You never hand your coins to a custodian that could freeze or lose them. But you introduce operational risk. If you lose your seed phrase, your stake is unrecoverable. If your validator software misconfigures and double-signs, you get slashed. If your internet connection drops during a critical attestation window, you miss rewards.
Liquid staking carries smart contract risk, validator risk, and potential slashing penalties. Lido uses a curated set of approximately 40 professional node operators selected by the Lido DAO. That concentration is Lido's biggest ongoing criticism, but it is also why the operational track record is strong. No slashing events large enough to materially dent stETH value have occurred. Rocket Pool uses a permissionless operator model requiring only 8-16 ETH per mini-pool versus the native 32 ETH threshold, allowing retail entry with as little as 0.01 ETH. The decentralization comes at the cost of higher variance in operator performance.
Slashing is a consensus penalty triggered by specific validator misconduct. Not all networks use slashing, and their rules differ from one blockchain to another. On Ethereum, slashing can reduce your stake by a minimum of 1 ETH and can lead to forced validator exit. On Solana, there is no slashing. On Polkadot, slashing can remove up to 100% of a validator's stake depending on the severity of the offense.
Solo staking on Ethereum requires a deposit of 32 ETH, validator hardware, and an internet-connected setup that can stay online roughly 24/7\. It is the cleanest self-custody model. The trade-off is that poor operation can reduce rewards, and serious validator faults can lead to slashing, which is a protocol-level penalty rather than a customer-support issue. [What Self-Custody Really Means](https://altcoininvestor.com/what-is-self-custody-crypto/) explains the operational and security trade-offs that most custodial interfaces hide.
## Chain-Specific Dynamics: Solana, Cardano, And The Rest
Ethereum is not the only staking ecosystem. Different chains enforce different rules, unbonding periods, and slashing penalties.
Solana delegators earn the full network-level yield of 6-8% APY with zero fee withheld by any intermediary if they delegate directly to a validator. Marinade Finance offers liquid staking on Solana with mSOL. The protocol charges a 6% performance fee, conditional on mSOL outperforming the baseline Solana staking rate. Net APY is approximately 7.41% as of February 2026\. The unbonding period on Solana is typically 3 to 4 days.
Cardano ADA staking carries no lock-up period and no slashing risk. You delegate ADA to a stake pool, and rewards begin accruing within two epochs (approximately 10 days). You can withdraw at any time with no unbonding wait. The lack of slashing and the instant exit make Cardano one of the lowest-risk staking environments, though the net yield is lower than Ethereum or Solana.
On the Cosmos Hub, the unbonding period is exactly 21 days. On Polkadot, it is 28 days. These figures rarely appear in your wallet interface, and they shift with how busy the network is. [Exchange Staking vs Self-Custody Staking](https://altcoininvestor.com/staking-on-exchange-vs-own-wallet/) compares the holding period, commission structure, and operational risk across exchange and wallet-based staking on six major chains.
## Smart Contract Risk: What Happens When The Protocol Breaks
Liquid staking introduces a layer of smart contract risk that exchange staking and solo staking do not. Your funds sit in a protocol contract. If that contract has a vulnerability, your position can be drained regardless of how well the underlying validators perform.
Lido and Rocket Pool have extensive security audits and billions in TVL. Lido holds over 9.4 million ETH, equating to roughly 27.7% of all staked ETH on Ethereum, with $38.985 billion in total value locked. Rocket Pool holds approximately $3.17 billion TVL. Both protocols have been live for multiple years without a material exploit. That track record does not eliminate smart contract risk. It reduces it.
Smaller liquid staking protocols carry higher smart contract risk because they have less auditing, less TVL, and less battle-testing under stress. The yield premium advertised by newer protocols is often compensation for that additional risk layer. [What Are Liquid Staking Tokens? A Beginner's Guide](https://altcoininvestor.com/what-are-liquid-staking-tokens-beginner-guide/) explains how stETH, rETH, and cbETH work, when the peg breaks, and why LST liquidity matters more than yield when markets turn.
## Who Each Model Is Right For
Exchange staking is right for you if you prioritize convenience over yield and trust the platform more than you trust your own operational discipline. It sacrifices yield for simplicity. You do not manage keys, you do not run hardware, and you do not worry about slashing. You accept the custody risk, the commission drag, and the platform's withdrawal terms in exchange for zero technical responsibility.
Liquid staking is right for you if you want self-custody with composability and are willing to accept smart contract risk in exchange for maintaining liquidity. It offers the best balance of yield and flexibility for most users. You keep your keys, you earn higher net yield than exchange staking, and you can trade or collateralize your liquid staking token without waiting for the protocol unbonding period. The trade-offs are smart contract risk, peg risk under stress, and the need to manage your own wallet security.
Solo staking is right for you if you have 32 ETH, technical competence, and a high-uptime internet connection. It maximizes returns but requires technical commitment. You keep the full protocol yield, you eliminate platform and smart contract risk, and you contribute directly to network decentralization. The trade-offs are operational complexity, slashing risk if you misconfigure, and the capital requirement of 32 ETH on Ethereum. Choose self-custody staking only if you are willing to own both the upside of control and the downside of operational error.
[Lido vs Rocket Pool](https://altcoininvestor.com/lido-vs-rocket-pool/) compares the two largest Ethereum liquid staking protocols on fee structure, node operator models, depeg behavior, and DeFi integration depth.
## My Recommendation: Liquid Staking For Most, Solo For The Committed
For most people with meaningful ETH holdings, liquid staking through Lido or Rocket Pool is the optimal path. The net yield after fees is 40-80 basis points higher than exchange staking, you maintain self-custody, and you preserve liquidity through the liquid staking token. The smart contract risk is real, but the track record and TVL depth on Lido and Rocket Pool suggest that risk is manageable.
Exchange staking makes sense only if you have a small position (under $5,000), limited technical confidence, and strong trust in the platform. The convenience premium is high. You forfeit 0.8-1.5 percentage points of net yield compared to liquid staking, and you hand custody to the exchange. That trade-off is acceptable for small balances where operational risk outweighs commission drag. It is not acceptable for larger positions where the annual cost of commission exceeds the cost of learning wallet management.
Solo staking is the correct choice if you have 32 ETH or more, technical competence, and a commitment to maintaining uptime. The net yield advantage over liquid staking is 20-60 basis points after accounting for hardware and internet costs. The custody and smart contract risk disappear. The operational risk becomes your responsibility. If you are comfortable running a Linux server, managing SSH keys, and monitoring validator performance, solo staking is the highest-sovereignty, highest-yield option available.
Do not stake on Binance. The 39.95% commission on bonded staking is indefensible. You can achieve higher net yield, better custody terms, and greater liquidity flexibility through Lido or Rocket Pool with less platform risk.
## The Takeaway: Commission Rate Determines Net Yield, Custody Model Determines Risk
If the platform charges more than 15% commission on staking rewards, you are paying too much. Lido charges 10%, Rocket Pool charges 14%, and both deliver self-custody with liquid exit optionality. Coinbase charges 35%, Binance charges 39.95%, and both require you to trust the platform with your keys and accept their withdrawal timeline. The difference is not marginal. On a $50,000 position, the commission gap costs you $400 per year, every year, compounding over the life of your stake. Choose the model that aligns your risk tolerance with your yield target, then verify the fee structure on-chain before you commit capital.
## Frequently Asked Questions
### What is the actual net yield on Coinbase ETH staking after fees?
Coinbase charges a 35% commission on Ethereum staking rewards. Applied to Ethereum's approximate 3.0% gross protocol yield in mid-2026, Coinbase delivers a net APY of roughly 1.95%. Coinbase One Premium subscribers pay a reduced 25.25% commission and receive approximately 2.39% net. The commission is deducted before rewards are credited to your account. Verify the current commission rate in your account settings before staking.
### How long does it take to withdraw staked ETH from Lido or Rocket Pool?
Lido and Rocket Pool issue liquid staking tokens (stETH and rETH) that you can sell immediately on secondary markets, bypassing the Ethereum protocol unbonding period. If you redeem stETH or rETH directly through the protocol for underlying ETH, you must wait for the Ethereum validator exit queue, which ranged from 6 to 60 days in 2026 depending on congestion. As of October 2026, the exit queue reached 14.77 days, the highest level of the year.
### Can I get slashed when staking through Lido or an exchange?
Yes. Slashing is a protocol-level penalty triggered by validator misconduct, such as double-signing blocks. If a Lido node operator or exchange validator gets slashed, the penalty reduces the total staked pool, which reduces your position proportionally. Lido has never experienced a material slashing event. Exchange validators are managed by the platform, so you have no visibility into their operational practices. Solo stakers control slashing risk directly through validator configuration and uptime management.
### Which staking method gives the highest net return on Ethereum?
Solo staking delivers the highest net return on Ethereum because you keep the full protocol yield of 3.0-3.5% minus only hardware and internet costs. Liquid staking through Rocket Pool (14% fee) or Lido (10% fee) delivers net yields of approximately 2.9% and 2.75% respectively. Exchange staking through Coinbase (35% fee) or Binance (39.95% fee) delivers the lowest net yields of 1.95-2.1%. The gap compounds annually.
### Is exchange staking safer than liquid staking protocols?
No. Exchange staking introduces custody risk and platform solvency risk. You hand your private keys to the exchange, and your stake depends on the platform's operational security and financial health. Liquid staking protocols like Lido and Rocket Pool are self-custody: you hold your own keys and receive a liquid token representing your staked position. Liquid staking introduces smart contract risk, but eliminates platform custody risk. Lido and Rocket Pool have multi-year track records and billions in TVL without material exploits.
Tool mentioned above
Ledger
Ledger devices display the full transaction on their own screen before you approve it, which is what stops an approval exploit at the point it matters.
[See Ledger devices](https://shop.ledger.com/?r=90612ff43561)
We may earn a commission if you sign up through this link, at no cost to you. It does not change what gets recommended.
The Weekly Yield Report
You just compared three staking models with commission rates ranging from 0% to 39.95% and net yields between 1.95% and 3.5%. Those numbers will shift next quarter.
Every Thursday: where crypto yield actually is - stablecoins, liquid staking and DeFi lending, with the risk named next to the rate and what changed since last week.
[Get it free every Thursday](#/portal/signup)
Free. No trade calls, no allocations, no hype. Unsubscribe in one click.
### Exchange Earn Program Withdrawal Terms: Lock Periods, Early Exit Penalties, And Liquidity Compared
URL: https://altcoininvestor.com/can-i-withdraw-from-exchange-staking-early/
Last updated: 2026-10-13T00:06:50.000Z
## The Decision You're Actually Making

You stake ETH on Binance Earn at 3.8% and the market drops 12% overnight. You attempt to exit. Binance tells you the funds will reach your spot wallet in 48 to 72 hours. That delay costs you another 6% before you can sell. The 3.8% yield you were earning becomes irrelevant when the liquidity you assumed you had does not exist when you need it.
The question is not whether you can withdraw early from exchange staking. The question is what that withdrawal actually costs in time, penalties, and forfeited yield, and whether the platform's definition of "flexible" matches yours during the market event that makes you want to exit. Most [major crypto exchanges](https://altcoininvestor.com/best-crypto-exchanges/) offer earn programs with advertised flexibility. The reality of that flexibility shows up in the withdrawal terms, the penalty structures, and the timelines that matter when price is moving against you.
This comparison covers Binance Earn, Coinbase Earn, Kraken Staking, and Crypto.com Earn. It focuses on lock periods, early exit penalties, real withdrawal timelines, and the conditions under which your accrued interest disappears. The goal is not to compare headline rates. The goal is to map the actual liquidity risk and cost you face when the market gives you a reason to leave.
## Lock Periods: Fixed Versus Flexible Terms

Binance Earn divides products into Flexible and Locked. Flexible products are primarily lending-based and allow redemption at any time, but redemption limits apply and can change based on platform liquidity. Locked products offer higher rates in exchange for commitment to 30, 60, 90, or 120-day terms. During the lock period, you cannot access principal. After maturity, redemption is available but early exit is possible with penalty.
Coinbase Earn supports staking for roughly 8 to 12 assets with no stated lockup period on most products. You can request to unstake at any time, but access depends on the underlying blockchain's unbonding period. For Ethereum, that period is variable and ranges from 1 to 5 days depending on exit queue length. Coinbase estimates the full exit and sweep process can take up to 10 days in worst-case scenarios. That is not a lock period in the traditional sense, but it is a liquidity delay that functions the same way during a market move.
Kraken offers Flexible Staking and Auto Earn, which allow instant unstaking at any time with no penalties. Bonded staking options temporarily lock crypto for an agreed term in exchange for higher yield. For assets that require protocol-level unbonding, Kraken's flexible products sidestep the delay by keeping a reserve of liquid tokens. That reserve allows immediate exit, but it also means the platform is absorbing the protocol unbonding risk, which it compensates for by taking a 30% commission on rewards.
Crypto.com Earn allows users to allocate supported cryptocurrencies for flexible, 1-month, or 3-month fixed terms. Flexible agreements yield lower returns but allow withdrawal at any time. Fixed-term plans deliver higher returns but prevent withdrawal until term expiration. Early withdrawal of fixed-term plans is at Crypto.com's sole discretion, and in the event of early withdrawal, all credited rewards are clawed back. That is the strictest penalty structure among the four platforms.
The nominal lock period is only part of the picture. The other part is what happens when you attempt to exit outside that period, or when the platform's liquidity or the protocol's unbonding queue delays your access even in a "flexible" product. Those delays are not theoretical. They show up during stress events when redemption volume spikes and liquidity shrinks.
## Early Exit Penalties And Reward Forfeiture

Binance Locked products allow early redemption, but any interest already distributed can be deducted upon early exit. That means if you have been earning for 40 days into a 90-day term, those 40 days of accrued and credited rewards may be clawed back when you leave. The principal is protected, but the yield you thought you had earned disappears. For Ethereum staking specifically, Binance sets a daily redemption quota per user due to Ethereum's protocol-level unstaking rate limits. When that quota is exceeded, your redemption request enters a queue and the 72-hour timeline extends.
Coinbase does not state a penalty on flexible staking products, but the unbonding delay is the functional equivalent. If you need liquidity immediately, Coinbase offers an instant unstake option for a 1% fee. That fee is deducted from your principal, not from rewards. On a $10,000 ETH position, instant exit costs you $100\. If ETH drops 5% while you wait for the standard unbonding process, the cost of not paying the fee is $500\. The 1% instant exit fee becomes the cheaper option during volatility, which is exactly when most users attempt to exit.
Kraken Flexible Staking allows instant unstaking with no penalties. The tradeoff is a 30% commission on staking rewards, which is higher than the 10% Binance charges for ETH staking and far higher than what you would pay [staking in self-custody](https://altcoininvestor.com/exchange-staking-vs-self-custody-staking-terms/). That commission is the cost of liquidity. Kraken absorbs the unbonding delay and you pay for that service through reduced yield. Bonded staking products on Kraken likely forfeit rewards if exited early, but the platform does not publish detailed terms for every asset, and the penalty structure varies by token and protocol.
Crypto.com fixed-term plans impose the harshest penalty. [According to the official terms](https://crypto.com/document/crypto%5Fearn), if a fixed plan is terminated before accrued rewards are credited, those rewards are forfeited. If early withdrawal is granted, all credited rewards are clawed back. That means a user 80 days into a 90-day term loses every dollar of yield earned if Crypto.com agrees to early exit. Flexible terms allow withdrawal at any time with no stated penalty, but rates are lower to compensate for that liquidity.
The common pattern across all four platforms is this: liquidity costs something. Either you forfeit yield, pay a fee, accept a delay, or take a lower rate up front. The platform that advertises the highest rate is usually the one with the strictest exit terms. The platform that allows instant exit is the one charging the highest commission. There is no free liquidity.
## Real Withdrawal Timelines During Market Moves
Binance flexible products are not instant. Tokens may take up to 72 hours to reach your spot account after redemption, and daily redemption limits apply. Those limits can change, and delays occur due to volatility, network congestion, or heavy redemption volume. During the May 2021 market crash, multiple centralized platforms experienced withdrawal delays as users attempted to exit positions simultaneously. Binance's 72-hour window is the stated maximum, but during stress events that window can extend if redemption volume exceeds available liquidity.
Coinbase standard unstaking requires waiting for the network unbonding process to complete. For Ethereum, that is 1 to 5 days under normal conditions and up to 10 days in worst-case exit queue scenarios. Coinbase has stated that access may be delayed during rare periods of high withdrawal requests. That language mirrors the terms Genesis used before pausing withdrawals in November 2022\. Genesis broke its five-day SLA, causing Gemini Earn to freeze withdrawals entirely. Coinbase has not experienced a similar event, but the terms allow for it.
The 1% instant unstake fee exists precisely because the standard timeline is a liquidity risk. Paying 1% to exit immediately is expensive, but it is rational when the alternative is watching your position lose 3% to 10% while you wait for protocol unbonding. The fee is Coinbase's way of pricing liquidity demand during periods when most users want out at the same time.
Kraken flexible staking delivers on the promise of instant exit. You can unstake at any time with no delay. That feature is worth the 30% commission for users who prioritize liquidity over yield. Bonded staking products introduce protocol-level unbonding delays that vary by asset. For assets like DOT or ATOM, unbonding can take 7 to 28 days. Kraken publishes [asset-specific terms](https://www.kraken.com/pro/staking), and users should verify the unbonding period before committing capital.
Crypto.com flexible terms allow immediate withdrawal with no stated delay. Fixed-term plans lock capital until maturity, and early exit is discretionary. That discretion is the problem. During a market event, Crypto.com is under no obligation to grant early exit requests, and even if it does, the reward clawback makes the exit punitive. Users in fixed-term plans should assume they cannot access capital until expiration.
The platforms that advertise flexibility often deliver it under normal conditions. The conditions that make you want liquidity are not normal conditions. Stress events are when withdrawal timelines extend, when redemption limits tighten, and when the gap between "flexible" and "instant" becomes a cost you pay in market exposure.
## Commission Structures And Their Impact On Net Yield
Exchange earn programs charge commissions that reduce your net yield in exchange for custody, simplicity, and in some cases liquidity. Binance charges a 10% fee on ETH staking rewards. If the protocol pays 4% annually, you receive 3.6%. Coinbase charges approximately 35% commission on staking rewards across supported assets. That same 4% protocol rate delivers 2.6% to the user. Kraken charges 30% on flexible staking and Auto Earn, bringing 4% down to 2.8%.
The commission is not the only cost. On Binance, the 10% fee is paired with potential reward clawback on early exit from locked products and a 72-hour withdrawal delay on flexible products. On Coinbase, the 35% commission is paired with network unbonding delays unless you pay the 1% instant unstake fee. On Kraken, the 30% commission buys you instant liquidity with no penalties. On Crypto.com, commission rates vary by asset and user tier, but fixed-term early exit forfeits all rewards regardless of commission.
The platforms with the lowest commissions are usually the ones with the strictest liquidity terms. The platforms with instant liquidity charge higher commissions to compensate for the capital they keep on hand to facilitate immediate exits. When comparing earn programs, the net yield after commission and after the implied cost of liquidity restrictions is what matters. A 4% headline rate that locks capital for 90 days and claws back rewards on early exit may deliver less value than a 2.8% rate with instant exit, depending on how much you value optionality during volatility.
## Failure Modes, Stress Scenarios, And Historical Precedent
Every exchange earn program includes terms that allow for delayed or paused withdrawals under certain conditions. Binance states that redemption limits can change and that delays may occur during volatility or heavy volume. Coinbase states that access may be delayed during rare periods of high withdrawal requests. Those terms exist because liquidity mismatches are a known risk in any yield product that relies on lending, staking, or rehypothecation to generate returns.
In November 2022, Genesis paused withdrawals after FTX collapsed, breaking its five-day redemption SLA. Gemini Earn, which routed user funds through Genesis, was forced to pause withdrawals as well. Users with capital in Gemini Earn lost access for months. In June 2022, Celsius paused withdrawals citing extreme market conditions. Users never regained full access, and the platform filed for bankruptcy. In both cases, the platforms had advertised flexible or short-term redemption, and in both cases that flexibility disappeared during the stress event that made users want liquidity.
Centralized earn programs are not deposits. They are unsecured loans to the platform, and your ability to withdraw depends on the platform's solvency and liquidity at the time of your redemption request. [What happens to staked assets if an exchange goes bankrupt](https://altcoininvestor.com/exchange-bankruptcy-staked-funds-safe/) depends on how those assets were legally held and whether they were segregated from platform funds. In the case of FTX, staked assets were commingled and users became unsecured creditors. In the case of Celsius, staked assets were rehypothecated and users recovered approximately 30 cents on the dollar.
Binance, Coinbase, Kraken, and Crypto.com have not experienced insolvency events, but the terms allow for liquidity restrictions during stress. The risk is not theoretical. It has materialized multiple times in the last three years, and users who treated earn programs as liquid savings accounts learned that those accounts were neither liquid nor safe during the events that mattered most.
## Who Each Platform Is Right For
Kraken flexible staking is the right choice for users who prioritize liquidity and are willing to accept a 30% commission in exchange for instant access with no penalties. If you expect to need capital on short notice or want the ability to exit during volatility without waiting for unbonding or paying fees, Kraken delivers that liquidity. The tradeoff is lower net yield, but the cost is predictable and transparent.
Binance locked products are the right choice for users who are confident they will not need liquidity before term expiration and who want higher rates than flexible products offer. If you are staking capital you do not plan to touch for 90 or 120 days, Binance's rates after the 10% commission are competitive. The risk is that early exit claws back rewards and that redemption can take up to 72 hours even after maturity. Binance flexible products are acceptable for short-term parking but should not be treated as instant liquidity during market moves.
Coinbase is the right choice for users who want exposure to staking without managing validators or self-custody and who are comfortable with either the unbonding delay or the 1% instant exit fee. The 35% commission is high, but the platform is regulated in the United States and has stronger custody protections than offshore exchanges. The instant unstake fee is expensive but rational during volatility, and the option to pay it exists, which is more than some platforms offer.
Crypto.com flexible earn is acceptable for users who want immediate access and are willing to accept lower rates. Fixed-term plans are only acceptable for users who are certain they will not need liquidity before expiration and who understand that early exit forfeits all rewards. The clawback terms are punitive, and the discretionary nature of early withdrawal makes fixed-term plans unsuitable for any capital you might need during volatility.
For users who value self-custody and are willing to manage protocol-level staking, [moving assets off exchanges and staking directly](https://altcoininvestor.com/how-does-binance-earn-work-cex-yield-2/) eliminates platform commission, removes counterparty risk, and gives you full control over exit timing subject only to protocol unbonding. The tradeoff is operational complexity and the requirement to monitor validators, but for positions above $10,000 the commission savings over 12 months are material.
## Recommendation: Liquidity Costs Something, So Know What You're Paying
If you need liquidity, use Kraken flexible staking or keep funds in a wallet you control and accept protocol unbonding delays. If you are confident you will not need access for 90 days, Binance locked products deliver competitive rates but only if you do not exit early. If you want simplicity and are comfortable with a 35% commission, Coinbase is acceptable, and the 1% instant unstake fee is worth paying during volatility. If you are considering Crypto.com fixed-term plans, understand that early exit claws back all rewards and that the platform has full discretion over whether to grant early withdrawal.
The platforms that advertise the highest rates are the ones with the strictest exit terms. The platforms that offer instant liquidity charge the highest commissions. There is no free lunch. The decision you are making is not whether you can withdraw early. The decision is how much liquidity costs, whether that cost is paid through lower yield, longer delays, or forfeited rewards, and whether the platform's definition of flexible matches yours when the market moves against you.
Every earn program includes terms that allow for delayed or paused withdrawals during stress. Those terms exist because liquidity mismatches are a structural feature of centralized yield products, not an edge case. Genesis, Celsius, and BlockFi all advertised flexible redemption, and all three paused withdrawals when liquidity dried up. The platforms covered here have not experienced that failure mode, but the terms allow for it, and the history of the last three years shows that stress events happen when liquidity matters most.
For capital you cannot afford to lose access to during volatility, exchange earn programs are the wrong place. For capital you are willing to lock for 30 to 120 days in exchange for yield, the programs compared here deliver that yield with varying degrees of flexibility, commission, and penalty. The right choice depends on how much you value optionality, how much you trust the platform, and whether you are willing to pay for liquidity through fees, delays, or reduced yield.
## The Takeaway: Flexible Is Not Instant, And Instant Costs
When you commit capital to an exchange earn program, you are making a liquidity tradeoff. Platforms that allow instant exit charge higher commissions or lower rates. Platforms that advertise higher rates lock capital or claw back rewards on early exit. Platforms that describe products as flexible often mean flexible under normal conditions, not flexible during the stress event that makes you want liquidity. Binance takes up to 72 hours and may claw back rewards. Coinbase charges 1% for instant exit or makes you wait up to 10 days. Kraken offers instant exit but takes 30% of your rewards. Crypto.com claws back all rewards if you leave a fixed term early. The cost of liquidity is always paid. The only question is whether you pay it up front through lower yield and higher commissions, or on the back end through delays, penalties, and forfeited rewards when you need liquidity and it is not there.
## Frequently Asked Questions
### Can I withdraw from Binance Earn before the lock period ends?
Yes, Binance allows early redemption from locked products, but any interest already distributed can be deducted when you exit. Your principal is protected, but accrued rewards may be clawed back. For flexible products, redemption is available anytime but can take up to 72 hours to reach your spot account. Daily redemption limits apply and can change based on platform liquidity or market stress.
### Does Coinbase charge a fee for early unstaking?
Coinbase offers two options: standard unstaking with no fee but a wait time of 1 to 10 days depending on network unbonding queues, or instant unstaking for a 1% fee deducted from your principal. The instant option exists because the standard unbonding process can take long enough that users lose more to price movement than they would pay in fees during volatility.
### What happens to my rewards if I withdraw early from Crypto.com Earn?
For flexible terms, you can withdraw at any time with no penalty. For fixed-term plans, early withdrawal is at Crypto.com's sole discretion. If granted, all credited rewards are clawed back. If a fixed plan is terminated before rewards are credited, those rewards are forfeited. This is the strictest penalty structure among major exchanges.
### Why does Kraken charge 30% commission if there are no withdrawal penalties?
Kraken's 30% commission on flexible staking pays for the liquidity it provides. The platform maintains a reserve of unstaked tokens so you can exit instantly without waiting for protocol unbonding. That reserve is a cost to Kraken, and the commission compensates for that cost. You are paying for instant access through lower net yield rather than through exit delays or penalties.
### Are exchange earn programs safe during market crashes?
Exchange earn programs are unsecured loans to the platform. During stress events, platforms can delay or pause withdrawals as allowed in their terms. Genesis, Celsius, and BlockFi all paused withdrawals during the 2022 liquidity crisis. Binance, Coinbase, Kraken, and Crypto.com have not experienced insolvency, but their terms permit withdrawal restrictions during extreme conditions. Staked assets are not deposits and are not protected the same way bank accounts are.
The Weekly Yield Report
You have just compared four platforms with withdrawal timelines between instant and ten days and penalties between zero and total reward forfeiture. Those timelines will change during the next market event.
Every Thursday: where crypto yield actually is - stablecoins, liquid staking and DeFi lending, with the risk named next to the rate and what changed since last week.
[Get it free every Thursday](#/portal/signup)
Free. No trade calls, no allocations, no hype. Unsubscribe in one click.
### Where Real Yield Comes From (And How To Spot Fake Yield)
URL: https://altcoininvestor.com/what-is-real-yield-in-crypto/
Last updated: 2026-10-12T23:03:59.000Z
## The Question That Separates Real Yield From Fake Yield
The Ethena protocol advertises 18% APY on sUSDe. The question worth answering is where that 18% is actually coming from. If the protocol stopped issuing new tokens tomorrow, would the yield still exist? That is the diagnostic question that separates real yield from fake yield, and it is the same question bond analysts asked about Greek sovereign debt in 2011, about mortgage-backed securities in 2007, and about every yield mechanism that has collapsed under its own weight in the last three decades.
Real yield is a return paid to token holders, stakers, or liquidity providers out of a protocol's actual revenue from trading fees, MEV capture, interest spread, or borrow fees. Fake yield is a return generated primarily through token incentives rather than real economic activity. The first can sustain itself as long as the underlying protocol keeps earning fees. The second depends on a steady stream of new buyers absorbing the inflation, and it stops working the moment that stream slows.
Most crypto yields advertised above 20% are unsustainable in ways their marketing obscures. The 22% APY advertised on that stablecoin farm is not a yield. It is a distribution of newly-issued tokens that will be worth less by the time you can sell them, priced against a stablecoin whose peg is maintained by a mechanism that has failed twice in the last three years. This is not new. The eurozone spent 2011 through 2013 discovering that yields advertised on Greek and Portuguese sovereign debt reflected the perceived probability of default rather than any actual return of principal. When the underlying credibility broke, the yields stopped being yields. They became losses that had been accruing all along, disclosed at last.
Every yield opportunity has one question that matters. Where does the money actually come from?
## Real Yield: Three Revenue Sources That Actually Sustain Returns
Real yield comes from protocol revenue, which is the fee income generated by a blockchain protocol from transaction fees, swap fees, lending interest, or liquidation penalties. When this revenue is distributed to token holders, it offsets token inflation and creates a yield stream that can persist independently of the protocol's token price. The mechanism producing this yield has three identifiable sources.
The first is protocol fees. Spot DEXs collect trading fees, lending markets capture the spread between supply and borrow rates, restaking and validator networks earn MEV and consensus rewards, and stablecoin issuers earn interest on their reserves. Uniswap generated $138.1 million in fees over the past 30 days, of which $10.9 million was protocol revenue. Over a trailing year, Uniswap collected roughly $892 million in fees and kept about $12 million. From December 2025, 17% of fees on Ethereum and from March 2026, 17% of fees on Optimism, Arbitrum, Base, Zora, and XLayer chains are shared to buy back and burn UNI. That is real yield. The fee income exists because users pay to swap tokens. The protocol captures a fraction of that fee income and distributes it to token holders. If the protocol stopped issuing new tokens tomorrow, the yield would still exist because the fee income would still exist.
The second is spread-based income. Aave earns the spread between what borrowers pay and what suppliers receive, plus liquidation penalties and flash loan fees. Aave V3 generated approximately $62 million in protocol revenue in May 2026, split between interest spread revenue, which is the difference between borrowing rates paid by users and lending rates paid to depositors, and liquidation fees. This is the same mechanism European banks used to generate net interest margin in the 1990s. The borrower pays 6%, the lender receives 4%, and the protocol keeps 2%. The 2% is real yield. It is not dependent on token issuance. It is dependent on borrowing demand and the protocol's ability to maintain that spread without triggering a bank run on the supply side.
The third is external revenue. Some protocols earn income from sources outside their native ecosystem and distribute that income to token holders. Real yield in this category is typically paid in stablecoins or base assets like ETH, not in the protocol's own token. This ensures the yield retains value independently of the native token. A yield stream paid in the same asset that users pay as fees, such as ETH or USDC, is more likely to be cashflow funded. A yield stream paid primarily in the protocol's own token is more likely to be emissions funded. That distinction is diagnostic.
Sustainable real yield from actual economic activity, whether trading fees, lending interest, or MEV capture, is 5-15%. Anything above that is likely subsidized by token emissions that dilute value. The number worth tracking is the revenue capture ratio, which is revenue divided by fees. This reveals the gap between user-paid activity and actual protocol economics. Fees measure how much money moves. Revenue measures how much a protocol keeps. Those are two different leaderboards.
Hyperliquid captures around 90% of fees as protocol revenue. Aerodrome around 77%. Sky Protocol around 53%. Jupiter around 30%. Aave around 13%. Uniswap around 1.4%. The revenue capture ratio tells you how much of the user-paid activity a protocol is converting into sustainable income. A low ratio does not mean the protocol is failing. It means the protocol is prioritizing liquidity provider incentives over protocol revenue, which is a deliberate trade-off. But it does mean that the yield paid to liquidity providers is likely subsidized by token emissions rather than fee income, and that matters for sustainability.
## Fake Yield: Three Mechanisms That Collapse Under Their Own Weight

Fake yield refers to returns generated primarily through token incentives rather than real economic activity. These yields often appear attractive in the short term but lack long-term sustainability because they rely on continuous token issuance rather than actual value creation. The mechanism producing this yield has three identifiable failure modes, and European monetary history has tested all three before.
The first is token emissions. These are newly minted tokens distributed to users as rewards. These emissions increase supply and often dilute existing holders, leading to token inflation. While emissions can bootstrap liquidity, they do not represent real income generated by the protocol. The problem with many high-yield protocols is that their rewards are paid out in newly minted tokens. This method, known as dilutionary emissions, floods the market with tokens, causing inflation and devaluing the rewards over time. The more tokens that are issued, the less they are worth, creating a vicious cycle where the rewards themselves lose value.
This is the same mechanism that produced the 2020 DeFi Summer collapse. Protocols advertised yields of 1000% APR or higher, paid entirely in their own tokens. As long as new buyers entered the system and absorbed the newly issued tokens, the token price held and the dollar value of the yield remained high. The moment new buyers stopped entering, the token price collapsed and the dollar value of the yield collapsed with it. The yield was never sustainable. It was a transfer of value from later entrants to earlier entrants, dressed up as income.
The second mechanism is protocol subsidies. A protocol can advertise double-digit real yield paying out in ETH while simultaneously using native token emissions to draw in the liquidity that makes the double-digit APY possible in the first place. In this situation, users will almost always be diluted by the amount of tokens that went out to pull in that ETH real yield. This is the hand-waving version of emissions-funded yield. The protocol pays you in a stable asset, which looks like real yield, but it funds that payment by issuing its own token to someone else, which is fake yield one layer removed. The net effect is the same. You receive income, but the protocol's token holders are diluted to pay for it.
The third mechanism is recycled or dilution-backed deposits. Emissions are paid for by diluting existing holders. If the protocol does not generate enough real revenue from fees or lending to buy back and burn those tokens, the price will eventually drop to match the increasing supply. Anchor Protocol, which collapsed in 2022, is the reference case. It advertised a fixed 20% APY on UST deposits. Over $18 billion chased that number. Until the day it all vanished: the yield, the stablecoin, and roughly $45 billion of market value with it. The 20% was paid from a combination of borrowing demand and treasury reserves, but the borrowing demand was never sufficient to cover the yield obligation, and the treasury was depleting. The yield was fake. It was a transfer from the protocol's reserves to depositors, dressed up as sustainable income.
Fake yield models fail because they depend on constant demand for newly issued tokens. Once demand slows, token prices drop, reducing yields and triggering capital flight. This creates a negative feedback loop that can collapse entire ecosystems. This is the same feedback loop that collapsed Long-Term Capital Management in 1998, that collapsed the mortgage-backed securities market in 2007, and that collapsed the eurozone periphery sovereign debt market in 2011\. The mechanism is identical. The yield is advertised as sustainable. The yield is actually funded by an unsustainable source. The unsustainable source stops. The yield collapses. The market reprices the underlying asset to reflect the fact that the yield was never real.
Understanding [how yield farming actually works](https://altcoininvestor.com/yield-farming-explained-beginner/) requires separating the fees, which are sustainable income, from the token rewards, which often dilute. The cleanest test for any real-yield claim is to ask: If the protocol stopped issuing new tokens tomorrow, would the yield still exist? If the answer is no, or if the answer is unclear, you are looking at fake yield.
## The Diagnostic Question: Where Does The Money Actually Come From?
The real question is not simply, "How high is the APY?" It is, "Where does the yield come from, and can that source continue?" This is the same question a bond investor asks about emerging market debt. Is the promise credible, and what happens when it breaks? The diagnostic framework has three components, and all three are necessary.
First, identify the revenue source. Is the yield paid from protocol fees, spread, or external revenue? Or is it paid from token emissions, subsidies, or recycled deposits? If the protocol cannot answer this question explicitly, or if the answer involves hand-waving about "protocol growth" or "community incentives," you should assume the yield is fake. Real yield has an identifiable source. Fake yield has marketing.
Second, verify the payment asset. Is the yield paid in the same asset that users pay as fees, such as ETH or USDC? Or is it paid primarily in the protocol's own token? If it is paid in the protocol's own token, the yield is likely emissions funded, and the dollar value of that yield depends on the token price holding. If the token price falls, the dollar value of your yield falls with it. If it is paid in stablecoins or base assets, the yield is more likely cashflow funded, and the dollar value of your yield is independent of the protocol's token price. That distinction is diagnostic.
Third, calculate the revenue capture ratio. Revenue divided by fees. This reveals how much of the user-paid activity a protocol is converting into sustainable income. A high revenue capture ratio means the protocol is keeping a large fraction of the fees it collects, which means it has more cashflow available to fund yield without relying on token emissions. A low revenue capture ratio means the protocol is prioritizing liquidity provider incentives over protocol revenue, which means it is likely subsidizing yield with token emissions. Neither is inherently good or bad, but one is sustainable and the other is not.
The single most important evaluation question is whether the yield comes from real economic activity, such as trading fees or interest payments, or from token emissions that dilute over time. Returns have moved toward fees, borrowing demand, and structured products rather than speculative token emissions. Stablecoin lending on established protocols now tends to sit in the low single digits, with higher figures available only by accepting more risk or more complexity. Sustainable yields typically range from 5-20% APY. Anything above 50% almost always relies on inflationary token emissions that will collapse.
If a protocol is handing out all its revenue to token holders, it cannot use that money to grow itself. A token's APY can still be gamed when projects might offer large token incentives just to attract deposits. This is treasury depletion disguised as revenue sharing. It is the same mechanism that European banks used in the early 2010s to advertise high deposit rates while their balance sheets deteriorated. The deposit rate was real. The balance sheet was insolvent. The depositors lost their money.
For readers [learning how to earn DeFi yield safely](https://altcoininvestor.com/how-to-earn-defi-yield-safely/), the diagnostic question separates protocols with verifiable income sources from those relying on unsustainable subsidies. The playbook starts with asking where the money comes from.
## Historical Precedent: When Similar Mechanisms Broke
European monetary history contains lessons every stablecoin design keeps needing to re-learn. The mechanism that produces fake yield in crypto is the same mechanism that produced unsustainable yields in European sovereign debt markets in 2011, in mortgage-backed securities in 2007, and in the Long-Term Capital Management collapse in 1998\. The structure is identical. The yield is advertised as sustainable. The yield is actually funded by an unsustainable source. The unsustainable source stops. The yield collapses. The market reprices the underlying asset to reflect the fact that the yield was never real.
The eurozone sovereign debt crisis of 2011-2012 is the reference case. Greek, Portuguese, and Irish sovereign bonds advertised yields of 10-20% in 2010 and early 2011\. Those yields reflected the perceived probability of default rather than any actual return of principal. When the European Central Bank and IMF imposed austerity conditions and restructured Greek debt in 2012, the yields stopped being yields. They became losses that had been accruing all along, disclosed at last. Bondholders who chased the 20% yield on Greek debt lost 50-70% of their principal in the restructuring. The yield was fake. It was compensation for default risk, not income.
The mortgage-backed securities collapse of 2007-2008 followed the same pattern. AAA-rated tranches of subprime mortgage pools advertised yields 2-3% above Treasuries. The yield was advertised as compensation for prepayment risk and complexity. The yield was actually compensation for default risk that the rating agencies and structuring banks had obscured. When default rates on subprime mortgages exceeded the historical range used to model the securities, the yields stopped being yields. They became losses. The securities were repriced from par to 20-30 cents on the dollar. The yield was fake. It was compensation for default risk, not income.
Long-Term Capital Management in 1998 is the third parallel. LTCM advertised returns of 20-40% annually from convergence trades in sovereign debt markets. The returns were advertised as arbitrage income from exploiting pricing inefficiencies. The returns were actually leveraged exposure to credit spreads, liquidity premiums, and volatility. When the Russian government defaulted on its domestic debt in August 1998, credit spreads widened, liquidity disappeared, and volatility spiked. LTCM's positions moved against it simultaneously. The fund lost $4.6 billion in four months and required a Federal Reserve-coordinated bailout to prevent systemic contagion. The yield was fake. It was leveraged exposure to tail risk, not arbitrage income.
The phrase "real yield" was popularized in late 2022 after the collapse of several "DeFi 2.0" tokens whose 1000%+ APRs were entirely funded by emissions. As the token price fell, the dollar value of the yield collapsed with it. Real yield protocols sidestepped that failure mode by paying in productive assets like ETH, AVAX, or stablecoins sourced from fee revenue. The historical precedent is clear. Yields that are too high to be sustainable are not yields. They are compensation for risks that the marketing obscures, or they are transfers from later entrants to earlier entrants, dressed up as income. In both cases, the mechanism fails the same way. The unsustainable source stops, the yield collapses, and the market reprices the underlying asset.
Investors comparing [leading DeFi protocols across categories](https://altcoininvestor.com/best-defi-protocols/) will find that sustainable yields cluster in the 5-15% range, with outliers explained by specific risk factors rather than structural magic.
## Edge Cases and Risk Factors Worth Noticing
Real yield is not a binary condition. It is a spectrum, and the edge cases are where most allocation errors occur. The first edge case is timing risk on protocol maturity. A protocol in its bootstrapping phase may offer subsidized yields to attract liquidity, with the explicit plan to transition to fee-funded yields once the protocol reaches scale. This is not inherently fake yield. It is a deliberate subsidy with a known expiration date. The question is whether the protocol will reach sufficient scale to sustain the yield from fees before the subsidy expires. Most do not. The protocols that survive the transition are the ones that built real economic activity during the subsidy phase, not the ones that attracted mercenary capital chasing the highest APY.
The second edge case is treasury depletion disguised as revenue sharing. A protocol can distribute 100% of its fee revenue to token holders, which looks like real yield, but if the protocol has no other source of income and no ability to retain earnings for development, it is distributing its own seed capital. This is the same mechanism that European banks used in the early 2010s to maintain dividend payments while their balance sheets deteriorated. The dividend was real. The balance sheet was insolvent. The shareholders lost their equity.
The third edge case is sustainability verification. The single most important evaluation question is whether the yield comes from real economic activity, such as trading fees or interest payments, or from token emissions that dilute over time. But real economic activity can be cyclical or dependent on external conditions. Aave's interest spread revenue depends on borrowing demand, which depends on leverage appetite, which depends on market sentiment and the availability of profitable trades. If borrowing demand collapses, Aave's revenue collapses, and the yield collapses with it. The yield is real in the sense that it is funded by fee income rather than emissions, but it is not stable.
The fourth edge case is the revenue capture ratio as a lagging indicator. A protocol with a low revenue capture ratio today may be prioritizing growth over profitability, with the explicit plan to increase the revenue capture ratio once the protocol reaches scale. This is a legitimate strategy if the protocol is actually building toward sustainable unit economics. But it is also the excuse every unsustainable protocol uses to justify subsidized yields. The diagnostic question is whether the protocol has a credible path from low revenue capture to high revenue capture, or whether it is simply deferring the reckoning.
For those exploring [LST yield sustainability](https://altcoininvestor.com/lst-yield-sustainability/), the 3-5% range breaks down into issuance, MEV, and priority fees, with identifiable conditions that would compress those components below sustainable thresholds.
## The Takeaway
Real yield comes from protocol fees, spread-based income, or external revenue. Fake yield comes from token emissions, protocol subsidies, or recycled deposits. The diagnostic question that separates them is: If the protocol stopped issuing new tokens tomorrow, would the yield still exist? Sustainable yields from actual economic activity range from 5-15%. Anything above 50% almost always relies on inflationary token emissions that will collapse. The revenue capture ratio reveals how much user-paid activity a protocol is converting into sustainable income. A high ratio means cashflow-funded yield. A low ratio means emissions-funded yield. European sovereign debt markets, mortgage-backed securities, and Long-Term Capital Management all collapsed under the same mechanism: yields advertised as sustainable, funded by unsustainable sources, repriced to reflect reality once the source stopped. Every yield opportunity has one question that matters. Where does the money actually come from?
## Frequently Asked Questions
### What is real yield in crypto?
Real yield is a return paid to token holders, stakers, or liquidity providers out of a protocol's actual revenue from trading fees, MEV capture, interest spread, or borrow fees. It is funded by protocol revenue rather than token emissions, which means it can sustain itself as long as the underlying protocol keeps earning fees. Real yield typically ranges from 5-15% APY and is paid in stablecoins or base assets like ETH rather than the protocol's own token.
### How do I tell if a yield is real or fake?
Ask: If the protocol stopped issuing new tokens tomorrow, would the yield still exist? If the answer is no, the yield is fake. Real yield is paid from protocol fees, spread, or external revenue. Fake yield is paid from token emissions, subsidies, or recycled deposits. Check the revenue capture ratio, which is revenue divided by fees. A high ratio means cashflow-funded yield. A low ratio means emissions-funded yield.
### What is the revenue capture ratio?
The revenue capture ratio is protocol revenue divided by total fees. It reveals how much user-paid activity a protocol is converting into sustainable income. Hyperliquid captures around 90% of fees as protocol revenue. Aave around 13%. Uniswap around 1.4%. A high ratio means the protocol keeps a large fraction of the fees it collects, which means it has more cashflow available to fund yield without relying on token emissions.
### Why did DeFi Summer yields collapse?
DeFi Summer protocols advertised yields of 1000% APR or higher, paid entirely in their own tokens through emissions. As long as new buyers entered and absorbed the newly issued tokens, the token price held. The moment new buyers stopped entering, the token price collapsed and the dollar value of the yield collapsed with it. The yield was never sustainable. It was a transfer from later entrants to earlier entrants, dressed up as income.
### What is a sustainable yield range in DeFi?
Sustainable real yield from actual economic activity such as trading fees, lending interest, or MEV capture is 5-15% APY. Anything above 50% almost always relies on inflationary token emissions that will collapse. Stablecoin lending on established protocols now sits in the low single digits, with higher figures available only by accepting more risk or more complexity. Yields above 20% require verification of the revenue source and payment asset.
The Weekly Yield Report
You now have the diagnostic framework separating cashflow-funded yields from emissions-funded subsidies. Those revenue capture ratios will shift next quarter.
Every Thursday: where crypto yield actually is - stablecoins, liquid staking and DeFi lending, with the risk named next to the rate and what changed since last week.
[Get it free every Thursday](#/portal/signup)
Free. No trade calls, no allocations, no hype. Unsubscribe in one click.
### Best Crypto Exchanges For Yield Capital Deployment
URL: https://altcoininvestor.com/best-crypto-exchange-yield-deployment/
Last updated: 2026-10-12T22:03:49.000Z
## The Capital Deployment Decision
When you are moving fiat into DeFi yield positions, the exchange is not where you make money. The exchange is the friction layer between your bank account and the protocols where the yield actually happens. The right exchange minimizes total cost and total time. The wrong one adds three days of settlement hold, clips you for 1.2% on the way in, and caps your withdrawal at $2,500 until you upload three more documents.
This comparison measures five exchanges by the metrics that matter for capital deployment: how fast ACH deposits clear for withdrawal, what trading fees cost on stablecoin pairs, how deep stablecoin liquidity sits, what withdrawal limits apply at each verification tier, and what the total time window looks like from bank transfer to capital deployed in a self-custody yield protocol. We are not comparing trading features. We are comparing total friction cost and time for the specific use case of getting USD into USDC or USDT and out to your wallet.
The exchanges: Coinbase, Kraken, Binance, Gemini, and OKX. The decision framework: capital efficiency for yield deployment, not speculation.
## ACH Deposit Speed And Settlement Hold Windows

ACH deposits are free on all five exchanges. That is where the similarity ends.
Coinbase allows trading immediately on pending ACH deposits but restricts withdrawals for three to five business days until the ACH settles. If you use Coinbase's Instant Deposit feature to access funds faster, any value credited is restricted from withdrawal for seven business days, whether it remains in USD or has been converted to crypto. For capital deployment, this means a T+3 to T+7 window before you can move stablecoins to a DeFi protocol. That latency matters if you are trying to enter a yield position during a rate spike.
Kraken offers instant ACH banking for US users. Funds are available for trading and withdrawal immediately after deposit. This is the fastest fiat-to-DeFi path among US-regulated exchanges. The settlement hold that locks capital on Coinbase does not exist on Kraken. If you deposit $10,000 via instant ACH on Monday morning, you can have USDC in your self-custody wallet by Monday afternoon.
Gemini follows the standard ACH model. Deposits are free, settlement takes three to five business days, and withdrawals are restricted until settlement completes. Binance.US operates similarly. OKX does not offer ACH deposits for US users, which removes it from consideration for US-based capital deployment unless you are using wire transfers or third-party fiat onramps.
The decision here is binary. If you need same-day capital deployment from a US bank account, Kraken is the only option. If you can tolerate a three-to-seven-day float, Coinbase, Gemini, and Binance.US are workable. OKX requires a different fiat onramp strategy entirely.
## Trading Fees On Stablecoin Pairs

Trading fees are the second friction layer. You pay once to convert USD to stablecoins, and you may pay again if you need to convert between stablecoins or back to fiat on exit.
At entry-level tiers, Binance and OKX offer the lowest fees. Binance charges 0.1% maker and taker fees, with a 25% discount available if you hold BNB, bringing effective fees to 0.075%. OKX charges 0.08% maker and 0.1% taker. For a $10,000 deposit converted to USDC, you pay $7.50 to $10 in trading fees on Binance or OKX.
Kraken charges 0.16% maker and 0.26% taker at the entry tier. For the same $10,000 conversion, you pay $16 to $26\. Gemini ActiveTrader charges 0.20% maker and 0.40% taker, which translates to $20 to $40\. Coinbase Advanced charges 0.40% maker and 0.60% taker for monthly volume under $10,000\. That same conversion costs $40 to $60.
The fee gap widens as you move capital repeatedly. If you rebalance positions or rotate between stablecoins, Coinbase's fee structure becomes prohibitively expensive. A round trip (USD to USDC, USDC back to USD) on Coinbase costs 0.80% to 1.20%. On Binance, the same round trip costs 0.15% to 0.20%.
Binance dominates on fee efficiency for capital deployment. Kraken sits in the middle. Coinbase is the most expensive option unless your volume qualifies for VIP tiers. Coinbase's September 2026 update allows traders to qualify for VIP pricing by holding USDC on the platform, which reduces fees if you plan to keep capital parked between yield rotations. But for one-time deployment, the entry-tier fees remain the highest in this comparison.
## Stablecoin Liquidity And Order Book Depth
Liquidity matters when you are moving five-figure or six-figure sums. Shallow order books mean slippage. Slippage is a hidden fee that does not appear in the fee schedule but costs you real capital.
Binance has the deepest stablecoin liquidity. One percent market depth for USDT trading pairs sits at approximately $100 million on both the bid and ask side. USDC pairs aggregate to roughly $40 million within one percent of the mid-price. Binance processes around 71,000 BTC in 24-hour volume, which translates to tight spreads and minimal slippage even on large orders.
Coinbase shows disproportionately strong USDC depth relative to overall volume, reflecting Circle's partnership. USDC pairs have roughly $35 million in one percent depth, while USDT sits at $25 million. Coinbase processes around 12,500 BTC in daily volume. For USDC-focused deployment, Coinbase offers better liquidity than its overall volume ranking would suggest.
Kraken has $15 million in USDT depth and $12 million in USDC depth within one percent of mid-price. Daily volume sits around 6,700 BTC. Kraken is the only major exchange that retained DAI pairs after Binance and Coinbase delisted DAI in April and May 2026 during the Sky Protocol migration to USDS. If you need DAI liquidity for specific DeFi protocols, Kraken is the only centralized option.
OKX sits between Binance and Coinbase in terms of stablecoin depth, with strong USDT pairs but less USDC liquidity than Coinbase. Gemini has the shallowest order books in this comparison, which makes it less suitable for large single deployments above $50,000.
The liquidity decision depends on which stablecoin your target DeFi protocol uses. If you are deploying into USDT-denominated pools, Binance offers the best execution. If you are deploying into USDC-denominated protocols, Coinbase or Kraken provide better depth. DAI is effectively dead on centralized exchanges outside of Kraken.
## Withdrawal Limits By Verification Tier
Deposit limits rarely constrain capital deployment. Withdrawal limits do. If you cannot withdraw your stablecoins to self-custody, you cannot deploy them into yield.
At the lowest verification tier, most exchanges restrict daily withdrawals to $1,000 to $2,500 for bank transfers and crypto. Coinbase starts newly registered accounts at $1,000 to $2,500 for bank transfers. Kraken's Starter tier is similarly limited. Gemini and Binance operate multi-tier systems that increase limits substantially after enhanced verification, which includes government-issued ID, address confirmation, and in some cases proof of funds documentation.
After full verification, Coinbase allows crypto withdrawals up to $100,000 equivalent per day, with USD ACH withdrawals in the $10,000 to $25,000 range depending on account history. Kraken offers daily crypto withdrawals exceeding $10 million for Pro accounts, with USD ACH withdrawals up to $500,000 per day at Intermediate verification. Gemini caps individual accounts at $100,000 daily for both crypto and USD withdrawals. Binance supports up to $2 million daily for Verified Plus accounts.
For small-to-mid capital flows under $25,000, entry-level verification is sufficient on all five exchanges. For $100,000+ deployments, you need enhanced verification before you can move capital. Kraken offers the highest withdrawal ceilings after verification, which makes it the best option for large capital deployment. Coinbase and Gemini sit in the middle. Binance offers high limits but requires navigating a more complex tier structure.
If you are deploying capital in the $10,000 to $50,000 range and you have completed full KYC, withdrawal limits will not constrain you on any of these platforms. If you are moving $500,000+, Kraken is the only exchange that will not require you to batch withdrawals across multiple days.
## Network Withdrawal Fees And Hidden Costs
Network fees are the final friction point. Some exchanges charge you to withdraw stablecoins to your wallet. Others absorb the cost.
Gemini does not charge additional withdrawal fees. You pay only the network fee, which Gemini covers. For ERC-20 stablecoins on Ethereum, this saves you $5 to $20 depending on gas prices. For large deployments, this adds up quickly.
Coinbase charges variable withdrawal fees depending on the network. For USDC on Ethereum, expect $2 to $10 depending on congestion. Kraken similarly charges network fees but at competitive rates. Binance's fee structure varies by region and changes frequently, but withdrawal fees for stablecoins are generally low compared to trading fees.
OKX charges network fees in line with Kraken and Coinbase. For capital deployment, the withdrawal fee difference between Gemini and the others is $5 to $20 per withdrawal. If you are deploying once and holding long-term, this is negligible. If you are rotating capital between protocols weekly, Gemini's zero-fee structure saves real money over time.
One hidden cost that no fee schedule mentions: fiat deposit fees on the way out. If you need to convert stablecoins back to USD and withdraw to your bank, Coinbase charges $10 for incoming USD wires. Kraken and Gemini charge similar fees. Binance's fiat withdrawal fees vary by region. For round-trip capital deployment, account for another $10 to $25 in withdrawal fees when you exit back to fiat.
## Total Time-to-DeFi Measurement
The actual deployment timeline depends on three variables: ACH settlement hold, trading execution time, and on-chain confirmation time.
On Kraken with instant ACH, you can complete the full cycle in under two hours. Deposit $10,000 via instant ACH at 10:00 AM, trade to USDC at 10:05 AM, withdraw to your wallet at 10:10 AM, and have confirmed capital in your DeFi protocol by 10:30 AM. The float window is effectively zero.
On Coinbase with standard ACH, the timeline extends to three to seven business days. Deposit Monday, trade immediately, but withdrawal is locked until Thursday or the following Monday. If you use Instant Deposit, withdrawal unlocks after seven business days. The float window is 72 to 168 hours.
On Gemini and Binance.US, expect three to five business days for standard ACH settlement. The float window matches Coinbase at 72 to 120 hours. OKX does not support ACH for US users, which adds a separate onramp step and extends the timeline further.
For non-US users, the picture changes. Wire transfers settle faster but cost $10 to $30\. SEPA transfers in Europe are free but take one to three business days. If you are deploying capital from outside the US, Binance and OKX become more competitive because ACH settlement holds are not a factor.
The time-to-DeFi measurement matters most when you are trying to capture yield opportunities with narrow windows. Stablecoin lending rates on Aave and Compound fluctuate. A 12% APY on USDC might drop to 6% in 48 hours. If your capital is locked in ACH settlement for five days, you miss the window entirely. Kraken's instant ACH eliminates that latency. Coinbase, Gemini, and Binance introduce it.
## Who Each Exchange Is Right For
Kraken is the best option for US-based users deploying capital under $500,000 who need same-day access to DeFi protocols. The instant ACH feature eliminates settlement latency, withdrawal limits are high after verification, and trading fees sit in the middle of the pack. The stablecoin liquidity is sufficient for most deployments. Kraken is the right choice if time-to-DeFi matters more than fee optimization.
Binance is the best option for non-US users or for US users willing to batch large deployments and tolerate settlement holds. The trading fees are the lowest in this comparison, stablecoin liquidity is the deepest, and withdrawal limits scale to $2 million for Verified Plus accounts. Binance is the right choice if you are optimizing for fee efficiency and liquidity depth on large capital deployments above $100,000.
Coinbase is the best option for USDC-focused deployments where liquidity depth matters more than fees. The partnership with Circle ensures tight spreads on USDC pairs, and the September 2026 VIP tier update allows you to reduce fees by holding USDC on the platform. Coinbase is the right choice if your target DeFi protocols are USDC-denominated and you can tolerate three-to-seven-day settlement holds.
Gemini is the best option for users who rotate capital frequently between DeFi protocols and want to minimize withdrawal fees. The zero-fee withdrawal structure saves $10 to $20 per withdrawal compared to competitors, which adds up over time. Gemini is the right choice if you are rebalancing positions weekly or monthly and withdrawal fees are a larger cost than trading fees.
OKX is the best option for non-US users who need low trading fees and high withdrawal limits but do not have access to Binance. The fee structure matches Binance, stablecoin liquidity is strong, and the platform is accessible in regions where Binance has exited. OKX is not a viable option for US-based ACH deposits, which removes it from consideration for most American yield deployers.
## The Recommendation
For US-based users deploying capital in the $10,000 to $100,000 range into DeFi yield positions, use Kraken. The instant ACH feature is the only zero-latency fiat onramp among US-regulated exchanges, which means you can capture yield opportunities the same day you deposit. Trading fees are higher than Binance but lower than Coinbase, and withdrawal limits scale high enough after verification that you will not hit caps until you are moving $500,000+. The stablecoin liquidity is sufficient for most deployments, and the platform supports both USDT and USDC pairs with reasonable depth.
If you are deploying above $500,000 or you are based outside the US, use Binance. The fee savings compound quickly on large capital flows, the stablecoin liquidity is the deepest available, and withdrawal limits scale to $2 million. The settlement hold is irrelevant if you are planning multi-month yield positions, and the global regulatory footprint makes Binance accessible in most jurisdictions outside the US.
If you are USDC-focused and you plan to hold USDC on the exchange between yield rotations, use Coinbase. The VIP tier structure rewards USDC holdings with reduced fees, the USDC liquidity is strong, and the platform is the most compliant US option for institutional-size deployments. The settlement hold is a real cost, but if you are deploying capital quarterly rather than weekly, the latency is tolerable.
Do not use Gemini unless withdrawal fees are your primary cost concern. The trading fees are too high, the stablecoin liquidity is too shallow, and the settlement holds match Coinbase without offering any offsetting advantage except zero-fee withdrawals. That savings matters only if you are rotating capital frequently enough that withdrawal fees exceed the trading fee differential.
Do not use OKX if you are based in the US. The lack of ACH support adds friction that eliminates any fee advantage. If you are outside the US and Binance is not available, OKX is a workable alternative, but it is not the first choice in any scenario.
## The Takeaway
The exchange decision for yield capital deployment is not about features. It is about total friction cost and total time. Kraken minimizes time. Binance minimizes fees. Coinbase optimizes for USDC liquidity. The right choice depends on where your capital is coming from, how quickly you need it deployed, and which stablecoin your target DeFi protocol uses. For most US-based yield deployers moving capital in the $10,000 to $100,000 range, Kraken's instant ACH is the decision variable that matters most. Everything else is secondary to eliminating the three-to-seven-day settlement hold that locks your capital while yield opportunities move. Choose the exchange that gets your capital to the yield protocol fastest, not the one with the lowest headline trading fee.
## Frequently Asked Questions
### Which crypto exchange has the fastest fiat-to-DeFi deployment time for US users?
Kraken offers instant ACH banking for US users, allowing same-day capital deployment from bank account to self-custody DeFi wallet. Funds are available for trading and withdrawal immediately after deposit. Coinbase, Gemini, and Binance.US impose three-to-seven-day settlement holds on ACH deposits before allowing crypto withdrawals, which delays capital deployment by 72 to 168 hours.
### What are the trading fees for converting USD to stablecoins on major exchanges?
Entry-level trading fees vary significantly. Binance charges 0.1% (0.075% with BNB discount), OKX charges 0.08% to 0.1%, Kraken charges 0.16% to 0.26%, Gemini charges 0.20% to 0.40%, and Coinbase charges 0.40% to 0.60% for volume under $10,000\. For a $10,000 USD-to-USDC conversion, fees range from $7.50 on Binance to $60 on Coinbase at entry tiers.
### Which exchange has the deepest stablecoin liquidity?
Binance has the deepest stablecoin order books with approximately $100 million in one percent market depth for USDT pairs and $40 million for USDC pairs. Coinbase offers strong USDC depth at $35 million due to Circle partnership but lower USDT depth at $25 million. Kraken maintains $15 million USDT and $12 million USDC depth, and is the only major exchange with DAI liquidity after April 2026 delistings.
### What withdrawal limits should I expect after completing KYC verification?
After full verification, Coinbase allows up to $100,000 daily crypto withdrawals and $10,000 to $25,000 USD withdrawals. Kraken Pro accounts support over $10 million daily crypto withdrawals and up to $500,000 USD withdrawals. Gemini caps individual accounts at $100,000 daily for both. Binance Verified Plus accounts reach $2 million daily. Entry-level accounts on all platforms start at $1,000 to $2,500 daily limits.
### Do exchanges charge fees to withdraw stablecoins to self-custody wallets?
Gemini covers network withdrawal fees entirely, charging users nothing beyond blockchain network costs. Coinbase, Kraken, Binance, and OKX charge variable withdrawal fees ranging from $2 to $20 for ERC-20 stablecoins depending on Ethereum gas prices. For frequent capital rotations between exchanges and DeFi protocols, Gemini's zero-fee structure saves $10 to $20 per withdrawal compared to competitors. All exchanges charge $10 to $30 for fiat withdrawals via wire.
The Weekly Yield Report
You have just compared five exchanges by ACH speed, trading fees, stablecoin depth, and withdrawal limits as of April 2026\. Those fee tiers and settlement windows will change by next quarter.
Every Thursday: where crypto yield actually is - stablecoins, liquid staking and DeFi lending, with the risk named next to the rate and what changed since last week.
[Get it free every Thursday](#/portal/signup)
Free. No trade calls, no allocations, no hype. Unsubscribe in one click.
### Binance vs Coinbase vs Kraken Staking: Who Gets Slashed
URL: https://altcoininvestor.com/exchange-staking-vs-self-custody/
Last updated: 2026-10-12T21:06:28.000Z
## The Decision You Are Actually Making

When you stake Ethereum or Solana on Binance, Coinbase, or Kraken, you are not just choosing an APY number. You are choosing who holds your private keys, who selects the validators, who absorbs slashing penalties, and who controls your position in the bankruptcy queue if the exchange collapses.
The advertised rates matter less than the legal infrastructure behind them.
Binance quotes up to 19.67% APY. Kraken quotes up to 22%. Coinbase quotes up to 15%. Those numbers are gross network yields before commission. After the exchange takes its cut, your net return on Ethereum staking drops from a protocol rate of roughly 3.5% to somewhere between 2.27% and 2.45%, depending on which platform you choose and which staking tier you select.
The commission spread is the visible cost. The invisible cost is what happens when validators get slashed, when withdrawal queues spike to fourteen days, or when the exchange files for bankruptcy and your staked assets become unsecured creditor claims ranked behind derivatives counterparties.
This is not hypothetical. MetaMask Staking's infrastructure was compromised on September 30, 2026\. MetaMask initiated the exit of nearly 17,000 validators holding approximately 523,000 ETH. The Ethereum exit queue spiked to 786,275 ETH, creating an estimated wait of 13 days and 16 hours, the longest exit delay recorded in 2026\. Users who believed their assets were liquid discovered they were locked in a protocol-enforced queue that no exchange could bypass.
The question is not which exchange offers the highest quoted APY. The question is which exchange runs the most resilient validator infrastructure, discloses the most transparent custody terms, and gives you the clearest legal recourse when things break.
## Custody Model and Validator Infrastructure
When you stake on an exchange, you transfer custody of your assets to the platform. The exchange then deploys those assets to validators it selects, operates, or contracts with.
Binance.US stores staked assets in Binance.US-owned wallets with a third-party staking custody provider and stakes them to nodes run by third-party Staking Services Providers. You do not hold the private keys. Binance does. The validator operators are disclosed in general terms but not by specific node.
Kraken runs a custodial staking service. You send your coins to Kraken, and Kraken stakes them on your behalf using validators Kraken operates or contracts with. Kraken does not disclose individual validator public keys for user-staked assets. Kraken pioneered Proof of Reserves audits in 2014 and continues to publish periodic attestations, but those audits cover total asset balances, not validator-level operational security.
Coinbase operates as a regulated US broker-dealer and Qualified Custodian. Coinbase does not publish detailed validator operator information. Coinbase is publicly traded and S&P 500-listed, which subjects it to SEC disclosure requirements, but those requirements do not extend to real-time validator infrastructure transparency.
The assumption of validator independence is not reasonable for a set dominated by institutional operators sharing infrastructure providers, consensus clients, execution clients, custody services, and operational practices. If a staking service provider with tens of thousands of validators commits a configuration error affecting a fraction of nodes, the correlation penalty activates as if it were a coordinated attack.
Lido's 2023 slashing event, caused by configuration errors at Chorus One and Launchnodes, cost the pool roughly 20 ETH combined. The incident was small in absolute terms but illustrative of the systemic risk: a single misconfiguration by one operator affected multiple validators simultaneously, triggering Ethereum's correlated slashing penalty.
When you stake on an exchange, you accept the operational risk of the validators the exchange selects. You cannot audit those validators yourself. You cannot exit a specific validator that shows poor performance. You can only unstake from the exchange and wait for the protocol-enforced unbonding period to expire.
## Slashing Risk Transfer and Who Pays
Slashing is the protocol-level penalty applied when a validator violates consensus rules. In Ethereum, slashing penalties start at 1 ETH and scale based on how many validators are slashed in the same time window. In networks such as Cosmos, slashing penalties can exceed 5% of the validator's total bonded stake.
Only about 0.04% of Ethereum validators have ever been slashed. That is 472 validators out of over 1.2 million active validators. Slashing appears in approximately 0.0033% of blocks, roughly one in every 30,000 blocks.
Slashing is rare. But when it happens, it is correlated.
All three exchanges claim to "absorb or manage" slashing risk on behalf of users. Binance.US's terms of service state that the platform may absorb slashing penalties but do not guarantee full coverage. Kraken's terms similarly reference slashing risk management without explicit guarantees. Coinbase does not publish a detailed slashing indemnification policy in its public staking terms.
The practical question is what happens when a large-scale slashing event occurs. If an exchange or service provider runs many validators sharing the same infrastructure, a single operational error can trigger compounded Ethereum penalties affecting all delegators simultaneously. The exchange may absorb the first 1 ETH penalty. It is less clear whether the exchange absorbs the compounded correlation penalty when dozens or hundreds of validators are slashed in the same epoch.
Staking through a reputable exchange can reduce your direct slashing exposure compared to running a solo validator, but it does not eliminate systemic correlation risk. The exchange's validator infrastructure becomes a single point of failure for thousands of users.
[Staking rewards calculations](https://altcoininvestor.com/staking-rewards-explained-calculation-reductions/) rarely include the expected value of slashing risk, even though that risk reduces net APY in the same way commission does.
## Withdrawal Queues, Unbonding Windows, and Protocol Delays
Proof-of-stake networks enforce unbonding or withdrawal queues. This is the waiting period from the moment you submit an unstaking request to when you receive the funds back in liquid form.
Ethereum's exit queue is rate-limited by protocol to 8 validators per epoch, roughly every 6.4 minutes. During periods of normal network activity, the exit queue clears in 1 to 2 days. During periods of high exit volume, the queue can extend to 14 days or longer.
Solana offers a 2-to-3 day unbonding period. Cosmos requires 21 days. These are protocol-enforced delays. No exchange can bypass them.
A slashed validator is force-exited by the protocol but faces a much longer withdrawal delay: 8,192 epochs, approximately 36 days, instead of the standard 256-epoch delay of roughly 27 hours. This extended delay is a penalty period imposed by the protocol.
User-level delays can exceed protocol delays if the exchange imposes additional redemption quotas. Binance explicitly states daily quotas for WBETH redemptions. If the exchange's internal redemption queue is full, you wait in line even after the protocol unbonding period has completed.
The MetaMask incident in September 2026 demonstrated how quickly exit queues can spike. When MetaMask initiated the exit of nearly 17,000 validators, the Ethereum network exit queue spiked to 14 days. Users who assumed they could unstake and withdraw within 48 hours discovered they were locked for two weeks.
This is critical for understanding the actual liquidity of exchange-staked positions. The headline APY is annualized. The withdrawal delay is not. If you need liquidity in less than 14 days, staked positions may not provide it, regardless of which exchange you use.
[Liquid staking tokens](https://altcoininvestor.com/what-are-liquid-staking-tokens/) like stETH, rETH, and cbETH offer an alternative by tokenizing the staked position, but those tokens trade at variable discounts to their underlying ETH value during periods of high redemption demand.
## Commission Structure and Net APY After Fees
Kraken takes 15% to 30% commission on bonded staking, or a flat 30% on flexible staking. Coinbase charges 25% to 35% in commissions. Binance's commission ranges from 9.95% to 39.95% depending on the asset and the staking product.
For Ethereum staking at a gross network yield of 3.5%, your net APY after commission is:
- Kraken bonded staking at 30% commission: 2.45% net APY
- Coinbase at 35% commission: 2.27% net APY
- Binance flexible staking at 30% commission: 2.45% net APY
These are the rates after the exchange takes its cut. They do not account for slashing risk, inflation dilution, or withdrawal queue opportunity cost.
The commission spread between platforms is smaller than the headline numbers suggest. The more important variable is the staking product tier you select. Bonded staking on Kraken locks your assets for a fixed term but offers lower commission than flexible staking. Flexible staking allows earlier withdrawal but charges higher commission.
Coinbase One members receive better rates. Binance offers tiered commission based on the asset and the user's BNB holdings. The effective commission you pay depends on your account tier, not just the platform you choose.
Real APY varies by asset, lock-up duration, and account tier. The advertised headline rate is not the rate you earn.
[Net staking return calculators](https://altcoininvestor.com/staking-rewards-calculator/) that incorporate commission, inflation, and expected slashing loss provide a more accurate picture than gross APY figures.
## Exchange Insolvency and Creditor Recovery Ranking
When an exchange files for bankruptcy, staked assets held in custodial accounts become part of the bankruptcy estate. You do not have segregated legal title to those assets. You have a claim against the exchange for the value of the assets.
Most customers rank as unsecured creditors, behind derivatives counterparties and insiders, with recovery prospects ranging from low to zero. Early estimates suggested FTX customers might recover 10% to 20% of their claims, far below the 100% return of traditional bank deposits. As of late 2024, FTX's revised recovery estimate reached 118%, but that outcome depended on the appreciation of seized assets during the bankruptcy proceedings, not on the legal structure of customer claims.
Customer recovery depends on the platform's terms of service, how assets were held, whether the exchange commingled or lent customer assets, whether fiat funds were segregated, whether the customer used an "earn" or staking product, whether fraud occurred, and what the bankruptcy court approves.
A customer with coins in a true custody account may be in a different legal position than a customer who transferred assets into a yield program. Staking terms of service often include language stating that the exchange takes custody of staked assets and deploys them to validators. That language may subordinate your claim relative to customers holding liquid assets in non-yield accounts.
Bittrex's bankruptcy left $63 million still unclaimed as of December 2024\. Celsius and BlockFi recovery proceedings remain ongoing, with expected recovery rates of approximately 72.5% but payable in native tokens rather than dollar equivalents.
Kraken has never suffered a breach resulting in client fund losses and publishes Proof of Reserves. Coinbase operates as a Qualified Custodian under US regulations. Neither platform provides insurance on staked crypto. Coinbase's insurance policy covers custodied assets against theft or breach but does not cover insolvency, regulatory seizure, or protocol-level slashing.
The legal distinction between custodied liquid assets and staked assets deployed to third-party validators remains untested in most jurisdictions. The safest assumption is that staked assets rank as unsecured creditor claims in bankruptcy.
[Exchange bankruptcy and staked fund safety](https://altcoininvestor.com/exchange-bankruptcy-staked-funds-safe/) depends on the legal structure of the custody arrangement, not on the platform's reputation or market capitalization.
## Regulatory Interruption and Jurisdiction-Specific Risk
The SEC forced Kraken to pay $30 million in 2023 and end US staking services. Kraken no longer offers staking to US customers for most assets. Kraken's international platform continues to offer staking, but US persons cannot access it.
Binance operates separate Binance.US and Binance Global entities. Binance Global is inaccessible to US persons. Binance.US offers staking on a limited set of assets with different commission structures than Binance Global.
Coinbase operates as a regulated US broker-dealer and has resisted SEC pressure to classify staking as a securities offering. Coinbase continues to offer staking to US customers as of October 2026, but regulatory risk remains.
Regulatory interruption can force-exit your staked positions on short notice. When Kraken shut down US staking, users were required to unstake and withdraw within a limited time window. The Ethereum withdrawal queue at the time extended the actual exit period beyond Kraken's notice deadline.
Jurisdiction-specific risk is not priced into APY quotes. The expected value of regulatory interruption reduces net return in the same way commission and slashing risk do.
## Supported Assets and Liquidity Product Differences
Kraken supports staking on 26 assets, including Ethereum, Polkadot, Solana, Cosmos, and Tezos. Kraken offers both bonded and flexible staking terms, plus Ethereum restaking and Bitcoin staking through third-party protocols.
Binance offers staking on over 100 assets, including Ethereum (liquid), BNB, Solana, NEAR, Algorand, Sui, and Aptos. Binance's product suite includes locked staking, flexible staking, and DeFi staking, which routes user funds to external DeFi protocols.
Coinbase supports staking for roughly 8 to 12 assets, including Ethereum, Solana, Cardano, Cosmos, and Tezos. Coinbase's product line is narrower than Binance or Kraken, but Coinbase offers institutional-grade custody for large allocations.
The breadth of supported assets matters less than the validator infrastructure behind each asset. A platform offering 100 staking products with shared validator infrastructure may present higher correlation risk than a platform offering 10 staking products with independent validator operators.
[Exchange selection](https://altcoininvestor.com/best-crypto-exchanges/) for staking depends on which assets you hold and whether the platform supports the specific network you want to stake on.
## Who Each Option Is Right For
Kraken is the best choice for users who want mid-tier commission rates, transparent Proof of Reserves audits, and access to bonded staking products with slightly lower fees. Kraken's commission structure favors users willing to lock assets for fixed terms. Kraken is not available to US customers for most staking products.
Binance is the best choice for users who want the widest selection of staking assets and who hold BNB to unlock lower commission tiers. Binance's flexible staking products offer shorter lock-up periods but higher commission. Binance.US operates separately from Binance Global, and US customers face a narrower product set.
Coinbase is the best choice for US customers who prioritize regulatory clarity, institutional-grade custody, and public company transparency. Coinbase charges the highest commission among the three platforms but offers the most robust legal and regulatory infrastructure for US persons.
None of these platforms is the best choice for users who want to retain full control of private keys, select specific validators, or eliminate exchange insolvency risk. For those users, [self-custody staking](https://altcoininvestor.com/exchange-staking-vs-self-custody-staking-terms/) through solo validators or non-custodial pools like Rocket Pool offers higher net yield and eliminates exchange-level custody risk, at the cost of higher operational complexity.
## The Recommendation
If you are a US person and you want regulatory clarity, use Coinbase. The higher commission is the price of regulatory compliance and institutional custody. If Coinbase is forced to shut down staking, you will have more legal recourse than you would with an offshore platform.
If you are not a US person and you want the lowest commission on Ethereum staking, use Kraken's bonded staking product. The lock-up period is the trade-off for lower fees. Kraken's Proof of Reserves audits provide more transparency than Binance or Coinbase offers.
If you want access to the widest range of staking assets and you hold BNB to unlock lower tiers, use Binance. The commission spread between Binance and Kraken is smaller than the headline numbers suggest, but Binance supports more networks.
If you want to eliminate exchange insolvency risk and retain full control of private keys, do not use any of these platforms. Stake through a solo validator or a non-custodial pool. The operational complexity is higher, but the custody risk is zero.
The legal fine print matters more than the advertised APY. Slashing is rare but correlated when it happens. Exit queues are protocol-enforced delays that no exchange can bypass. Insolvency recovery is uncertain regardless of platform reputation. Choose based on who holds your keys, who selects the validators, and who you trust to manage the legal and operational risk when the system breaks.
## The Takeaway
The choice between Binance, Coinbase, and Kraken is not a choice between APY numbers. It is a choice between custody models, validator infrastructure, slashing indemnification policies, and bankruptcy creditor rankings. Commission differences are measurable and visible. Slashing risk, withdrawal queue delays, and insolvency exposure are harder to price but equally material. The MetaMask incident in September 2026 demonstrated that centralized operator risk cascades to thousands of delegators when infrastructure fails. The FTX and Celsius bankruptcies demonstrated that staked assets rank as unsecured creditor claims. The actual yield you earn is the gross network rate minus commission, minus expected slashing loss, minus the opportunity cost of withdrawal delays, minus the probability-weighted insolvency recovery haircut. That number is lower than the advertised APY. It is also the number that matters.
## Frequently Asked Questions
### Does Binance or Coinbase or Kraken cover slashing penalties?
All three exchanges claim to absorb or manage slashing risk on behalf of users, but none explicitly guarantees full coverage in published terms of service. Binance.US states the platform may absorb slashing penalties. Kraken references slashing risk management without explicit guarantees. Coinbase does not publish a detailed slashing indemnification policy. The practical question is what happens during large-scale correlated slashing events when multiple validators sharing the same infrastructure are penalized simultaneously.
### What happens to my staked crypto if the exchange goes bankrupt?
Staked assets held in custodial exchange accounts become part of the bankruptcy estate. You do not have segregated legal title. You hold an unsecured creditor claim against the exchange. Recovery rates vary widely by case. FTX eventually returned 118% but early estimates were 10-20%. Celsius and BlockFi recovery is ongoing at approximately 72.5% payable in native tokens. Bittrex left $63 million unclaimed as of December 2024\. Staked assets deployed to third-party validators may rank differently than liquid custodied assets, but that legal distinction remains untested in most jurisdictions.
### How long does it take to unstake and withdraw on Binance, Coinbase, or Kraken?
Withdrawal time depends on the protocol unbonding period plus any exchange-imposed redemption queues. Ethereum exit queues range from 1 to 14 days depending on network congestion. Solana requires 2-3 days. Cosmos requires 21 days. Binance imposes daily redemption quotas on WBETH. The MetaMask incident in September 2026 created a 14-day Ethereum exit queue. Slashed validators face a 36-day penalty delay before withdrawal begins. No exchange can bypass protocol-enforced unbonding windows.
### What is the actual net APY after exchange commission on Ethereum staking?
For Ethereum staking at a gross network yield of 3.5%, net APY after commission is approximately 2.45% on Kraken bonded staking at 30% commission, 2.27% on Coinbase at 35% commission, and 2.45% on Binance flexible staking at 30% commission. Actual rates vary by account tier and staking product. Coinbase One members receive better rates. Binance offers tiered commission based on BNB holdings. These figures do not account for slashing risk, inflation dilution, or withdrawal queue opportunity cost.
### Can I choose which validators my staked assets go to on Binance, Coinbase, or Kraken?
No. When you stake on an exchange, the exchange selects and operates the validators or contracts with third-party staking service providers. Binance.US stakes to nodes run by third-party providers. Kraken operates its own validators or contracts with operators. Coinbase does not publish validator-level operational details. You cannot audit individual validators, exit underperforming validators, or control validator selection. You can only unstake from the exchange and wait for the protocol unbonding period to expire.
The Weekly Yield Report
You have just compared custody models, slash risk transfer, and insolvency ranking across three exchanges. Those terms will change as regulators and protocols evolve.
Every Thursday: where crypto yield actually is - stablecoins, liquid staking and DeFi lending, with the risk named next to the rate and what changed since last week.
[Get it free every Thursday](#/portal/signup)
Free. No trade calls, no allocations, no hype. Unsubscribe in one click.
### Yield Farming Explained: How It Actually Works
URL: https://altcoininvestor.com/yield-farming-explained-beginner/
Last updated: 2026-10-12T19:07:30.000Z
## What Yield Farming Is at the Mechanism Level

Yield farming is the practice of depositing tokens into DeFi protocol smart contracts in exchange for a share of protocol revenue plus additional token rewards. The revenue share comes from actual economic activity. The additional rewards come from newly minted tokens. These are not the same income source.
A liquidity pool is a smart contract holding pairs of tokens. When you deposit USDC and ETH into a Uniswap pool, you become a liquidity provider. The protocol uses your deposited tokens to facilitate swaps between traders. Every swap generates a fee. A portion of that fee gets distributed to LPs proportional to their share of the pool.
That fee is real yield. It comes from transaction volume. The more traders swap through the pool, the more fees accumulate for LPs.
Many protocols also distribute governance tokens as incentives to attract liquidity. These tokens are minted by the protocol and distributed on a schedule. This is emission-based yield. It does not come from revenue. It comes from dilution.
The advertised APY you see on most [DeFi protocols](https://altcoininvestor.com/best-defi-protocols/) combines both sources. A pool might show 28% APY. That number typically breaks down into 6% from trading fees and 22% from token emissions. One of those components is sustainable. The other depends on whether anyone wants to buy the emitted tokens.
## The Two-Source Yield Model and How to Distinguish Them

Every yield farming position decomposes into at least two layers:
1. **Protocol revenue distribution:** Trading fees from DEX pools, interest from lending protocols, or funding rates from derivatives platforms. This is real yield backed by actual protocol activity.
2. **Token emissions:** Governance tokens minted by the protocol and distributed as incentives. This is inflationary yield backed by nothing except ongoing demand for the token.
A mature protocol example: Aave, the largest DeFi lending protocol with $19.3 billion in TVL, pays lenders interest funded by borrower payments. This is real yield. The protocol also distributes AAVE tokens as liquidity mining rewards. That component is emission-based.
When evaluating a yield farming opportunity, decompose the advertised APY. Ask what percentage comes from fees or interest versus what percentage comes from token rewards. If the answer is 80% emissions and 20% fees, you are not farming yield. You are farming a token that will face constant sell pressure.
Red flags for unsustainable emission-based yield:
- APYs consistently above 50% with no clear revenue source backing the number
- Rewards paid entirely in a newly launched governance token with low liquidity
- Returns depending primarily on new depositors entering the pool
- Annual token inflation above 10% with no matching burn or revenue mechanism
Many governance tokens from the 2020-2021 DeFi cycle lost 90%+ of their peak value. The protocols emitted millions of tokens daily. Farmers harvested and sold. No organic demand existed to absorb that sell pressure. Token price collapsed. The APY that looked like 200% at deposit became 15% at withdrawal because the reward token lost 92% of its value.
This is not a hypothetical scenario. It is the dominant failure mode for high-APY yield farming.
## Impermanent Loss: The Math Without the Euphemism
Impermanent loss is opportunity cost. It is the difference between the value of your LP position and the value you would hold if you had simply kept the tokens in your wallet.
IL occurs when the price ratio of the two pooled tokens changes. Automated market makers rebalance your position to maintain a 50/50 value split. If one token appreciates, the pool automatically sells some of it and buys more of the other token. You end up holding less of the winner and more of the loser compared to a simple hold strategy.
The loss is "impermanent" only if the price returns to the original ratio. If it does not, the loss becomes permanent when you withdraw.
Here is the actual math for common price movements:
- **1.25x price change:** 0.6% IL
- **1.5x price change (50% move):** 2.0% IL
- **2x price change (100% move):** 5.7% IL
- **3x price change (200% move):** 13.4% IL
- **4x price change (300% move):** approximately 20% IL
Direction does not matter. A 50% price increase produces the same 2.0% IL as a 50% price decrease. Only magnitude affects impermanent loss.
Most impermanent loss calculators do not account for trading fees earned or yield farming rewards. Your actual profit or loss equals fee income plus token rewards minus impermanent loss minus gas costs.
Break-even framework: If you deposit into an ETH/USDC pool and expect ETH could move 50% in either direction over 90 days, your base-case IL exposure is approximately 2.0%. The fee income you earn over that period must exceed 2.0% to break even before accounting for any token rewards.
For volatile pairs, higher expected price movement increases IL risk. For stablecoin pairs like USDC/USDT, price movement is minimal. IL rarely exceeds 0.1-0.3%. This is why stablecoin pools pay lower APYs but remain attractive to conservative LPs.
As of September 2026, stablecoin pools with $10 million or more in deposits paid a TVL-weighted average of approximately 4.1% APY. That represents sustainable real yield with negligible IL risk. Volatile two-token LP pools with $1 million or more in TVL averaged 16.96% APY, with 8.07 percentage points coming from reward tokens. The IL risk on those pools can easily exceed 10% in a trending market.
## Concentrated Liquidity and Active Management Complexity
Uniswap V3 introduced concentrated liquidity. Instead of providing liquidity across the entire price range, you can specify a narrow range where you expect most trading activity to occur. This increases capital efficiency. Your liquidity earns more fees per dollar deposited.
The trade-off: if the price moves outside your specified range, you earn nothing until it returns. Your position goes idle. You collect zero fees while the price sits outside your range.
Concentrated liquidity requires active management. You must monitor the pool and adjust your range as market conditions change. If you set a range of $3,000 to $3,200 for ETH and the price moves to $3,400, your entire position sits unused.
For beginners, this adds mechanical complexity and gas cost. Every range adjustment requires a transaction. Gas fees on Ethereum mainnet can exceed $20-50 per transaction during network congestion. Adjusting a range three times in a month can cost $60-150 in gas alone.
Concentrated liquidity makes sense for sophisticated LPs managing large positions who can absorb gas costs and monitor positions daily. For a beginner deploying $2,000-5,000, the overhead often exceeds the benefit. Stick with full-range positions or protocols that do not require manual rebalancing.
## Protocol Maturity and the KelpDAO Lesson
In Q2 2026, an attacker exploited a flaw in KelpDAO's bridge integration and extracted approximately $292 million. Depositors panicked. Aave's TVL dropped from $26.4 billion to $14.3 billion in days. That is a $12 billion withdrawal, or 46% of total deposits.
The incident was not an Aave exploit. KelpDAO was a separate restaking protocol with positions on Aave. But the fear contagion was immediate. Users withdrew capital from Aave and other lending protocols as a precaution.
This illustrates composability risk. DeFi protocols integrate with each other. An exploit in one protocol can trigger withdrawals across the ecosystem. Protocol maturity matters. Battle-tested platforms like Aave, Uniswap, and Curve have survived multiple market cycles, exploit attempts, and stress conditions. New protocols with novel mechanisms have not been tested under adversarial conditions.
When selecting a [yield farming platform](https://altcoininvestor.com/how-to-earn-defi-yield-safely/), prioritize protocols with:
- Multi-year track records and no history of critical exploits
- Professional third-party audits from firms like Trail of Bits, OpenZeppelin, or Consensys Diligence
- Transparent on-chain data accessible via [DefiLlama](https://defillama.com/) or similar dashboards
- Active bug bounty programs with payouts exceeding $1 million for critical vulnerabilities
An extra 6% APY on a $50,000 position is $3,000 annual income. Losing the principal costs $50,000\. The risk-return asymmetry favors conservative protocol selection.
## Sustainability Signals and Token Emission Red Flags
The DeFi market has shifted toward real yield. Protocols now emphasize revenue-backed returns over inflationary token emissions. This shift followed the 2022 collapse of dozens of high-emission farming protocols whose tokens lost 85-95% of their value.
Sustainability signals to look for:
- **Fee revenue exceeding emissions:** The protocol generates more revenue from fees than it pays out in token rewards. This means the yield is net-positive for the protocol, not a subsidy.
- **Token buyback or burn mechanisms:** The protocol uses fee revenue to buy back and burn governance tokens, offsetting inflation from emissions.
- **Multi-year emission schedule:** Token distribution spreads over 3-5 years with declining rates, not frontloaded into the first 6 months.
- **Diversified revenue sources:** The protocol earns fees from multiple activities (trading, lending, derivatives) rather than relying on a single mechanism.
Red flags for unsustainable emissions:
- **Emission rate exceeds trading volume:** If a protocol emits 1 million new tokens daily but daily trading volume is only $100,000, there are not enough buyers to absorb selling pressure. Farmers claim rewards and immediately sell. Token price declines.
- **No fee mechanism:** Protocols that exist solely to distribute governance tokens with no underlying revenue model. Once emissions slow, yield drops to near zero and token price collapses.
- **Locked staking with emission cliffs:** Protocols that require 6-12 month lock periods with high emissions in the first months, then drop emissions sharply. This creates a race to exit before the cliff.
- **Annual inflation above 10%:** Creates aggressive sell pressure that most projects cannot absorb through organic demand growth.
Check [protocol documentation](https://docs.aave.com/) for emission schedules and fee distribution mechanisms. If the documentation is vague about where yield comes from, skip the protocol.
## When Yield Farming Makes Sense in 2026
Yield farming is not a blanket strategy. It makes sense in specific contexts with specific risk profiles.
**Stablecoin liquidity provision:** Pairs like USDC/USDT or USDC/DAI offer 3-6% APY with minimal IL risk. This is comparable to traditional savings yields but with smart contract risk. Appropriate for conservative allocators who want passive income without directional price exposure.
**Liquid staking derivatives:** Protocols like Lido allow you to stake ETH and receive stETH, a liquid token representing your staked position. You earn approximately 3-4% APY from staking rewards while maintaining liquidity. You can use stETH in other DeFi protocols to stack additional yield. This is a low-IL, moderate-complexity strategy.
**Blue-chip DEX liquidity on mature pairs:** Providing liquidity to ETH/USDC or WBTC/ETH pools on Uniswap or Curve. These pairs have deep liquidity, high trading volume, and predictable IL characteristics. Fee APYs range from 5-15% depending on volatility. Appropriate for intermediate users comfortable managing IL risk.
Yield farming does not make sense when:
- The protocol is less than six months old with no audit history
- APYs exceed 50% with no clear revenue backing the number
- The only yield source is a governance token with low liquidity and no utility
- You do not understand the mechanism producing the yield
- The protocol has a history of exploits or paused withdrawals
## The First-Farm Strategy for Beginners
Your first yield farming position should minimize downside while teaching you the mechanics. The goal is not maximum APY. The goal is to learn how deposits, withdrawals, fee accrual, and token claiming work without risking significant capital.
Step 1: Start with a stablecoin pair on a mature protocol. USDC/USDT on Uniswap or Curve. This eliminates IL risk and focuses your attention on protocol interaction rather than price volatility.
Step 2: Deposit a small test amount. $500-1,000 if that is 5-10% of your total crypto holdings. Do not deploy 50% of your portfolio into your first farming position.
Step 3: Monitor the position for 30 days. Track fee accrual. Check how much you earn daily. Calculate your actual APY based on deposited capital and fees received.
Step 4: Attempt a withdrawal. Gas costs on Ethereum mainnet can be $15-30 for a withdrawal transaction. Factor this into your return calculation. A $20 gas fee on a $1,000 position that earned $8 in fees over 30 days means you netted negative on the first month.
Step 5: Compare your actual return to the advertised APY. Most dashboards show gross APY without accounting for gas costs, slippage on entry, or IL. Your net return will be lower. Understanding this gap is critical.
After completing one full cycle with a stablecoin pair, you can consider volatile pairs or concentrated liquidity positions. But learn the mechanics first with minimal risk exposure.
For reference, sustainable yield ranges in 2026 have settled into predictable tiers:
- **Stablecoin lending:** 4-8% APY
- **Liquid staking:** 2.5-4% APY
- **DEX liquidity provision:** 5-30% APY depending on pair volatility and fee tier
- **Restaking:** 4-6% APY
These ranges represent real yield backed by protocol activity. Anything significantly above these numbers likely includes emission-based yield that carries dilution risk.
## What to Do Next
If you want to start yield farming, complete these steps before deploying capital:
1. **Select a mature protocol:** Aave for lending, Uniswap or Curve for liquidity provision. Avoid new protocols with untested mechanisms.
2. **Decompose the advertised APY:** Identify what percentage comes from fees versus token emissions. If more than 50% comes from emissions, expect the actual return to decline as the token price drops.
3. **Calculate your IL exposure:** Use an impermanent loss calculator to model your expected IL under different price scenarios. If you cannot tolerate 10% IL, do not farm volatile pairs.
4. **Check on-chain data:** Verify TVL, trading volume, and fee generation on DefiLlama. If the dashboard shows declining TVL or volume, skip the protocol.
5. **Deposit a test position:** Start with 5-10% of your intended allocation. Monitor for 30 days. Withdraw. Calculate your net return after gas costs.
6. **Scale only after verification:** If your test position performs as expected and you understand the mechanics, you can increase allocation. Never allocate more than 10% of your total portfolio to any single yield farming protocol.
Yield farming is not passive income in the traditional sense. It requires monitoring, rebalancing, and active risk management. The protocols that pay sustainable yields in 2026 are the ones generating real revenue from real economic activity. Everything else is a subsidy waiting to end.
## The Takeaway
Yield farming decomposes into fee income and token emissions. Fee income is sustainable. Token emissions create sell pressure that usually exceeds organic demand. Impermanent loss is not a minor footnote. It is a core risk that erases fee income if the price moves against you. Stablecoin pairs offer 4% APY with minimal IL. Volatile pairs offer 15-30% APY with double-digit IL risk in trending markets. Start with stablecoins. Learn the mechanics. Scale only after you understand what would cause the mechanism to fail.
## Frequently Asked Questions
### What is the difference between real yield and emission-based yield in DeFi?
Real yield comes from actual protocol revenue like trading fees, lending interest, or funding rates. Emission-based yield comes from newly minted governance tokens distributed as incentives. Real yield is sustainable because it is backed by economic activity. Emission-based yield creates constant sell pressure as farmers harvest and sell rewards. Most high APYs advertised by DeFi protocols combine both sources. Decompose the advertised number to identify what percentage comes from fees versus emissions. If more than 50% comes from token rewards, expect the actual return to decline as the reward token loses value from dilution.
### How much impermanent loss should I expect on a volatile LP pair?
Impermanent loss depends on price movement magnitude, not direction. A 50% price change in either direction produces approximately 2% IL. A 100% price change produces 5.7% IL. A 200% price change produces 13.4% IL. For volatile pairs like ETH/USDC, expect 50-100% price movements over 90 days during trending markets. That translates to 2-6% base-case IL exposure. Your fee income and token rewards must exceed that percentage to break even. Stablecoin pairs like USDC/USDT rarely experience more than 0.1-0.3% IL because price ratios remain stable.
### Which protocols are safe for a beginner's first yield farming position?
Start with battle-tested protocols with multi-year track records and no critical exploit history. Aave for lending (currently $19.3 billion TVL), Uniswap for DEX liquidity, or Curve for stablecoin pools. These platforms have survived multiple market cycles and stress conditions. Avoid protocols less than six months old or those offering APYs above 50% with unclear revenue sources. Use stablecoin pairs like USDC/USDT for your first position to minimize impermanent loss while learning deposit, withdrawal, and fee claiming mechanics. Deploy 5-10% of your intended allocation as a test position before scaling.
### What are the red flags that a yield farming protocol is unsustainable?
Key red flags include APYs consistently above 50% with no clear revenue source, rewards paid entirely in a newly launched governance token with low liquidity, annual token inflation above 10% with no burn mechanism, and emission rates exceeding trading volume. If a protocol emits 1 million tokens daily but only has $100,000 in daily trading volume, sell pressure will exceed demand and the token price will decline. Check protocol documentation for emission schedules and fee distribution. If the documentation is vague about where yield comes from or relies on phrases like 'ecosystem growth,' skip the protocol.
### How do I calculate my actual net return from a yield farming position?
Your net return equals fee income plus token rewards minus impermanent loss minus gas costs. Most dashboards show gross APY without accounting for these factors. Track your position value at deposit and withdrawal. Calculate the dollar value of fees and rewards earned. Subtract gas costs for deposit, any rebalancing transactions, reward claims, and withdrawal. Then calculate impermanent loss by comparing your final token holdings to what you would have held if you had not provided liquidity. Your actual APY is often 20-40% lower than the advertised number after accounting for IL and gas costs.
The Weekly Yield Report
You just decomposed yield farming into fee income, token emissions, and impermanent loss math. Those numbers and the protocols paying them will be different in three months.
Every Thursday: where crypto yield actually is - stablecoins, liquid staking and DeFi lending, with the risk named next to the rate and what changed since last week.
[Get it free every Thursday](#/portal/signup)
Free. No trade calls, no allocations, no hype. Unsubscribe in one click.
### How To Claim Crypto Losses On Taxes: Deduction Rules
URL: https://altcoininvestor.com/how-to-claim-crypto-losses-on-taxes/
Last updated: 2026-10-12T17:03:46.000Z
## What You Will Accomplish

You will report realized cryptocurrency capital losses to the IRS using Form 8949 and Schedule D. You will understand the $3,000 annual deduction limit against ordinary income, how to carry forward unused losses to future tax years, and the documentation the IRS requires to support your claim. This process reduces your tax liability through loss harvesting and carryforward mechanics, particularly when managing multi-year yield positions.
Prerequisites: you must have realized a loss by disposing of cryptocurrency at a price lower than your cost basis. Unrealized losses, no matter how large, do not qualify. You need transaction records showing acquisition date, acquisition cost, disposal date, and disposal proceeds for every taxable event.
In Argentina, capital controls forced millions to hold savings in USDT rather than pesos. Those who allocated a portion to Bitcoin during the 2021 peak and later sold at a loss face the same reporting challenge you do. The mechanism is identical whether you realized a $2,000 loss on a BTC trade in San Francisco or a $2,000 loss unwinding a yield position in Buenos Aires. The IRS requires Form 8949 either way.
## How Form 8949 and Schedule D Work Together
Form 8949 is the line-by-line transaction detail. Schedule D is the aggregation and netting layer. You cannot skip Form 8949 and go straight to Schedule D. The two-document flow is mandatory.
Form 8949 has two parts. Part I reports short-term transactions, meaning you held the cryptocurrency for one year or less before disposal. Part II reports long-term transactions, held for more than one year. Each transaction gets its own line: description of property (for example, "0.5 BTC"), date acquired, date sold, proceeds, cost basis, and the resulting gain or loss.
The IRS added transaction codes to Form 8949 to indicate the source of your data. If your exchange sent you a Form 1099-DA reporting gross proceeds and cost basis, and those numbers match your records, you use Box A for short-term or Box D for long-term. If the 1099-DA reported proceeds but not basis, you use Box B or Box E. If nothing was reported to the IRS at all, you use Box C or Box F.
After completing Form 8949, you transfer the totals to Schedule D. Schedule D performs the netting. Short-term losses offset short-term gains first. Long-term losses offset long-term gains first. Only after those internal offsets does the IRS allow you to net short-term results against long-term results. The final number on Schedule D, your net capital gain or loss, flows to Form 1040 line 7.
This two-layer structure matters because it determines what survives into carryforward. A taxpayer with $50,000 in long-term losses and $45,000 in long-term gains nets to a $5,000 long-term loss. That $5,000 is subject to the $3,000 annual limit against ordinary income, leaving $2,000 to carry forward, not $47,000.
## The $3,000 Annual Deduction Limit and How It Works
After netting all capital gains and losses, the IRS allows you to deduct up to $3,000 of net capital loss against ordinary income per year. If you are married filing separately, the limit is $1,500\. This limit has remained unchanged for years and applies to 2025, 2026, and beyond until Congress changes it.
The limit applies to your net loss, not your gross losses. If you have $10,000 in short-term losses and $5,000 in short-term gains, your net short-term loss is $5,000\. You deduct $3,000 against ordinary income this year and carry forward the remaining $2,000.
There is no limit on using capital losses to offset capital gains. If you are carrying forward $200,000 in losses from prior years and you realize $200,000 in gains this year, the entire carryforward absorbs the gains. The $3,000 limit only applies to the portion you deduct against wages, interest, or other ordinary income.
This is the primary income mechanism: a large realized loss from a yield position unwound in Year 1 can offset staking rewards, LP fees, and other ordinary income up to $3,000 per year, then offset any capital gains you realize in future years without limit. The carryforward becomes a multi-year tax asset.
## Carryforward Mechanics and Character Preservation
Unused capital losses carry forward indefinitely under IRC sections 1211 and 1212\. There is no expiration. A loss realized in 2022 can offset a gain in 2035 if you have not used it yet.
Carryforwards preserve their character as short-term or long-term. A short-term loss from 2023 remains a short-term loss when carried to 2024, 2025, and beyond. This matters because long-term losses offset long-term gains first, and short-term losses offset short-term gains first, before any cross-netting occurs.
The IRS treats the $3,000 deduction as a short-term capital gain for purposes of computing what survives into the next year. This means the $3,000 comes out of your short-term loss bucket first, even if you also have long-term losses. A taxpayer with $5,000 in short-term losses and $10,000 in long-term losses will deduct $3,000 against ordinary income (absorbed from the short-term bucket), carry forward $2,000 short-term and $10,000 long-term.
Most taxpayers and many CPAs miss this ordering rule. The result is that long-term losses tend to survive into carryforward at higher rates than short-term losses. If you are managing a multi-year DeFi position with yield income taxed as ordinary and a later exit generating capital losses, tracking the character of each loss component is essential.
Record your carryforward on your Schedule D each year. Line 6 on Schedule D (short-term) and line 14 (long-term) ask for prior-year carryforward. The IRS does not automatically track this for you. If you forget to claim a carryforward, it does not disappear, but you will need to amend prior returns to recover it.
## Realized vs. Unrealized Losses and Common Mistakes
Only realized losses are deductible. A realized loss occurs when you dispose of cryptocurrency through a sale, trade, or exchange at a price lower than your cost basis. Holding Bitcoin that has declined in value does not create a realized loss. Your wallet balance and unrealized loss do not matter to the IRS until you execute a taxable disposition.
This creates the core of tax-loss harvesting: you sell the asset to realize the loss, claim the deduction, and if you still want exposure to that asset, you buy it back. In traditional securities markets, the wash sale rule under IRC section 1091 disallows the loss if you repurchase the same or substantially identical security within 30 days before or after the sale.
As of 2026, cryptocurrency is classified as property, not a security. Section 1091 does not apply to direct sales of Bitcoin, Ethereum, or other digital assets. You can sell Bitcoin at a loss, buy it back the same day, and still claim the capital loss on Form 8949\. This is a significant advantage over stock traders, who must wait 31 days to avoid the wash sale disallowance.
This treatment is fragile. Congress has considered extending the wash sale rule to digital assets in multiple legislative drafts. The IRS has not issued guidance explicitly blessing same-day loss harvesting in crypto, though the statute does not currently prohibit it. If you harvest losses aggressively, document the distinction between direct crypto holdings and crypto-linked securities like futures ETFs or company stocks, which do fall under section 1091.
The most common mistake is forgetting to track cost basis across wallets and exchanges. When you transfer Bitcoin from Coinbase to a hardware wallet, that is not a taxable event, but your cost basis travels with the asset. If you later sell from the hardware wallet, the cost basis is still the original acquisition price on Coinbase, not the market value at the time of transfer. Failing to track this creates two failure modes: claiming a loss that does not exist, or overpaying tax because you forgot your actual basis was higher.
## Yield Positions, Staking Rewards, and Two-Bucket Scenarios
Yield farming and staking create a two-bucket tax scenario that most single-event trading guides ignore. Staking rewards are taxable as ordinary income at the moment you receive them, per Revenue Ruling 2023-14\. Lending interest accrues with every block and is also ordinary income. LP fees in Uniswap v2 and v3 pools follow different accrual rules, but the result is the same: you pay income tax on the reward when you receive dominion and control.
If you stake ETH in 2024 and earn $8,000 in staking rewards, you report $8,000 of ordinary income on your 2024 return. That $8,000 becomes the cost basis in the newly received ETH. If the market crashes in 2025 and you sell the staked ETH at a $12,000 capital loss, you report the $12,000 loss on Form 8949 in 2025\. The $8,000 of ordinary income you already paid tax on in 2024 does not reduce the 2025 loss, but the $8,000 is now part of your cost basis, which limits the size of the loss.
This two-bucket structure is why multi-year yield positions require careful documentation. The yield you earned in Year 1 increased your cost basis. The capital loss you realized in Year 2 reflects the decline from that elevated basis. If you forget to add the staking rewards to basis, you will overstate the capital loss and trigger an audit if the IRS cross-references your 1099-DA proceeds against incomplete basis records.
Impermanent loss in liquidity pools is a separate edge case. The IRS has not issued definitive guidance. Depositing into a Uniswap pool typically produces LP tokens and is treated as a taxable swap of the underlying assets for the LP token. Withdrawing reverses the transaction. If the value of the assets you withdraw is less than the value you deposited due to price divergence, some CPAs argue this is a realized capital loss. Others argue impermanent loss is not realized until you exit the pool and sell the underlying tokens. Conservative practitioners wait until final disposition. Aggressive practitioners claim the loss at withdrawal. The IRS has not ruled, so if you take an aggressive position, document the methodology and be prepared to defend it.
## Documentation Requirements and IRS Scrutiny Under Form 1099-DA
The IRS introduced Form 1099-DA for digital asset transactions. Brokers must report gross proceeds for sales occurring on or after January 1, 2025\. Cost basis reporting begins for covered digital assets acquired in a broker account on or after January 1, 2026\. This means the IRS increasingly sees your sale proceeds directly from the exchange. Your basis records need to hold up under cross-reference.
For every transaction on Form 8949, you need the date acquired, date sold, proceeds, cost basis, and resulting gain or loss. If you used multiple exchanges, moved assets between wallets, or participated in DeFi protocols, reconstructing this data is the hardest part of the process. Most exchanges provide CSV exports, but they rarely calculate cost basis correctly, especially if you transferred assets in or out.
Acceptable documentation includes exchange transaction histories, blockchain explorer records showing wallet transfers, contemporaneous notes recording acquisition prices, and third-party tax software reports that reconcile wallet and exchange activity. The IRS does not require a specific format, but the burden of proof is on you. If your reported basis is higher than what the exchange reported, or if you claim a loss on an asset the IRS has no record of you purchasing, expect a CP2000 notice asking for substantiation.
If your 1099-DA shows proceeds but not basis, you must manually enter basis and use the correct box code on Form 8949\. If you received no 1099-DA at all, for example because the transaction occurred on a non-U.S. exchange or a self-custodied wallet, you still report it using Box C or Box F. Failing to report a transaction because you did not receive a 1099-DA is not a defense. The taxable event still occurred.
For users in Turkey routing stablecoin corridors or in Nigeria using P2P exchanges, the absence of a U.S.-issued 1099-DA does not eliminate the reporting requirement if you are a U.S. taxpayer. The IRS expects you to report worldwide income and gains. If you realized a capital loss on a non-U.S. platform, document the transaction the same way you would a Coinbase trade and report it on Form 8949 with the appropriate box code.
## Step-by-Step Filing Process
First, gather all transaction records. Export CSVs from every exchange you used. Download wallet transaction histories from blockchain explorers if you used self-custody. If you participated in DeFi protocols, retrieve on-chain records of deposits, withdrawals, swaps, and LP position entries and exits. Organize by short-term (held one year or less) and long-term (more than one year).
Second, calculate cost basis for each transaction. If you bought 1 BTC for $30,000 and sold it for $20,000, your cost basis is $30,000, proceeds are $20,000, and your loss is $10,000\. If you received staking rewards worth $5,000 at the time of receipt, your cost basis in those rewards is $5,000\. If you later sold them for $3,000, the loss is $2,000\. Match every sale to an acquisition using FIFO, specific identification, or whatever method you chose, but use the same method consistently across all assets.
Third, complete Form 8949 Part I for short-term transactions and Part II for long-term transactions. Enter each transaction on a separate line or attach a statement with the same information if you have hundreds of trades. Use the correct box code based on whether you received a 1099-DA and whether it included basis. Sum the gains and losses in each part and transfer the totals to Schedule D.
Fourth, complete Schedule D. Enter short-term totals from Form 8949 Part I into Schedule D Part I. Enter long-term totals from Form 8949 Part II into Schedule D Part II. If you have capital loss carryforward from prior years, enter it on line 6 (short-term) or line 14 (long-term). The form will net everything and calculate your final capital gain or loss.
Fifth, apply the $3,000 deduction limit. If your net capital loss exceeds $3,000, Schedule D will automatically limit the deduction to $3,000 (or $1,500 if married filing separately) and show the amount to carry forward to next year. Record the carryforward amount in your personal tax files. The IRS does not store it for you. You will need it next year.
Sixth, attach Form 8949 and Schedule D to your Form 1040 and file. If you are using tax software, it will generate the forms automatically once you enter the transactions. If you are filing by hand, double-check every line and every transferred total. Errors in the netting process or forgetting to claim a carryforward are the two most common mistakes.
## What Happens If You Forget or Make a Mistake
If you forget to claim a capital loss in the year you realized it, you can file an amended return using Form 1040-X. The statute of limitations is generally three years from the date you filed the original return. If you realized a loss in 2024 and filed in April 2025, you have until April 2028 to amend and claim the loss.
If you claim a loss and later discover your cost basis was wrong, you should amend. Overstating a loss is more dangerous than understating it because the IRS treats it as underpayment of tax, which can trigger penalties and interest. Understating a loss just means you overpaid, and you can amend to get a refund.
If the IRS sends you a CP2000 notice because your reported basis does not match the 1099-DA they received, respond with documentation. Provide the transaction history showing your actual acquisition date and cost. If you transferred the asset from another wallet or exchange, show the blockchain record and the original purchase. The IRS will adjust your account if the documentation supports your position.
If you are carrying forward losses and fail to claim them in a given year, the carryforward does not expire. You can claim it in a future year, but you cannot skip years selectively. If you had a $10,000 carryforward in 2024 and forgot to claim it, you must amend 2024 to claim the $3,000 deduction that year before you can use the remaining $7,000 in 2025.
## What to Do Next
Organize your records now, before the next tax year closes. Export transaction histories from every exchange. Download wallet records from blockchain explorers. If you use DeFi protocols, retrieve on-chain data showing deposits, withdrawals, and swaps. If you have not been tracking cost basis in real time, start now. Use a spreadsheet or third-party tax software to reconcile wallet transfers and calculate basis for every holding.
If you realized significant losses in a prior year and did not claim them, calculate whether amending is worth the effort. If the carryforward is large enough to offset future gains or provide the $3,000 annual deduction for multiple years, file Form 1040-X.
If you are managing multi-year yield positions, track the character of each loss component. Know which losses are short-term and which are long-term. Know how much carryforward you have and in which bucket. This matters when you realize future gains because the netting order determines how much of the carryforward you consume.
If you earned staking rewards or LP fees in prior years, add those amounts to the cost basis of the tokens you received. Do not double-tax yourself by forgetting that the ordinary income you already reported created basis in the new tokens.
You now know how to report crypto capital losses, how the $3,000 limit works, how to preserve and claim carryforwards, and what documentation the IRS requires. The forms are not complicated, but the multi-year netting and character preservation mechanics trip up most taxpayers. If you have a large carryforward or complex yield positions, verify your methodology with a CPA who understands digital asset taxation before you file.
## The Takeaway
Form 8949 reports every realized crypto loss as a line item. Schedule D nets short-term against short-term, long-term against long-term, then applies the $3,000 annual deduction limit. Unused losses carry forward indefinitely and preserve their character. The $3,000 deduction comes out of the short-term bucket first, so long-term losses survive into carryforward at higher rates. Staking rewards and LP fees create ordinary income in Year 1 and increase cost basis, which affects the capital loss calculation in Year 2 when you exit the position. Crypto avoids the wash sale rule today, but that advantage is policy-dependent. Document everything, because Form 1099-DA means the IRS sees your proceeds and will cross-reference your basis. Multi-year yield positions require tracking the character and timing of every component, or you will either overpay or trigger an audit. The carryforward is a multi-year tax asset, not a one-time event, and managing it correctly can offset significant future income.
## Frequently Asked Questions
### Can I deduct crypto losses if I didn't sell, just held a position that declined?
No. Only realized losses are deductible. A realized loss occurs when you dispose of cryptocurrency through a sale, trade, or exchange at a price lower than your cost basis. Holding an asset that has declined in value does not create a tax deduction. You must execute a taxable transaction to realize the loss and report it on Form 8949.
### Does the wash sale rule apply to Bitcoin and Ethereum losses?
Not under current IRS rules as of 2026\. IRC section 1091 disallows losses only for stock or securities. The IRS classifies cryptocurrency as property, not a security, so you can sell Bitcoin at a loss and buy it back the same day while still claiming the capital loss. This treatment could change if Congress extends the wash sale rule to digital assets.
### How much of my crypto losses can I deduct each year?
Capital losses first offset capital gains without limit. After netting all gains and losses, you can deduct up to $3,000 of net capital loss against ordinary income per year, or $1,500 if married filing separately. Any unused loss carries forward indefinitely to future tax years and retains its character as short-term or long-term.
### What happens to my staking rewards when I claim a capital loss on the position?
Staking rewards are taxable as ordinary income when you receive them, per Revenue Ruling 2023-14\. That income amount becomes the cost basis in the newly received tokens. If you later sell at a loss, the capital loss is calculated from that elevated basis. The ordinary income you already paid tax on does not reduce the capital loss, but it does increase your cost basis, which limits the size of the loss.
### Do I need to report crypto losses if I didn't receive a 1099-DA from the exchange?
Yes. Every realized capital loss must be reported on Form 8949, regardless of whether you received a 1099-DA. If no form was issued, use box code C for short-term or F for long-term transactions. The absence of a 1099-DA does not eliminate the reporting requirement. You are responsible for reporting all taxable events, including those on non-U.S. exchanges or in self-custodied wallets.
Tool mentioned above
Koinly
Koinly imports from 800+ exchanges and wallets and handles the DeFi cases most tools get wrong - rebasing tokens, LP positions, staking rewards.
[Try Koinly](https://koinly.io/?via=F6E2E35A&utm%5Fsource=affiliate)
We may earn a commission if you sign up through this link, at no cost to you. It does not change what gets recommended.
The Weekly Yield Report
You have just reviewed Form 8949 reporting, the $3,000 limit, and carryforward character preservation. Those rules stay stable, but 1099-DA enforcement and wash sale legislation will not.
Every Thursday: where crypto yield actually is - stablecoins, liquid staking and DeFi lending, with the risk named next to the rate and what changed since last week.
[Get it free every Thursday](#/portal/signup)
Free. No trade calls, no allocations, no hype. Unsubscribe in one click.
### How To Earn DeFi Yield Safely: The Real Playbook
URL: https://altcoininvestor.com/how-to-earn-defi-yield-safely/
Last updated: 2026-10-12T15:03:30.000Z
## Understanding What Safe Yield Actually Means

Safe DeFi yield is not about finding the highest APY. It is about identifying yield mechanisms you can decompose, verify, and stress-test. A protocol paying 4.8% with a clear income source is safer than one paying 50% with no explanation of where the return comes from. The difference is structural: real yield comes from economic activity that generates revenue. Ponzi yield comes from new deposits.
The test is simple. If the protocol stopped attracting new capital tomorrow, would it still generate returns? [Aave generates lending fees from borrowers](https://altcoininvestor.com/best-defi-protocols/). Curve generates trading fees from swaps. Pendle generates fees from yield trading. These protocols produce income independent of new user deposits. That is the baseline definition of safe yield.
The red flag is inverse. A protocol paying 300% APY but collecting zero protocol fees is structurally dependent on new deposits. When deposits stop, the yield stops. That is not a yield mechanism. That is a Ponzi scheme with a countdown timer. The SEC defines this explicitly: payment of returns to existing investors from new investor contributions rather than legitimate business activities.
## The Risk Stack Framework

Every DeFi position carries four distinct risk layers. Most users evaluate only one. You need to evaluate all four before deploying capital.
**Smart contract risk:** The protocol's code could contain exploitable vulnerabilities. This risk compounds exponentially with complexity. A simple Aave deposit exposes you to one contract. A vault that deposits into Aave, which supplies to Compound, which stakes in Curve exposes you to four. Each additional layer multiplies the attack surface. Aave V3 has been audited by six firms and holds $11 billion in TVL without a critical exploit. That is not zero risk. That is acceptable risk for conservative yield strategies.
**Market risk:** The underlying yield source can compress or invert. Aave's 4.8% USDC rate depends on borrowing demand. If demand drops, rates drop. Ethena's sUSDe yield depends on perpetual funding rates staying positive. Historically, 17.5% of days have carried negative summed funding for ether positions, with the longest negative stretch at 13 days. The protocol has a reserve fund to absorb negatives, but the fund is finite. Sustained negative funding for months would drain the reserve and force yield to zero.
**Oracle risk:** Protocols depend on price feeds to calculate collateralization ratios, liquidation thresholds, and position health. Chainlink oracles support Aave. No critical V3 exploit has occurred via oracle manipulation to date, but [protocol contagion demonstrated in April 2026](https://altcoininvestor.com/how-to-evaluate-crypto-yield/) when KelpDAO's $292 million incident triggered a $10 billion exodus from Aave. The risk is not theoretical.
**Governance risk:** Protocol teams control upgrade keys, multisigs, and emergency pause functions. Pendle operates a 2-of-4 multisig with undisclosed signers. sPENDLE governance is limited to emission direction. No path to full decentralization has been articulated. This means four people control $1.24 billion in user capital. That is a trust assumption most users do not realize they are making.
## Platform Selection: The Protocols That Have Actually Paid Out
**Aave V3:** Typical stablecoin lending APY ranges from 3-8% as of 2026\. Ethereum mainnet USDC yields approximately 4.8% gross. Polygon and Arbitrum offer 4.7% with gas costs of $0.50 per transaction versus $3.78 on mainnet. The yield comes from borrower interest minus a protocol reserve factor of 10-20%. All borrowing positions are strictly overcollateralized and monitored in real-time by the Health Factor.
Aave has best-in-class DeFi security but zero regulatory protection. The contagion risk demonstrated in April 2026 is structural: protocols built on top of Aave create dependencies that can cascade. The failure mode is not Aave's code. The failure mode is a connected protocol draining liquidity so fast that Aave users panic and withdraw $10 billion in 48 hours.
**Curve Finance:** $2.39 billion TVL with typical APY ranges of 3-10%. The 3pool (USDC/USDT/DAI) processes $800 million in daily volume and generates approximately $320,000 in daily trading fees split among LPs. That produces 3-6% base yield before any CRV token emissions. LPs deposit into Curve pools and earn a share of trading fees. On stable pairs, fees are low per trade but aggregate to meaningful annual yields on high-volume pools.
The risk is pool depeg. Curve's 3pool lost more than 10% during the March 2023 USDC depeg before recovering. Impermanent loss barely registers on stablecoin pairs since tokens trade near $1, but depeg events can cause temporary principal loss even if the pool eventually recovers. [The veCRV locking mechanism](https://altcoininvestor.com/how-to-provide-liquidity-dex/) rewards long-term holders with boosted yields up to 2.5x and protocol revenue sharing.
**Pendle Finance:** $1.24 billion TVL as of September 2026, down from $2.08 billion at end of Q1\. Pendle splits yield-bearing tokens like sUSDe, stETH, and weETH into Principal Tokens (PT) that redeem 1:1 at maturity, and Yield Tokens (YT) that capture variable yield. Conservative investors can buy PTs or sell YTs to secure fixed yields. Traders can buy YTs to bet on higher yields or capture bonus rewards.
Pendle's primary risk is compositional. Activity concentrates in cyclical yield opportunities like Ethena. TVL dropped approximately 70% from its $13 billion peak due to unwinding of Ethena positions concentrated in Pendle markets. When maturities expire, capital leaves. Fee generation collapses when yields compress. The protocol charges a 5% fee on all yield accrued by YT holders, with 80% of remaining revenue going to PENDLE buybacks.
**Ethena / sUSDe:** On September 28, 2026, sUSDe paid 4.76% APY with a 30-day average of 4.79% and $1.31 billion in TVL. Yield comes from delta-neutral basis trading: Ethena holds long spot positions in LSTs (primarily stETH) and BTC, shorts equivalent perpetual futures, and harvests funding rate paid by long perp traders. A 10% protocol performance fee is deducted from gross yield before distribution.
The failure mode is structural. The model depends on funding staying positive. Ethena's data shows 17.5% of days carried negative summed funding for ether positions, with the longest negative stretch at 13 days versus the longest positive at 176 days. A reserve fund absorbs negatives so stakers are not charged, but the fund is finite. Prolonged negative funding drains the reserve and forces yield to zero or negative.
## Verifying Yield Sources On-Chain
Marketing claims mean nothing. On-chain data is the only verification that matters. Here is what to check before deploying capital.
**Protocol fee generation:** Visit [DefiLlama](https://defillama.com/) and navigate to the protocol page. Look for the Fees and Revenue section. Curve generates approximately $120 million in annual fees and emits $80 million in CRV tokens. The ratio is 1.5 to 1\. That is healthy. Fees exceed emissions. The protocol is not dependent on inflation to pay yields.
Inverse example: a protocol paying 300% APY but showing zero fees on DefiLlama is structurally unsustainable. The only source of return is new deposits. When deposits stop, the yield stops. Skip.
**Utilization ratios:** Aave publishes utilization rates for every market. USDC utilization on Ethereum mainnet currently sits around 65%. That means 65% of deposited USDC is being borrowed and generating interest. The supply APY you earn is a function of that utilization. If utilization drops to 20%, your yield drops proportionally. Monitor utilization before entering a lending position.
**Contract audits and exploit history:** Check whether the protocol has been audited by reputable firms. Aave V3 has been audited by Trail of Bits, OpenZeppelin, ABDK, Peckshield, Certora, and Sigma Prime. That is not a guarantee of safety, but it is a baseline requirement. Then check the exploit history. Has the protocol suffered a critical loss event in the past two years? If yes, [read the post-mortem](https://altcoininvestor.com/defi-yield-tax-reporting/). If the team did not publish a detailed post-mortem naming the specific failure mechanism, that is a red flag for governance competence.
## Position Sizing Across Protocols
Diversification reduces single-protocol risk but introduces operational complexity. The baseline rule: never deposit more than you can afford to lose in a single protocol. That is not conservative rhetoric. That is the structural reality of smart contract risk.
Practical framework: split yield capital across 3-5 protocols. Aave 30%, Curve 30%, Pendle 20%, Ethena 20% is a reasonable allocation for someone deploying $50,000 in DeFi yield strategies. That structure ensures that a single protocol exploit does not wipe out the entire position. It also ensures that correlated failures (Pendle and Ethena are highly correlated due to composability) do not exceed 40% of total capital.
Layer 2 networks offer 10x cheaper gas than Ethereum mainnet while maintaining identical APYs. Polygon and Arbitrum Aave deployments pay 4.7% on USDC with gas costs of $0.50 per transaction. Mainnet pays 4.8% with gas costs of $3.78\. For positions under $10,000, the gas differential often produces better net returns on L2 than mainnet despite slightly lower gross APY.
Avoid nested exposure. A Yearn vault that deposits into Aave, which supplies to Compound, which stakes in Curve exposes you to four protocol risks compounded. Each layer multiplies the attack surface. Stick to direct protocol exposure unless the additional yield from the aggregator meaningfully compensates for the added risk. In most cases, it does not.
## The Specific Mistakes That Turn Low-Risk Yield Into Losses
**Chasing APY without decomposing the mechanism:** A protocol advertising 50% APY on stablecoins is either lying, paying in inflationary emissions, or exposing you to leveraged market risk. Decompose the yield. What are the constituent parts? If the answer is not clear from the protocol documentation, skip the position. High yield without a clear mechanism is a red flag, not an opportunity.
**Ignoring the unstaking delay:** Ethena's sUSDe has a 7-day cooldown on unstaking. During high-volatility periods, that locked capital can represent meaningful opportunity cost or worse, forced exposure during a liquidation cascade. Pendle's PT tokens are tradable but illiquid. Exiting a $50,000 PT position in a low-liquidity pool can cost 2-5% in slippage. That erases months of yield. Always check the exit mechanism before entering the position.
**Deploying on unaudited forks:** Aave has dozens of forks. Most are unaudited. Some are outright scams with backdoor withdrawal functions. Stick to the original protocol or forks with independent audits and meaningful TVL. A fork with $5 million TVL and no audits is not an opportunity. It is a honeypot.
**Failing to monitor utilization and funding rates:** Aave yields fluctuate with utilization. Ethena yields fluctuate with perpetual funding rates. Both can compress to near-zero in specific market conditions. Set alerts for utilization dropping below 40% or funding rates turning negative for more than three consecutive days. Those are early warning signals that your yield is about to compress.
**Ignoring protocol fee extraction:** [Protocols charge performance fees](https://altcoininvestor.com/how-to-yield-farm-safely-2026/) that reduce gross yield to net yield. Pendle charges 5% on yield. Yearn v3 charges 10%. Convex charges 17% on CRV revenue. Beefy charges 4.05% to 9.5%. Those fees compound annually. A 10% performance fee on an 8% APY position reduces your net yield to 7.2%. Over five years, that 0.8% annual drag costs you 4% of total returns. Factor fees into the position sizing decision before entering.
## The Takeaway
Safe DeFi yield starts with decomposition. If you cannot name the yield mechanism's constituent parts, you do not understand the position. Aave's 4.8% comes from borrower interest. Curve's 3-6% comes from trading fees. Pendle's fixed rates come from yield trading fees. Ethena's 4.76% comes from perpetual funding arbitrage with a reserve buffer. Each mechanism has a specific failure mode. Aave fails under contagion. Curve fails under depeg. Pendle fails under cyclical unwinding. Ethena fails under sustained negative funding.
Position sizing across 3-5 protocols with 2+ years of exploit-free operation reduces single-protocol risk. Layer 2 deployments reduce gas drag. Monitoring utilization ratios, funding rates, and protocol fee generation on-chain reveals stress conditions before they turn into losses. The playbook is not complicated. Decompose the mechanism, verify the yield source, name the failure mode, size the position accordingly.
## Frequently Asked Questions
### What is the safest DeFi protocol for earning yield in 2026?
Aave V3 has the strongest security track record with six independent audits and $11 billion TVL without a critical exploit. Stablecoin lending on Aave yields 4-8% APY with overcollateralized borrowing and real-time Health Factor monitoring. Curve Finance is a close second with $2.39 billion TVL and yield generated from actual trading fees rather than inflationary emissions. Both have been stress-tested through multiple market cycles and produce verifiable on-chain income.
### How do I verify that a DeFi yield source is real and not a Ponzi?
Check DefiLlama for protocol fee generation. Real yield comes from economic activity that produces revenue independent of new deposits. Curve generates $120 million annually in fees and emits $80 million in CRV, a 1.5:1 ratio showing fees exceed emissions. A protocol paying 300% APY but showing zero fees on DefiLlama is structurally dependent on new deposits. When deposits stop, yield stops. That is the definition of a Ponzi scheme.
### What is the biggest risk when earning DeFi yield?
Smart contract risk compounds exponentially with complexity. A simple Aave deposit exposes you to one contract. A vault depositing into Aave, then Compound, then Curve exposes you to four. Each layer multiplies the attack surface. Even audited protocols carry risk, as demonstrated in April 2026 when the KelpDAO incident triggered a $10 billion exodus from Aave despite Aave's code being secure. Protocol contagion is structural, not theoretical.
### How much capital should I allocate to a single DeFi protocol?
Never deposit more than you can afford to lose in a single protocol. A reasonable allocation for $50,000 in DeFi yield is 30% Aave, 30% Curve, 20% Pendle, 20% Ethena. This ensures a single exploit does not wipe out the entire position and limits correlated failures to 40% of capital. Stick to protocols with 2+ years of exploit-free operation and meaningful TVL above $500 million.
### Why are Layer 2 yields better than Ethereum mainnet for small positions?
Gas costs determine net returns on positions under $10,000\. Polygon and Arbitrum Aave deployments pay 4.7% APY on USDC with $0.50 gas per transaction. Mainnet pays 4.8% with $3.78 gas. For a $5,000 position held six months with two transactions, L2 saves $6.56 in gas. That 0.13% gain may seem small, but compounded over multiple positions and years, L2 meaningfully outperforms mainnet for capital-efficient deployers.
The Weekly Yield Report
You have just decomposed Aave's 4.8%, Curve's 3-6%, Pendle's fixed rates, and Ethena's 4.76% yield mechanisms. Those numbers will compress, and new protocols will emerge with different failure modes.
Every Thursday: where crypto yield actually is - stablecoins, liquid staking and DeFi lending, with the risk named next to the rate and what changed since last week.
[Get it free every Thursday](#/portal/signup)
Free. No trade calls, no allocations, no hype. Unsubscribe in one click.
### Bitcoin Life Insurance: What the Meanwhile Round Means
URL: https://altcoininvestor.com/bitcoin-life-insurance-meanwhile-funding/
Last updated: 2026-10-15T18:00:06.000Z
## What Meanwhile Built and Who Backed It
Sam Altman-backed Bitcoin life insurer Meanwhile closed a $37.5 million funding round led by Bain Capital Crypto. The company offers life insurance products denominated in Bitcoin, allowing policyholders to maintain BTC exposure while holding long-term coverage. The funding round indicates institutional capital is moving beyond custody products into income-generating financial instruments built on Bitcoin rails.
This is not a stablecoin yield product. This is not a DeFi protocol with governance tokens. This is a regulated insurance product where premiums are paid in Bitcoin, policies are denominated in Bitcoin, and beneficiaries receive payouts in Bitcoin. The income mechanism at work is insurance premium generation, not staking rewards or liquidity provision.
Bain Capital Crypto led the round. That matters. Bain is not leading speculative DeFi rounds in 2026\. They are leading rounds in projects building real financial products with regulatory clarity and institutional distribution channels. The Meanwhile raise sits alongside other institutional convergence plays, such as tokenized stock trading platforms and Bitcoin-collateralized lending products that have gained traction over the past year.
## The Income Layer for Long-Term Bitcoin Holders
Bitcoin holders face a specific problem. If you hold BTC for the long term because you believe it is a superior store of value, you are forgoing yield that dollar holders can capture through money market funds, Treasury bills, or stablecoin products. The opportunity cost of holding Bitcoin instead of yielding dollars is real, and it compounds over time.
Meanwhile's product offers one solution. Policyholders pay premiums in Bitcoin. Meanwhile collects those premiums and uses them to underwrite life insurance risk. The income generated comes from the spread between premium collection and actuarial payouts, the same way traditional life insurers earn. The difference is that the entire flow, from premium to payout, stays in Bitcoin.
This creates an income opportunity for Bitcoin holders who would have purchased life insurance anyway. Instead of converting BTC to dollars to pay premiums, they pay in BTC and keep their exposure. Instead of beneficiaries inheriting dollars and then deciding whether to buy Bitcoin, they inherit Bitcoin directly. For families in high-inflation economies where Bitcoin adoption is already established, this product removes a conversion step that would otherwise expose them to local currency risk or foreign exchange friction.
## Why This Matters for Emerging Market Adoption

The interesting signal here is not the American Bitcoin holder who wants life insurance. The interesting signal is the family in Argentina, Turkey, or Nigeria who already treats Bitcoin as a savings vehicle and now has access to a financial product that does not force them back into local currency.
In Argentina, families who moved savings into Bitcoin during the 2019 capital controls and the subsequent peso devaluation have been holding BTC as a dollar substitute for years. Those families need life insurance. Until now, accessing that insurance required converting BTC to pesos or dollars, paying premiums in fiat, and hoping beneficiaries could convert payouts back into hard currency without hitting capital controls or exchange rate losses.
A Bitcoin-denominated life insurance product removes that friction. Premiums stay in BTC. Payouts stay in BTC. No forced conversion. No exposure to peso devaluation risk between the date of the policyholder's death and the date beneficiaries receive the payout. For a family in Buenos Aires, that difference is not theoretical. It is the difference between a payout that preserves purchasing power and a payout that loses 30% to currency collapse while the claim processes.
The same logic applies in Turkey, where lira devaluation has driven significant Bitcoin adoption, and in Nigeria, where naira instability and capital controls have made BTC a preferred savings vehicle for the middle class. The adoption pattern is already in place. The financial product infrastructure is now catching up.
## What Institutional Capital Sees in Bitcoin Financial Products
Bain Capital Crypto's involvement signals that institutional capital is tracking a specific thesis: Bitcoin is moving from a speculative asset to a collateral and settlement layer for real financial products. The income opportunity is not in holding Bitcoin and hoping the price rises. The income opportunity is in building the financial services layer on top of Bitcoin and capturing fees, premiums, and spreads from users who are already holding BTC for other reasons.
This is the same thesis driving Bitcoin-collateralized lending, tokenized stock platforms, and institutional custody products. The question institutional investors are asking is not whether Bitcoin will replace the dollar. The question is whether there is enough demand from long-term Bitcoin holders to support a parallel financial system where BTC is the unit of account and the settlement layer.
Meanwhile's raise suggests the answer, at least for life insurance, is yes. Other products will follow. The income mechanisms will vary, but the underlying structure will be the same: take a traditional financial product, denominate it in Bitcoin, and serve the population of users who already hold BTC and do not want to convert back to fiat to access financial services.
For readers tracking where real institutional capital is flowing, the signal is clear. The income opportunities in Bitcoin are not just in staking, mining, or [trading on crypto exchanges](https://altcoininvestor.com/best-crypto-exchanges/). They are in building and operating the financial products that Bitcoin holders need once they decide to hold long-term.
## Who Benefits and Who Misses This Shift
The direct income beneficiaries from Meanwhile's model are the company and its investors, not retail policyholders. Policyholders get a product that preserves their Bitcoin exposure while accessing life insurance coverage. The income, in the form of underwriting spreads and premium collection, accrues to Meanwhile and, over time, to Bain Capital Crypto and other investors in the round.
That is the income structure of most financial services businesses. The yield does not go to the customer. The yield goes to the provider of the service. Retail Bitcoin holders are not earning passive income by holding a Meanwhile policy. They are paying for a service that allows them to stay in BTC while accessing insurance coverage. The income story here is about the business model, not the product user.
For readers thinking about where to deploy capital or where to look for income-generating projects, the lesson is this: the next wave of Bitcoin income opportunities will come from projects that provide financial services to long-term holders, not from projects that promise yield on BTC itself. Bitcoin does not natively generate yield. But Bitcoin holders need financial services, and the companies that provide those services can generate income from fees, spreads, and premiums.
Western analysts focused on staking yields and DeFi protocols may miss this entirely. The income story in Bitcoin is not DeFi. It is the institutional convergence of Bitcoin rails with traditional financial products. Life insurance is one product. Mortgages, annuities, and structured products will follow. Each represents a potential income stream for the companies that build them, and each depends on a population of long-term Bitcoin holders who need those products.
## The Takeaway
Meanwhile's $37.5 million raise, led by Bain Capital Crypto, confirms that institutional capital sees Bitcoin not as a speculative trade but as a settlement layer for real financial products. The income opportunity is in building and operating those products, not in holding Bitcoin and hoping for price appreciation. For families in high-inflation economies who already use Bitcoin as a savings vehicle, products like Bitcoin-denominated life insurance remove the forced conversion back into unstable local currencies. That removes friction and preserves value. For investors and builders, the signal is clear: the income layer on Bitcoin is financial services, not DeFi yield. The projects capturing institutional funding in 2026 are the ones building that layer, and the demand is coming from users in places where Bitcoin adoption is already real. [More institutional funding rounds](https://www.theblock.co/) in this category will follow, and most Western crypto income analysts will continue to miss the pattern until it is too obvious to ignore.
## Frequently Asked Questions
### What is Bitcoin-denominated life insurance?
Bitcoin-denominated life insurance is a life insurance product where premiums are paid in Bitcoin, policies are denominated in BTC, and beneficiaries receive payouts in Bitcoin. Meanwhile offers this product, allowing long-term Bitcoin holders to maintain BTC exposure while holding life insurance coverage. The product removes the need to convert Bitcoin to fiat currency to pay premiums or receive payouts, which is particularly valuable in high-inflation economies where local currency devaluation is a persistent risk.
### How do policyholders earn income from Bitcoin life insurance?
Policyholders do not earn income from holding a Bitcoin life insurance policy. The income in this model accrues to the insurance provider, in this case Meanwhile, through underwriting spreads and premium collection. Policyholders benefit by maintaining Bitcoin exposure and accessing insurance coverage without converting to fiat. The income opportunity is in owning or investing in the company providing the service, not in being a customer of the product itself.
### Why does Bitcoin life insurance matter for emerging markets?
Bitcoin life insurance removes forced conversion back into unstable local currencies. In Argentina, Turkey, and Nigeria, families already use Bitcoin as a savings vehicle and dollar substitute. Traditional life insurance requires converting BTC to local currency to pay premiums and exposes beneficiaries to devaluation risk during claim processing. Bitcoin-denominated policies allow premiums and payouts to stay in BTC, preserving purchasing power and avoiding capital controls or foreign exchange friction that would otherwise erode the payout value.
### What does institutional funding in Bitcoin financial products signal?
Bain Capital Crypto leading Meanwhile's $37.5 million round signals that institutional investors see Bitcoin as a collateral and settlement layer for real financial products, not just a speculative asset. The income opportunity is in building and operating financial services for long-term Bitcoin holders, capturing fees, premiums, and spreads. This thesis is also driving Bitcoin-collateralized lending, tokenized stock platforms, and custody products. Institutional capital is flowing toward projects that serve users who already hold BTC and need financial services without converting to fiat.
The Weekly Yield Report
You just read why one Bitcoin life insurer raised $37.5 million and which emerging markets benefit most. The next institutional round in this category will target a different financial product.
Every Thursday: where crypto yield actually is - stablecoins, liquid staking and DeFi lending, with the risk named next to the rate and what changed since last week.
[Get it free every Thursday](#/portal/signup)
Free. No trade calls, no allocations, no hype. Unsubscribe in one click.
### GPU Mining vs ASIC Mining: Real Income, Breakeven, and Exit
URL: https://altcoininvestor.com/gpu-vs-asic-mining-profitability/
Last updated: 2026-10-12T02:04:14.000Z
## The Decision Most Miners Get Wrong

The typical mining profitability calculator shows you daily revenue, subtracts electricity cost, and tells you how long until you break even on the hardware. That calculation is incomplete. It ignores the single largest difference between GPU and ASIC mining: exit value. A used RTX 3090 sells for $300 to $500 on secondary markets regardless of whether mining is profitable, because gamers, content creators, and AI researchers all want the hardware. A used Antminer S19j Pro two generations old has very limited resale value if it is no longer profitable to mine. This difference - 40% to 60% residual value for GPUs versus under 10% for ASICs - changes the entire return calculation.
I spent twelve years in the gambling industry before crypto, where product economics and customer lifetime value calculations were the basis of every decision. Mining hardware is the same structure: upfront capital deployed, daily operational costs incurred, uncertain revenue stream over time, and a residual asset value at exit. The way to evaluate GPU versus ASIC mining is total cost of ownership, not hashrate per watt. This article compares them across the metrics that determine real net income: daily earnings after electricity, upfront capital requirements, time to breakeven, and hardware resale value when you exit.
## Daily Earnings: What the Hardware Actually Nets

Start with the income the hardware generates after electricity cost, because that is the cash flow that pays back your capital and eventually turns into profit. The numbers here are current as of 2026 and assume $0.10 per kilowatt-hour electricity, which is roughly the threshold where most mining becomes marginal.
An RTX 4090, the highest-end consumer GPU available, generates approximately $0.80 to $1.20 per day after power cost. An RTX 4070 generates $0.30 to $0.45 per day. An RTX 3070 Ti generates $0.15 to $0.25 per day. These numbers come from mining Ethereum Classic or Ravencoin, the two most profitable GPU-minable coins in 2026\. [GPU mining post-merge killed the biggest opportunity](https://altcoininvestor.com/gpu-mining-profitable-coins/), and what remains is a smaller, more competitive income surface.
ASIC miners generate higher absolute daily income because they consume far more power and deploy far more capital. An Antminer S21 XP with 270 terahashes per second and 3,645 watts of power consumption generates approximately $1.80 to $5 per day after electricity at $0.10 per kilowatt-hour, depending on Bitcoin price. An Antminer L9 mining Litecoin and Dogecoin simultaneously earns roughly $4.63 per day in Litecoin and $10.63 per day in Dogecoin at $0.07 per kilowatt-hour. Litecoin and Dogecoin share the Scrypt algorithm, so any Scrypt ASIC mines both at once at no extra electricity cost. This merged mining structure is one of the few remaining high-yield ASIC opportunities for smaller operators.
The critical threshold for profitability is electricity cost. Bitcoin mining remains profitable for operators with power rates under about $0.08 per kilowatt-hour, ASIC hardware rated under 15 joules per terahash, and reliable uptime. In 2026, the break-even electricity price for an NVIDIA RTX 5090 mining traditional altcoins hovers around $0.04 per kilowatt-hour, while a top-tier Bitmain Antminer S23 Hydro maintains profitability at electricity prices up to $0.11 per kilowatt-hour. If you are a home miner paying $0.12 or more per kilowatt-hour, GPU mining of major coins is generally unprofitable or barely break-even. ASICs remain profitable at slightly higher electricity rates because of superior energy efficiency, but only for the most recent hardware generations.
## Upfront Capital and Hardware Cost
The capital required to deploy a competitive mining operation differs substantially between GPU and ASIC systems, and the difference compounds when you scale beyond a single unit.
A new NVIDIA RTX 4090 costs $1,200 to $1,800\. A six-GPU rig built around RTX 4070 Super cards costs approximately $3,000 to $4,000 and delivers roughly 200 megahashes per second on Etchash for Ethereum Classic mining. A used RTX 3080, the most cost-effective mining GPU in 2026, is widely available for $300 to $450 from miners who exited after Ethereum's merge to proof-of-stake. These used cards mining Ethereum Classic might generate $2 to $4 per day net profit, resulting in 100 to 200 days to return on investment if network difficulty and coin price remain stable.
A new Antminer S21 Pro costs approximately $4,000 to $6,000 for 234 terahashes per second. A single air-cooled ASIC runs $3,500 to $7,500 depending on the model and generation. The capital outlay per unit is comparable to a six-GPU rig, but the operational profile is entirely different. ASICs require 240-volt dedicated circuits, proper ventilation, and tolerance for significant noise. Loud 3,500-watt ASICs require infrastructure that most residential settings cannot support. The home miner category covers machines designed for residential use - quieter, smaller, lower power draw - but these units sacrifice efficiency and absolute hashrate.
The GPU advantage here is modularity. You can start with one or two cards, test profitability, and scale incrementally. ASICs are all-or-nothing: each unit is a discrete $4,000 to $7,000 capital deployment with no ability to scale down.
## Breakeven Time and Return on Investment
Time to breakeven is the most commonly cited metric in mining profitability discussions, and it is the most commonly misunderstood. The mistake is treating breakeven as static when difficulty, price, and hardware depreciation are all moving variables.
At $0.10 per kilowatt-hour electricity, the return on investment period for GPU mining Ethereum Classic on an RTX 4090 can be 18 to 24 months. In 2026, typical ROI periods range from two to five-plus years for new GPUs. ASICs have 12 to 18 month ROI cycles in stable, large-scale applications with low electricity rates. A break-even of 6 to 12 months is excellent, 12 to 18 months is healthy and acceptable for most well-hosted operations, and 18 to 30 months is workable only if you have a fixed low electricity rate and confidence that network difficulty will not spike during that period.
The problem with these calculations is that they assume static conditions. Network difficulty for Bitcoin sits at 126.23 trillion as of 2026, and hashrate sits at 826 exahashes per second. Every time a new generation of ASICs comes online, difficulty rises, and the daily income from your existing hardware declines. ASIC manufacturers release new generations frequently. A machine that is top-tier today might become unprofitable in 18 to 24 months as network difficulty rises and more efficient hardware enters the market. This is not speculation - it is the consistent pattern across every ASIC generation for the past eight years.
GPU mining faces the same difficulty increases, but the impact is dampened by the ability to switch coins. [Pool mining is the standard structure for small operators](https://altcoininvestor.com/solo-mining-vs-pool-mining/), and modern mining software allows GPU miners to switch between dozens of different cryptocurrencies at the click of a button. When Ravencoin is more profitable than Ergo, the miner pivots instantly. If you buy a Bitcoin ASIC, you can only mine SHA-256 coins. If the Bitcoin network changes its algorithm or the coin's value crashes, the hardware becomes a paperweight. This flexibility does not eliminate difficulty risk, but it reduces single-coin exposure substantially.
## Resale Value and Hardware Depreciation
This is the factor most mining calculators ignore entirely, and it is the largest difference in total cost of ownership between GPU and ASIC mining. GPU residual value is 40% to 60% after a four- to six-year lifespan. ASIC residual value is less than 10% after a two- to three-year lifespan. That difference is not small - it is the difference between losing 90% of your capital and recovering half of it.
A used RTX 3090 sells for $300 to $500 on secondary markets regardless of whether mining is profitable. The card has value to gamers running AAA titles at 4K, to content creators rendering video, and to AI researchers running local models. The mining income might disappear, but the hardware retains utility and therefore retains market value. GPU versatility allows resale or repurposing after the mining lifecycle ends, with a four- to six-year lifespan far exceeding ASICs and maintaining 40% to 60% residual value.
ASICs have no alternative use case. Unlike GPUs, ASICs have little to no resale value because they are designed for a specific task and cannot be used for anything else. If a miner decides to stop mining, they cannot recoup their investment by selling their ASIC. The depreciation curve is steep and accelerating, with new model announcements causing immediate drops. Prices can drop 50% or more in a single year during bear markets. A used Antminer S19j Pro two or three generations old has very limited resale value if it is no longer profitable to mine, because the only buyers are miners, and miners only buy hardware that is still profitable. Once your ASIC crosses the profitability threshold, its value approaches zero.
This difference changes the entire breakeven calculation. If you deploy $5,000 into GPUs and mine for three years, then sell the hardware for $2,500, your net capital outlay was $2,500\. If you deploy $5,000 into an ASIC and mine for three years, then sell the hardware for $300, your net capital outlay was $4,700\. The GPU miner needs to generate $2,500 in profit to break even. The ASIC miner needs to generate $4,700\. That is an 88% larger income requirement for the same upfront capital.
For operators who understand this, the decision changes. [Most breakeven calculators ignore resale timing and GPU market cycles](https://altcoininvestor.com/gpu-mining-breakeven-calculator-resale/), but resale value is not a footnote - it is a primary variable in the return equation.
## Energy Efficiency and Operating Cost
In terms of power consumption and computational efficiency, ASICs take the lead. Although they consume a large amount of power, their computational efficiency makes them the most energy-effective option per unit of work performed. A modern Bitcoin ASIC achieves 15 joules per terahash or better. A GPU mining Ethereum Classic might achieve 0.5 to 1.5 megahashes per watt, which translates to substantially worse efficiency on a work-per-watt basis.
The issue for small operators is that energy efficiency only matters if you have access to cheap electricity. Bitcoin mining is now mostly an industrial game: efficient ASICs and electricity under roughly $0.06 to $0.08 per kilowatt-hour separate profitable operators from those barely breaking even. Regional electricity costs swing the outcome dramatically. A setup that loses money at $0.15 per kilowatt-hour residential rates can be solidly profitable at $0.04 to $0.07 per kilowatt-hour industrial rates.
GPU miners face the same electricity cost sensitivity, but because absolute power consumption is lower per unit and because resale value provides a partial hedge against poor returns, the penalty for marginal electricity rates is smaller. A single RTX 4090 consumes 350 watts. A single Antminer S21 XP consumes 3,645 watts - more than ten times as much. If electricity cost rises or coin price falls and your operation becomes unprofitable, shutting down a GPU rig costs you future opportunity but preserves hardware value. Shutting down an ASIC rig begins the countdown to obsolescence, because the hardware has no alternative use and depreciates rapidly while idle.
## Flexibility, Coin Selection, and Network Risk
GPU miners can switch between dozens of different cryptocurrencies based on real-time profitability. Modern mining software automates this process, directing hashrate toward the most profitable coin every few minutes. ASICs are locked into a single algorithm. A Bitcoin ASIC can only mine SHA-256 coins. A Litecoin ASIC can only mine Scrypt coins. If the target network changes its consensus algorithm or if coin price collapses, the hardware becomes worthless overnight.
Bitcoin mining with GPUs became obsolete around 2015 when ASIC miners dominated the network. An Antminer S21 Pro produces 200 terahashes per second - more hashpower than thousands of RTX 4090s combined. GPU mining is dead for Bitcoin, and it will never return. The lesson here is that ASICs do not just dominate a network - they eliminate all competing hardware from profitability. This has already happened to Bitcoin. It is happening now to Kaspa, where ASICs have entered the ecosystem and GPU profitability has declined from peak levels. Ethereum Classic remains GPU-minable because the community has resisted ASICs, but there is no guarantee that resistance will hold indefinitely.
The risk for ASIC miners is single-coin exposure. If you deploy $30,000 into Bitcoin ASICs and Bitcoin's price falls 60%, your daily income falls 60% and your breakeven timeline extends dramatically. If you deploy $30,000 into GPUs and Ethereum Classic's price falls 60%, you switch to Ravencoin or Kaspa or whichever coin is most profitable that week. The income still declines because all altcoin prices are correlated, but you are not locked into a single asset.
## Who Each Option is Right For
ASICs are right for operators with access to industrial electricity rates below $0.08 per kilowatt-hour, sufficient capital to deploy at scale (at least $20,000 to $50,000 to make infrastructure and hosting costs worthwhile), and either ownership of suitable facilities or access to professional hosting. ASICs are also right for operators with very high conviction in a specific coin - typically Bitcoin - and willingness to accept single-asset exposure over a multi-year period. If you have cheap power, scale, and conviction, ASICs generate higher absolute income than GPUs and reach breakeven faster in stable conditions.
GPUs are right for smaller operators, for miners paying residential electricity rates above $0.10 per kilowatt-hour who want to test the income surface before committing large capital, and for anyone who values optionality and exit value. GPUs are also right for operators who want to repurpose hardware after mining - either selling into the gaming and AI markets or [renting out GPU compute](https://altcoininvestor.com/rent-out-gpu-for-income/) for inference and rendering work. If you have higher electricity costs, smaller capital, or lower conviction in any single coin, GPUs preserve more optionality and produce better risk-adjusted returns once resale value is included in the calculation.
Do not buy ASICs if you are paying more than $0.10 per kilowatt-hour for electricity. Do not buy GPUs if you are mining Bitcoin. Do not buy either if you have not modeled the breakeven calculation with realistic assumptions about difficulty increases, price volatility, and hardware depreciation.
## The Real Comparison: Total Cost of Ownership
The correct way to compare GPU and ASIC mining is not hashrate or even daily income - it is total cost of ownership over the hardware lifecycle, including exit value.
Assume you deploy $5,000 into mining hardware. You can buy one Antminer S21 Pro or a six-GPU rig with RTX 4070 Super cards. The ASIC generates higher daily income - roughly $3 to $5 per day versus $2 to $3 per day for the GPU rig, assuming $0.10 per kilowatt-hour electricity. The ASIC reaches nominal breakeven in 12 to 18 months. The GPU rig reaches nominal breakeven in 18 to 24 months.
But nominal breakeven ignores exit value. After two years, the ASIC has depreciated to roughly $500 in resale value - 10% of original cost. After two years, the GPU rig retains roughly $2,500 in resale value - 50% of original cost. The ASIC must generate $4,500 in profit to reach true breakeven. The GPU rig must generate $2,500 in profit to reach true breakeven. That is an 80% larger income requirement for the same upfront capital.
If you mine for two years and exit, the GPU rig needs to generate $1,250 per year in profit to break even. The ASIC needs to generate $2,250 per year. The ASIC's higher daily income advantage disappears when you include resale value in the calculation, unless you are confident you will mine for four or five years and that the hardware will remain profitable for that entire period. Given that ASIC manufacturers release new generations every 18 to 24 months and that each new generation reduces the profitability of older hardware, that confidence is difficult to justify.
## My Recommendation
For most readers of this site - smaller operators, people paying residential electricity rates, people who want exposure to mining income without committing $50,000 and five years - GPUs are the better choice. The lower absolute daily income is offset by flexibility, lower capital requirements, and dramatically higher exit value. The ability to switch coins, repurpose hardware, and recover 40% to 60% of your capital at exit makes GPUs a better risk-adjusted return than ASICs for anyone who does not have access to industrial-scale electricity rates.
If you have access to electricity below $0.06 per kilowatt-hour, if you can deploy at least $30,000 in capital, and if you have high conviction in Bitcoin specifically, ASICs generate higher absolute returns and reach breakeven faster in stable conditions. But stable conditions are rare. Difficulty increases, price volatility, and hardware obsolescence are the norm, not the exception. ASICs are a bet on stability. GPUs are a hedge against uncertainty.
The decision rule: if you can answer yes to cheap power, large capital, and long time horizon, buy ASICs. If any of those three is no, buy GPUs or [calculate breakeven before you buy anything](https://altcoininvestor.com/gpu-mining-profitability-calculator/).
## The Takeaway
Most mining profitability comparisons stop at daily income and time to breakeven. That analysis is incomplete because it ignores the single largest economic difference between GPU and ASIC mining: residual hardware value. A GPU retains 40% to 60% of its value after four years because it has alternative use cases in gaming, content creation, and AI compute. An ASIC retains less than 10% of its value after two years because it has no use case except mining a single algorithm, and mining profitability declines as difficulty rises and newer hardware arrives. Once you include exit value in the return calculation, the GPU's lower daily income is offset by dramatically lower net capital outlay. For smaller operators without access to industrial electricity rates below $0.08 per kilowatt-hour, GPUs produce better risk-adjusted returns than ASICs over any realistic time horizon. The hardware you can sell is worth more than the hardware you cannot, and that difference is worth real money.
## Frequently Asked Questions
### Which is more profitable for a home miner, GPU or ASIC?
For home miners paying residential electricity rates above $0.10 per kilowatt-hour, GPUs typically produce better risk-adjusted returns once resale value is included. ASICs generate higher daily income but require industrial electricity rates below $0.08 per kilowatt-hour and at least $20,000 to $50,000 in capital to make infrastructure costs worthwhile. GPUs retain 40% to 60% of their value after four years, while ASICs drop below 10% after two years, which changes the total cost of ownership calculation substantially.
### How long does it take to break even on GPU mining in 2026?
At $0.10 per kilowatt-hour electricity, ROI periods for new GPUs mining Ethereum Classic or Ravencoin range from 18 to 24 months for high-end cards like the RTX 4090\. Used RTX 3080 cards purchased for $300 to $450 can reach breakeven in 100 to 200 days if network difficulty and coin prices remain stable. These timelines assume static conditions. Difficulty increases and price volatility extend breakeven periods in practice, but GPU flexibility to switch coins reduces single-asset exposure.
### Why do ASICs lose resale value so quickly?
ASICs are single-purpose machines designed to mine one specific algorithm. They have no alternative use case in gaming, content creation, or AI compute. When an ASIC becomes unprofitable due to rising difficulty or falling coin prices, the only potential buyers are other miners, and miners only buy hardware that is still profitable. Each new ASIC generation increases network difficulty and reduces profitability for older hardware. Once your ASIC crosses the profitability threshold, resale value approaches zero because no one wants unprofitable hardware that cannot be repurposed.
### Can I mine Bitcoin profitably with GPUs in 2026?
No. Bitcoin mining with GPUs became obsolete around 2015 when ASIC miners dominated the network. An Antminer S21 Pro produces 200 terahashes per second, more hashpower than thousands of RTX 4090s combined. GPU miners are not competitive on Bitcoin and have not been for nearly a decade. GPUs remain viable for Ethereum Classic, Ravencoin, Kaspa, and other altcoins that either resist ASICs or have not yet attracted ASIC manufacturers. Bitcoin mining requires ASICs, period.
### What electricity rate makes ASIC mining profitable?
Bitcoin ASIC mining remains profitable for operators with power rates under about $0.08 per kilowatt-hour, assuming hardware rated under 15 joules per terahash and reliable uptime. The most efficient ASICs like the Antminer S23 Hydro maintain profitability at rates up to $0.11 per kilowatt-hour. Above $0.12 per kilowatt-hour, most ASIC mining becomes marginal or unprofitable unless Bitcoin price spikes substantially. Industrial operators target $0.04 to $0.07 per kilowatt-hour to maintain healthy margins through difficulty increases and price volatility.
The Weekly Yield Report
You have compared GPU and ASIC profitability across capital outlay, electricity cost, breakeven time, and resale value with 2026 data. Those numbers will shift next quarter as difficulty rises and new hardware launches.
Every Thursday: where crypto yield actually is - stablecoins, liquid staking and DeFi lending, with the risk named next to the rate and what changed since last week.
[Get it free every Thursday](#/portal/signup)
Free. No trade calls, no allocations, no hype. Unsubscribe in one click.
### Is Koinly Safe? Data Access, Storage, And Third-Party Risk
URL: https://altcoininvestor.com/is-koinly-safe/
Last updated: 2026-10-12T00:06:27.000Z
## What Koinly Sees When You Connect a Wallet or Exchange
Koinly uses read-only API access when you connect an exchange account. This means the software can retrieve transaction history, deposit records, withdrawal records, and trade data, but it cannot place orders, transfer funds, or modify your account in any way. The API key you generate on the exchange controls these permissions.
When you connect a blockchain wallet, Koinly only requires the public wallet address. No private keys, no seed phrases, no signing permissions. The platform queries public blockchain explorers to pull transaction history associated with that address. This is structurally safer than exchange API connections because there is no authentication token involved at all.
The risk here is not what Koinly is designed to access. The risk is what you accidentally grant when you create the API key. Exchange API systems allow you to specify exactly what the key can do: read transaction history, place trades, initiate withdrawals. If you check the wrong box when setting up the key, you have created a withdrawal-enabled token that now exists in Koinly's database. Not because Koinly asked for it, but because you gave it.
The platform does not need or request withdrawal permissions. But if your API key has those permissions attached and your Koinly account is compromised, that key becomes a direct attack vector. This is user-controlled risk, not a flaw in Koinly's design, but it is real exposure nonetheless.
## Where That Data Is Stored and How It Is Protected

Koinly hosts the vast majority of its services and data in Amazon Web Services facilities in the United States. API keys and blockchain wallet addresses are encrypted before storage on Koinly's servers. The platform holds SOC 2 and ISO 27001 certifications and is GDPR compliant.
All API and application endpoints use TLS/SSL encryption and score an A+ rating on SSL Labs' tests, with strong cipher suites, HSTS, and Perfect Forward Secrecy fully enabled. These are not marketing claims. They are measurable security configurations that reduce the risk of man-in-the-middle attacks during data transmission.
Koinly does not hold custody of any crypto assets. It does not store private keys or seed phrases because it never asks for them. The platform is a reporting tool, not a wallet or exchange. This structural design removes the most dangerous attack surface: the ability to move user funds directly.
But the platform does store API keys, transaction metadata, portfolio balances, and personally identifiable information like names and email addresses. That data is encrypted at rest, but encryption is only as strong as the access control protecting the decryption keys. If an attacker gains administrative access to Koinly's infrastructure, encrypted data becomes readable data.
## The Mixpanel Breach and What It Exposed

In December 2025, Koinly disclosed that email addresses and limited user metadata may have been exposed through a third-party breach at Mixpanel, an analytics service provider the company used to track user behavior and feature usage. Mixpanel itself was compromised, and data shared with Mixpanel by Koinly became accessible to unauthorized parties.
Koinly confirmed that no wallet information, transaction history, tax reports, or portfolio data was shared with Mixpanel or compromised in the incident. The information disclosed could have contained names, email addresses, rough position details like city or country, and device data like operating system and browser version.
This is the documented security incident in Koinly's history. The breach did not originate within Koinly's primary systems. It originated at a third-party analytics vendor, and the exposure was limited to metadata that Koinly had shared with that vendor for product improvement and user tracking. The company stopped using Mixpanel after the incident and initiated an audit of other third-party tools that process user information.
What the incident demonstrates is third-party risk. Koinly's main infrastructure was not compromised, but the data that left Koinly's controlled environment and entered a vendor's system became vulnerable to that vendor's security practices. This is a structural risk in any platform that integrates external services, and it is one that users cannot fully avoid without opting out of the platform entirely.
The company has not disclosed the exact number of users impacted or the specific timeframe during which the exposure occurred. It stated that it is collaborating with Mixpanel to determine the full extent of the incident, but as of publication, no further details have been made public.
## API Permission Scopes and What You Control
When you create an API key on an exchange, you are presented with a set of permission checkboxes. Typical options include Read, Trade, and Withdraw. Koinly only needs Read permissions to function. It needs to see your transaction history to calculate cost basis and generate tax reports. It does not need to place trades or move funds.
If you enable Trade or Withdraw permissions when creating the key, you have given that key the ability to execute those actions. The key itself becomes a bearer token: anyone who possesses it can perform the actions it authorizes. If that key is stored in Koinly's database and your Koinly account is compromised, the attacker now holds a token with withdrawal permissions.
This is not a hypothetical risk. Forum evidence shows users reporting unauthorized account activity following API key creation, though no direct Koinly culpability was established by investigators. The more likely explanation is that users either enabled excessive permissions or that their exchange accounts were compromised through unrelated vectors like phishing or credential reuse.
The safe configuration is simple: when creating an API key for [tax reporting software like Koinly](https://altcoininvestor.com/koinly-vs-coinledger/), enable only Read or View permissions. Never check Trade. Never check Withdraw. If Koinly asks you to enable those permissions, it is a red flag. It does not ask for them, and it should not need them.
Some exchanges allow you to restrict API keys by IP address. If your exchange offers this option, use it. Bind the key to Koinly's known IP ranges if available, or at minimum, do not allow access from arbitrary IP addresses. This adds a layer of protection if the key is stolen: it will only work when used from the approved IP range.
## API Key Expiration and Maintenance
Expired or revoked API keys are the leading cause of Koinly connection errors. Keys do not last forever. They expire, get revoked during exchange security events, or stop working after an exchange API update. When that happens, Koinly can no longer retrieve transaction data, and your tax report becomes incomplete.
Some exchanges automatically expire API keys after a set period, often 90 or 180 days. Others revoke keys following a security incident like a password change or two-factor authentication reset. If you have not logged into Koinly in several months and you see sync errors when you return, the most likely cause is an expired or revoked API key.
The fix is straightforward: generate a new read-only API key on the exchange, delete the old key from Koinly, and add the new one. This is standard maintenance for any platform that uses API-based integrations. It is not a security failure. It is a feature: API keys that stop working after expiration or account changes reduce the window of exposure if a key is compromised without your knowledge.
If you are concerned about API key persistence, treat it like a password: rotate it regularly. Every six months, generate a new key, update Koinly, and revoke the old one. This limits the lifespan of any individual key and reduces the risk that a stolen key remains useful to an attacker over time.
## How Koinly Compares to CoinLedger on Security History
CoinLedger, Koinly's primary competitor, experienced a data breach in 2020 affecting approximately 1,000 users. That breach exposed user email addresses and transaction data stored within CoinLedger's systems. The incident originated within CoinLedger's infrastructure, not through a third-party vendor.
Koinly's 2025 Mixpanel incident exposed email addresses and metadata through a vendor breach, but no transaction history or tax filings were compromised. The structural difference matters: CoinLedger's breach involved core financial data, while Koinly's involved only ancillary metadata shared with an analytics provider.
Both platforms now use read-only API access as the default connection model. Both encrypt API keys before storage. Both hold SOC 2 certifications. The practical security difference between them today is marginal. The historical record shows that both have experienced incidents, and both responded by tightening third-party vendor oversight and expanding security audits.
What this comparison tells you is that no tax platform is breach-proof. The question is not whether a platform has ever been involved in an incident. The question is what data was exposed, how the platform responded, and whether the structural design minimizes the damage if a future breach occurs. On that measure, both Koinly and CoinLedger use non-custodial models that prevent direct theft of user funds, even if account data is compromised.
## What Happens If Koinly Is Breached Directly
If Koinly's primary infrastructure is compromised, the attacker gains access to the data stored in that infrastructure: encrypted API keys, transaction metadata, portfolio balances, and user account information. The encrypted API keys would need to be decrypted to be useful, which requires access to the decryption keys stored elsewhere in the system.
If those decryption keys are also obtained, the attacker now has usable API keys for connected exchanges. If those keys were created with read-only permissions, the attacker can view transaction history but cannot withdraw funds or place trades. If the keys were created with withdrawal permissions enabled, the attacker can initiate withdrawals directly from the user's exchange account.
This is why API permission scopes matter. Read-only keys limit the damage of a breach to privacy loss. Withdrawal-enabled keys turn a data breach into a fund-theft event. The security model you implement when creating the API key determines the worst-case outcome if Koinly is compromised.
For blockchain wallet connections, the risk is different. Koinly only stores public addresses, not private keys. If those addresses are exposed, an attacker can see transaction history and wallet balances, but they cannot move funds. The public address is already public. The breach exposes what is already visible on the blockchain to anyone who knows where to look.
The privacy risk is real. If your Koinly account links your real name to a set of wallet addresses, a breach that exposes that linkage has deanonymized your on-chain activity. For users in jurisdictions with capital controls or restrictive tax enforcement, this privacy loss has material consequences.
## When Koinly's Risk Profile Changes
Koinly's risk profile depends on what you are using it for and where you are using it from. If you are a US or EU taxpayer using Koinly to generate annual tax filings with read-only API keys, the risk is limited to privacy loss and metadata exposure. Your funds cannot be stolen through Koinly because Koinly has no mechanism to move them.
If you are a user in a jurisdiction with capital controls and you are using Koinly to track cross-border stablecoin transfers, the privacy risk is higher. A breach that exposes your name, email, and linked wallet addresses could reveal to local authorities the full extent of your offshore holdings. This is not a Koinly-specific risk. It is a risk inherent in any platform that links your identity to your transaction history.
If you accidentally created API keys with withdrawal permissions and stored them in Koinly, your risk profile has shifted from privacy loss to direct fund theft. The platform itself will not misuse those permissions, but a compromised Koinly account now grants an attacker the ability to drain your exchange balance. The fix is immediate: revoke those keys, generate new read-only keys, and update Koinly with the corrected credentials.
The platform offers a free tier that allows you to import up to 10,000 transactions, connect unlimited wallets and exchanges, and preview your capital gains without payment. You only pay when you download an official tax report. This structure reduces financial risk: you can test the platform, verify its accuracy, and confirm that your API keys are configured correctly before committing to a paid plan.
## The Actual Attack Surface
Koinly's actual attack surface consists of three layers: the API keys you generate and store in the platform, the transaction metadata the platform collects and analyzes, and the third-party vendors the platform integrates for analytics and infrastructure.
The API key layer is the highest-risk if misconfigured. Withdrawal-enabled keys are direct theft vectors. Read-only keys limit exposure to privacy loss. You control this layer entirely when you create the key on the exchange.
The transaction metadata layer is medium risk. If compromised, an attacker gains visibility into your trading history, portfolio composition, and linked wallet addresses. This does not enable fund theft, but it does expose financial activity that you may prefer to keep private. [Users depositing into DeFi protocols or tracking stablecoin income flows](https://altcoininvestor.com/how-to-check-protocol-multisig-before-depositing/) should assume that any data stored in Koinly could become public in a breach scenario.
The third-party vendor layer is the least predictable. The Mixpanel incident demonstrated that data shared with external services can be exposed even when Koinly's primary infrastructure remains secure. Koinly has stated that it is auditing its third-party integrations following the incident, but there is no public list of which vendors currently have access to which data.
What you can control: API permission scopes, the decision to link wallet addresses to your account, and whether you store sensitive transaction history in the platform at all. What you cannot control: Koinly's internal security posture, the security practices of its third-party vendors, and whether AWS itself experiences a breach that exposes customer data.
## When the Risk Is Worth It
The risk is worth it if the alternative is incomplete tax reporting, manual transaction tracking across dozens of wallets and exchanges, or errors in cost-basis calculation that result in overpayment or audit exposure. Koinly automates a process that is otherwise time-intensive and error-prone, particularly for users with activity across multiple chains, DeFi protocols, and centralized platforms.
For users earning [stablecoin yield in high-inflation economies](https://altcoininvestor.com/passive-income-stablecoins/), the ability to accurately track cost basis and generate jurisdiction-specific tax filings is not optional. Tax authorities in Argentina, Turkey, and Nigeria are increasingly scrutinizing crypto income, and manual tracking of hundreds or thousands of transactions is not feasible for most individual users.
The risk is not worth it if you are holding assets in jurisdictions where capital controls make exposure of cross-border transfers a legal liability, or if you have enabled API keys with withdrawal permissions that you have not revoked. In those cases, the downside of a breach exceeds the benefit of automated tax reporting.
For most users, the correct approach is to use Koinly with read-only API keys, link only the wallets and exchanges necessary for tax compliance, and accept that the metadata you share with the platform could become public in a breach. That is the trade-off. The platform reduces operational burden and improves tax accuracy, but it introduces a new privacy and security dependency that did not exist when you were tracking transactions manually.
## The Takeaway
Koinly is safe in the sense that it uses read-only API access, encrypts stored data, and does not hold custody of user funds. It is not safe in the sense that it has already experienced a third-party vendor breach, and any platform that stores API keys and transaction metadata is a potential target for attackers. The risk you face depends on what permissions you grant when you create your API keys, what data you choose to share, and whether you are operating in a jurisdiction where exposure of that data has legal consequences. The platform works as designed when you configure it correctly. The documented incident history shows that vendor risk is real, and that Koinly's response has been to tighten vendor oversight rather than to eliminate third-party integrations entirely. If you are using Koinly, verify your API key permissions today. If any key has withdrawal or trading permissions enabled, revoke it immediately and generate a new read-only key. That single step reduces your attack surface more than any other security measure the platform can implement.
## Frequently Asked Questions
### Can Koinly withdraw funds from my exchange account?
No. Koinly uses read-only API access, which means it can view transaction history but cannot place trades, withdraw funds, or modify your account. However, if you accidentally create an API key with withdrawal permissions enabled when setting up the connection, that key could become a theft vector if your Koinly account is compromised. Always verify that you enable only Read or View permissions when generating API keys for tax software.
### What data did the Mixpanel breach in December 2025 expose?
The Mixpanel breach exposed email addresses, names, rough location data like city or country, and device metadata such as operating system and browser version. Koinly confirmed that no wallet information, transaction history, tax reports, or portfolio data was shared with Mixpanel or compromised in the incident. The breach occurred at a third-party analytics vendor, not within Koinly's primary infrastructure.
### Does Koinly store my private keys or seed phrases?
No. Koinly only requires public wallet addresses to track blockchain transactions. It never asks for private keys or seed phrases because it does not need signing permissions or the ability to move funds. For exchange connections, Koinly stores encrypted API keys that you generate on the exchange, but those keys should be configured as read-only and do not include private key material.
### How often should I rotate my API keys connected to Koinly?
Rotating API keys every six months is a reasonable security practice. Many exchanges automatically expire API keys after 90 to 180 days, and some revoke keys following account security events like password changes. Regular rotation limits the lifespan of any individual key and reduces the window of exposure if a key is compromised without your knowledge. When you rotate, generate a new read-only key on the exchange, update Koinly, and revoke the old key immediately.
### What happens if Koinly is directly breached?
If Koinly's infrastructure is compromised, an attacker could access encrypted API keys, transaction metadata, portfolio balances, and user account information. If decryption keys are also obtained and your API keys were created with withdrawal permissions, an attacker could initiate withdrawals from your exchange account. If your keys are read-only, the breach exposes transaction history and privacy but does not enable fund theft. For blockchain wallets, Koinly only stores public addresses, so a breach would not grant access to move your funds.
Tool mentioned above
Koinly
Koinly imports from 800+ exchanges and wallets and handles the DeFi cases most tools get wrong - rebasing tokens, LP positions, staking rewards.
[Try Koinly](https://koinly.io/?via=F6E2E35A&utm%5Fsource=affiliate)
We may earn a commission if you sign up through this link, at no cost to you. It does not change what gets recommended.
The Weekly Yield Report
You have just examined what access Koinly requires, where that data is stored, and what the Mixpanel breach actually exposed. Those vendor relationships and permission scopes will evolve, and new incidents will be disclosed.
Every Thursday: where crypto yield actually is - stablecoins, liquid staking and DeFi lending, with the risk named next to the rate and what changed since last week.
[Get it free every Thursday](#/portal/signup)
Free. No trade calls, no allocations, no hype. Unsubscribe in one click.
### How To Increase Your Allocation In Lottery-Based Token Sales
URL: https://altcoininvestor.com/how-to-get-more-allocation-token-sale-lottery/
Last updated: 2026-10-11T23:04:20.000Z
## What You Will Accomplish And What You Need First
You will learn how to increase the size of your allocation in oversubscribed token sales that use lottery or proportional distribution systems. This is not a guide to choosing which token sales to enter. This is a guide to improving your odds once you have decided to participate.
The methods documented here work on DAO Maker, Polkastarter, Fjord Foundry, and most tier-based launchpads. The math is different on each platform. The underlying principle is the same: staking more of the platform's native governance token increases your allocation chance or size, but the return per dollar staked drops sharply as you move up tiers.
Before you proceed, you need three things. First, capital to stake in the platform's native token for 7 to 30 days before the sale date. Second, capital to deploy into the sale itself, separate from your staking commitment. Third, a self-custody wallet that has passed KYC on the platform you are using. Most launchpads now block multi-wallet sybil strategies through mandatory identity verification. If you have not completed KYC, you will not receive an allocation even if you win the lottery.
The income mechanism here is straightforward. You secure a larger allocation at the token launch price before public market trading begins. If the token trades above the launch price after listing, your larger allocation translates directly to larger absolute profit. If it trades below launch price, your larger allocation translates to larger absolute loss. This guide optimizes entry size. It does not reduce token selection risk.
## Step One: Understand The Tier System And Calculate Cost Per Percentage Point

Every launchpad publishes a tier structure. Most users read the tier names and the advertised allocation sizes. Almost none calculate the marginal cost per percentage point of win probability.
DAO Maker uses a weighted lottery system. Staking 500 DAO tokens (approximately $1,750 at current prices) gives you a 3% chance of winning a participation slot. Staking 2,000 DAO tokens (approximately $7,000) gives you a 14% chance. Staking 10,000 DAO tokens (approximately $35,000) gives you a 28% chance. The top tier does not guarantee allocation. It improves your lottery odds.
The math per tier breaks down this way. At the lowest tier, you are paying $583 per percentage point of win probability ($1,750 divided by 3%). At the middle tier, you are paying $500 per percentage point ($7,000 divided by 14%). At the top tier, you are paying $1,250 per percentage point ($35,000 divided by 28%). The top tier costs more per unit of probability than the middle tier. The marginal efficiency reverses.
Polkastarter moved from pure first-come-first-served sales to a hybrid model. Users who meet minimum POLS staking requirements enter a lottery to gain access to a guaranteed allocation window. Once whitelisted, you have one hour to claim your maximum allocation. After that hour, unclaimed tokens move to a first-come-first-served pool. Higher POLS balances increase your chance of being selected in the initial lottery, but the platform does not publish the exact weighting formula. This opacity makes it harder to calculate cost per percentage point, but the directional principle holds: more staked POLS equals higher selection probability.
Fjord Foundry allows projects to configure their own sale mechanics. Some use fixed-price sales with demand caps. When total contributions exceed the cap, the platform applies either a lottery or a pro-rata split. Pro-rata distribution is proportional. If you commit $1,000 and total demand is $100,000 for a $10,000 raise, you receive 10% of your commitment ($100 worth of tokens). Lottery distribution gives each participant an equal chance regardless of commitment size. You need to read the specific sale terms for each Fjord project to know which mechanic applies.
The first decision you make is whether the tier upgrade cost is justified by the increase in expected allocation. Expected allocation equals your win probability multiplied by the allocation size if you win. On DAO Maker, if winning a slot gives you $500 worth of tokens, the 3% tier gives you an expected value of $15\. The 14% tier gives you an expected value of $70\. The 28% tier gives you an expected value of $140\. You are locking $1,750, $7,000, or $35,000 for 10 to 15 days to receive those expected values. The opportunity cost of that locked capital matters.
Most users skip this calculation. That is why most users consistently overpay for allocation chances on low-probability tiers.
## Step Two: Time Your Staking Commitment To Meet Lock-Up Requirements

Launchpads require you to stake platform tokens before the snapshot date. The snapshot is when the platform records who is eligible for the upcoming sale. If you stake after the snapshot, you do not qualify. If you unstake before the snapshot, you do not qualify.
DAO Maker snapshots occur 7 to 10 days before the sale date. Polkastarter snapshots occur at varying intervals depending on the project. Fjord Foundry snapshots are project-specific. The information is published in the sale announcement, usually in a Medium post or in the project's official Telegram channel. You need to track it manually. There is no universal calendar.
The most common failure mode here is staking too late. A user sees a sale announced for March 15, stakes on March 10, and discovers the snapshot occurred on March 5\. The stake does not count. The capital is now locked for the minimum unstaking period (often 7 to 14 days) with no allocation chance.
The second most common failure mode is staking in the wrong wallet. You stake from Wallet A, but you completed KYC using Wallet B. The platform does not recognize your stake because the addresses do not match. Always verify that the staking wallet and the KYC wallet are identical before you commit capital.
After you win a lottery slot on DAO Maker, your DAO power locks for 10 days. This is separate from the pre-snapshot staking period. You cannot use the same staked tokens to enter another sale during those 10 days. If you plan to participate in multiple sales in the same month, you need either separate staking capital for each sale or enough time between sales to unlock and re-stake.
Polkastarter's one-hour guaranteed allocation window creates a different timing risk. You must be available to transact during that specific hour. If you are selected in the lottery but do not claim your allocation within 60 minutes, your slot goes to the FCFS pool. Users in time zones misaligned with the sale schedule consistently lose allocations this way. Set alarms. Have your wallet funded and browser open 10 minutes before the window starts.
## Step Three: Evaluate Multi-Wallet Strategy Within KYC Constraints
The theoretical maximum allocation strategy is to create multiple wallets, complete KYC on each, stake the minimum tier requirement in each, and enter the lottery multiple times. In 2019 and 2020, this worked. In 2026, it does not.
Most launchpads now enforce one KYC per individual. DAO Maker, Polkastarter, and Fjord all require identity verification. You cannot verify the same passport or driver's license on multiple wallets. Attempting to do so triggers an automatic disqualification and, on some platforms, a permanent ban.
The remaining multi-wallet opportunity is wallet reuse across different launchpads. You can use the same self-custody address on DAO Maker, Polkastarter, and Fjord simultaneously, as long as each platform's KYC is completed separately. This does not increase your allocation on any single sale, but it does let you enter multiple sales happening on different platforms during the same week without needing separate wallets for each ecosystem.
There is one edge case where multiple wallets still provide value: different chain deployments. Some projects launch on Ethereum and BNB Chain simultaneously using different launchpads for each chain. If Chain A uses Polkastarter and Chain B uses a BNB-native launchpad, you can enter both with different wallets and different KYC processes, because the launchpads do not share data. This happens rarely. When it does, it requires tracking two separate tier systems, two separate snapshot dates, and two separate sale windows. The operational complexity usually outweighs the allocation benefit unless the project is severely oversubscribed.
Do not attempt to bypass KYC using synthetic identities, borrowed documents, or family members' credentials unless those family members are the actual wallet controllers and tax-liable parties. Most jurisdictions treat token sale participation as a taxable event. If you win an allocation using someone else's identity, that person is legally liable for the tax reporting, and you have created a compliance problem with no clean resolution path.
## Step Four: Use Guaranteed Allocation Tiers When The Math Supports It
Some launchpads offer guaranteed allocation tiers at the top end of their staking structure. DAO Maker does not. Its highest tier is still a 28% lottery. Polkastarter's top tiers provide guaranteed access to the one-hour allocation window, but your maximum allocation within that window is capped. Fjord allows projects to configure guaranteed tiers on a case-by-case basis.
Guaranteed allocation is not the same as unlimited allocation. A guaranteed tier might give you certain access to buy $200 worth of tokens. If the project's public market valuation implies that $200 will be worth $600 within the first week, the $200 cap still limits your upside. You are guaranteed to participate, but you are not guaranteed to capture enough allocation to make the tier staking cost worth it.
Calculate the breakeven multiple. If staking for a guaranteed tier requires locking $50,000 worth of tokens for 30 days, and your guaranteed allocation is $500, you need the token to trade at 100x your entry price just to cover the opportunity cost of the locked capital at a 10% annual return. That is not realistic for most launches.
Guaranteed tiers make sense in exactly one scenario: when you have very high conviction on a specific project, the oversubscription ratio is expected to exceed 50:1, and the lottery win rate in lower tiers will be below 5%. In that case, paying the premium for certainty is rational. For everything else, lower tiers with higher cost-efficiency deliver better expected value.
One additional consideration: some platforms, including DAO Maker, use a proportional allocation formula within the guaranteed or winning cohort. The formula is published in their documentation. Guaranteed Allocation equals User's DAO Power multiplied by Total Allocation multiplied by Guaranteed Ratio, divided by Total DAO Power registered. If 1,000 users all stake the exact same amount in the guaranteed tier, they split the allocation equally. If one user stakes 10x more than the others, that user receives a proportionally larger share. This creates an auction dynamic. You are not just competing to get into the tier. You are competing within the tier for relative size.
This is where the math becomes adversarial. If you know 100 other users will stake the minimum for guaranteed tier access, staking 2x the minimum gives you 2x their individual allocation. But if everyone else makes the same calculation and also stakes 2x, you are back to equal splits at higher absolute cost. There is no dominant strategy. You are guessing what others will do. The only reliable edge is information: if you can observe staking balances in real time before the snapshot (some platforms publish this, most do not), you can adjust your stake to be in the top quartile of the tier. If you cannot observe staking balances, you are gambling.
## Step Five: Monitor Oversubscription Ratios And Adjust Expectations
Oversubscription ratio is total demand divided by total supply. If a project raises $500,000 and receives $10 million in commitments, the oversubscription ratio is 20:1\. Your $1,000 commitment will result in a $50 allocation after pro-rata distribution.
Most launchpad users do not check oversubscription ratios until after the sale closes. By then it is too late to adjust. The information that matters is directional demand before the sale starts. You can estimate this by watching Telegram group size, Twitter engagement, and early staking velocity on the launchpad. If a project's Telegram group grows from 5,000 to 50,000 members in the week before the sale, oversubscription will be severe. If the group size is static, demand is likely moderate.
On Polkastarter, unclaimed allocations during the one-hour guaranteed window roll into the FCFS pool. The size of that FCFS pool tells you how many guaranteed-tier winners did not show up. If 30% of the allocation moves to FCFS, it means the lottery was less competitive than expected, and lower-tier participants had a better-than-advertised chance. If 0% moves to FCFS, it means every winner claimed their full amount, and demand was at or above projections.
Fjord publishes live contribution tracking during sales when the project enables it. You can watch the total raised and the number of unique participants in real time. If the sale hits its cap in the first 10 minutes, you know the lottery or pro-rata split will be punishing. If it takes six hours to reach the cap, you know demand was softer and your allocation percentage will be higher.
This monitoring does not increase your allocation directly. It tells you whether your tier choice and commitment size were appropriately calibrated. If you staked $10,000 to enter a sale that ends up 3:1 oversubscribed, you overpaid for your tier. If you staked the minimum and the sale ends up 50:1 oversubscribed, you under-allocated. Neither mistake can be fixed after the snapshot, but both can inform your tier choices for the next sale.
## Common Failure Modes And How To Avoid Them
The first failure mode is gas failure during FCFS windows. Polkastarter's FCFS phase and Fjord's overflow mechanics both depend on transaction speed. If you submit your transaction with default gas settings and 500 other users submit with 2x gas, your transaction confirms 30 seconds later and the allocation is gone. Always set gas to at least the 75th percentile of recent network activity during high-demand windows. Use a gas tracker like Etherscan or BscScan and refresh it 60 seconds before the window opens. Overpaying by $5 in gas is cheaper than missing a $500 allocation.
The second failure mode is vesting surprise. You receive your allocation, the tokens appear in your wallet, and you discover they are locked for 12 months with no early exit. This is not a platform failure. This is you not reading the vesting schedule before committing capital. Every legitimate launchpad publishes vesting terms in the project documentation. Most include a vesting cliff (zero tokens released for 3 to 6 months) followed by linear or monthly unlocks. If you need liquidity within 90 days, do not enter a sale with a six-month cliff. The allocation is worth zero to you during that period.
The third failure mode is refund mechanics on pro-rata oversubscription. You commit $1,000 in stablecoins to a Fjord sale. The sale is 10:1 oversubscribed. You receive $100 worth of tokens and $900 is refunded. Except the refund is not instant. It processes after the sale closes, which may be 48 to 72 hours later. During that time, your $900 is in the sale contract, not in your wallet. If you were planning to use that capital for another trade or sale, you cannot. Always isolate launchpad funds in a temporary allocation separate from your active trading capital. Do not commit money you will need before the refund processes.
The fourth failure mode is forgetting to claim. Some platforms require a manual claim transaction after the sale ends. The tokens do not automatically appear in your wallet. If you do not claim within the claim window (usually 7 to 30 days), you forfeit the allocation. This happens more often than platforms admit. Set a calendar reminder for two days after the sale date to check whether a claim transaction is required. If the platform uses a vesting contract, you may need to claim each unlock tranche separately. Missing one claim does not forfeit the entire allocation, but it does mean you are not receiving tokens you are entitled to until you execute the transaction.
## What To Do Next
You now know how to calculate cost per percentage point of win probability, how to time your staking commitment to meet snapshot requirements, and how to evaluate whether guaranteed tiers justify their capital lock-up cost. The next step is to apply this process to a specific upcoming sale.
Choose a launchpad. Read the tier structure and snapshot date for the next project on the calendar. Calculate your expected allocation at each tier using the win probability and allocation size published by the platform. Compare that expected value to the opportunity cost of locking your capital in the platform's governance token for the required staking period. If the expected value is positive after accounting for lock-up cost, stake at the tier that maximizes expected value per dollar committed. If the expected value is negative at every tier, do not participate.
Track three pieces of information after you commit. First, monitor whether your staking transaction confirmed before the snapshot and whether your wallet shows the correct tier status on the launchpad dashboard. Second, monitor the project's community growth and early staking velocity to estimate oversubscription ratio. Third, set reminders for the sale window, the claim window, and each vesting unlock date if the project uses a multi-tranche release schedule.
Most users treat launchpad participation as a one-time event. The users who consistently secure larger allocations treat it as a recurring process with measurable inputs and outputs. They track which platforms deliver the best cost-per-allocation over a 12-month period. They track which tier strategies produced profitable outcomes and which did not. They adjust their staking strategy based on observed oversubscription patterns, not on advertised hype.
For a broader understanding of how tier mechanics and staking costs compare across platforms, see [Launchpad Allocation Odds: How Staking, Lottery, and Oversubscription Work](https://altcoininvestor.com/how-do-crypto-launchpad-allocations-work/). For strategies that apply when you are deciding whether to enter a sale at all, see [How To Maximize Allocation In Oversubscribed Token Sales](https://altcoininvestor.com/how-to-get-more-allocation-in-ido/). For tools to evaluate whether a token's holder distribution suggests concentration risk before you commit to a sale, see [How To Check Who Really Holds A Token](https://altcoininvestor.com/check-token-holder-distribution/).
## The Takeaway
The math on tier upgrades is public. The cost per percentage point of allocation chance is calculable. Most users do not calculate it. That gives you an edge if you do.
The highest tier is not always the best tier. On DAO Maker, the middle tier at $7,000 delivers better cost-efficiency than the top tier at $35,000\. On Polkastarter, guaranteed access to a one-hour window does not matter if your maximum allocation is capped at $200 and the tier staking cost is $20,000\. Run the numbers for each sale individually. Do not assume the platform's tier labels ("platinum," "diamond," "guaranteed") correspond to optimal value.
Multi-wallet strategies no longer work on platforms with enforced KYC. The opportunity that remains is cross-platform wallet reuse and cross-chain participation when the same project launches on multiple chains through different launchpads. These cases are rare. When they occur, they require tracking multiple snapshot dates and sale windows simultaneously. The operational complexity is high enough that most users will find single-platform participation more practical.
Oversubscription ratio determines your final allocation size more than tier choice does. A 50:1 oversubscribed sale will give you a tiny allocation even if you are in the top tier. A 3:1 oversubscribed sale will give you a meaningful allocation even in the lowest tier. The project's community size, social media engagement, and early staking velocity give you directional signals about oversubscription before the sale starts. Use those signals to calibrate whether participation makes sense at all.
You have just compared three launchpad tier systems with win probabilities ranging from 3% to 28% and capital requirements ranging from $1,750 to $35,000\. Those numbers will be different next month, and the marginal efficiency of each tier will shift as platform tokenomics and user behavior change. The process of calculating cost per percentage point and expected value per tier does not change. Apply it to every sale you evaluate, and you will consistently secure better allocations than users who stake based on tier names instead of tier math.
## Frequently Asked Questions
### What is the difference between lottery allocation and guaranteed allocation on token launchpads?
Lottery allocation gives you a percentage chance of winning a participation slot based on how much of the platform's governance token you stake. Guaranteed allocation means you will receive tokens if you meet the tier requirements, but your maximum allocation size is usually capped. DAO Maker's top tier offers 28% lottery odds, not a guarantee. Polkastarter's guaranteed tiers give you access to a one-hour buying window with a fixed allocation limit. Neither system guarantees unlimited allocation size.
### How do I calculate whether a higher tier is worth the extra staking cost?
Divide the tier staking cost by the win probability percentage to get cost per percentage point. On DAO Maker, the $1,750 tier costs $583 per percentage point (1,750 divided by 3%). The $7,000 tier costs $500 per point (7,000 divided by 14%). The $35,000 tier costs $1,250 per point. The middle tier is the most cost-efficient. Multiply your win probability by the allocation size if you win to get expected value, then compare that to the opportunity cost of locking your capital for 10 to 30 days.
### Can I use multiple wallets to increase my allocation in the same token sale?
Not on platforms that enforce KYC. DAO Maker, Polkastarter, and Fjord all require identity verification, and you cannot verify the same identity on multiple wallets. Attempting to do so results in disqualification. You can use the same wallet across different launchpads for different sales, and you can participate in the same project if it launches on multiple chains using separate launchpads, but each instance requires separate KYC and separate capital.
### What happens if I stake after the snapshot date?
Your stake does not count for that sale. Launchpads take a snapshot of staked balances 7 to 30 days before the sale to determine who qualifies for allocation. If you stake after the snapshot, you are not eligible, and your capital is locked for the platform's minimum unstaking period with no allocation chance. Always verify the snapshot date in the project's official announcement and stake at least 48 hours before that date to account for transaction confirmation delays.
### How do I know if a token sale will be heavily oversubscribed before I commit capital?
Watch the project's Telegram member growth, Twitter engagement, and early staking velocity on the launchpad in the week before the sale. A Telegram group that grows from 5,000 to 50,000 members in seven days signals severe oversubscription. Flat community growth suggests moderate demand. On platforms that publish live staking data, compare current participation to the previous sale on the same platform. If participation is 3x higher, expect oversubscription to be proportionally higher. These are directional signals, not guarantees, but they help calibrate whether your tier choice matches expected demand.
The Weekly Yield Report
You have just compared tier costs from $1,750 to $35,000 and win probabilities from 3% to 28%. Those numbers will change next month as platform mechanics and user behavior shift.
Every Thursday: where crypto yield actually is - stablecoins, liquid staking and DeFi lending, with the risk named next to the rate and what changed since last week.
[Get it free every Thursday](#/portal/signup)
Free. No trade calls, no allocations, no hype. Unsubscribe in one click.
### How To Dollar Cost Average Into Crypto
URL: https://altcoininvestor.com/how-to-dca-crypto/
Last updated: 2026-10-11T22:06:34.000Z
## What Dollar Cost Averaging Is and Why It Underperforms

Dollar-cost averaging is a strategy where you invest a fixed dollar amount into a cryptocurrency on a fixed schedule, regardless of price. You buy more units when prices are low and fewer when prices are high. The average cost per unit trends lower than a single purchase at the cycle peak.
The behavioral benefit is real. You remove timing decisions and avoid putting your entire allocation in at the top. The performance cost is also real.
Lump sum investing beats DCA 66% of the time when you have capital available to deploy immediately. This applies to equities and to crypto. Vanguard documented this across rolling 10-year periods from 1926 to 2011\. The same pattern holds for Bitcoin since 2014.
The reason is structural. Markets trend up over time. Every dollar you delay is a dollar not earning returns during the delay period.
For a 12-month DCA schedule, the underperformance averages 3.7%. For 24 months, 10%. For five years, 17%. The longer you spread your purchases, the worse DCA performs relative to lump sum in a rising market.
A $100 monthly DCA into Bitcoin since January 2014 required $35,700 in total investments and returned approximately $589,000 by early 2026\. That is a 1,648% return. A lump sum of $35,700 invested in January 2014 would have delivered materially higher absolute returns, though the DCA schedule reduced emotional exposure to Bitcoin's 80%+ drawdowns.
The case for DCA is not performance. It is risk management and behavioral control. If you know you will panic-sell during a 50% drawdown, spreading purchases over time keeps you in the market. If you can tolerate volatility and have capital available now, lump sum wins most of the time.
## When DCA Outperforms: Valuation-Based Entry Rules
DCA does not always lose. It wins when you are entering at elevated valuations and prices subsequently correct.
Bitcoin power law research provides a quantifiable signal. The power law trend is a long-term regression line that tracks Bitcoin's price growth relative to time since genesis. When Bitcoin trades below 1.0× the trend, lump sum wins 89-100% of historical cases. Below 1.25×, lump sum wins 100% of the time.
Above 1.3× trend, DCA wins the majority of cases. The higher above trend you enter, the more likely a correction occurs during your DCA schedule, reducing your average cost.
As of early 2026, Bitcoin trades at approximately 0.55× power law trend. At this valuation, historical data supports immediate lump sum deployment over any DCA schedule.
The 2018 crypto winter is the clearest historical example of DCA outperformance. Bitcoin fell from $20,000 in December 2017 to $3,200 by December 2018, an 84% decline. Investors who dollar-cost averaged throughout 2018 and 2019 accumulated more Bitcoin at lower average prices than anyone who made a single purchase before the correction began.
The post-COVID recovery from March to December 2020 illustrates the opposite case. Bitcoin gained over 300% during that period. Lump sum investors captured the entire rally from the beginning. DCA investors earned excellent returns but missed the early recovery gains by design.
The rule: deploy lump sum below 1.0× trend. Spread purchases above 1.3× trend. Between 1.0× and 1.3×, your decision depends on risk tolerance and whether you can withstand near-term volatility without selling.
## Choosing Frequency: Daily, Weekly, or Monthly
The returns from daily, weekly, and monthly DCA schedules are nearly identical over multi-year periods. A four-year backtest showed no material performance difference between frequencies.
The decision is about fees, not returns.
Every purchase incurs a transaction fee. Daily purchases incur 30× the fee events of monthly purchases. If you are investing $100 per month, that is one fee event. If you split it into $3.33 daily purchases, that is 30 fee events, each subject to the exchange's minimum fee or percentage charge.
Coinbase charges $0.99 for orders under $10, $1.49 for $10-$25, $1.99 for $25-$50, and $2.99 for $50-$200\. A $100 monthly purchase incurs a $2.99 fee (2.99%). Four $25 weekly purchases incur $5.96 in fees (5.96%). Daily $3.33 purchases would incur $29.70 in fees (29.7%).
Monthly is the dominant choice for most retail investors. It minimizes fees, aligns with paycheck schedules, and delivers the same long-term cost averaging as higher-frequency schedules.
Weekly makes sense if your income arrives weekly and you want to automate the deposit immediately. It still incurs 4× the fee events of monthly, but the fee drag is tolerable if you are investing more than $200 per month and using an exchange with percentage-based fees instead of flat minimums.
Daily is only rational for investors deploying large sums where the percentage fee is low and the absolute dollar amount per trade is high enough to avoid minimum fee triggers. For most retail allocators, daily DCA is a fee donation to the exchange.
## Platform Selection: Fees and Automation Features
Three platforms dominate DCA automation: Coinbase, Kraken, and Binance. The fee structures are different enough to change which platform makes sense at different investment sizes.
Coinbase is the simplest to use and supports recurring buys across 270+ assets. The fee is 1.49% per transaction for recurring purchases. For amounts under $200, Coinbase also applies flat minimum fees: $0.99 for orders under $10, $1.49 for $10-$25, $1.99 for $25-$50, and $2.99 for $50-$200\. If you are investing less than $200 per month, Coinbase is the easiest onramp despite the higher fee.
Kraken supports 530+ coins and 1,270+ trading pairs. The recurring buy feature charges 1% for instant buy transactions, lower than Coinbase's 1.49%. For investors who want to use limit orders instead of market buys, Kraken Pro offers maker fees starting at 0.25% and taker fees at 0.40%. This is the lowest-cost option for investors deploying $200-$2,000 per month who are willing to set up limit orders manually or semi-manually.
Binance offers the lowest effective fees for automation. Auto-Invest recurring buys cost approximately 0.1% on spot markets. Binance supports 630+ coins, pre-built portfolio allocations, and integrated staking for assets like ETH and SOL. If you are comfortable with Binance's regulatory posture and are investing more than $500 per month, the fee advantage compounds over time.
Fee comparison on a $500 monthly DCA over one year:
- Coinbase: $89.40 in fees (1.49% × $6,000)
- Kraken instant buy: $60 in fees (1% × $6,000)
- Kraken Pro (manual limit orders): $15-$24 in fees (0.25%-0.40% × $6,000)
- Binance Auto-Invest: $6 in fees (0.1% × $6,000)
The gap widens at higher amounts. At $2,000 per month over one year, Coinbase costs $357.60 in fees. Binance costs $24.
The trade-off is regulatory clarity and ease of use. Coinbase is a U.S. publicly traded company with full regulatory compliance. Binance operates in a more complex jurisdictional environment. For beginners prioritizing simplicity, Coinbase is worth the fee premium. For cost-sensitive investors with larger allocations, Kraken Pro or Binance are the rational choices.
Both Kraken and Coinbase support auto-staking for accumulated assets. If you are DCA-ing into ETH or SOL, enabling auto-staking adds yield on top of your accumulation strategy. Binance integrates staking directly into its Auto-Invest product.
## Asset Selection: Bitcoin, Ethereum, and Altcoins
Bitcoin is the most common DCA target for one reason: it has the longest history of recovering from drawdowns and returning to new all-time highs. Every investor who DCA-ed into Bitcoin for at least four years and held is currently in profit, regardless of when they started.
Ethereum is the second-most common DCA target. It has a shorter history than Bitcoin but a similar recovery pattern. Both assets have survived multiple 70-80% drawdowns and returned to new highs within 2-4 years.
Altcoins introduce different risk. Many altcoins that ranked in the top 20 by market cap in 2017 no longer exist or trade at 90%+ below their all-time highs. DCA into an altcoin that never recovers results in permanent capital loss.
The DCA framework works best for assets with established recovery patterns. If you DCA into an altcoin, you are making two separate bets: one on the asset's long-term viability and one on the timing benefit of spreading purchases. If the asset fails, the timing strategy is irrelevant.
For most investors, a 70-80% allocation to Bitcoin and Ethereum, with 20-30% allocated to 2-4 high-conviction altcoins, balances the risk. The core BTC/ETH allocation provides the baseline exposure to crypto's growth. The altcoin allocation captures upside if your thesis is correct.
DCA works for both. You reduce the risk of entering the altcoin allocation at the cycle peak, and you reduce the behavioral temptation to sell the Bitcoin allocation during a drawdown.
## Tax Implications: Capital Gains, Wash Sales, and Holding Period Resets
Every DCA purchase creates a separate tax lot with its own cost basis and holding period. When you sell, you must track which lots you are selling to calculate capital gains correctly.
If you hold the asset for more than one year before selling, you pay long-term capital gains tax at 0%, 15%, or 20%, depending on your income bracket. If you sell within one year, you pay short-term capital gains tax at your ordinary income rate, which ranges from 10% to 37%.
DCA creates a rolling series of holding periods. If you buy Bitcoin on the first of every month for 12 months and then sell half your position, the lots you sell determine your tax rate. If you sell the oldest lots first (FIFO method), those lots will have the longest holding period and the best chance of qualifying for long-term rates. If you sell the most recent lots (LIFO method), you may trigger short-term rates.
Crypto is currently exempt from the wash sale rule that applies to stocks and securities. The wash sale rule prevents you from selling an asset at a loss and immediately repurchasing it to harvest the tax loss. For stocks, if you sell at a loss and rebuy within 30 days, the loss is disallowed.
For crypto, the wash sale rule does not apply as of 2026\. You can sell Bitcoin at a loss, claim the loss against other capital gains, and immediately rebuy Bitcoin without penalty. This creates a tax-loss harvesting opportunity during bear markets.
Pending legislation could change this. The Lummis bill proposes extending the wash sale rule to cryptocurrency. If it passes, the current tax-loss harvesting advantage disappears. Until then, it remains a tool for reducing taxable gains in down years.
One caution: the IRS applies the economic substance doctrine to disallow transactions with no purpose beyond tax avoidance. Selling and immediately rebuying the same amount of the same asset may lack economic substance. To reduce this risk, vary the timing or amount slightly when harvesting losses. Sell on Tuesday, rebuy on Wednesday. Sell 1.0 BTC, rebuy 0.98 BTC. The doctrine is subjective, but demonstrating some economic difference reduces audit risk.
Tax reporting for 2025 requires brokers to report gross proceeds from crypto sales. Cost basis reporting is optional for 2025 but will become mandatory in future years. If your exchange does not report cost basis, you are responsible for tracking it yourself. [Form 8949](https://altcoininvestor.com/crypto-tax-form-8949/) is where you reconcile the exchange's 1099 data with your own cost basis records.
## Behavioral Discipline: Why DCA Works Despite Lower Returns
The performance data says lump sum wins. The behavioral data says most investors cannot execute lump sum correctly.
Investors who deploy lump sum at market peaks often panic-sell during drawdowns. They lock in losses and miss the recovery. DCA forces continued buying through the drawdown, which lowers the average cost and increases the position size when prices are lowest.
The 2018 crypto winter is the test case. Bitcoin fell 84% over 12 months. Lump sum investors who bought in December 2017 watched their position lose more than 80% of its value. Many sold during the drawdown. DCA investors who continued buying throughout 2018 accumulated Bitcoin between $6,000 and $3,200, lowering their average cost with every purchase.
By December 2020, Bitcoin had returned to $20,000\. DCA investors who stuck to the schedule were in profit. Lump sum investors who held were back to breakeven. Lump sum investors who sold during the drawdown never recovered.
DCA only works if you continue buying through the drawdown. If you stop the schedule when prices fall, you lose the primary benefit of the strategy. The lowest prices are when DCA accumulates the most units. Stopping during a bear market converts DCA into a poorly timed lump sum strategy.
The discipline required is not intuitive. It feels wrong to keep buying an asset that is falling. Every month you deploy capital into a position that is underwater. The emotional signal is to stop. The math says keep going.
This is why DCA works for risk-averse investors despite underperforming lump sum on average. It structures the decision so that the correct action (keep buying) is automatic, not discretionary. You are less likely to make the behavioral mistake of stopping during the drawdown because the schedule removes the decision.
## When to Stop DCA and Switch to Lump Sum
DCA is not a permanent strategy. It is a tool for entering a position when you have limited capital or elevated uncertainty about near-term price direction.
Once you have built a core position, additional capital should be deployed based on valuation, not schedule.
If Bitcoin is trading at 0.55× power law trend and you receive a $10,000 bonus, deploy it immediately. The historical data supports lump sum at that valuation. Spreading the $10,000 over 10 months introduces unnecessary underperformance risk.
If Bitcoin is trading at 1.5× trend, spread the $10,000 over several months. The elevated valuation increases the probability of a correction, and DCA reduces your risk of entering entirely at the peak.
The transition from DCA to lump sum is not calendar-based. It is valuation-based. Use power law trend, on-chain metrics, or your own fundamental analysis to decide whether current prices justify immediate deployment or delayed deployment.
For ongoing income (salary, freelance revenue), DCA remains the default. You receive capital monthly, and you deploy it monthly. There is no lump sum option because the capital does not arrive as a lump sum.
For windfall capital (bonus, inheritance, sale of an asset), valuation determines the deployment schedule. Low valuation means lump sum. High valuation means DCA.
## Common Mistakes That Destroy DCA Returns
Stopping during drawdowns is the most common failure mode. The entire point of DCA is to keep buying when prices fall. If you stop, you convert the strategy into lump sum at the wrong time.
Increasing purchase size during rallies and decreasing during corrections is the second most common mistake. DCA requires fixed dollar amounts. If you invest $100 per month during a bear market and $500 per month during a bull market, you are doing the opposite of what the strategy is designed to accomplish.
Choosing the wrong platform and paying excessive fees is the third. A 1.49% fee on Coinbase versus a 0.1% fee on Binance is an 89 basis point drag on returns every month. Over five years, that fee difference compounds to thousands of dollars on a $500 monthly DCA schedule.
DCA-ing into altcoins without understanding recovery risk is the fourth. Bitcoin and Ethereum have recovered from every historical drawdown. Most altcoins have not. If you DCA into an altcoin that falls 90% and never recovers, you have converted a timing strategy into a permanent loss strategy.
Ignoring tax-lot tracking is the fifth. When you eventually sell, you will need to report cost basis for every lot. If you have been DCA-ing for three years and have 36 separate purchases, you have 36 tax lots. Failing to track them creates a reporting problem when you file taxes. Exchanges are beginning to report cost basis, but the data is not always complete. [Track your own records](https://altcoininvestor.com/crypto-tax-form-8949/) as a backup.
## What to Do Next
If you are starting a DCA schedule, choose the platform first. For investments under $200 per month, Coinbase is simplest. For $200-$2,000 per month, Kraken Pro offers the best fee-to-usability ratio. For more than $2,000 per month, Binance's Auto-Invest feature delivers the lowest fees.
Set the frequency to monthly unless you have a specific reason to choose weekly. The returns are identical, and monthly minimizes fee drag.
Allocate 70-80% to Bitcoin and Ethereum if you are building a core position. Reserve 20-30% for altcoins only if you have a high-conviction thesis and understand that most altcoins never recover from bear market drawdowns.
Check Bitcoin's power law trend before deploying windfall capital. Below 1.0× trend, deploy lump sum. Above 1.3× trend, spread purchases over 3-6 months. Between 1.0× and 1.3×, your decision depends on risk tolerance.
Track every purchase as a separate tax lot. Use a spreadsheet or a portfolio tracker that records date, amount, price, and exchange. When you sell, you will need this data to calculate capital gains correctly.
Do not stop during drawdowns. The lowest prices are when DCA accumulates the most units. If you stop buying when prices fall, you lose the primary benefit of the strategy.
Consider enabling auto-staking on platforms that support it. If you are DCA-ing into ETH, SOL, or other proof-of-stake assets, staking adds yield on top of your accumulation strategy. Kraken, Coinbase, and Binance all support auto-staking for select assets.
Review your DCA schedule every six months. If your income has increased, increase the monthly amount. If your conviction in a specific altcoin has changed, rotate the allocation. DCA is a framework, not a rigid rule. Adjust it as your circumstances and the market environment change.
## The Takeaway
Dollar-cost averaging underperforms lump sum in two-thirds of historical cases, but it remains the correct strategy for most retail investors because it removes the behavioral mistakes that destroy returns during drawdowns. The math favors lump sum. The psychology favors DCA. Choose the strategy you will actually execute through an 80% correction, because the strategy you abandon halfway through is the one that costs you the most.
## Frequently Asked Questions
### Does dollar-cost averaging into crypto outperform lump sum investing?
No. Lump sum investing outperforms DCA 66% of the time across historical backtests in both equities and crypto. For a 12-month DCA schedule, the average underperformance is 3.7%. For 24 months, 10%. For five years, 17%. The longer you spread purchases, the worse DCA performs in a rising market. DCA wins when you enter at elevated valuations and prices subsequently correct. Above 1.3× Bitcoin power law trend, DCA wins the majority of cases. Below 1.0× trend, lump sum wins 89-100% of the time.
### How often should I dollar-cost average into crypto?
Monthly is optimal for most investors. Daily, weekly, and monthly DCA schedules deliver nearly identical returns over multi-year periods, but monthly minimizes transaction fees. A $100 monthly purchase on Coinbase incurs a $2.99 fee (2.99%). Four $25 weekly purchases incur $5.96 in fees (5.96%). Daily $3.33 purchases incur $29.70 in fees (29.7%). Monthly also aligns with paycheck schedules and reduces the number of tax lots you must track for capital gains reporting.
### Which platform has the lowest fees for crypto DCA?
Binance offers the lowest effective fees at approximately 0.1% for Auto-Invest recurring buys. Kraken Pro charges 0.25% maker and 0.40% taker fees for manual limit orders. Kraken instant buy charges 1%. Coinbase charges 1.49% per recurring transaction. On a $500 monthly DCA over one year, Coinbase costs $89.40 in fees, Kraken instant buy costs $60, Kraken Pro costs $15-$24, and Binance costs $6\. For investments under $200 per month, Coinbase is simplest despite higher fees. For larger amounts, Kraken Pro or Binance are more cost-effective.
### How does crypto DCA affect my taxes?
Every DCA purchase creates a separate tax lot with its own cost basis and holding period. When you sell, you pay long-term capital gains tax (0-20%) if you held for more than one year, or short-term rates (10-37%) if you held less than one year. Crypto is currently exempt from the wash sale rule, allowing you to sell at a loss and immediately rebuy to harvest tax losses. Pending legislation may change this. Track every purchase date, amount, and price to calculate cost basis correctly when you sell.
### When should I stop DCA and deploy lump sum instead?
Use valuation to decide. Below 1.0× Bitcoin power law trend, historical data supports immediate lump sum deployment. Above 1.3× trend, spread purchases over 3-6 months. As of early 2026, Bitcoin trades at approximately 0.55× trend, favoring lump sum for windfall capital. For ongoing income like salary, continue monthly DCA regardless of valuation because the capital arrives monthly. The transition from DCA to lump sum is valuation-based, not calendar-based. Low valuation means deploy immediately. High valuation means spread purchases over time.
The Weekly Yield Report
You just read the frequency, platform, and valuation data for structuring DCA entries in 2026\. Those fee tiers and Bitcoin trend levels will shift by next quarter.
Every Thursday: where crypto yield actually is - stablecoins, liquid staking and DeFi lending, with the risk named next to the rate and what changed since last week.
[Get it free every Thursday](#/portal/signup)
Free. No trade calls, no allocations, no hype. Unsubscribe in one click.
### Crypto Trading Bots For Yield Position Rebalancing: When Automation Helps And When It Destroys Returns
URL: https://altcoininvestor.com/crypto-trading-bot-yield-rebalancing/
Last updated: 2026-10-11T21:06:40.000Z
## The Question: Can Automation Improve Yield Position Management

Yield allocators face a specific automation question: can a [crypto trading bot](https://altcoininvestor.com/crypto-trading-bot/) monitor rates across protocols, rebalance positions faster than manual management, and capture spread or timing advantages that justify the added cost? The infrastructure exists. DeFi Saver reports $1.5 billion under automation, primarily for liquidation protection. Yearn and Beefy automate compounding across thousands of positions. Commercial bots promise rate monitoring, auto-rebalancing, and DCA accumulation for active yield positions.
The reality is simpler and narrower than the marketing suggests. Most automation fails because fee drag, slippage, and execution latency erase any timing advantage gained. A retail bot executing 50 trades daily on a $200 balance at 0.25% fees and 0.15% slippage per round trip incurs over $4 in daily costs, leaving net returns close to break-even before subscription fees or gas. Approximately 30 to 50 percent of a strategy's theoretical edge disappears when running live due to slippage, partial fills, exchange latency, and shifting market microstructure.
Ninety percent of bot automation for yield positions destroys value. The remaining ten percent - alerts, simple threshold-based rebalancing, gas optimization, and execution splitting - helps under specific conditions. This article identifies what works, what fails, and the cost-benefit threshold where automation makes sense.
## How Most Automation Destroys Returns

Fee drag compounds faster than most yield allocators expect. Exchange fees for spot trades range from 0.01% on Bitget to 0.40% maker and 0.60% taker on Coinbase, with most retail platforms charging 0.1% to 0.3% per side. Slippage on retail crypto orders averages 0.1% to 0.6% per trade under normal conditions and exceeds 1.5% during volatility. A round-trip trade - selling one asset and buying another - incurs double fees and double slippage.
A [grid trading bot](https://altcoininvestor.com/how-grid-trading-bots-work/) pulling one percent daily edge from range trading can lose 0.8% of that to exchange fees, slippage, and funding costs, leaving near-zero net return. Add subscription fees of $24 to $99 monthly and the math breaks for accounts below $5,000\. One published case showed a bot managing average 11% 30-day returns on Bitsgap in late 2025, but real returns after fees and slippage were closer to 0.2% daily - roughly six percent monthly, a meaningful gap from headline numbers.
Arbitrage and MEV bots face even harsher economics. Competitive MEV bots burn 80 to 90 percent of gross profit in priority gas fees bidding against each other for the same opportunities. Ethereum saw over $600 million in MEV extraction annually, with minimal profit left for individual operators. A slower bot loses the gas fee even when the opportunity vanishes - one millisecond of latency can cost you the trade while you still pay network fees. Bot accounts on Solana exhibited a transaction failure rate of 58.43%, far higher than human accounts. When an arbitrage bot bids thousands in gas to secure a trade but a faster bot executes one millisecond earlier, the slower bot still pays the network fee, resulting in total loss with zero profit.
DCA bots multiply transaction costs over time. Daily DCA generates more transactions than weekly or monthly intervals, multiplying exchange fees proportionally. At 0.2% per round trip, 50 daily trades on a $200 account equal $4 per day in costs. In the US, DCA bots cost anywhere from free to roughly $50 per month depending on the platform, plus exchange trading fees of about 0.1% to 0.6% per fill. The global DCA bot market was valued at $55.7 million in 2024 and is projected to reach $115 million by 2031, at a CAGR of 7.3%, but the economics favor exchanges and bot providers, not end users running small accounts.
Liquidation bot economics do not favor retail. Liquidation bots - keepers - are profitable at scale due to MEV ecosystem access and liquidation bonuses paid by lending protocols. In Aave V3, when health factor drops below 1.0, liquidators repay up to 50% of debt or 100% for stablecoins and receive the corresponding collateral plus a liquidation bonus. Aave witnessed $27 million in forced liquidations in late 2025 triggered by protocol configuration flaws. Retail operators attempting to run liquidation bots face infrastructure costs, gas bidding wars, and extreme execution latency that makes the strategy unviable. DeFi Saver's value is in liquidation protection - alerting users and helping them avoid liquidation - not in executing liquidations for profit.
## The Ten Percent That Works
Alerts beat auto-execution in nearly every yield context. Simple threshold monitoring - health factor below 1.1, yield rate drops by two percent, TVL falls 20% in 24 hours - with human approval beats fully autonomous trading. DeFi Saver's core value is alerts plus semi-automated rebalancing, not blind robo-execution. Users configure a health factor threshold, the system monitors the position 24/7, and when the threshold is breached, the system can execute a single pre-approved action like repaying debt or adding collateral. The automation is narrow, the decision tree is simple, and the cost is predictable.
Gas optimization for compound events provides real savings when done correctly. Yearn uses Keep3r bots to trigger harvest calls on its strategies, with the bot network monitoring gas costs against expected yield and only harvesting when profitable. Autonoly's gas fee predictor saves approximately $18,000 per month by scheduling transactions during low-congestion windows. This works because it optimizes a single decision point - when to execute, not how much or what to trade. The bot does not need to predict market direction or beat other traders to an opportunity. It simply waits for the right moment based on network conditions.
Execution splitting and order routing reduce slippage on large rebalancing trades. Splitting a $10,000 position move into ten $1,000 fills, using limit orders instead of market orders, and routing through Flashbots Protect - which returns 90% of MEV captured back to users - can reduce slippage by 0.3% to 0.5% per trade. For yield allocators moving capital between protocols, this is meaningful. A bot that monitors multiple DEX pools, calculates optimal routing, and splits orders across venues provides value when the position size justifies the added complexity. Below $5,000, manual execution with limit orders typically performs better.
Liquidation protection automation works when it executes simple threshold-based actions non-custodially. Tools like DeFi Saver's auto-repay and auto-boost execute when health factor hits a specific threshold - typically 1.15 to avoid the liquidation zone at 1.0\. The action is pre-approved, the cost is known, and the bot does not compete in MEV auctions. Users deposit collateral into a smart contract that monitors their position and executes repayment or collateral addition when needed. This is fundamentally different from trying to profit from liquidating other users' positions.
DCA for long-term accumulation has predictable costs and enforces discipline. Fixed $100 weekly DCA underperforms lump-sum investment in bull markets but provides three specific benefits: it enforces regular capital deployment, it on-ramps capital over time for users who cannot deploy a lump sum, and it has predictable transaction costs. Volatility-adaptive DCA - doubling the purchase amount on a 20% drawdown - can lower cost basis by three to five percent versus fixed-interval DCA. One published backtest showed a cost basis improvement of $770 savings versus lump sum over a multi-month accumulation period, though transaction cost drawback must be netted against this.
Rate monitoring and [yield hopping](https://altcoininvestor.com/when-to-exit-defi-position/) reduce manual overhead when rate differentials justify the gas and slippage cost. Bots that monitor Aave, Compound, and MakerDAO rates hourly and shift capital to the highest-yield protocol can lift APY by 0.5% to 2% if rates swing by more than two percent between protocols. The cost is slippage plus gas - typically $5 to $30 depending on network congestion and position size. For positions above $10,000, this can justify one or two moves per month. Below that threshold, the cost exceeds the benefit.
## When Automation Makes Economic Sense
The cost-benefit threshold for yield automation depends on position size, rebalancing frequency, and the income mechanic being optimized. For positions below $5,000, manual management with simple alerts beats bot automation in nearly every scenario. The subscription cost, fee drag, and slippage exceed any timing advantage gained. For positions between $5,000 and $20,000, narrow automation - gas scheduling, execution splitting, threshold alerts - begins to justify the added cost if rebalancing frequency is low and the rate differential between protocols is persistently above two percent.
Above $20,000, automation can provide net value if configured correctly. A semi-automated rebalancing bot that monitors rates, alerts the user when differentials exceed thresholds, and splits execution into multiple fills with gas optimization can save 0.5% to 1.5% annually after costs. One 2024 backtest showed static yield farming yielding 8.2% annualized return versus 13.7% with AI auto-rebalancing and lower volatility, though this is a single cited case and should be viewed as upper-bound potential rather than typical outcome.
Impermanent loss automation does not remove the underlying risk. Beefy's concentrated liquidity manager resets range every six hours, takes up to 9.5% of trading fees, and remains exposed to impermanent loss and out-of-range risk. A study of 17 Uniswap v3 pools found $260.1 million of impermanent loss against $199.3 million of fees over the sample period. Automation does not remove impermanent loss, and published research shows many liquidity providers lose money against simply holding. Autonoly reports 78% cost reduction through intelligent liquidity pool rebalancing, but the baseline comparison matters - rebalancing an already unprofitable LP position more efficiently still results in a net loss.
Skilled manual management still outperforms commercial bots for most yield allocators. The edge in yield position management comes from understanding protocol mechanics, monitoring TVL and audit status, recognizing when yield spikes indicate unsustainable incentive programs, and exiting positions before risk materializes. These decisions require context and judgment that current automation does not replicate. A bot can monitor health factor and execute threshold-based actions. It cannot evaluate whether a yield spike from 8% to 18% is driven by sustainable fee revenue or temporary liquidity mining that will end in 30 days.
## What To Use And What To Avoid
For liquidation protection, DeFi Saver provides the most mature infrastructure for monitoring health factor across Aave, Compound, and MakerDAO positions. Users configure thresholds and pre-approve actions. The system monitors 24/7 and executes only when needed. The cost is gas plus a small protocol fee. This is substantially cheaper than getting liquidated and paying liquidation bonuses of 5% to 10%.
For gas optimization on compounding or rebalancing, Yearn's vault infrastructure and Autonoly's scheduling tools provide the best economics for users who want set-and-forget automation. Yearn's Keep3r network ensures harvest calls only execute when profitable after gas costs. Autonoly's gas predictor schedules transactions during low-congestion windows. Both work because they optimize execution timing rather than trying to predict market direction.
For DCA accumulation, choose interval length based on total capital and transaction cost. Weekly DCA at 0.1% to 0.2% per trade makes sense for allocators deploying $500 or more per week. Daily DCA multiplies transaction costs without improving cost basis materially unless deploying over $200 per day. Monthly DCA reduces transaction frequency but increases timing risk. [Free DCA tools](https://altcoininvestor.com/best-free-crypto-trading-bots/) from Pionex or exchange-native solutions like Coinbase's recurring buy feature avoid subscription fees, leaving only exchange fees and slippage as costs.
For rate monitoring and yield hopping, build your own alert system using on-chain data from DefiLlama or DeFi protocols' public APIs rather than paying for commercial bot subscriptions. A simple script that checks rates hourly and sends a notification when the differential exceeds two percent costs nothing and avoids the execution risk of fully automated rebalancing. Manual execution with limit orders and Flashbots Protect routing provides better fills than most commercial bots.
Avoid commercial arbitrage and MEV bots marketed to retail users. The infrastructure advantage required to compete in MEV extraction - sub-100ms node latency, private RPC endpoints, Flashbots integration, capital for gas bidding wars - exceeds what retail operators can deploy. One quantitative trading operation discovered 400ms of node latency was costing them 40% of potential arbitrage captures. After switching to faster infrastructure, their success rate jumped from 60 to 85 profitable trades per hundred attempts. A Rust-based MEV operator reported burning 80 to 90 percent of gross profit in priority gas auctions against other bots. The economics do not work at retail scale.
Avoid fully automated rebalancing bots that execute without human approval. The decision to move capital between protocols should incorporate context that bots do not have - protocol audit status, team activity, TVL trends, governance risk, smart contract upgrade risk. A bot that automatically shifts $10,000 from Aave to a newer lending protocol offering two percent higher APY cannot evaluate whether that protocol has been audited, whether the yield is sustainable, or whether the TVL concentration presents exit liquidity risk.
## The Takeaway
Automation for yield positions works in a narrow band: threshold alerts, gas optimization, execution splitting, and simple liquidation protection. Everything else - commercial arbitrage bots, fully automated rebalancing, high-frequency DCA, MEV extraction tools marketed to retail - destroys returns through fee drag, slippage, and execution failures that exceed any theoretical edge. The useful ten percent of automation saves 0.5% to 1.5% annually on positions above $20,000 when configured correctly. Below that threshold, manual management with free alert tools outperforms commercial bots after costs. The path to better yield outcomes is understanding protocol economics and position risk, not outsourcing decisions to software that cannot evaluate context. Check your current bot's transaction history, net fee and slippage costs against gross returns, and calculate whether you would have done better buying once and holding. Most allocators would.
## Frequently Asked Questions
### Do crypto trading bots work for yield position rebalancing?
Most do not. Commercial bots bleed returns through fee drag, slippage, and execution latency that exceed any timing advantage gained. Approximately 30 to 50 percent of a strategy's theoretical edge disappears when running live. The ten percent of automation that works - threshold alerts, gas optimization, execution splitting - provides value only on positions above $20,000 when configured for narrow, pre-approved actions rather than fully autonomous trading.
### What are the biggest hidden costs of yield rebalancing bots?
Fee drag and slippage compound faster than expected. A round-trip rebalancing trade incurs exchange fees of 0.1% to 0.6% per side plus slippage averaging 0.1% to 0.6% under normal conditions. A bot executing 50 trades daily on a $200 balance at 0.25% fees and 0.15% slippage per round trip incurs over $4 in daily costs. Add $24 to $99 monthly subscription fees and the math breaks for accounts below $5,000\. Gas costs on Ethereum add $5 to $30 per transaction depending on network congestion.
### When does DCA automation make sense for yield accumulation?
DCA automation justifies its cost when deploying $500 or more weekly at 0.1% to 0.2% transaction fees. Daily DCA multiplies costs without materially improving cost basis unless deploying over $200 per day. Use exchange-native recurring buy features or free tools like Pionex to avoid subscription fees. Volatility-adaptive DCA - doubling purchases on 20% drawdowns - can lower cost basis by three to five percent versus fixed intervals, but transaction costs must be netted against this benefit.
### Should I use a bot for liquidation protection on DeFi lending positions?
Yes, but only for threshold-based liquidation protection, not for executing liquidations. DeFi Saver monitors health factor 24/7 and executes pre-approved actions like debt repayment or collateral addition when your threshold is breached. This is substantially cheaper than paying 5% to 10% liquidation bonuses. Running a bot to liquidate other users' positions is not viable for retail due to infrastructure costs, gas bidding wars, and MEV competition where 80 to 90 percent of gross profit is burned in priority fees.
### What type of yield automation actually improves returns?
Gas optimization, execution splitting, and alert-based rebalancing provide measurable value on positions above $10,000\. Yearn's Keep3r bots harvest only when profitable after gas costs. Splitting large rebalances into multiple fills with limit orders and Flashbots routing reduces slippage by 0.3% to 0.5% per trade. Rate monitoring that alerts when protocol differentials exceed two percent lets you manually execute rebalancing with better fills than fully automated systems. Build your own alerts using DefiLlama or protocol APIs rather than paying for commercial subscriptions.
The Weekly Yield Report
You have just evaluated fee drag, slippage costs, and the narrow band where yield automation works. Those thresholds shift as gas prices and protocol rates change weekly.
Every Thursday: where crypto yield actually is - stablecoins, liquid staking and DeFi lending, with the risk named next to the rate and what changed since last week.
[Get it free every Thursday](#/portal/signup)
Free. No trade calls, no allocations, no hype. Unsubscribe in one click.
### Decentralized Exchanges: Liquidity, Slippage, and Entry
URL: https://altcoininvestor.com/decentralized-exchanges/
Last updated: 2026-10-11T19:03:58.000Z
## The Question: When Does DEX Execution Cost You Yield?

You are moving capital into a yield position. You need to swap USDC for USDT to enter a Curve pool, or buy UNI to stake in a governance vault, or convert ETH to stETH for liquid staking exposure. The swap itself is not the yield surface. It is the cost of entry. Execute it poorly and you erase days or weeks of the income you are trying to capture.
Decentralized exchanges handle this capital movement without custody, but execution quality varies dramatically by asset pair, trade size, and protocol choice. Uniswap, Curve, Balancer, and Jupiter each optimize for different liquidity profiles. The wrong choice costs you 0.5% to 4% in slippage, MEV extraction, and price impact before you deploy a single dollar into yield. The right choice saves you that cost and gets you into position faster than any [centralized exchange](https://altcoininvestor.com/best-crypto-exchanges/) can clear the withdrawal.
This piece covers how DEX execution actually works for yield position entry and exit, the liquidity depth thresholds where execution quality breaks down, the specific trade size ranges where CEX becomes cheaper, and the stablecoin swap mechanics where DEX wins every time. If you are treating DeFi as an income surface rather than an ideology, execution cost is the first variable to control.
## How Automated Market Makers Price Your Trade
Uniswap, the largest decentralized exchange by volume, cleared roughly $73 billion in 30-day flow across Ethereum mainnet and 39 chains as of late 2025\. Uniswap V4, launched in early 2026, consolidated all pools into a single PoolManager contract and introduced hooks that customize pool behavior across the lifecycle. The flagship V3 version introduced concentrated liquidity in May 2021, which reshaped how AMMs price assets and improved capital efficiency by up to four orders of magnitude versus the constant-product invariant used in V2.
Concentrated liquidity means LPs can allocate capital to specific price ranges rather than spreading it across the entire curve. A pool with $10 million in total value locked may have $8 million concentrated between $0.98 and $1.02 for a stablecoin pair. That concentration amplifies available liquidity near the active price, but it also means liquidity vanishes quickly if price moves outside the range. For yield position entry, this creates execution risk: a $100,000 swap may encounter deep liquidity at the current price but push into a low-liquidity zone if the pool is lightly capitalized outside the narrow band.
Price impact in a constant-product AMM can be estimated as trade size divided by liquidity plus trade size. For a $10,000 swap into a pool with $300,000 in liquidity, impact approximates to 3.2%. For the same trade into a $1 million pool, impact drops to roughly 1%. The threshold that matters for yield deployment is whether impact stays below 0.5%, because anything higher starts eroding the first week or two of yield income. That requires verifying pool depth is at least three times your trade size before execution.
Curve dominates stablecoin and like-asset swaps because its StableSwap invariant delivers 10x to 100x less slippage than Uniswap for near-peg pairs. A $1 million USDC to USDT swap on Curve incurs less than 0.01% slippage. The same trade on Uniswap V3 incurs 0.3% to 0.5%. For [stablecoin yield strategies](https://altcoininvestor.com/how-to-make-money-with-stablecoins/), Curve is the default execution venue. Stable pools typically charge 0.04% per swap, half of which goes to LPs and half to veCRV holders. That 0.04% total cost is lower than the 0.1% maker-taker fee most centralized exchanges charge, and execution settles on-chain in one block rather than waiting for CEX withdrawal processing.
Balancer generalizes the AMM into multi-asset weighted pools where two to eight tokens can sit in a single pool with custom weights. Balancer V3 introduced hooks similar to Uniswap V4 in late 2025\. The largest practical use case in 2026 is liquid staking token liquidity, where pools holding stETH, rETH, and ETH allow LP-backed liquid staking exposure with relatively low impermanent loss. Pool fees range from 0.01% to 1.00%, set by pool creators. For yield position entry involving LSTs, Balancer often offers better execution than Uniswap because liquidity is distributed across multiple assets rather than concentrated in a two-token pair.
Jupiter controls approximately 95% of Solana's DEX aggregator market and handles over 50% of all DEX trading volume on the network. Its Metis routing engine runs offchain, precomputes liquidity graphs for all integrated venues, and returns optimized swap paths through the v6 API. Jupiter can split trades across several paths when needed, reducing avoidable slippage and helping users access better real-world pricing. For Solana-based yield positions, Jupiter is the execution layer. It aggregates liquidity from Orca, Raydium, and other Solana DEXs, and returns a single transaction that settles across multiple pools.
## Slippage Thresholds and When Liquidity Depth Matters
Slippage is the difference between the price you expect and the price you receive. Price impact is the portion of slippage caused by your trade size moving the pool's price curve. For swaps larger than $100,000, price impact and slippage together account for roughly 77% of overall transaction cost on a per-dollar basis. The rest is fees and gas. That ratio flips for smaller trades, where fees dominate and slippage is negligible.
Under 0.1% slippage: excellent execution, trade is small relative to pool depth. Between 0.1% and 0.5%: acceptable for most trades on major pools. Between 0.5% and 1.0%: moderate impact, consider splitting the trade or using an aggregator. Above 1.0%: high impact, a significant portion of value is lost to the pool LPs. For yield deployment, the breakeven threshold is whether slippage costs more than one week of yield income. If you are entering a position that pays 8% APY, 0.15% slippage costs you roughly one week of returns. If slippage reaches 0.6%, you have given up a month of yield before the position even starts earning.
Concentrated liquidity complicates this calculation. Uniswap V3 and V4 pools show total value locked, but real liquidity differs drastically from naive pool reserve inspection. A pool with $5 million TVL may have only $500,000 actively deployed in the current price range. If price moves outside that range during your trade, liquidity can drop to near zero. The practical check is to query the pool's liquidity distribution before executing a large trade. Tools like Uniswap Analytics and DefiLlama show liquidity depth by price range. If your trade size is larger than 10% of the active range liquidity, split the order or wait for deeper liquidity.
For stablecoin swaps, depth matters less because Curve's StableSwap invariant keeps slippage low even at high trade sizes relative to pool depth. A $500,000 USDC to DAI swap on Curve's 3pool typically incurs 0.02% to 0.05% slippage, even though the pool's active liquidity in that range may be only $10 million. The invariant is designed for stable assets and handles large trades more gracefully than constant-product AMMs. This is why Yearn, Convex, and Pendle all route stablecoin capital movement through Curve rather than Uniswap.
DEX aggregators solve the liquidity depth problem by splitting trades across multiple pools. A $200,000 trade might route 60% through Uniswap, 30% through Balancer, and 10% through a smaller AMM, settling in one transaction. 1inch and Jupiter are the two most widely used aggregators. 1inch covers Ethereum and EVM-compatible chains. Jupiter covers Solana. Both query dozens of automated market makers and request-for-quote market makers, slice the order, and return the best execution price. For trades above $50,000, aggregators almost always beat single-pool execution unless you are swapping stablecoins on Curve.
## MEV Exposure and Hidden Costs in Public Mempools
Maximal extractable value is the profit searchers extract by reordering, inserting, or censoring transactions in a block. For DEX swaps, MEV typically manifests as sandwich attacks: a searcher sees your trade in the mempool, front-runs it with a buy to push the price up, lets your trade execute at the worse price, then back-runs with a sell to capture the spread. The cost to you is higher slippage than the pool math predicted.
Advanced traders reduce MEV by avoiding the public mempool. In practice, that means using a private RPC, Flashbots Protect, CoW Protocol, 1inch Fusion, or UniswapX. Flashbots Protect routes your transaction directly to block builders without broadcasting it to the mempool. CoW Protocol batches trades and settles them at uniform clearing prices, eliminating the opportunity for sandwich attacks. UniswapX uses off-chain signed orders that fillers compete to execute, with MEV protection built into the auction mechanism. For trades above $100,000, MEV protection is not optional. The difference between protected and unprotected execution can be 0.3% to 1% of trade size.
Institutional approach for large swaps is a four-hour TWAP with MEV protection. Estimated slippage for a $1.25 million trade executed this way is 0.3% to 0.5%, or $3,750 to $6,250 loss. Instant execution for the same trade incurs 2% to 4% slippage, or $25,000 to $50,000 loss. The difference is whether you are willing to wait four hours to enter the yield position. For most yield strategies, waiting four hours to save $20,000 in execution cost is the correct trade. For time-sensitive entries during a liquidity event or governance vote, instant execution may be worth the cost.
Gas costs on Ethereum mainnet add another layer. Uniswap V4's flash accounting defers token transfers until the end of a transaction, which reduces gas for multi-step operations. A multi-hop swap that previously cost 300,000 gas on V3 may cost 180,000 gas on V4\. At 30 gwei and $3,000 ETH, that saves roughly $16 per trade. For high-frequency yield rebalancing, gas savings compound. For one-time position entry, gas is a rounding error compared to slippage and MEV.
## When CEX Execution Beats DEX
Centralized exchanges charge 0.05% to 0.1% in maker-taker fees plus spread, but they offer zero MEV exposure and often deeper orderbooks for long-tail tokens. For new or low-liquidity tokens, CEX may have better execution than DEX. The breakpoint is whether the DEX pool has at least 3x your trade size in active liquidity. If it does not, check whether a major CEX lists the token and what the orderbook depth looks like.
For governance token acquisition above $500,000, CEX often wins. A $500,000 UNI purchase on Uniswap may push price impact above 1% if the pool's active liquidity in the current range is below $1.5 million. The same purchase on Binance or Coinbase, where UNI has deep two-sided liquidity, may incur 0.1% in fees and 0.1% in spread. The 0.2% total cost beats 1% price impact. The trade-off is custody risk during the time it takes to withdraw from the CEX to your wallet. For yield positions that require governance tokens, the typical workflow is: buy on CEX, withdraw to wallet, stake or deploy into the yield protocol.
Stablecoin swaps are the exception where DEX almost always wins. Curve's 0.04% fee and sub-0.01% slippage beat every CEX's 0.1% fee plus spread. For $1 million USDC to USDT, CEX execution costs roughly $1,000 in fees. Curve execution costs $400 in fees and $100 in slippage, total $500\. The $500 savings is meaningful when you are deploying capital into a [liquidity pool](https://altcoininvestor.com/liquidity-pools-crypto-yield-impermanent-loss/) that pays 5% APY. It represents ten days of yield income recovered at entry.
The size thresholds for Ethereum mainnet as of 2026: below $10,000, DEX is faster and often cheaper than CEX gas and fees combined. Between $10,000 and $100,000, DEX is optimal if liquidity exceeds three times trade size. Above $100,000, use an aggregator with MEV protection, or split the trade across DEX and CEX. Above $500,000, CEX becomes competitive for non-stablecoin pairs, especially governance tokens with deep CEX orderbooks. For stablecoins at any size, Curve wins.
## Yield Position Deployment: The Split Strategy
The workflow for entering a DeFi yield position depends on the asset pair and trade size. For stablecoin pair entry, such as USDC to USDT for a Curve LP position, use Curve. Cost is 0.04% versus 0.1% plus spread on a CEX. For governance token acquisition, such as buying CRV to lock for veCRV, use a DEX aggregator for trades below $100,000 and consider splitting between aggregator and CEX for larger sizes. For liquid staking token swaps, such as ETH to stETH, use Curve or Balancer depending on which has deeper liquidity in the specific pair at the time of execution.
Jupiter on Solana simplifies this for Solana-based yield. It aggregates all major Solana DEXs and returns the best execution path automatically. For Solana stablecoin swaps, Jupiter routes through Saber or Mercurial, which use Curve-like stable invariants. For SPL token purchases, Jupiter splits across Orca, Raydium, and smaller AMMs. The JLP pool, Jupiter's liquidity product, earns 75% of platform fees and has historically delivered 30% to 80% APY for LPs. For users entering Solana yield positions, Jupiter is both the execution layer and a yield surface itself.
Exit mechanics matter as much as entry. [When you exit a yield position](https://altcoininvestor.com/when-to-exit-defi-position/), you reverse the capital flow. If you entered by swapping USDC for a governance token, you exit by swapping the token back to USDC. Liquidity depth at exit determines whether you can realize the yield you earned. If the pool's liquidity has dropped since you entered, or if price has moved outside the concentrated liquidity range, your exit trade may encounter higher slippage than your entry trade. The check is to verify current pool depth before initiating the exit swap, and to use an aggregator if depth has deteriorated.
Concentrated liquidity failure modes become visible at exit. If price moves outside the range where LPs have allocated capital, liquidity can drop to near zero. During volatile moves, position exits may encounter liquidity deserts. The solution is to split exit orders across price ranges using an aggregator, or to wait for liquidity to return before exiting. For large positions above $100,000, a TWAP exit over several hours reduces the risk of executing into a low-liquidity zone. For time-sensitive exits, accept higher slippage or route part of the trade to a CEX if the token is listed.
## The Takeaway
DEX execution is infrastructure for yield capital movement, not ideology. Curve wins for stablecoins at any size. Uniswap and Balancer win for non-stable pairs below $100,000 if liquidity depth exceeds three times your trade size. Aggregators win for trades above $50,000 when liquidity is fragmented across multiple pools. CEX wins for governance tokens above $500,000 when orderbook depth beats DEX pool depth. MEV protection is not optional for trades above $100,000\. The specific check before entering any yield position is to verify pool liquidity depth, compare execution cost across DEX and CEX, and calculate whether slippage and fees will erase more than one week of yield income. If they will, the execution venue is wrong. If they will not, the path is clear.
Every swap into a yield position costs you liquidity, fees, gas, and time. The venues and mechanics above let you control those costs. For readers deploying stablecoin capital into Curve, the execution path is Curve itself. For readers buying governance tokens to stake, the path is an aggregator below $100,000 and a CEX-DEX split above that threshold. For readers exiting positions during volatile price moves, the path is a TWAP with MEV protection or a delayed exit until liquidity returns. The [real-time data](https://defillama.com/protocol/uniswap) on pool depth, volume, and fees updates every block. Use it before every trade.
## Frequently Asked Questions
### What is the minimum liquidity depth needed to execute a DEX trade without high slippage?
Verify pool depth is at least three times your trade size. For a $10,000 swap, you need minimum $30,000 in active liquidity to keep price impact below 1%. For $100,000, you need $300,000 plus in depth. Concentrated liquidity on Uniswap V3 and V4 means total value locked differs from active liquidity in the current price range, so check liquidity distribution by price range before executing large trades.
### When should I use a centralized exchange instead of a DEX for entering a yield position?
CEX beats DEX for governance token purchases above $500,000 when the CEX orderbook has deeper liquidity than the DEX pool. For stablecoin swaps, DEX wins at any size because Curve's StableSwap invariant delivers sub-0.01% slippage versus 0.1% plus spread on centralized exchanges. For long-tail tokens with thin DEX liquidity, check whether a major CEX lists the token and compare orderbook depth.
### How does MEV affect my DEX trade execution cost?
Sandwich attacks from MEV searchers increase your slippage by 0.3% to 1% of trade size on unprotected swaps above $100,000\. Use Flashbots Protect, CoW Protocol, or UniswapX to route transactions outside the public mempool. For a $1 million trade, MEV protection can save $3,000 to $10,000\. For institutional-size swaps, a four-hour TWAP with MEV protection cuts total execution cost from 2-4% to 0.3-0.5%.
### Why does Curve offer better execution for stablecoin swaps than Uniswap?
Curve's StableSwap invariant is optimized for assets that trade near parity, delivering 10x to 100x less slippage than Uniswap's constant-product model for USDC, USDT, DAI, and other stablecoins. A $1 million USDC to USDT swap on Curve incurs less than 0.01% slippage and 0.04% in fees, total cost under 0.05%. The same trade on Uniswap incurs 0.3% to 0.5% slippage plus fees.
### What is the role of DEX aggregators in reducing slippage for large trades?
Aggregators like 1inch and Jupiter split your trade across multiple pools to access deeper combined liquidity and reduce price impact. A $200,000 trade might route 60% through Uniswap, 30% through Balancer, and 10% through a smaller AMM, settling in one transaction. For trades above $50,000, aggregators almost always beat single-pool execution unless you are swapping stablecoins on Curve, where the StableSwap invariant already minimizes slippage.
The Weekly Yield Report
You just compared execution costs across four DEX protocols and identified the exact trade size thresholds where slippage erases yield income. Those thresholds shift every week as liquidity moves.
Every Thursday: where crypto yield actually is - stablecoins, liquid staking and DeFi lending, with the risk named next to the rate and what changed since last week.
[Get it free every Thursday](#/portal/signup)
Free. No trade calls, no allocations, no hype. Unsubscribe in one click.
### How To Check Who Really Holds A Token
URL: https://altcoininvestor.com/check-token-holder-distribution/
Last updated: 2026-10-11T17:03:19.000Z
## Why Raw Holder Rankings Are Misleading

The 'Top Holders' list on Etherscan or Solscan is not a list of who can exit into your liquidity. It is a list of addresses, many of which represent exchange custody infrastructure, liquidity pool contracts, protocol treasuries, and vesting locks. When you see that the top ten addresses control 62% of circulating supply, that number is analytically useless until you know how many of those addresses are Binance hot wallets, how many are Uniswap liquidity pairs, and how many are actual holders who can sell tomorrow.
The distinction matters for a specific reason. Every yield opportunity in crypto carries counterparty risk, but [token concentration risk](https://altcoininvestor.com/how-to-screen-low-cap-token/) is the version where a handful of wallets can exit before you do, turning your position into exit liquidity regardless of your thesis. The top-holder percentage is the metric that tells you whether that risk is acceptable, but only after you exclude the addresses that represent infrastructure rather than ownership.
Research into concentration metrics shows that excluding protocol-controlled addresses changes the Herfindahl-Hirschman Index by a median factor of 2.3 times, with some tokens showing an 18-times difference when custodial bridge contracts are removed from the calculation. This is not a rounding error. This is the difference between a token that looks dangerously concentrated and one that has a plausible claim to distributed ownership.
What follows is the process for distinguishing exchange and contract wallets from real holders, calculating the concentration percentage that actually matters, and deciding what threshold makes a position untenable. This is not complicated, but it is manual, and most holders never do it.
## Reading The Holder List On Etherscan
Start with the token contract address. Open Etherscan, paste the contract address into the search bar, and navigate to the 'Holders' tab. The page displays total supply at the top, followed by a ranked list of addresses and their percentage of total supply. The top line typically shows the largest holder, often a decentralized exchange liquidity pair or an exchange hot wallet, holding anywhere from 8% to 40% depending on the token.
Your first task is to identify which addresses represent infrastructure rather than individual ownership. Etherscan labels known exchange wallets with tags such as 'Binance 14' or 'Coinbase 10'. Liquidity pool contracts are labeled with the DEX name, usually 'Uniswap V2' or 'Uniswap V3: TOKEN/WETH'. Protocol treasury addresses are sometimes labeled, though smaller projects rarely receive verified tags unless they submit wallet information to Etherscan's labeling system.
For unlabeled addresses, click through to the wallet page. If the address holds dozens or hundreds of different tokens and shows thousands of transactions, it is almost certainly an exchange wallet or aggregator contract. If the address shows only outbound transfers on a fixed schedule, it is likely a vesting contract. If the address holds a single liquidity pool token and has no outbound transactions, it is locked liquidity, not a holder who can sell.
Once you have identified the infrastructure addresses, exclude them from your calculation. Add up the percentages held by the remaining top-ten wallets. That sum is your actual concentration figure. If three of the top ten addresses are exchange wallets holding a combined 35%, and two more are liquidity pools holding 18%, then your real top-ten concentration is not 70%, it is 17%. That difference determines whether you take the position.
The process is tedious, but the alternative is buying into a token where you believe distribution is healthy when in fact four wallets control 55% of the free float and [one vesting unlock](https://altcoininvestor.com/token-vesting-schedule-analysis/) will double circulating supply in thirty days. Etherscan's 'Download CSV' feature on the first page of holder data allows you to export the list and build your own exclusion model if you are analysing multiple tokens regularly.
## Reading The Holder List On Solscan

Solana token analysis follows the same logic but with a different interface. Open Solscan, search the SPL token mint address, and click through to the token page. The 'Holders' tab shows the ranked address list, and the 'Token Holder Analytics' section provides concentration risk summaries that Etherscan does not offer natively.
The analytics dashboard breaks down holder distribution by tier, showing how many wallets hold more than 1% of supply, how many hold between 0.1% and 1%, and so on down to dust balances. This tiered view reveals whether the token has a deep holder base or whether ownership drops off sharply after the top twenty addresses. A healthy token shows gradual distribution across hundreds of addresses. A concentrated token shows 60% in the top ten and then 8% spread across the next thousand holders, which tells you the token has whales and dust, with nothing in between.
Solscan also provides a 'Whale Exposure' metric and a 'Concentration Risk' indicator, both of which attempt to exclude known infrastructure addresses automatically. These are useful starting points, but you should verify the exclusions manually because Solscan's tagging database is smaller than Etherscan's, particularly for newer tokens. Click through to the largest holders and check for exchange deposit programs, staking contracts, and protocol-owned liquidity positions.
For Solana tokens, the additional complexity is that many larger holders are staking accounts or token accounts controlled by programs rather than individuals. If the holder address is a program-derived address, it may represent a staking pool, a yield aggregator, or a DAO treasury. These addresses do not represent sell pressure in the same way a individual wallet does, though they do represent governance concentration if the protocol uses token-weighted voting.
After you exclude infrastructure and program-controlled addresses, calculate the percentage held by real wallets in the top ten. Compare that figure against your risk threshold. If the number is above 40%, you are looking at a token where a small number of holders can move the market. If it is above 50%, you are looking at material rug-pull risk regardless of the team's stated intentions.
## What Concentration Level Makes A Position Untenable
The threshold that matters is not a single number. It is a function of your position size, your liquidity assumptions, and the token's market depth. A 25% top-ten concentration is acceptable in a token with $10 million daily volume and verified team history. The same 25% is unacceptable in a token with $200,000 daily volume and an anonymous developer.
That said, there are levels where the analysis becomes simple. If a single non-custodial wallet holds more than 20% of circulating supply, that is material risk. If the top ten non-infrastructure wallets hold more than 50%, that is a strong signal that the token exists to extract value from later buyers. The 40% threshold represents the boundary where healthy distribution ends and concentration risk begins to dominate other considerations.
The Herfindahl-Hirschman Index provides a more rigorous measure for readers who want to quantify concentration with precision. The HHI sums the squares of all holder percentages, producing a score between 0 and 10,000\. An HHI below 1,500 indicates unconcentrated ownership. An HHI between 1,500 and 2,500 indicates moderate concentration. An HHI above 2,500 indicates high concentration, the same threshold U.S. antitrust regulators use to evaluate market dominance in traditional industries.
For tokens, an HHI above 2,500 after excluding infrastructure addresses is a warning that ownership is concentrated enough to create exit risk that your position size cannot absorb. You can calculate HHI manually by squaring each holder's percentage and summing the results, or you can use [open-source tools](https://github.com/technicalanalysis00005-cell/token-holder-metrics) that pull holder data via API and compute the index automatically. The GitHub repository linked provides working Python code for Gini coefficient, HHI, and Nakamoto coefficient calculations, with methodology notes explaining the exclusion logic for common infrastructure addresses.
The Nakamoto coefficient measures how many addresses you would need to collude to control more than 50% of supply. A coefficient below 10 is a meaningful decentralization concern. A coefficient below 5 is a red flag. If three wallets can coordinate to control majority supply, the token is not decentralized in any sense that limits exit risk, regardless of what the whitepaper claims.
## Common Failure Modes And What They Look Like
The most frequent error is treating circulating supply and total supply as interchangeable. Many tokens report a circulating supply that excludes burned tokens, vesting locks, and treasury reserves, but Etherscan's holder list shows percentages of total supply by default. If the token has burned 30% of total supply to a dead address, that address will appear as the top holder, and every other percentage will be artificially depressed. You must adjust your calculation to reflect circulating supply, not total supply, or your concentration figure will understate the real risk by whatever percentage has been removed from circulation.
The second failure mode is assuming that labeled addresses are always infrastructure. Some exchange wallets are in fact [team-controlled wallets](https://altcoininvestor.com/how-to-research-crypto-team-background/) that route through exchange custody to obscure ownership. If a wallet labeled 'Binance' received a large transfer directly from the token deployer contract within the first week of launch, it may be a team allocation being custodied at Binance rather than genuine exchange liquidity. Cross-reference large holders against the token's vesting schedule and deployer history before you exclude them.
The third failure mode is ignoring concentration trends over time. A token that launched with 25% top-ten concentration and now shows 48% is experiencing accumulation, most likely by insiders or by a single actor building a position large enough to manipulate price. Comparing current holder distribution against the distribution at launch reveals whether concentration is increasing, which is a stronger sell signal than the absolute level. Most block explorers do not archive historical holder snapshots, but you can track changes manually by recording top-holder percentages every thirty days.
The fourth failure mode is grouping all liquidity pool addresses as infrastructure without checking whether the liquidity is locked. A Uniswap V2 pair holding 15% of supply is not exit risk if the LP tokens are locked in Unicrypt or Team Finance for twelve months. It is direct exit risk if the LP tokens sit in an unlabeled wallet that has been active in the last week. Click through to the LP token holder to verify lock status before you exclude the position from your concentration calculation.
## What To Do With The Number You Calculate
Once you have the adjusted top-ten percentage, compare it against your risk tolerance and position size. If you are allocating 2% of your portfolio to a speculative token with 35% top-ten concentration, the position is sized appropriately for the risk. If you are allocating 15% of your portfolio to the same token, you are taking counterparty risk that you cannot recover from if the top holders exit before you do.
For tokens where concentration exceeds 40%, the decision tree is simple. Either the token has a specific catalyst that justifies the risk, such as imminent exchange listings or protocol revenue growth that will drive accumulation by new holders, or it does not. If it does not, the position is speculative in the sense that you are betting you can exit before the concentrated holders do. That is a trade, not an investment, and it should be sized and monitored as such.
For tokens where concentration exceeds 50%, the analysis ends unless you have direct knowledge of who the top holders are and why they are not selling. At that level of concentration, the token's price is determined by the actions of fewer than ten addresses, and your ability to exit depends entirely on their behavior. There are cases where this is acceptable, typically early-stage projects where the top holders are known team members or DAO treasury multisigs, but those cases require transparency that most projects do not provide.
The ongoing monitoring task is to re-check holder distribution every thirty days. Concentration can increase rapidly if whales accumulate or if smaller holders exit into low liquidity. Set a threshold at which you will exit regardless of price action. For most positions, that threshold should be 10 percentage points above the concentration level at which you entered. If you bought at 32% top-ten concentration and it rises to 42%, someone is accumulating, and that someone is not you.
## The Takeaway
Holder concentration is the risk that does not show up in price charts until it is too late to exit. The top-ten percentage is the metric that quantifies that risk, but only after you exclude exchange wallets, liquidity pools, staking contracts, and protocol treasuries from the calculation. Etherscan and Solscan both provide the raw data, but neither provides the adjusted figure that actually matters. That calculation is manual, and it is the difference between a position you can exit and a position where you are exit liquidity.
The 40% top-ten threshold is the boundary where concentration begins to dominate other factors. Above 50%, the token is controlled by a small group regardless of the narrative. A single wallet holding more than 20% is material risk in any scenario. These are not soft guidelines. They are the levels at which European sovereign debt markets began pricing in default risk during the 2011 crisis, and they are the levels at which crypto tokens begin behaving like instruments whose value depends on the intentions of a small number of actors rather than on market dynamics.
If you are evaluating a token and the top-holder list shows heavy concentration, the question you should ask is not whether the team intends to rug. The question is whether your position size and exit plan account for the fact that a handful of wallets can sell before you do, and whether you have mispriced that risk because you did not exclude the addresses that represent infrastructure rather than ownership. Most holders have mispriced it. The ones who calculate the adjusted figure have an edge that compounds over every position they evaluate.
## Frequently Asked Questions
### What percentage of top-ten holder concentration is too high?
After excluding exchange wallets, liquidity pools, and protocol treasuries, top-ten concentration above 40% is the threshold where risk begins to dominate other factors. Above 50%, the token is effectively controlled by a small group. A single non-custodial wallet holding more than 20% of circulating supply represents material risk in any scenario. These thresholds apply to the adjusted concentration figure, not the raw percentage shown on block explorers before infrastructure addresses are excluded.
### How do I know if a top holder is an exchange wallet or a real holder?
Etherscan and Solscan label known exchange wallets with tags like 'Binance 14' or 'Coinbase 10'. For unlabeled addresses, click through to the wallet page. Exchange wallets typically hold dozens or hundreds of different tokens and show thousands of transactions. Vesting contracts show only outbound transfers on a fixed schedule. Liquidity pool addresses hold a single LP token with no outbound transactions. If an address shows frequent trading activity across multiple tokens, it is likely exchange infrastructure or an aggregator contract.
### What is the Herfindahl-Hirschman Index and why does it matter for tokens?
The Herfindahl-Hirschman Index sums the squares of all holder percentages to produce a concentration score between 0 and 10,000\. An HHI below 1,500 indicates unconcentrated ownership. An HHI between 1,500 and 2,500 indicates moderate concentration. An HHI above 2,500 indicates high concentration, the same threshold used to evaluate market dominance in traditional industries. For tokens, an HHI above 2,500 after excluding infrastructure addresses warns that ownership is concentrated enough to create exit risk your position cannot absorb.
### Should I exclude liquidity pool addresses from my concentration calculation?
Exclude liquidity pool addresses only if the LP tokens are verifiably locked in a contract like Unicrypt or Team Finance. If the LP tokens sit in an unlabeled wallet that has been active recently, the liquidity represents potential exit risk and should be included in your concentration calculation. Click through to the LP token holder to verify lock status. Unlocked liquidity pool positions controlled by team wallets or anonymous addresses are direct sell pressure, not infrastructure.
### How often should I re-check token holder concentration?
Re-check holder distribution every thirty days. Concentration can increase rapidly if whales accumulate or if smaller holders exit into low liquidity. Set a threshold at which you will exit regardless of price action. For most positions, that threshold should be 10 percentage points above the concentration level at entry. If you bought at 32% top-ten concentration and it rises to 42%, someone is accumulating, and that represents increasing counterparty risk that warrants position review or exit.
The Weekly Yield Report
You just learned how to exclude exchange wallets and calculate real top-ten concentration. Those percentages will shift next month, and someone will notice before you do.
Every Thursday: where crypto yield actually is - stablecoins, liquid staking and DeFi lending, with the risk named next to the rate and what changed since last week.
[Get it free every Thursday](#/portal/signup)
Free. No trade calls, no allocations, no hype. Unsubscribe in one click.
### GPU Rental Platforms Compared: Vast.ai vs Akash vs Render
URL: https://altcoininvestor.com/rent-out-gpu-for-income/
Last updated: 2026-10-11T16:03:42.000Z
## The Decision You Are Making
You own a GPU. You want it to generate income when you are not using it. Three platforms process the majority of consumer GPU rental transactions in 2026: Vast.ai, Akash Network, and Render Network.
The question is not which platform has the lowest fee. The question is which one puts the most money in your account after electricity, depreciation, downtime, and platform cuts.
Vast.ai processes over 700,000 GPU rental transactions per month across 17,000+ GPUs from 1,400 independent hosts. Akash Network aggregates approximately 250 active GPUs across 73 providers. Render Network had 60,000 GPUs approved for use as of April 2026.
Those numbers tell you something about demand density. This article compares all three on the factors that decide your actual net income: platform fees, utilization rates, payout structure, hardware requirements, and the income gap between rental and [mining versus GPU compute rental](https://altcoininvestor.com/gpu-rental-vs-mining-returns/).
## Platform Fees And What They Actually Cost You

Vast.ai charges a 20% platform fee. Akash Network charges 10-18%, variable. Render Network does not publish a fixed percentage, but all payouts are denominated in RNDR tokens rather than USD or BTC.
On the surface, Akash looks cheaper. In practice, Vast.ai hosts often net more.
The reason is demand. Vast.ai takes a larger cut but has the highest traffic and best price discovery. Even after the 20% fee, hosts often earn more than on lower-fee platforms with sparse job flow.
A consumer RTX 4090 on Vast.ai lists at $0.30-$0.60 per GPU-hour when there is demand. At 40% utilization over a month, that is 288 hours billed. At $0.45 average, gross revenue is $129.60\. After the 20% platform fee, you net $103.68 before electricity and depreciation.
On Akash, the same RTX 4090 might list at $0.40-$0.80 per hour with a 15% fee. But Q1 2026 GPU utilization on Akash was 33.7%, and lease revenue declined 45% quarter-over-quarter. At 33.7% utilization and $0.60 average rate, you bill 243 hours for $145.80 gross. After a 15% fee, you net $123.93.
That is $20 more per month gross, but only if utilization holds at 33.7%. If it drops to 20%, your billed hours fall to 144, gross revenue falls to $86.40, and net after fees is $73.44\. Suddenly Vast.ai's higher traffic wins.
Render Network payouts are harder to model because income is denominated in RNDR tokens. An RTX 4090 running 22 hours per day can complete 28-35 rendering jobs per day and earn $120-$150 daily, or $3,600-$4,500 monthly. That is materially higher than Vast.ai or Akash, but it assumes consistent demand for rendering workloads and token price stability.
One thing worth noting: rendering demand is cyclical. If studios batch their work or a few large clients pause projects, your income can drop 50% month-over-month. Vast.ai and Akash serve AI training and inference workloads, which have steadier baseline demand in 2026.
## Utilization Rates And Why They Decide Everything

Utilization is the percentage of time your GPU is rented and generating income. It is the single most important variable in the income equation.
Vast.ai hosts report realistic utilization between 20% and 50% for unmanaged consumer cards. Akash reported 70% utilization in one source and 33.7% GPU utilization in its Q1 2026 quarterly report. The 70% figure likely refers to utilized capacity among actively leased GPUs, not all registered GPUs.
Render Network does not publish aggregate utilization, but node operators report job flow is inconsistent. High-end RTX 50-series cards see better fill rates than older 30-series hardware.
At 40% utilization, a consumer RTX 4090 nets roughly $22 per month after electricity, depreciation, marketplace fee, and idle upkeep costs. Push utilization down to 20% and revenue halves while depreciation stays fixed, so net margin goes negative unless your electricity is extremely cheap.
The data shows Vast.ai delivers the most consistent utilization for consumer GPUs because it has the largest renter base. Akash has enterprise-grade potential but residential node income is thin at current lease volumes. Render has the highest per-hour rates but the most volatile month-to-month demand.
One hour of GPU rental for AI can yield 1.5x-4x the revenue of the same hour spent mining, and cash flow is less tied to token volatility. But only if the hour is actually rented.
## Payout Structure: How And When You Get Paid
Vast.ai pays out weekly in BTC or USD with a minimum payout threshold of $20\. If you net $103 in a month, you receive four payments of roughly $25 each, assuming even weekly distribution.
Akash payouts depend on the provider setup. The Homenode Beta, launched in Q1 2026, enables consumer GPU owners to register at homenode.akash.network and earn from compute demand. Payouts are in AKT tokens or USD depending on lease terms. Minimum thresholds vary by provider configuration.
Render Network pays exclusively in RNDR tokens. Suppliers earn RNDR for completing rendering jobs. If you need USD, you sell RNDR on an exchange, which introduces liquidity risk and exchange fees.
For providers who want predictable cash flow, Vast.ai's weekly BTC/USD payouts are the cleanest. For providers who are comfortable holding tokens and believe in long-term appreciation, Render's RNDR model can work. Akash sits in the middle but has the least mature payout infrastructure for residential nodes as of mid-2026.
## Hardware Requirements: What Cards Qualify
Most platforms require an NVIDIA GPU with 8+ GB VRAM, but the real floor for sustained earnings over the next two to three years is 16 GB.
Vast.ai accepts RTX 3060 and newer. RTX 4090 and higher-end cards like A100 or H100 command premium rates. Consumer GPUs like the RTX 5090 earn $0.30-$0.60 per GPU-hour. A four-GPU RTX 5090 rig running at 80% utilization can generate $700-$1,400 per month gross.
Akash Homenode launched accepting RTX 4090s, RTX 5090s, and Quadro RTX 6000 Ada GPUs. Older or lower-VRAM cards are not supported in the initial Homenode rollout.
Render Network node operators report that RTX 5090 and RTX 5080 cards deliver the best return on investment. An RTX 5090 breaks even in approximately 45-60 days at $150/day average earnings. An RTX 5080 breaks even in approximately 35-50 days at $110/day average earnings.
All three platforms require a stable internet connection with 50+ Mbps upload, Docker support, and Linux or Windows 10/11\. Vast.ai has the lightest setup friction. Akash Homenode is still in beta and requires more configuration. Render node setup is documented but involves token staking and wallet configuration.
If you already own an RTX 4090 or RTX 5090, all three platforms are viable. If you are buying hardware specifically to rent, target 16 GB VRAM minimum and prioritize cards with strong rendering performance for Render or high CUDA core counts for Vast.ai and Akash.
## Uptime Expectations And Reliability Penalties
Renters care about uptime. Platforms care about renters. If your node goes offline frequently, your income drops.
On Vast.ai, unverified hosts face a 20-40% effective cost increase to renters due to downtime and restart risk. That means renters avoid your listings or demand lower rates. Interruptible instances appeal to clients willing to trade guaranteed uptime for 50-80% cost savings. Hosts earn less per hour but fill gaps that would otherwise generate nothing.
Akash does not publish uptime SLAs for Homenode providers, but enterprise leases expect 99%+ uptime. Residential nodes that cannot maintain that standard will see lower lease renewal rates.
Render Network job completion is non-negotiable. If your node fails a rendering job, you do not get paid for that job. Repeated failures can result in reduced job allocation.
The data shows that consumer GPUs running in home environments realistically achieve 90-95% uptime accounting for ISP issues, power interruptions, and maintenance. That is acceptable for Vast.ai interruptible instances and marginal for Akash and Render.
If you cannot guarantee 95%+ uptime, Vast.ai is your best option. If you are running dedicated hardware in a controlled environment, all three platforms are viable.
## Real Net Income After All Costs
Gross revenue means nothing. Net income after electricity, depreciation, and platform fees is the only number that matters.
For a consumer RTX 4090 running at 40% utilization on Vast.ai, monthly gross revenue is approximately $129.60 at $0.45/hour average. After the 20% platform fee, net is $103.68\. Subtract approximately $15-$25 for electricity depending on your local rate, and $30-$40 for monthly depreciation assuming a 24-month hardware lifespan. Net income: $39-$59 per month.
If electricity costs more than €0.28/kWh, margins compress or go negative unless you push utilization above 50% or secure premium rates.
On Render Network, an RTX 4090 running 22 hours per day at $120-$150 daily gross income generates $3,600-$4,500 monthly. Subtract electricity at $60-$90 for a high-duty-cycle card, subtract depreciation at $50-$60 for accelerated wear, and you net $3,450-$4,350 per month. That is 50x-70x the Vast.ai income, but only if rendering demand holds and RNDR token price remains stable.
Akash net income at 33.7% utilization and $0.60/hour after a 15% fee is approximately $123.93 gross. Subtract $15-$25 electricity and $30-$40 depreciation, and net is $59-$79 per month. That is better than Vast.ai on paper, but utilization volatility is higher.
For most modern GPUs, AI rental now pays more than mining does. A Nvidia H100 SXM earns $40-$60/day renting on AI markets while the best mining algorithm it can run clears under $2/day. For consumer cards, the gap is smaller but still favorable: an RTX 4090 nets $50-$85/month renting versus $10-$25/month mining after electricity.
Opportunity cost matters. If you mine, you earn regardless of external demand. If you rent, you earn only when someone leases your hardware. In 2026, rental demand for AI workloads is high enough that the income gap outweighs the demand risk for most providers.
## Who Each Platform Is Right For
**Vast.ai:** Best for consumer GPU owners who want predictable weekly payouts in BTC or USD, can tolerate 20-50% utilization, and prioritize ease of setup. If you own an RTX 4090 or RTX 5090 and want passive income without managing enterprise infrastructure, Vast.ai delivers the most consistent results in 2026.
**Akash Network:** Best for providers already running infrastructure who can monetize spare capacity. Not recommended for hardware purchased specifically to rent. If you are a developer or enterprise operator with idle GPU capacity and comfort managing Homenode configuration, Akash is viable. For pure income seekers starting from zero, the juice does not justify the squeeze at current utilization and lease volume.
**Render Network:** Best for providers with high-end RTX 50-series cards, 95%+ uptime capability, and tolerance for token-denominated income volatility. If you can maintain 22-hour daily uptime and are comfortable holding RNDR tokens, the income potential is materially higher than Vast.ai or Akash. If you need USD cash flow or cannot guarantee uptime, Render introduces too much risk.
## The Recommendation
For most consumer GPU owners in 2026, Vast.ai is the correct choice.
It has the highest transaction volume, the most consistent utilization, the simplest setup, and weekly payouts in BTC or USD. The 20% platform fee is offset by higher demand density. You will earn less per hour than on Render Network, but you will earn more hours per month.
If you already own an RTX 5090 or newer and can maintain 95%+ uptime, Render Network is worth testing. The income ceiling is 50x-70x higher than Vast.ai, but the floor is zero if demand drops or your node goes offline.
Akash Network has long-term potential but is not ready for residential income seekers in mid-2026\. Utilization is too low and lease revenue is declining. Revisit Akash in 12 months if Homenode matures and demand stabilizes.
## The Takeaway: One-Paragraph Decision Rule
If you own a consumer GPU with 16+ GB VRAM and want passive income, start with Vast.ai. If your electricity costs less than €0.28/kWh and you can maintain 40%+ utilization, you will net $50-$85/month per RTX 4090 after all costs. If you own an RTX 5090 or RTX 5080 and can guarantee 95%+ uptime, add Render Network as a second income stream and allocate 50-70% of your compute time to Render for higher per-hour rates. Avoid Akash unless you already run infrastructure and can absorb income volatility. Track your net income monthly and compare it to [mining returns](https://altcoininvestor.com/gpu-rental-vs-mining-returns/) every quarter. The income gap favors rental in 2026, but that can reverse if AI workload demand contracts or token prices collapse.
## Frequently Asked Questions
### Which GPU rental platform pays the most per hour in 2026?
Render Network pays the highest per-hour rates, with RTX 4090 nodes earning $120-$150 per day or $3,600-$4,500 monthly at 22-hour uptime. Vast.ai pays $0.30-$0.60 per GPU-hour for consumer cards like the RTX 4090, netting $50-$85 monthly after costs at 40% utilization. Akash pays $0.40-$0.80 per hour but suffers from low utilization. Render has the highest ceiling but requires 95%+ uptime and token-price tolerance.
### What are the minimum hardware requirements to rent out a GPU?
Most platforms require an NVIDIA GPU with 8+ GB VRAM, but 16 GB is the practical floor for sustained earnings over 2-3 years. Vast.ai accepts RTX 3060 and newer. Akash Homenode launched with RTX 4090, RTX 5090, and Quadro RTX 6000 Ada support. All platforms require 50+ Mbps upload speed, Docker support, and Linux or Windows 10/11\. RTX 4090 and RTX 5090 command premium rates across all three platforms.
### How much can you realistically earn renting out an RTX 4090?
An RTX 4090 at 40% utilization on Vast.ai nets $50-$85 per month after electricity, depreciation, and platform fees. On Render Network at 22-hour daily uptime, the same card can net $3,450-$4,350 monthly, but only if rendering demand and RNDR token price remain stable. On Akash at 33.7% utilization, net income is $59-$79 monthly. Electricity costs above €0.28/kWh compress margins significantly.
### Is GPU rental income better than crypto mining in 2026?
For most modern GPUs, rental income exceeds mining income in 2026\. An RTX 4090 nets $50-$85/month renting versus $10-$25/month mining after electricity. A Nvidia H100 SXM earns $40-$60/day on AI rental markets versus under $2/day mining. One hour of GPU rental for AI yields 1.5x-4x the revenue of mining, and cash flow is less tied to token volatility. The income gap favors rental if utilization stays above 30-40%.
### What is the biggest risk when renting out your GPU?
Utilization volatility is the biggest risk. If your GPU sits idle, you earn nothing while depreciation and electricity costs continue. Vast.ai hosts report 20-50% utilization for consumer cards. Akash Q1 2026 utilization was 33.7% with lease revenue down 45% quarter-over-quarter. Render demand is cyclical and can drop 50% month-over-month. Downtime below 90% on Vast.ai reduces renter trust and lowers your effective rate by 20-40%.
The Weekly Yield Report
You have just compared three platforms with utilization between 20% and 70% and fees between 10% and 20%. Those numbers will change next quarter.
Every Thursday: where crypto yield actually is - stablecoins, liquid staking and DeFi lending, with the risk named next to the rate and what changed since last week.
[Get it free every Thursday](#/portal/signup)
Free. No trade calls, no allocations, no hype. Unsubscribe in one click.
### How To Complete Form 8949 For Crypto: Capital Gains, Staking Income, And Cost Basis Rules
URL: https://altcoininvestor.com/crypto-tax-form-8949/
Last updated: 2026-10-11T15:04:01.000Z
## What Form 8949 Does And Why It Matters For Crypto Filers

Form 8949 is the IRS document that lists every sale, swap, or disposition of capital assets, including cryptocurrency. Each transaction requires its own line entry with acquisition date, disposal date, proceeds, cost basis, and gain or loss. The totals from Form 8949 flow into Schedule D, which calculates your final capital gains tax.
For crypto filers in 2026, Form 8949 carries an additional complication. Brokers must report proceeds to the IRS on Form 1099-DA, but they do not have to report cost basis for transactions that occurred in 2025\. That gap creates a scenario where the IRS sees $50,000 in proceeds but no offsetting cost basis. If you do not file Form 8949 with your actual cost basis documented, the IRS may assess tax on the full proceeds as if your cost was zero.
This is not a theoretical risk. Leaving the basis column blank or copying the 1099-DA without adjustments leads to overstated gains. You are responsible for supplying your own cost basis, and if you cannot substantiate it, FIFO applies by default. Accurate Form 8949 completion with proper cost basis tracking is the legal mechanism that reduces your tax burden. Incorrect reporting either triggers an audit or results in overpayment.
## How Form 8949 Is Structured For Short-Term And Long-Term Gains
Form 8949 is divided into two parts. Part I covers short-term transactions, meaning you held the asset for one year or less. Part II covers long-term transactions, meaning you held it longer than one year. The distinction matters because short-term gains are taxed as ordinary income at rates up to 37%, while long-term gains face capital gains rates of 0%, 15%, or 20% depending on your income bracket.
Each part includes three checkbox options. For Part I (short-term), the boxes are A, B, and C. For Part II (long-term), the boxes are D, E, and F. Most crypto filers in 2026 will use Box B or Box C. Box B applies if proceeds were reported to the IRS on a 1099-DA but basis was not. Box C applies when neither proceeds nor basis were reported, which is the case for DeFi activity, self-custody wallets, and any platform that does not issue a 1099-DA.
Each transaction line on Form 8949 requires the following columns:
- Description of property (e.g., "0.5 BTC")
- Date acquired
- Date sold or disposed
- Proceeds (sale price)
- Cost basis (original purchase price plus fees)
- Adjustment code and amount, if applicable
- Gain or loss (proceeds minus cost basis)
If you traded BTC for ETH, that is a taxable event. The BTC sale goes on Form 8949 with proceeds equal to the fair market value of the ETH you received. The cost basis is what you originally paid for the BTC. Each swap, sale, or spend creates a separate line entry.
For more background on how different holding periods and income types are taxed, see [Crypto Tax Rates 2025: Short-Term, Long-Term, And Income](https://altcoininvestor.com/crypto-tax-rate-2025/).
## Cost Basis Methods: FIFO, Specific ID, And The Per-Wallet Rule
Cost basis is the original purchase price of an asset plus any fees. When you sell or swap crypto, your taxable gain equals proceeds minus cost basis. The challenge arises when you have acquired the same asset multiple times at different prices. Which lot are you selling?
The IRS allows two methods for crypto: FIFO and Specific Identification. FIFO is the default. It assumes you sell the oldest lots first. In a rising market, FIFO produces higher taxable gains because you are disposing of coins purchased when prices were lower. Specific Identification allows you to designate which specific lot you are selling, potentially reducing your gain by selecting higher-cost lots.
LIFO and HIFO are not separate IRS-approved methods. They are strategies applied through Specific Identification, which means they carry the same documentation burden. LIFO is not an IRS-permitted method for crypto. Any tax return using LIFO is technically non-compliant and may be challenged on audit.
Starting January 1, 2025, the IRS requires that you identify the disposed asset no later than the time of the transaction. You cannot retroactively choose Specific ID when filing your tax return if you did not document the lot selection at the time of sale. The per-wallet rule also went into effect on January 1, 2025\. Each cost basis method must be applied on a per-wallet or per-account basis. You cannot use FIFO for one wallet and Specific ID for another within the same asset.
Selecting "HIFO" or "LIFO" in tax software does not satisfy Specific Identification requirements. The software may calculate gains using those methods, but if you cannot produce lot-level records showing you designated specific lots at the time of each transaction, FIFO applies by default. Many popular crypto tax tools allow LIFO selection, but FIFO and Specific ID are the only methods officially supported by the IRS.
For a detailed comparison of these methods and their impact on taxable income, read [Best Crypto Tax Software For DeFi Yield And Staking Income](https://altcoininvestor.com/best-crypto-tax-software-defi-yield-staking/).
## How To Report Staking Rewards And LP Tokens: Schedule 1 Line 8v, Not Form 8949
Staking rewards, liquidity pool rewards, and yield farming income are not reported on Form 8949 at the time you receive them. These are ordinary income events, taxed at your marginal income tax rate based on the fair market value of the tokens when you gain control. You report the total value on Schedule 1, line 8v, labeled "other income."
Revenue Ruling 2023-14 clarified the IRS position: staking rewards are taxable when you gain dominion and control over them. That is the moment you can transfer, sell, or otherwise dispose of the tokens. If rewards remain locked or vested, they are not taxable until the lockup ends.
The fair market value at the time of receipt becomes your cost basis for future capital gains calculations. When you later sell, swap, or spend those reward tokens, that transaction goes on Form 8949 with the cost basis set at the value you reported as ordinary income.
Here is an example. On March 15, you receive 10 SOL in staking rewards when SOL is trading at $120\. You report $1,200 as ordinary income on Schedule 1, line 8v. On June 10, you sell those 10 SOL for $150 each, receiving $1,500\. The sale goes on Form 8949 with proceeds of $1,500, cost basis of $1,200, and a long-term or short-term capital gain of $300 depending on whether you held the SOL for more than one year after receipt.
Double-counting is a common error. If you report staking rewards as income and then fail to use that same value as cost basis when you sell, you pay tax twice on the same value.
Solana pays staking rewards at every epoch boundary, roughly every two to three days. A year of staking produces well over 100 separate income events, each requiring its own fair market value snapshot. Using year-end price instead of receipt-date price is incorrect and may result in underreported income or overstated cost basis.
Casual yield farmers report rewards on Schedule 1, line 8v. If your farming activity rises to a trade or business with significant time, regularity, and profit motive, it may need to be reported on Schedule C and could attract self-employment tax. Most retail stakers do not meet that threshold.
For the full explanation of when staking rewards become taxable and how the IRS defines "dominion and control," see [Crypto Staking Tax Treatment: What The IRS Actually Says](https://altcoininvestor.com/crypto-staking-tax-treatment-irs/).
## Step-By-Step: Filling Out Form 8949 For A Crypto Sale
You will need transaction records showing the date you acquired each asset, the date you disposed of it, the amount you paid, and the amount you received. Most exchanges provide transaction history exports, but you are responsible for reconciling transfers between wallets and calculating cost basis across platforms.
Step 1: Determine whether each transaction is short-term or long-term. Count the holding period from the day after acquisition to the day of disposal. If you bought BTC on January 5, 2024, and sold it on January 5, 2025, that is exactly one year and qualifies as short-term. One day later, on January 6, 2025, it becomes long-term.
Step 2: Group transactions by holding period and reporting status. Use Part I for short-term, Part II for long-term. Within each part, use Box B if the exchange reported proceeds to the IRS but not basis. Use Box C for DeFi, self-custody, and non-reporting platforms.
Step 3: Enter each transaction on its own line. In column (a), describe the property. "0.5 BTC" or "250 USDC" is sufficient. In column (b), enter the date you acquired it. In column (c), enter the date you sold or swapped it. In column (d), enter the proceeds, which is the fair market value in USD at the time of disposal. In column (e), enter your cost basis.
Step 4: If you received a 1099-DA and the proceeds listed do not match your records, or if the basis is blank, enter your own calculated figures. You may need to add an adjustment in column (g) with code B to explain the difference. The IRS expects the final totals on Form 8949 to reconcile with the totals on all 1099-DA forms you received.
Step 5: Subtract cost basis from proceeds to calculate gain or loss in column (h). A positive number is a gain, a negative number is a loss. Total all gains and losses for each part and carry the totals to Schedule D.
If you have hundreds or thousands of transactions, you do not need to list each one individually. You can attach a summary statement showing total proceeds, total cost basis, total adjustments, and total gain or loss for each checkbox category. The IRS accepts summary reporting as long as you retain the underlying transaction records and can produce them on request.
For practical filing guidance that integrates staking income and complex DeFi yield into TurboTax, read [TurboTax Crypto Import: File Staking, Lending, And LP Income Without Errors](https://altcoininvestor.com/turbotax-crypto-import-staking-lending-lp/).
## Common Pitfalls: Cost Basis Mismatches, Double-Counting, And Missing DeFi Activity
The most frequent error is leaving cost basis blank or relying entirely on what the 1099-DA shows. For 2025 transactions, brokers do not have to report cost basis. If you do not fill in column (e) on Form 8949, the IRS computes your gain as 100% of proceeds. A $50,000 sale with no documented basis results in a $50,000 taxable gain, even if your actual cost was $45,000.
The second common mistake is double-counting income. When you receive an airdrop or staking reward, that is taxable as ordinary income at the fair market value on the date you gain control. That value becomes your cost basis. When you sell the asset, you report the sale on Form 8949 with that same value as basis. If you report the airdrop as income but then list zero basis on the sale, you pay tax on the same value twice.
The third pitfall is ignoring DeFi activity. Notice 2024-57 temporarily exempts six categories of DeFi transactions from 1099-DA reporting: staking, liquidity provision, wrapping and unwrapping, digital lending, short sales, and notional contracts. The exemption applies to broker reporting, not to your tax liability. You still owe tax on gains and income from these activities, and you must report them on Form 8949 and Schedule 1 even if you received no 1099-DA.
Users with positions on Uniswap, SushiSwap, Compound, Aave, Lido, or similar protocols receive no 1099-DA but must track every swap, deposit, withdrawal, and reward claim. Each swap is a taxable event. LP token deposits are generally not taxable, but redeeming LP tokens for the underlying assets is. Impermanent loss does not offset taxable gains unless you actually realize it by withdrawing from the pool.
The fourth issue is wallet-to-wallet transfers. Moving crypto from Coinbase to your Ledger hardware wallet is not a taxable event, but you must track the cost basis through the transfer. If you later sell from the Ledger, the cost basis is the original purchase price on Coinbase, not the value at the time of transfer. Failing to track transfers across wallets breaks the cost basis chain and may force you into FIFO by default.
The fifth error is misclassifying transaction types. Paying gas fees in ETH is a taxable disposal of ETH. Swapping reward tokens for stablecoins is a sale. Spending crypto on goods or services is a sale at fair market value. Each of these goes on Form 8949, not on Schedule 1.
For a clear explanation of which crypto events trigger capital gains versus ordinary income, see [Crypto Taxes On Yield Income: What Triggers A Taxable Event](https://altcoininvestor.com/crypto-taxes-yield-income-taxable-events/).
## How To Handle High Transaction Volume Without Filing Thousands Of Lines
If you made hundreds of swaps on a DEX or thousands of microtransactions, listing each one individually on Form 8949 is impractical. The IRS permits summary reporting. Instead of individual lines, you attach a separate statement with column totals: total proceeds, total cost basis, total adjustments, and total gain or loss.
The summary must still be separated by holding period (short-term versus long-term) and by reporting category (Box A/D, B/E, or C/F). You cannot combine a short-term gain from Coinbase with a long-term gain from Uniswap in a single summary line.
Most crypto tax software generates this summary automatically. The software imports transaction data from exchanges and wallets, calculates cost basis using your chosen method, applies the per-wallet rule, and outputs a summary statement formatted for IRS submission. You attach the summary PDF to your e-filed return or mail it with your paper return.
The key requirement is that you retain the underlying transaction records. If the IRS audits your return, you must be able to produce the full transaction log showing every acquisition date, disposal date, proceeds, and cost basis calculation. The summary is a filing convenience, not a substitute for record-keeping.
If you use software, verify that it correctly handles the per-wallet rule and does not retroactively apply Specific ID without documentation. Some platforms allow you to switch methods at filing time, but that does not satisfy IRS requirements if you did not designate lots at the time of each transaction.
## Where To Enter LP Token Redemptions, Wrapped Tokens, And Gas Fees
Liquidity pool token redemptions are capital gain events. When you deposit ETH and USDC into a Uniswap v2 pool, you receive LP tokens. The deposit itself is not taxable. When you redeem those LP tokens for the underlying assets, you are disposing of the LP tokens. The fair market value of the ETH and USDC you receive is the proceeds. Your cost basis is the fair market value of the assets you originally deposited. The difference is your gain or loss, reported on Form 8949.
Wrapped tokens (wBTC, wETH, stETH) create a gray area. Wrapping ETH into wETH or unwrapping it back is arguably a non-taxable event under the IRS's current guidance, because you retain the same economic exposure. Notice 2024-57 exempts wrapping and unwrapping from 1099-DA reporting. However, the exemption does not explicitly state that wrapping is non-taxable. Conservative filers may choose to report wrapping as a taxable swap and track separate cost basis for the wrapped token.
Paying gas fees in ETH is a taxable disposal. Each transaction that consumes ETH for gas is a sale of ETH at fair market value. If you paid 0.01 ETH in gas when ETH was $2,000, you disposed of $20 worth of ETH. The proceeds are $20, the cost basis is whatever you originally paid for that 0.01 ETH, and the difference is a capital gain or loss reported on Form 8949.
For active DeFi users, gas fees alone can produce dozens of taxable events per month. Most tax software automatically categorizes gas as a disposal and calculates the gain or loss using your selected cost basis method.
For additional guidance on tracking DeFi yield and ensuring accurate cost basis in complex LP and autocompounding strategies, see [Best Crypto Tax Software For DeFi Yield And Staking Income](https://altcoininvestor.com/best-crypto-tax-software-defi-yield-staking/).
## What To Do If You Cannot Substantiate Cost Basis
If you lost your transaction records, closed an exchange account before exporting data, or acquired crypto years ago without documentation, you may not be able to substantiate your cost basis. In that case, FIFO applies by default, and you must use the earliest possible acquisition date and the lowest defensible cost basis.
The IRS does not accept "I forgot" as a basis method. If you cannot prove what you paid, the safest approach is to estimate conservatively. Use blockchain explorers to reconstruct wallet activity. Request transaction history from exchanges, even if your account is closed. Some platforms retain records for several years.
If reconstruction is impossible, consider reporting zero basis. This results in the highest possible taxable gain, but it eliminates audit risk related to unsubstantiated basis claims. It is better to overpay than to underreport and face penalties.
For assets acquired before exchanges tracked cost basis, you may be able to use historical price data from CoinGecko or CoinMarketCap to estimate fair market value on the acquisition date. Document your methodology and retain the source data in case of audit.
## Capital Loss Harvesting And Carryforward Rules
Capital losses offset capital gains. If your total losses exceed your total gains, you can deduct up to $3,000 of net capital loss against ordinary income each year. Any excess loss carries forward to future tax years indefinitely.
This creates a tax optimization opportunity called loss harvesting. If you hold crypto that has declined in value, you can sell it to realize the loss, offset gains elsewhere, and immediately repurchase the same asset. The wash sale rule, which prohibits claiming a loss if you repurchase the same security within 30 days, does not currently apply to crypto. The IRS has not classified cryptocurrency as a security for wash sale purposes.
However, this may change. Proposed regulations have suggested extending the wash sale rule to digital assets. Until that happens, crypto loss harvesting remains a legal and effective way to reduce taxable gains.
To claim a loss, you must actually dispose of the asset. Unrealized losses (assets you still hold) do not reduce your tax liability. The loss must be reported on Form 8949 with the same detail as a gain: acquisition date, disposal date, proceeds, cost basis, and loss amount.
## The Takeaway
Form 8949 is where your crypto tax liability is calculated, line by line. Exchanges report proceeds but not basis, which means the IRS sees the sale but not the cost. If you do not document your own cost basis, you risk paying tax on 100% of proceeds. Staking rewards go on Schedule 1 as ordinary income when received, then on Form 8949 as capital gains when sold. Cost basis methods must be chosen at the time of each transaction, not retroactively at filing time. Summary reporting is allowed for high transaction volume, but you must retain the underlying records. The difference between FIFO and Specific ID can mean thousands of dollars in tax savings, but only if you document lot selection at the time of disposal. This is not optional bookkeeping. It is the legal mechanism that determines what you owe.
You have just walked through the exact columns, checkboxes, and documentation requirements that separate compliant filing from audit risk. Those rules will evolve as broker reporting expands in 2027 and beyond.
## Frequently Asked Questions
### Do I need to file Form 8949 if I only staked crypto and did not sell?
No. Staking rewards are reported as ordinary income on Schedule 1, line 8v, when you receive them. You only file Form 8949 when you later sell, swap, or spend those reward tokens. The sale creates a capital gain or loss event. Until you dispose of the staked tokens, no Form 8949 entry is required.
### What happens if my 1099-DA shows proceeds but no cost basis?
For 2025 transactions, brokers do not have to report cost basis. You must calculate and enter your own cost basis in column (e) of Form 8949\. If you leave it blank, the IRS may assess tax on the full proceeds, treating your cost as zero. This results in significantly overstated gains and potential overpayment.
### Can I use LIFO or HIFO instead of FIFO for crypto cost basis?
LIFO is not an IRS-permitted method for cryptocurrency. HIFO is a strategy applied through Specific Identification, which requires you to document which specific lot you are selling at the time of each transaction. If you cannot substantiate Specific ID with contemporaneous records, FIFO applies by default.
### How do I report hundreds of DeFi swaps without listing them individually?
The IRS allows summary reporting. Attach a statement showing total proceeds, total cost basis, and total gain or loss for each category (short-term Box B, long-term Box E, etc.). You must retain the detailed transaction records and be able to produce them if audited. Most crypto tax software generates the required summary automatically.
### Are gas fees paid in ETH reported on Form 8949?
Yes. Paying gas fees is a disposal of ETH at fair market value. Each gas payment is a taxable event with proceeds equal to the dollar value of the ETH consumed and cost basis equal to what you originally paid for that ETH. The resulting gain or loss is reported on Form 8949.
Tool mentioned above
Koinly
Koinly imports from 800+ exchanges and wallets and handles the DeFi cases most tools get wrong - rebasing tokens, LP positions, staking rewards.
[Try Koinly](https://koinly.io/?via=F6E2E35A&utm%5Fsource=affiliate)
We may earn a commission if you sign up through this link, at no cost to you. It does not change what gets recommended.
The Weekly Yield Report
You have just reviewed the exact columns, cost basis rules, and staking classifications that determine your 2026 crypto tax liability. Broker reporting requirements and IRS guidance will expand further in 2027.
Every Thursday: where crypto yield actually is - stablecoins, liquid staking and DeFi lending, with the risk named next to the rate and what changed since last week.
[Get it free every Thursday](#/portal/signup)
Free. No trade calls, no allocations, no hype. Unsubscribe in one click.
### NEAR Protocol Surges 118.2% in 30 Days on ETF Launch
URL: https://altcoininvestor.com/near-protocol-surge-118-percent-etf-launch/
Last updated: 2026-10-14T18:00:05.000Z
## NEAR Doubles on ETF Launch and Intents Growth

NEAR Protocol climbed 118.2% over 30 days to $5.37 as of October 11, 2026, according to CoinGecko. The move pushed NEAR's market capitalization to $7.02 billion and lifted the token to rank 20 among all cryptocurrencies, overtaking Stellar. The 7-day gain stood at 10.0%, while the 24-hour change registered 0.1%.
The primary catalyst was [the launch of the Bitwise NEAR ETF](https://altcoininvestor.com/near-protocol-doubles-privacy-ai-staking/) on September 29, 2026\. The fund, trading under ticker NRR on NYSE Arca, became the first U.S. spot exchange-traded product tracking NEAR Protocol. According to CoinMarketCap on October 9, 2026, the ETF received final approval from NYSE Arca and the SEC on September 24, 2026.
The price surge preceded the ETF launch by several weeks. NEAR started September near $1.80 and had already climbed above $3.50 by mid-month, according to CoinCentral on October 7, 2026\. The ETF approval on September 24 arrived after NEAR had already gained roughly 100% from its September low. The announcement accelerated an existing rally rather than initiating it.
The Bitwise NEAR ETF drew approximately $58.9 million in net inflows during its first week, according to CoinMarketCap on October 7, 2026\. SoSoValue ETF data cited by CoinGabbar showed the fund pulled $5.13 million in net inflows on October 9 alone. The fund stakes its NEAR holdings and aims to pass approximately 67% of staking rewards to shareholders, according to the same October 7 report.
## Intents Volume and AI Narrative Drive Institutional Interest

The second major driver was growth in NEAR Intents, the protocol's cross-chain trading system. Cumulative volume processed through NEAR Intents surpassed $31 billion across more than 30 blockchains by early October 2026, according to CoinMarketCap on October 9, 2026\. Weekly volume reached $1.04 billion on September 18, 2026, with a single-day peak near $300 million, taking cumulative volume to $29.5 billion at that time, per CoinCub on September 20, 2026.
NEAR Intents allows users to specify a desired outcome, such as an asset swap, while solvers execute the transaction across multiple blockchain networks. On February 23, 2026, NEAR activated a fee conversion mechanism that routes all Intents fees into open-market purchases of NEAR tokens, according to an SVRN report from September 2026\. DeFiLlama showed over $45 million per year in gross fees as of September 2026, with over $6 million protocol-retained since the fee switch, according to an independent NEAR review dated September 24, 2026.
Bitwise CEO Hunter Horsley linked investor interest to NEAR's role in enabling AI agents to manage cross-chain assets via its Intents system, according to CoinMarketCap on October 9, 2026\. A Grayscale report released during the rally period described NEAR as a platform for agentic commerce, where AI agents can request work and pay for services autonomously, per CoinCentral on October 7, 2026.
The AI narrative gained traction in part because NEAR co-founder Illia Polosukhin co-authored the 2017 transformer research paper that underpins modern large language models. An independent NEAR review noted the paper has been cited over 140,000 times as of September 24, 2026.
## Technical Upgrades and Reduced Inflation Preceded the Rally

Protocol changes in the months before the rally improved NEAR's economic structure. On October 30, 2025, NEAR's annual inflation rate was permanently reduced from 5% to 2.5%, cutting issuance roughly in half, according to an SVRN report from September 2026 and confirmed by ChangeNow on an unspecified date in 2026\. The inflation cut was followed by the February 23, 2026 activation of the Intents fee conversion mechanism.
On July 20, 2026, NEAR deployed Mainnet v2.13.0, which introduced quantum-resistant signing and automatic shard scaling, according to CoinMarketCap on October 9, 2026\. The upgrade integrated the NIST-approved FIPS-204 signature scheme, allowing accounts to rotate to quantum-safe keys in a single transaction. Dynamic resharding enables the protocol to add network capacity automatically as demand grows without manual validator coordination, per the same report.
These infrastructure upgrades positioned NEAR for higher throughput ahead of the rally. The network processed over 1 million transactions per second during testing, according to a NEAR Protocol roadmap update on January 1, 2026, as reported by CryptoNews on that date. Daily transactions on the NEAR chain frequently surpassed 8 million in 2026, with peak capacity recorded at 4,135 TPS, according to CryptoNews on October 7, 2026.
## Rally Dynamics and Liquidation Activity
The move higher was fueled in part by short liquidations. On October 5, 2026, NEAR surged 6.24% to $5.14 within four hours, driven by $110,000 in short position liquidations across Binance, Bybit, and OKX, according to Pluang on October 5, 2026\. No long liquidations were reported during that period, indicating bullish market sentiment at the time. A separate report from Pluang on October 6, 2026 noted $280,000 worth of short position liquidations across the same exchanges during a four-hour window.
According to CoinGabbar on October 1, 2026, liquidations hit $5.27 million in the 24 hours through approximately 06:00 UTC on October 1, with shorts accounting for $3.69 million and longs for $1.59 million. Binance's long/short ratio read 1.3332 at that time, while top-trader positions read 2.521, per the same report.
NEAR reached a daily high of $5.54 on October 1, 2026, then pulled back to $4.55 on October 3 and 4, according to TokenPost on October 4, 2026\. The token recovered to trade near $5.19 to $5.25 by October 6, per CoinCentral on October 7, 2026\. This volatility pattern is consistent with a crowded position unwinding after a rapid advance.
## What the Move Does Not Mean for Income-Focused Holders
The 118.2% rally does not change the fundamental case for holding NEAR as an income-generating asset. The Bitwise ETF offers staking exposure with an estimated 3.08% net staking yield for the Deutsche Börse Xetra-listed NEAR Staking ETP, according to SVRN on September 2026\. Direct staking of NEAR tokens by holders would capture the full staking reward without the ETF expense ratio, which ranges from 0.20% to over 1% for similar crypto ETF products.
The fee conversion mechanism activated in February 2026 creates a structural demand source tied to Intents volume, but the protocol remains inflationary at current usage levels. At the February 2026 channel-mix-weighted fee rate, the deflationary threshold sits at approximately $177 million in daily Intents volume, according to SVRN. The trailing 90-day daily average through February 2026 was approximately $77 million, per the same report. NEAR would need to more than double its average daily Intents volume to reach net deflation at current token prices.
For holders evaluating NEAR based on yield, the staking rate has not materially changed. For those considering NEAR for its role in cross-chain settlement or AI agent infrastructure, the rally reflects increased awareness of those use cases rather than a fundamental breakthrough in adoption. The ETF provides a new access point for traditional investors, but it does not alter the economics of holding the token directly.
## Risks and What Would Need to Hold
A 118.2% move in 30 days leaves little room for error. NEAR is trading 73.7% below its all-time high of $20.44 reached on January 16, 2022, according to CoinGecko. The current price of $5.37 would need to hold above key support levels identified by market observers. CoinGabbar on October 1, 2026 placed support at $4.566, with resistance starting at $5.585 to $5.596.
For the rally to extend, NEAR Intents volume would need to sustain or exceed the mid-September peak of $1.04 billion per week. A decline in cross-chain trading activity would reduce fee-based buyback pressure and remove a key narrative supporting the ETF inflows. CoinMarketCap noted on October 9, 2026 that NEAR Intents suffered a $3.8 million exploit on October 8, 2026, due to a bug in the deposit system. The team pledged full user reimbursement, and funds were fully recovered within 24 hours, according to TradingView on an unspecified date in October 2026.
The exploit, though resolved quickly, demonstrates operational risk in the Intents system that drives a significant portion of NEAR's value proposition. A larger security incident could reverse the institutional confidence that fueled ETF inflows.
The move would break if NEAR falls decisively below $4.566 and fails to reclaim it. That level represents the lower boundary of the range NEAR established after its September advance. A breakdown would likely trigger additional liquidations of leveraged long positions accumulated during the rally, accelerating the reversal. The speed of the ascent means the descent could match it.
The Weekly Yield Report
You have just seen how a 118.2% move was driven by an ETF launch that came after most of the rally. The timing and sequence will differ next time.
Every Thursday: where crypto yield actually is - stablecoins, liquid staking and DeFi lending, with the risk named next to the rate and what changed since last week.
[Get it free every Thursday](#/portal/signup)
Free. No trade calls, no allocations, no hype. Unsubscribe in one click.
### Profit-Taking In A Bull Market: When And How Much
URL: https://altcoininvestor.com/profit-taking-bull-market-framework/
Last updated: 2026-10-11T12:06:25.000Z
## The Hardest Decision I Make Every Cycle

In December 2017, I watched my portfolio hit a value that represented life-changing money. I had been accumulating since 2013\. Bitcoin was approaching $20,000\. Ethereum had gone from $8 to over $700\. The altcoins I held had done multiples of that. Every day I didn't sell felt like leaving money on the table. Every day I considered selling felt like stepping off a rocket mid-flight.
I sold nothing. By February 2018, that decision had cost me roughly 40% of my peak portfolio value. By November 2018, it had cost me 84%. The failure wasn't that I didn't sell at the exact top. Nobody does. The failure was that I had no framework. I was making a binary decision with a probability distribution problem.
The question is never "should I sell or hold." The question is "at what prices do I sell what percentages, and why those levels specifically." The difference between those two framings is the difference between systematic wealth extraction and emotional wreckage.
## Why Price Levels, Not Emotions
The single biggest mistake I see long-term holders make in a [bull market](https://altcoininvestor.com/bull-market/) is treating the exit decision as a single binary event. Do I sell or do I hold? This framing guarantees regret. If you sell and the price doubles, you feel like an idiot. If you hold and it crashes, you feel like an idiot. You cannot win a binary game against a continuous probability distribution.
The correct frame is scaling. You define price levels in advance. At each level, you sell a fixed percentage. You do this before the market moves, before euphoria sets in, before fear takes over. The levels are not arbitrary. They are based on your entry cost basis, your risk tolerance, your time horizon, and what you have learned from watching previous cycles.
I use a tranched framework now. I did not use it in 2017, which is why I rode the entire cycle up and 84% of the way back down. I built the framework during the 2018-2019 bear market, tested it during the 2020-2021 bull, and refined it through 2022\. It is not perfect. Nothing is. But it removes emotion from the hardest decision you will make in any cycle.
### The Levels I Use
My baseline framework uses five tranches, each tied to a specific return multiple from my average cost basis. The percentages are not equal. The closer I get to what I consider full valuation, the more I sell. This is the opposite of what emotion tells you to do, which is why it works.
At 2x my cost basis, I sell 10%. This locks in my initial capital. If the position goes to zero tomorrow, I have broken even. Psychologically, this is the most important sale. It converts the position from "at risk" to "playing with house money." The emotional weight of the position changes entirely.
At 3x, I sell another 15%. At 5x, I sell 20%. At 8x, I sell 25%. At 10x or higher, I sell another 20%, leaving me with 10% of my original position as a long-term hold. These are my personal levels. Yours will be different based on your cost basis, your conviction in the asset, and your financial situation. The point is not the specific numbers. The point is that they are defined in advance and executed mechanically.
The 2020-2021 cycle tested this framework in real conditions. Bitcoin went from $10,000 in September 2020 to $69,000 in November 2021\. My average cost basis at the time was around $6,500, built over 2018-2020\. That meant my 2x level was $13,000, my 3x was $19,500, my 5x was $32,500, my 8x was $52,000, and my 10x was $65,000\. I hit every single level except the 10x, which I missed by timing. I sold the final tranche at $58,000 on the way down, which in hindsight was better than waiting for a level that never came.
By the time Bitcoin peaked at $69,000, I had sold 70% of my position across four tranches. I still held 30%. When it crashed to $16,000 in 2022, that remaining 30% hurt, but it did not destroy me, because I had already extracted multiples of my initial capital. The 30% I held was risk I could afford. That is the entire point.
## What I Sold Too Early (And Why That Was Fine)
In the 2020-2021 cycle, I sold my first Ethereum tranche at $800, which was roughly 2x my cost basis. Ethereum went to $4,800\. I left 6x on the table for that first 10%. It felt terrible watching it run without me. Every instinct told me I had screwed up.
But the math told a different story. That 10% tranche, sold at $800, represented a locked-in gain. When Ethereum later crashed to $880 in June 2022, that early sale looked prescient. More importantly, the existence of that sale gave me the emotional stability to hold the remaining 90% longer. I had taken some profit. I was not riding the position with white knuckles. I could think clearly.
This is the second-order effect of systematic selling that most people miss. Early sales do not just lock in gains. They reduce the emotional load of the position. A 100% position at 5x creates an entirely different psychological state than a 50% position at 5x after you have already banked profits. The latter lets you think. The former makes you reactive.
I have sold too early in every cycle I have traded. In 2016-2017, I sold Bitcoin at $1,200 before it ran to $20,000\. In 2020-2021, I sold Ethereum at $800 before it ran to $4,800\. In hindsight, those sales look like mistakes. In real time, they were the correct execution of a pre-defined plan. The plan is not designed to maximize theoretical gain. It is designed to maximize realized gain while keeping you emotionally stable enough to execute the rest of the plan.
## What I Sold Too Late (And What That Cost Me)
The flip side is harder to admit. In 2017, I sold nothing. I watched Bitcoin go from $1,000 to $20,000 and Ethereum go from $8 to $1,400, and I convinced myself that "this time was different" and that we were in a paradigm shift and that the old rules did not apply. I believed the narrative. I ignored the framework I should have built.
By the time I finally sold in early 2018, Bitcoin was at $11,000 on the way down and Ethereum was at $900\. Those were not bad prices in absolute terms. But they represented a 45% drawdown from the peak for Bitcoin and a 36% drawdown for Ethereum. The opportunity cost of not selling systematically at higher levels was enormous.
The lesson was not that I should have sold everything at the top. The lesson was that I should have been selling in tranches on the way up, so that when the top came and went, I had already extracted significant value and could afford to hold the rest through volatility.
In 2021, I executed better, but I still made mistakes. I held one altcoin position too long because I was emotionally attached to the project. It was a Layer-1 protocol I had researched deeply. I believed in the technology. My cost basis was $0.40, and it ran to $3.80, which was 9.5x. According to my framework, I should have sold 90% of it across multiple tranches. Instead, I sold only 50%, because I told myself the fundamentals justified holding more.
That coin is now trading at $0.60\. The 50% I held is worth barely more than my cost basis. The lesson, again, is that conviction in fundamentals does not exempt you from taking profit. [Maximizing gains](https://altcoininvestor.com/maximize-crypto-gains/) in a bull market requires selling things you still believe in, at prices that feel too early, according to a plan that feels mechanical. If it feels comfortable, you are doing it wrong.
## The MVRV Framework For Bitcoin
For Bitcoin specifically, I overlay my tranched selling framework with on-chain data, particularly the MVRV Z-Score. This metric compares Bitcoin's market value to its realized value and adjusts for volatility. Historically, an MVRV Z-Score above 7 has marked cycle tops. A score between 3 and 5 has marked the beginning of significant distribution phases.
As of early October 2026, Bitcoin is trading around $81,000 to $86,000, according to [CoinMarketCap](https://coinmarketcap.com/) data. The MVRV Z-Score is hovering in the 3 to 4 range, which suggests we are in a distribution phase but not yet at euphoric extremes. This aligns with what I am seeing in whale behavior. Over the last five months, supply from major Bitcoin holders declined by 290,000 BTC, but accumulation has started again in recent weeks, indicating that whales have temporarily stopped selling.
This is the environment where my tranched framework earns its keep. The market is not in panic. It is not in euphoria. It is in the middle, which is where most of the bull market actually happens. Systematic selling in this phase feels wrong because the price is still moving up and the narrative is still bullish. But this is exactly when disciplined profit-taking builds wealth. You sell into strength, not into panic.
## What Could Prove Me Wrong
I do not know where this cycle tops. I do not know if Bitcoin will reach $113,000, as Citigroup projects, or if it will stall here and consolidate for months. I do not know if the macro environment (persistent inflation, geopolitical instability, potential rate hikes) will compress the cycle or extend it.
What I do know is that my framework is probabilistic, not deterministic. If Bitcoin runs to $150,000 and I have sold 70% of my position by $100,000, I will have left significant gains on the table. That is fine. The goal is not to capture every dollar. The goal is to capture enough dollars that I am financially better off, emotionally stable, and still holding a position if the asymmetric upside case plays out over the next decade.
The worst-case scenario is not selling too early. The worst-case scenario is selling nothing, riding the euphoria to a top I cannot predict, and then riding the drawdown back to breakeven or worse. I did that in 2017\. I will not do it again.
## Why This Matters For The Next Decade
Crypto is the future of money and global transactions. I believe that. I have believed it since 2013, and nothing in the last ten-plus years has changed that view. But believing in the long-term thesis does not mean ignoring the cyclical reality. Bull markets end. They always have. They always will. The four-year Bitcoin halving cycle may be evolving, as I wrote about in [previous analysis](https://altcoininvestor.com/bitcoin-liveliness-bullish/), but cyclicality itself is not going away.
The investors who build generational wealth in crypto are not the ones who hold through every cycle. They are the ones who systematically extract value in bulls, deploy it in bears, and compound over decades. Taking profit is not betraying the thesis. Taking profit is what lets you stay in the game long enough for the thesis to play out.
In 2035, I expect Bitcoin to be worth significantly more than it is today. I expect Ethereum and a handful of other protocols to be foundational infrastructure for a global financial system that looks nothing like the one we have now. But between now and then, there will be multiple cycles. There will be multiple opportunities to sell high and buy low. The framework I have built is designed to capture those opportunities without requiring me to predict tops and bottoms.
If you are reading this in October 2026 and wondering whether you should sell some of your position, the answer is probably yes. Not because I think the top is in. I do not. But because if you are asking the question, you are feeling the emotional weight of the position, and that weight will only grow heavier as the market moves. Systematic selling removes that weight. It lets you participate in the upside while protecting the downside. It converts paper gains into realized gains, which are the only kind that matter when the cycle turns.
## The Takeaway
I have been trading crypto for more than ten years. I have built a substantial portfolio from nothing twice. I have watched that portfolio drop 84% and come back stronger. The single most important lesson I have learned is this: taking profit in a bull market is not about calling the top. It is about defining levels in advance, selling fixed percentages at those levels, and trusting the framework when every instinct tells you to hold for one more leg up.
The levels I use are 2x, 3x, 5x, 8x, and 10x my cost basis, with increasing sell percentages as the multiples rise. The percentage I sell at each level is 10%, 15%, 20%, 25%, and 20%, leaving me with 10% as a long-term hold. These levels are not magic. They are the result of watching three full cycles, making every mistake once, and building a system that removes emotion from the hardest decision I make every four years.
You will sell too early. You will sell too late. You will feel regret either way. But if you sell systematically, according to a plan built before the euphoria set in, you will walk away from this cycle wealthier than you entered it. That is the only outcome that matters.
## Frequently Asked Questions
### When should I start taking profit in a crypto bull market?
Start taking profit in systematic tranches at predefined price levels based on multiples of your cost basis, not based on emotions or market sentiment. A common framework is selling 10% at 2x, 15% at 3x, 20% at 5x, 25% at 8x, and 20% at 10x or higher. The first sale at 2x locks in your initial capital and reduces emotional pressure. Begin this process as soon as you hit your first predetermined level, even if it feels too early.
### How much of my crypto position should I sell during a bull run?
Sell in increasing percentages as price multiples rise. A systematic approach involves selling 70-90% of your position across multiple price levels while retaining 10-30% for long-term asymmetric upside. The exact percentages depend on your cost basis, conviction in the asset, and financial situation. The key principle is selling more at higher valuations, which is counterintuitive but prevents riding gains back to zero in the subsequent bear market.
### What is the MVRV Z-Score and how does it help with profit-taking?
The MVRV Z-Score compares Bitcoin's market value to its realized value, adjusted for volatility. Historically, scores above 7 mark cycle tops, while scores between 3 and 5 indicate significant distribution phases. This on-chain metric helps confirm whether systematic profit-taking aligns with broader market conditions. Use it as a secondary confirmation tool alongside your predetermined price-level framework, not as a standalone timing signal.
### Why sell in tranches instead of all at once?
Selling in tranches removes the impossible burden of calling the exact top and eliminates binary regret. If you sell everything and the price doubles, you feel terrible. If you hold everything and it crashes, you also feel terrible. Tranched selling captures gains across a range of prices, locks in realized profits progressively, and reduces emotional pressure with each sale. This approach maximizes your ability to execute the rest of your plan rationally as the market becomes more volatile.
### Should I sell crypto I still believe in fundamentally?
Yes. Conviction in long-term fundamentals does not exempt a position from systematic profit-taking during bull market euphoria. Bull markets end regardless of how strong a project's technology is. Taking profit allows you to realize gains, reduce risk, and redeploy capital in the subsequent bear market at lower prices. You can retain a small position (10-30%) for long-term asymmetric upside while banking the majority of cyclical gains. Fundamentals win over years, but cycles dominate over months.
### Week in Crypto: Wallets, Yield, and the End of Airdrop Season
URL: https://altcoininvestor.com/week-in-crypto-2026-10-11/
Last updated: 2026-10-11T11:02:34.000Z
## Security Failures and the Hardware Wallet Illusion
The week started with a reminder that hardware wallets are not attack-proof. Over 7,000 D'CENT wallets lost 12.4 million XRP plus Bitcoin, Ethereum, Tron, and Stellar assets between late September and early October. The [D'CENT wallet hack](https://altcoininvestor.com/dcent-wallet-cross-chain-hack-analysis/) totaled over $20 million. What started as a drain on XRP Ledger addresses spread to five different blockchains within hours. Attackers emptied wallets across entirely different chains using a single compromised credential layer.
[](https://altcoininvestor.com/dcent-wallet-cross-chain-hack-analysis/)
D'CENT Wallet Hack: $20M Stolen Across Five Blockchains
This was not a seed phrase compromise or a phishing attack. It was a centralized point of failure in what was marketed as decentralized infrastructure. Hardware wallets protect private keys from remote exploits, but if the credential layer that authorizes transactions is compromised at the server level, none of that matters. The question the incident forces is whether non-custodial really means non-custodial when a vendor holds the authorization keys.
The timing was notable. The same week produced multiple guides on [wallet security for active yield positions](https://altcoininvestor.com/crypto-wallet-security-active-yield-positions/), hardware wallet setup procedures, and multisig alternatives for large allocations. The coverage reflects a shift in how serious allocators think about custody. You cannot earn 8% on stablecoins if you lose the principal to a wallet exploit. Security is not a footnote. It is the first line item in the yield calculation.
[](https://altcoininvestor.com/crypto-wallet-security-active-yield-positions/)
Crypto Wallet Security For Active Yield Positions
## Yield Strategies: Structural vs. Cyclical Returns
The educational content this week focused heavily on yield mechanics and what separates sustainable returns from promotional noise. The distinction that matters most is structural versus cyclical yield. Structural yield comes from protocol fees and persists across market cycles. Cyclical yield comes from token emissions and disappears when the market turns. Confusing the two [costs capital](https://altcoininvestor.com/structural-vs-cyclical-yield-crypto/).
Morpho vaults currently deliver 4-8.5% on USDC against Aave's 3.8-6.2%. That spread is not promotional. It is structural. Morpho pays more because less of the borrow spread gets captured by the protocol. The [rate improvement](https://altcoininvestor.com/morpho-lending-reviews/) holds when utilization is high, but curator risk matters more than most depositors realize. The vault curator controls which borrowers get access to your capital. If the curator approves a bad loan, you eat the loss.
[](https://altcoininvestor.com/morpho-lending-reviews/)
Morpho Lending Reviews: Rate Improvement Over Aave, Vault Risk, And Optimizer Performance
The week also brought detailed breakdowns of [stablecoin yield mechanisms](https://altcoininvestor.com/how-to-make-money-with-stablecoins/), exchange earn program risks, and the actual commission structures behind platforms advertising 3-4% on ETH. What you see advertised is not what you keep. Coinbase takes 35% of staking rewards. Kraken takes 26-30%. Lido takes 10%. Solo staking takes zero but costs you capital, hardware, and operational attention.
[](https://altcoininvestor.com/how-to-make-money-with-stablecoins/)
How To Make Money With Stablecoins: Lending, Liquidity, Yield
## Regulation and Institutional Access
Two regulatory developments shifted the boundary between compliant and grey-zone strategies. First, the CFTC proposed defining sports, politics, and weather event contracts as federally regulated swaps while explicitly excluding sportsbooks and casino games. The [proposed rule](https://altcoininvestor.com/cftc-event-contracts-swap-definition-gambling/) targets platforms like Kalshi and Polymarket. If finalized, it draws a clear line: prediction markets are swaps, casino games are not, and the distinction determines which regulator controls the activity.
Second, Robinhood disclosed its first corporate Bitcoin holding: $25 million in BTC added to its balance sheet. The [announcement](https://altcoininvestor.com/robinhood-bitcoin-treasury-income-implications/) signals institutional legitimacy for BTC treasury allocation and shifts regulated income access for retail investors who want crypto exposure through traditional brokerage accounts. The move matters less for the dollar amount than for what it says about regulatory comfort.
[](https://altcoininvestor.com/robinhood-bitcoin-treasury-income-implications/)
Robinhood Adds Bitcoin to Treasury, Signals Shift in Regulated Income Access
On the institutional infrastructure side, OKX and Intercontinental Exchange (the parent company of the NYSE) announced a joint venture to launch a tokenized US stock trading venue. The [partnership](https://altcoininvestor.com/okx-nyse-ice-tokenized-stock-trading/) follows the SEC's September 17 Innovation Exemption for tokenized securities venues. This is not a pilot. It is a licensed trading venue for onchain equities, which means dividend income and corporate actions start flowing through smart contracts instead of legacy clearing infrastructure.
[](https://altcoininvestor.com/okx-nyse-ice-tokenized-stock-trading/)
OKX and NYSE Parent Launch Tokenized Stock Trading
## The End of Airdrop Farming
LayerZero disqualified 803,093 wallets from its June 2024 airdrop. That is 59% of total claimants. The disqualification was not random. Projects now flag coordinated wallet groups through on-chain transaction patterns, funding graphs, transaction timing, and sequence matching. The [detection methods](https://altcoininvestor.com/how-airdrops-detect-sybil-wallets/) work, and they work at scale.
[](https://altcoininvestor.com/how-airdrops-detect-sybil-wallets/)
How Airdrop Sybil Detection Works: On-Chain Patterns Projects Flag
The question farmers now face is whether running parallel wallets multiplies eligibility or triggers detection. The breakeven math has shifted. Running ten wallets might earn you $5,000 in theory, but if detection disqualifies the entire cluster, you lose months of gas costs with zero recovery. The clustering methods that [disqualify 40% of claimants](https://altcoininvestor.com/airdrop-farming-multiple-wallets-worth-it/) are not secret. They are documented, reproducible, and improving.
The era of naive airdrop farming is over. What worked in 2022 and 2023 does not work in 2026\. Projects learned. Detection improved. The marginal farmer got priced out.
## Tax Season Preparation and Software Comparisons
October marks the beginning of tax preparation season for investors with complex yield positions. The coverage this week focused on what breaks when you hand multi-protocol yield wallets to tax software. CoinLedger wins on pricing, CoinTracker wins on DeFi accuracy, and Summ covers over 2,300 DeFi protocols with on-chain indexing. The [comparison](https://altcoininvestor.com/coinledger-vs-cointracker/) shows what actually breaks when you import 500+ transactions across staking, LP positions, and bridge transactions.
[](https://altcoininvestor.com/coinledger-vs-cointracker/)
CoinLedger vs CoinTracker: Protocol Coverage, Import Accuracy, And Cost Breakdown
The tax treatment of yield income varies by mechanism. Staking rewards are taxed at receipt as ordinary income. Lending interest accrues with every block. LP fees have different rules for v2 and v3 pools. The [tax treatment](https://altcoininvestor.com/crypto-taxes-yield-income-taxable-events/) of every yield mechanism determines whether you owe at the moment of accrual or at the moment of withdrawal.
TurboTax removed CSV crypto imports in 2026, which forces most yield earners to prepare transactions externally and import via Form 8949\. The workflow is documented, but it is not simple. You need software that tracks cost basis, categorizes income correctly, and exports in the format TurboTax expects.
## Mining Economics: When Selling Power Beats Mining Bitcoin
PowerCompute mined 8.1 Bitcoin in September but generated $312,000 in Q3 energy sales. The CEO was explicit: in the hottest months, selling power back to the grid earns more than mining. The [decision](https://altcoininvestor.com/powercompute-energy-sales-outpace-mining/) reflects a shift in mining economics. Owned power infrastructure is now the edge, not hashrate alone.
The same logic applies to GPU mining. Most breakeven calculators ignore hardware depreciation and difficulty increases. The real calculation accounts for mining revenue minus operating costs, plus capital recovery through hardware resale, minus the opportunity cost of holding the coin versus mining it. At current difficulty and $0.10 per kilowatt-hour electricity, most ASICs and GPUs lose to buying the asset directly.
## What to Watch Next Week
The CFTC comment period on event contract classification closes in mid-November. Watch whether platforms like Kalshi and Polymarket push back on the swap designation or accept the regulatory boundary. The distinction determines whether prediction markets operate under CFTC oversight or seek offshore domicile.
MiCA's transitional period expires July 1, 2026\. Any entity providing crypto-asset services to EU clients without a MiCA license after that date is in breach of EU law. Watch which DeFi protocols geo-block EU users and which attempt compliance. The [regulatory framework](https://altcoininvestor.com/mica-yield-strategy-europe/) shapes which yield strategies remain accessible to European allocators.
Zcash deploys post-quantum signature opcodes in January 2027\. The upgrade initially protects transparent transactions, which account for 70% of issued ZEC. Shielded payments follow in late 2027\. This is the first proof-of-stake chain to ship quantum-resistant infrastructure at scale. Watch whether other chains follow the same roadmap or wait for NIST standards to finalize.
## Frequently Asked Questions
### What was the biggest security incident this week in crypto?
Over 7,000 D'CENT hardware wallets lost more than $20 million across five blockchains (XRP, Bitcoin, Ethereum, Tron, and Stellar) between late September and early October 2026\. The attack was not a seed phrase compromise or phishing - it was a centralized credential layer failure that allowed attackers to drain wallets across entirely different chains using a single compromised access point. This exposed a fundamental flaw in what was marketed as decentralized infrastructure.
### Where can I earn the highest stablecoin yields right now?
As of October 2026, realistic stablecoin yields range from 3.6% to 8.5% APY. Morpho vaults deliver 4-8.5% on USDC compared to Aave V3's 3.8-6.2%. The premium exists because less of the borrow spread gets captured by the protocol, but curator risk matters - the vault curator controls which borrowers access your capital. Exchange earn programs like Coinbase and Kraken advertise 3-4% but take 25-35% commission on staking rewards. Solo staking or direct protocol participation keeps full yield but adds operational complexity.
### Is airdrop farming with multiple wallets still profitable in 2026?
No, not for most participants. LayerZero disqualified 803,093 wallets (59% of total claimants) from its June 2024 airdrop using cluster analysis, funding graphs, transaction timing, and sequence matching. Projects now detect coordinated wallet groups at scale. Running ten wallets might multiply eligibility in theory, but if detection disqualifies the entire cluster, you lose months of gas costs with zero recovery. Detection methods that flag 40% of claimants are documented, reproducible, and improving. The era of naive airdrop farming is over.
### What major regulatory changes happened this week?
The CFTC proposed defining sports, politics, and weather event contracts as federally regulated swaps while explicitly excluding sportsbooks and casino games. The rule targets platforms like Kalshi and Polymarket. If finalized, prediction markets operate under CFTC oversight. Separately, Robinhood disclosed its first corporate Bitcoin holding ($25M in BTC), signaling institutional legitimacy for treasury allocation. OKX and NYSE parent ICE also announced a joint venture for tokenized US stock trading following the SEC's September Innovation Exemption.
### What crypto tax software works best for DeFi yield positions?
CoinLedger wins on pricing, CoinTracker wins on DeFi accuracy for complex positions, and Summ covers over 2,300 DeFi protocols with on-chain indexing. The real issue is what breaks when you import 500+ transactions across staking, LP positions, and bridges. TurboTax removed CSV crypto imports in 2026, forcing external preparation via Form 8949\. You need software that tracks cost basis, categorizes staking rewards as ordinary income at receipt, handles LP fee accrual differences between v2 and v3 pools, and exports correctly.
### TurboTax Crypto Import: File Staking, Lending, And LP Income Without Errors
URL: https://altcoininvestor.com/turbotax-crypto-import-staking-lending-lp/
Last updated: 2026-10-11T02:03:54.000Z
## What You Will Accomplish

You will import crypto transactions into TurboTax, categorize staking and lending income correctly, and generate a complete Form 8949 that reports capital gains and ordinary income without triggering IRS scrutiny or overpaying tax.
TurboTax is an excellent filing tool. It is not a crypto reconciliation engine. It will not chase down a missing wallet, match a transfer between your own accounts, or correctly label a liquidity-pool exit. In 2026, TurboTax Online removed CSV import support for crypto transactions. The workflow now requires PDF or image uploads instead, which means you must prepare your data externally if you have any DeFi activity, staking rewards, or multi-chain transactions. A handful of trades on one exchange can go straight in. Everything else needs preparation first.
This guide walks through the full workflow: when TurboTax's built-in tools suffice, when they fail, how to prepare data using third-party software, and how to import the results correctly so your return reflects two separate tax treatments: ordinary income for [staking rewards when received](https://altcoininvestor.com/how-to-start-staking-crypto-beginner/), and capital gains when you later sell.
### Prerequisites
You need TurboTax Premier or Premium tier. The Free and Deluxe versions do not support crypto. Premier costs $89 federal, Premium costs $139 federal. Premium handles up to 20,000 crypto transactions and 10,000 stock transactions in a single import. If you have fewer than 50 transactions and they all occurred on a single exchange TurboTax directly integrates with, you may not need third-party software. If you have staking rewards, [lending income](https://altcoininvestor.com/how-to-earn-crypto-lending/), LP positions, or any DeFi activity, you will.
Gather your transaction history from every exchange, wallet, and protocol you used. This includes centralized exchange CSV exports, wallet addresses for on-chain activity, and any 1099 forms your exchange sent. The IRS now supports Form 1099-DA for digital assets, but brokers are not yet required to report cost basis information to filers. That means the cost basis reconciliation still falls on you.
## When TurboTax's Built-In Crypto Tools Suffice
TurboTax integrates directly with more than 10 centralized exchanges, including Coinbase, Kraken, Gemini, and Crypto.com. If your entire tax year involved buying on one of these platforms, holding or trading on that same platform, and selling on that same platform with no withdrawals to external wallets, TurboTax can handle this natively.
Log into TurboTax Premier or Premium. Navigate to the Federal Taxes section, then Wages and Income. Select Cryptocurrency. TurboTax will prompt you to connect your exchange account using API or by uploading a transaction history file. For supported exchanges, API connection is the cleanest path. You authorize read-only access, TurboTax pulls your transaction history, and it generates Form 8949 automatically.
This workflow assumes every transaction occurred on a single platform, TurboTax correctly identifies the cost basis for every sale, and there are no transfers between wallets you control. That assumption breaks the moment you withdraw crypto to a hardware wallet, move funds between exchanges, stake on-chain, provide liquidity to a DeFi protocol, or bridge assets to another chain.
### The Limitation: DeFi and Multi-Wallet Activity
A single afternoon of moving funds through Uniswap, parking them in a Curve pool, then bridging to Arbitrum can generate a dozen separate taxable events. TurboTax does not read on-chain activity. It does not reconcile transfers. It does not recognize that the USDC you withdrew from Coinbase is the same USDC you deposited into Aave. Every transfer TurboTax cannot match looks like a disposal with no corresponding acquisition, which means it either assigns zero cost basis, inflating your taxable gain, or flags the transaction as incomplete.
Ethereum imports do not include DeFi activity. If you provided liquidity, [earned yield on stablecoins](https://altcoininvestor.com/passive-income-stablecoins/), or participated in any protocol that issues LP tokens or autocompounding rewards, TurboTax will miss it. You need external software to reconcile this correctly.
## How to Prepare Crypto Data Using Third-Party Software
The honest, practical answer for most crypto investors: compute gains in dedicated software such as Koinly, CoinTracker, or CoinLedger, then import the results into TurboTax to file. These platforms connect to exchanges via API, import wallet activity by pasting your public address, and reconcile transfers between accounts you control. They classify staking rewards as ordinary income, LP exits as taxable swaps, and bridged assets as non-taxable transfers. TurboTax cannot do this.
### Step 1: Choose Your Crypto Tax Software
Three platforms dominate the TurboTax integration workflow in 2026:
- **Koinly:** Supports 800+ exchanges and wallets, tracks DeFi across 15+ chains, and now generates PDF reports formatted for TurboTax Online. Koinly no longer produces CSV files because TurboTax removed CSV support in January 2026\. Pricing starts at $49 for up to 100 transactions.
- **CoinTracker:** Official TurboTax partner. Offers direct API integration, which bypasses the file upload workflow entirely. CoinTracker connects to TurboTax via OAuth, pushes your Form 8949 data automatically, and handles up to 2,000+ transactions depending on your tier. The partnership covers tax years 2025, 2026, and beyond.
- **CoinLedger:** Strong DeFi support, recognizes autocompounding yield, and exports a formatted CSV that you then convert to PDF or upload as a document image. Pricing starts at $49 for up to 100 transactions.
If you have fewer than 300 transactions and most are on supported exchanges, Koinly or CoinLedger will suffice. If you have complex DeFi positions, margin trades, or frequent bridging, CoinTracker's direct integration saves time and reduces classification errors.
### Step 2: Connect Your Exchanges and Wallets
Open your chosen software and connect every account. For centralized exchanges, use API keys with read-only permissions. For wallets, paste your public address. The software will pull all on-chain activity visible on the blockchain. This includes transfers, swaps, staking deposits, staking rewards, LP deposits, LP withdrawals, and bridging events.
Review the transaction list. The software will attempt to classify each event automatically. Common misclassifications include:
- Transfers between your own wallets labeled as taxable disposals instead of non-taxable transfers.
- Staking rewards labeled as capital gains instead of ordinary income.
- LP withdrawals split incorrectly, with impermanent loss not reflected in cost basis.
- Bridging events counted as sales and reacquisitions instead of continuations of the same position.
Correct these manually. The classification you set here determines whether TurboTax treats the event as ordinary income on Schedule 1 or as a capital gain on Form 8949\. [Most tax software handles exchange trades well](https://altcoininvestor.com/best-crypto-tax-software-defi-yield-staking/). Few handle autocompounding, LP rebalancing, or cross-chain bridges correctly without manual review.
### Step 3: Generate the TurboTax-Compatible Export
Once all transactions are classified, generate the export file. For CoinTracker, you will connect directly to TurboTax in the next step and skip file generation. For Koinly and CoinLedger, generate the TurboTax report. Koinly will produce a PDF. CoinLedger may produce a CSV, which you must convert to PDF or prepare as an image upload.
If you have more than 2,200 transactions, TurboTax will only accept 2,200 transactions at a time and requires users to split files. This is a hard limit. You must divide your transaction list into separate files, import each batch sequentially, and ensure no transaction appears twice.
## How to Import Prepared Crypto Data into TurboTax
Open TurboTax Premier or Premium. Navigate to Federal Taxes, then Wages and Income, then Cryptocurrency. TurboTax will ask how you want to report your transactions. Select "Import from crypto tax software" or "Upload a file," depending on your workflow.
### Option A: Direct Import via CoinTracker
If you used CoinTracker, select "Connect CoinTracker." TurboTax will redirect you to CoinTracker's OAuth login. Authorize the connection. CoinTracker will push your Form 8949 data directly into TurboTax. Review the imported transactions. TurboTax will display a summary: total proceeds, total cost basis, total gain or loss. Verify these numbers match the summary in CoinTracker. If they do not, disconnect and re-import.
### Option B: PDF or Image Upload for Koinly, CoinLedger, or Manual CSVs
TurboTax Online's updated import flow now pushes users toward PDF or image uploads instead of the previous CSV path. If you have a PDF from Koinly or a converted PDF from CoinLedger, upload it directly. TurboTax will parse the file and populate Form 8949\. If the parsing fails or produces errors, you will need to enter transactions manually or switch to TurboTax Desktop, which still supports limited CSV workflows.
For image uploads, take clear, high-resolution photos or scans of your printed transaction summary. TurboTax uses OCR to read the data. This method is slow and error-prone for large transaction counts. Use it only if you have fewer than 50 transactions and no other option.
### What to Do if TurboTax Rejects Your File
TurboTax will reject files that do not match its expected format, contain more than 20,000 transactions, or include unsupported characters in descriptions. If your upload fails, check the following:
- File size under 10 MB.
- Transaction count under 20,000 for Premium, under 2,200 for standard import workflows.
- No special characters in asset names or transaction descriptions.
- Date format MM/DD/YYYY, not DD/MM/YYYY or YYYY-MM-DD.
If the file still fails, export a smaller batch from your tax software, or switch to CoinTracker's direct integration.
## How to Categorize Staking, Lending, and LP Income Correctly
The IRS treats staking, lending, and DeFi rewards as ordinary income at the time you receive them. This is separate from capital gains. When you stake crypto and earn new tokens as rewards, the rewards are treated as income at their fair market value at the time of receipt. If you sell or trade these tokens later, any increase in value is subject to capital gains tax.
Two separate tax events occur:
1. **Receipt of the reward:** The token you earn, or its value when you receive it, is considered taxable income. You report it on Schedule 1 as "Other Income" or on Schedule C if you are staking as a business. The fair market value at the time of receipt becomes your cost basis for that token.
2. **Disposal of the reward:** When you sell, trade, or spend the reward token, you calculate capital gain or loss using the cost basis established at receipt. Report this on Form 8949 and Schedule D.
TurboTax often misclassifies DeFi yield by treating the receipt and disposal as a single capital gain event. This inflates your taxable gain because it assigns zero cost basis to the reward. Your external tax software should separate these events. Verify this before importing. In Koinly or CoinLedger, staking rewards should appear as "Reward" or "Income" transactions with a separate "Sell" or "Trade" transaction when you dispose of them. If they appear only as "Sell" with no corresponding "Reward," your cost basis is wrong.
### Lending Income
Lending rewards follow the same two-step structure. When you supply USDC to Aave and earn interest, the accrued interest is ordinary income when you claim it or when it auto-compounds into your position. The IRS has not issued explicit guidance on whether auto-compounded DeFi yield is taxable at compounding or only at withdrawal, but the conservative approach treats each compounding event as a taxable receipt. [IRS Notice 2014-21](https://www.irs.gov/pub/irs-drop/n-14-21.pdf) establishes that cryptocurrency is property, which means every change in ownership or receipt of value is a taxable event.
When you withdraw your position and sell the earned tokens, you report capital gain or loss on Form 8949.
### Liquidity Provider (LP) Income
LP positions are the most complex. When you deposit two assets into a liquidity pool, the IRS treats this as a taxable swap of both assets for the LP token. When you withdraw, it treats the LP token redemption as a taxable swap back to the underlying assets. Any fees or rewards earned during the LP period are ordinary income when claimed. Impermanent loss is not deductible until you exit the position, at which point it affects your capital gain or loss calculation.
Verify that your tax software correctly identifies LP deposits, withdrawals, and fee claims as separate events. TurboTax will not do this automatically. It will see four separate transactions and attempt to match them as buys and sells. If your tax software does not classify LP activity correctly, you will underreport income and overreport capital losses.
## How to Generate and Review Form 8949 in TurboTax
Once your transactions are imported and categorized, TurboTax generates Form 8949 automatically. Navigate to Federal Taxes, then Tax Tools, then View Tax Summary. Scroll to Capital Gains and Losses. TurboTax will display your total short-term and long-term gains or losses. Click "View" to see the full Form 8949.
Review every line. Verify that:
- Each sale has a corresponding acquisition date and cost basis.
- Staking and lending rewards do not appear on Form 8949 unless you sold them after receiving them.
- Transfers between your own wallets do not appear as taxable events.
- LP deposits and withdrawals are classified as swaps, not as sales with zero proceeds.
If you find errors, return to your tax software, correct the classification, and re-import. Do not attempt to manually edit Form 8949 in TurboTax unless you have fewer than 10 transactions. Manual edits do not sync back to your transaction history, and you will lose the audit trail.
### What to Do if Your Cost Basis Is Missing
If TurboTax shows "cost basis not reported" or zero cost basis for a sale, you must provide it manually. This happens when you transferred crypto into an exchange from an external wallet, sold it, and TurboTax has no record of the original acquisition. Your tax software should have captured this. If it did not, locate the wallet transaction where you originally acquired the asset, note the date and price, and enter it in TurboTax as the cost basis.
Missing cost basis is the most common reason crypto filers overpay tax. The IRS assumes zero cost basis if you do not report one, which means 100% of your proceeds are taxed as gain.
## Common Errors and How to Avoid Them
Three errors account for the majority of crypto tax mistakes in TurboTax:
### 1\. Counting Staking Rewards Twice
Reporting the reward as ordinary income when received, then again as a capital gain with zero cost basis when sold. This happens when your tax software does not link the reward receipt to the later sale. You pay income tax twice on the same value. Verify that every reward transaction has a cost basis equal to its fair market value at receipt.
### 2\. Treating Transfers as Sales
When you withdraw Bitcoin from Coinbase to your Ledger wallet, that is not a taxable event. It is a transfer between accounts you control. TurboTax cannot determine this automatically. If your tax software does not match the withdrawal to the deposit, TurboTax will treat the withdrawal as a sale with unknown proceeds and the deposit as an acquisition with unknown cost basis. This inflates both your gains and your taxable income. [Hardware wallet transfers](https://altcoininvestor.com/how-to-set-up-hardware-wallet/) must be marked as non-taxable in your tax software before importing.
### 3\. Ignoring DeFi Protocol Interactions
Every swap, every LP deposit, every yield claim, every bridge is a taxable event. Ignoring these because they feel like "internal" moves is incorrect. The IRS does not care whether you sold ETH for USD or swapped ETH for USDC on Uniswap. Both are disposals of ETH and both trigger capital gains. If you participated in DeFi and did not track it, your return is incomplete. You will either underreport income and face penalties, or you will overreport losses and trigger an audit.
## What to Do Next
Once Form 8949 is complete and reviewed, continue through TurboTax's interview to report staking and lending income on Schedule 1\. TurboTax will prompt you for "Other Income." Enter your total staking and lending rewards as reported by your tax software. Attach a statement describing the income source if the total exceeds $10,000.
File your return. TurboTax supports e-filing for returns that include crypto. The IRS accepts Form 8949 with thousands of transactions, but if your transaction count exceeds 2,000, TurboTax may prompt you to file by mail. Do not ignore this. If you e-file a return the IRS system cannot process, it will reject the return and you will miss the deadline.
Save your transaction history, your tax software export, and your TurboTax file for at least seven years. The IRS can audit crypto returns up to six years after filing, and you will need this documentation to defend your cost basis and income classification.
## The Takeaway
TurboTax can file your crypto return. It cannot prepare it. The 2026 removal of CSV import for crypto means you must now prepare data externally, verify that staking and DeFi yield are classified as ordinary income, and import a clean Form 8949 via PDF or direct integration. The workflow works. It requires one external tool, two hours of setup, and careful review before you file. The alternative is missing cost basis, misclassified income, and either an overpaid tax bill or an IRS notice you do not want. [Real crypto income happens on-chain](https://altcoininvestor.com/currency-crisis-crypto-adoption-2/), and TurboTax was not built to read it. Prepare externally, import carefully, review completely.
## Frequently Asked Questions
### Can I import crypto transactions directly into TurboTax without third-party software?
Yes, but only if all your transactions occurred on a single exchange that TurboTax integrates with directly, such as Coinbase or Kraken, and you did not withdraw to external wallets or participate in DeFi. For staking rewards, multi-chain activity, or any on-chain transactions, you need third-party software to reconcile transfers and classify income correctly before importing into TurboTax.
### Why did TurboTax remove CSV import for crypto in 2026?
TurboTax Online shifted to PDF and image upload workflows to streamline processing and reduce formatting errors from incompatible CSV files. The change forces users to prepare data in crypto-specific tax software first, then import formatted reports. CoinTracker offers direct API integration as an alternative. This workflow change increases friction but improves accuracy when properly executed.
### How are staking rewards taxed differently from selling crypto?
Staking rewards are taxed as ordinary income at fair market value when you receive them, reported on Schedule 1\. When you later sell those rewards, any price change creates a capital gain or loss reported on Form 8949\. This is two separate tax events. TurboTax often misclassifies this by assigning zero cost basis to the sale, which inflates your taxable gain.
### What happens if TurboTax shows zero cost basis for my crypto sales?
The IRS will tax 100% of your proceeds as gain because it assumes zero cost basis when none is reported. This happens when you transfer crypto from a wallet to an exchange and TurboTax cannot match the acquisition. You must manually enter the date and price you originally acquired the asset. Missing cost basis is the most common reason crypto filers overpay tax.
### Do I need TurboTax Premium to file crypto taxes?
You need at least TurboTax Premier ($89 federal) for crypto support. Premium ($139 federal) handles up to 20,000 crypto transactions and 10,000 stock transactions. If you have fewer than 100 simple exchange transactions, Premier suffices. For high transaction counts, DeFi activity, or complex LP positions, Premium plus third-party software like Koinly or CoinTracker is the standard workflow.
Tool mentioned above
CoinLedger
CoinLedger generates tax reports that import straight into TurboTax and TaxAct, and its free tier lets you see the calculation before paying.
[Try CoinLedger](https://coinledger.io?fpr=dlr3ye)
We may earn a commission if you sign up through this link, at no cost to you. It does not change what gets recommended.
The Weekly Yield Report
You now have a complete workflow for importing staking, lending, and LP income into TurboTax without misclassifying yield or missing cost basis. Tax rules and software integrations shift every filing season.
Every Thursday: where crypto yield actually is - stablecoins, liquid staking and DeFi lending, with the risk named next to the rate and what changed since last week.
[Get it free every Thursday](#/portal/signup)
Free. No trade calls, no allocations, no hype. Unsubscribe in one click.
### Market Cap vs FDV: The Number That Costs Retail Money
URL: https://altcoininvestor.com/market-cap-vs-fully-diluted-valuation-crypto/
Last updated: 2026-10-11T00:03:20.000Z
## The Question That Should Be Asked Before Every Low-Cap Entry
A token trades at $0.50\. Its market capitalization stands at $30 million. The pitch is compelling, the roadmap credible, the team experienced. You enter the position. Six months later the project has grown revenue by 40%, gained meaningful partnerships, and delivered two major protocol upgrades. The token trades at $0.32\. You are down 36% on a thesis that proved correct.
What happened is not a mystery. The circulating supply grew from 60 million tokens to 400 million tokens. The fully diluted valuation was $300 million at the time you entered, a fact disclosed on every data aggregator but ignored in the analysis. The market capitalization stayed flat while circulating supply increased by 567%. Your position was diluted, not disproven. This is the most common loss mechanism in small-cap crypto, and it is entirely predictable if you price the unlock schedule into the entry decision rather than reacting to it afterward.
Market cap measures only the tokens already circulating. Fully diluted valuation measures what the entire supply would be worth at the current price, including every token still locked in team wallets, treasury reserves, and vesting schedules. The gap between the two is a warning about how much supply is waiting to hit the market. Where that gap is wide, dilution is structural, not accidental. The token does not need to fail for you to lose money. It merely needs to release the supply it always planned to release.
## How Market Cap and FDV Are Calculated
The formulas are simple. Market capitalization is the current token price multiplied by the circulating supply, which is the number of tokens available to trade right now. Fully diluted valuation is the same token price multiplied by the total supply, which includes every token that will ever exist under the current issuance schedule. If a token trades at $2.00 and has 50 million tokens circulating with a total supply of 500 million, the market cap is $100 million and the FDV is $1 billion. The ratio between the two is 0.1, meaning 90% of the supply has not yet entered circulation.
CoinGecko displays this ratio on every token page under the "Market Cap / FDV" field. A ratio of 1.0 means the entire supply is circulating and no further dilution is scheduled. A ratio of 0.5 means half the supply is still locked. A ratio of 0.1 means the circulating supply will need to grow tenfold to reach full dilution, and unless demand grows proportionally, the price will compress to absorb that supply. Most retail losses in tokens under $100 million market cap come from ratios below 0.3, where the unlock schedule was disclosed but not priced into the position sizing or holding period.
Worldcoin showed a market cap near $1.54 billion against an FDV of $4.25 billion in August 2024, producing a ratio of 0.36\. This meant that even if the project succeeded in every technical and adoption goal, the token price would need to absorb a threefold increase in circulating supply over the vesting period. The price could fall 50% while the project grew 200%, purely as a function of supply expansion. This is not bearish sentiment. It is arithmetic.
## Why Token Unlocks Produce Predictable Losses
Research covering more than 16,000 token unlock events found that approximately 90% created negative price pressure regardless of size, timing, or recipient category. This is not because recipients always sell. It is because the market front-runs the event. Traders initiate selling pressure nearly 30 days before the actual unlock, anticipating that some portion of newly liquid tokens will be sold and that price will adjust downward to clear that supply. The unlock itself is often the moment of maximum fear, but the price damage begins weeks earlier.
Cliff unlocks, where a large percentage of supply becomes liquid on a single date, produce immediate volatility. Linear vesting, where tokens unlock gradually over months or years, produces a slower bleed that is harder to time but compounds steadily. A typical team vesting schedule includes a 12-month cliff with 25% of allocation unlocking on that date, followed by linear monthly releases over 36 months. The cliff represents the maximum single-day dilution risk. The linear tail represents the ongoing supply pressure that continues regardless of market conditions.
Arbitrum's March 2024 unlock increased circulating supply by 87% in a single event. The token dropped more than 12% despite strong fundamentals, institutional backing, and growing protocol usage. The unlock was scheduled, disclosed, and entirely predictable. The price moved because the supply moved, and the market repriced the token to reflect the new equilibrium between available supply and current demand. This was not a failure of the project. It was the market pricing in dilution that had always been part of the tokenomics design.
When an unlock exceeds 5% of circulating supply, material price impact is likely. When it exceeds 20%, severe downward pressure is nearly guaranteed. The mechanism is straightforward. If circulating supply increases by 20% and market capitalization remains constant, the price must fall by approximately 16.7% simply to maintain the same aggregate valuation. For that price to stay flat, demand must absorb the entire new supply at the prior price level. In most cases, it does not.
### The Case Where Unlocks Do Not Crash the Price
An unlock schedule does not automatically produce a price decline. Three conditions can prevent it. First, the unlocked tokens must have immediate utility that discourages selling. Tokens that can be staked for yield, used in governance, or locked for fee-sharing are less likely to be dumped on the open market. LayerZero and Lista DAO both experienced large unlocks where significant portions of newly liquid tokens were immediately restaked rather than sold, absorbing the supply internally rather than pushing it to exchanges.
Second, the market environment matters. A token unlocking supply during a bull market, where aggregate liquidity is expanding and attention is high, absorbs new supply more easily than one unlocking during a bear market where liquidity is thin and bids are shallow. The same unlock event in different macro conditions produces different price outcomes, though the structural dilution is identical in both.
Third, the project's fundamental growth rate must exceed the dilution rate. If circulating supply grows 50% over 12 months but revenue grows 150%, the market may reprice the token upward despite dilution. This is rare in small-cap tokens, where unlock schedules are typically faster than revenue realization, but it is the only sustainable path for a token to appreciate through a heavy vesting schedule. You can find examples of this behavior in [low-cap versus large-cap risk comparisons](https://altcoininvestor.com/low-cap-vs-large-cap-crypto-risk/), where mature tokens with high circulating ratios behave differently under supply pressure than those still early in their vesting cycles.
## Worked Example: $30 Million Market Cap, $300 Million FDV
A token trades at $0.50 with 60 million circulating and 600 million total supply. Market cap is $30 million. FDV is $300 million. The ratio is 0.1\. Over the next 24 months, 540 million tokens will unlock linearly, increasing circulating supply from 60 million to 600 million. Assume market capitalization stays flat at $30 million, meaning aggregate demand neither grows nor shrinks.
At full dilution, if market cap remains $30 million and circulating supply reaches 600 million, the token price will be $0.05\. You entered at $0.50\. Your position has lost 90% not because the project failed but because the supply expanded tenfold while demand stayed constant. Even if the project grew revenue by 50% during that period, the token price fell 90% because the dilution rate far exceeded the demand growth rate. This is the default outcome for most tokens with FDV ratios below 0.2, and it is why filtering by that ratio is one of the most effective risk controls available.
If instead the project's market cap doubles to $60 million by the time full dilution is reached, the token price will be $0.10\. You are still down 80%. For the token to return to your $0.50 entry price at full dilution, the market cap must grow to $300 million, a tenfold increase in aggregate valuation. That is possible if the project becomes a category leader, but it is not the base case. Pricing a position in a 0.1 FDV ratio token means pricing in either a tenfold market cap expansion or a 90% price decline. Most investors price in neither and are surprised when the latter occurs.
## Where to Track Unlock Schedules and What to Look For
CoinGecko's tokenomics page for each asset displays the vesting schedule, allocation breakdown, and upcoming unlock dates. Tokenomist.ai provides a calendar view of major unlocks across hundreds of projects, with details on cliff versus linear releases. Token Unlocks (datawallet.com) specializes in tracking supply shock events, flagging unlocks that exceed 5% of circulating supply in a single release.
The most important data points are the unlock percentage relative to current circulating supply, the date of the next cliff event, and the monthly linear release rate if applicable. A token with 80% of supply already circulating and a 2% monthly release rate poses minimal dilution risk. A token with 15% circulating and a 50% cliff unlock in 60 days poses extreme dilution risk. The structure of the vesting schedule tells you whether the risk is concentrated in a single event or distributed over time.
For any position in a token with an FDV ratio below 0.5, the unlock schedule should be treated as a primary risk factor, equivalent in weight to liquidity depth and competitive positioning. Where unlocks are front-loaded and near-term, the position sizing should reflect the high probability of price compression before the thesis has time to prove out. Where unlocks are back-loaded and the project has 18 to 24 months to deliver revenue or usage growth, the risk is more manageable, though still structural.
Cross-referencing unlock timing with [liquidity depth in low-cap tokens](https://altcoininvestor.com/how-to-check-liquidity-low-cap-crypto/) provides a clearer picture of exit conditions. A token unlocking 30% of circulating supply into a market with $50,000 daily volume will experience more severe price impact than one unlocking the same percentage into $2 million daily volume. Liquidity absorbs or amplifies the dilution effect, and both must be measured together.
## When FDV Matters and When It Does Not
FDV matters most in tokens with vesting schedules longer than 24 months and FDV ratios below 0.3\. These are the conditions under which dilution becomes the dominant price driver, often overwhelming fundamental performance. It matters less in tokens with ratios above 0.8, where most supply is already circulating and the remaining unlock schedule is back-loaded or spread over many years. A token with 85% of supply circulating and a 1% monthly release rate will experience dilution, but that dilution is slow enough that demand growth can offset it if the project performs.
FDV also matters less in tokens where the unlocked supply has strong utility. Ethereum's transition to proof-of-stake made staking the dominant use case for ETH, meaning that new issuance was largely absorbed into staking rather than sold. Tokens with governance power, fee-sharing mechanisms, or liquidity mining incentives that reward locking rather than selling experience less price pressure from unlocks because the newly liquid supply does not immediately flow to exchanges.
Where FDV does not matter is in tokens that are already fully diluted or close to it. Bitcoin's issuance schedule is fixed and transparent, with over 93% of total supply already mined. The remaining issuance is slow and predictable, declining by half every four years. No unlock event will surprise the market because the supply curve is known decades in advance. This is why [market cap levels in crypto](https://altcoininvestor.com/demystifying-market-cap-in-crypto/) treat Bitcoin as a special case where FDV and market cap converge, removing dilution as a structural risk factor.
## The Risk Framework You Should Apply
If a token's FDV ratio is below 0.3, assume dilution will dominate price action for the next 12 to 24 months unless the project achieves exceptional demand growth. Position sizing should reflect that assumption. A 2% portfolio allocation to a 0.1 FDV ratio token is defensible if the thesis is strong and liquidity is adequate. A 10% allocation to the same token is pricing in a tenfold market cap expansion, which is not a base case for most projects.
If a single unlock event will increase circulating supply by more than 10%, expect front-running to begin 30 days before the event and price pressure to persist for 7 to 14 days afterward. This is the window in which traders who are aware of the schedule will derisk or short, and it is the window in which unaware holders experience the largest drawdowns. Monitoring unlock calendars and setting alerts for major events provides an edge simply by removing surprise.
If a token's vesting schedule includes a cliff event within the next 90 days and you are holding for fundamental reasons, consider whether the thesis will have time to prove out before the cliff hits. If the unlock arrives before the next major product release, partnership announcement, or revenue milestone, the dilution will arrive before the demand catalyst, and the price will likely compress. Timing entries after cliff events rather than before them removes the front-running risk and often provides better entry prices as the market digests the new supply.
## The Takeaway
A token trading at $30 million market cap with $300 million FDV is not the same bet as one where the two figures are close. The first is a bet that demand will grow tenfold before supply does. The second is a bet on a project with minimal dilution risk. Most retail losses in small-cap tokens come not from failed projects but from supply schedules that were disclosed, ignored, and then experienced as unexpected price declines. The market cap to FDV ratio is the single most predictive filter for avoiding those losses. Where the ratio is below 0.3, dilution is structural. Where it is above 0.8, the risk is manageable. Pricing future supply into the entry decision rather than reacting to it after the unlock turns a common loss mechanism into an avoidable one.
## Frequently Asked Questions
### What is the difference between market cap and fully diluted valuation in crypto?
Market cap is calculated by multiplying a token's current price by its circulating supply, which is the number of tokens available to trade right now. Fully diluted valuation uses the same token price but multiplies it by the total supply, including all tokens still locked in vesting schedules, team allocations, or treasury reserves. The gap between the two reveals how much supply dilution is waiting to enter the market. A token with $30 million market cap and $300 million FDV has 90% of its supply still locked, meaning holders face significant dilution risk as those tokens unlock.
### Why do token unlocks usually cause price drops?
Research on over 16,000 unlock events found that approximately 90% create negative price pressure, primarily because the market front-runs the event. Traders begin selling 30 days before scheduled unlocks, anticipating that some portion of newly liquid tokens will be sold. When circulating supply increases by 5% or more in a single unlock, material price impact is likely. When it exceeds 20%, severe downward pressure is nearly guaranteed. Even if recipients do not sell immediately, the market reprices the token to reflect the increased supply. If market cap stays flat while circulating supply grows 50%, the token price must fall roughly 33% to maintain the same aggregate valuation.
### How can I find out when a token's supply will unlock?
CoinGecko displays vesting schedules, allocation breakdowns, and the market cap to FDV ratio on each token's page. Tokenomist.ai provides a calendar view of upcoming unlocks across hundreds of projects, distinguishing between cliff events and linear releases. Token Unlocks via datawallet.com specializes in tracking supply shock events and flags unlocks exceeding 5% of circulating supply. For the most authoritative data, check the project's whitepaper or GitHub repository, which typically includes the full tokenomics schedule. Monitoring these sources and setting alerts for major unlock dates provides an edge by removing surprise from the dilution timeline.
### What is a good market cap to FDV ratio?
A ratio of 1.0 means the entire supply is circulating and no further dilution is scheduled, representing minimal risk. A ratio between 0.5 and 0.8 indicates moderate dilution risk, typical for established projects with standard four-year vesting. A ratio below 0.3 signals extreme dilution risk, where circulating supply will more than triple before full dilution is reached. Most retail losses in tokens under $100 million market cap come from ratios below 0.3, where the unlock schedule was disclosed but not priced into position sizing. Filtering for tokens with ratios above 0.5 removes the highest-dilution projects from consideration.
### Can a token price go up even with large unlocks scheduled?
Yes, if three conditions are met. First, the unlocked tokens must have strong utility that discourages selling, such as staking for yield, governance rights, or fee-sharing mechanisms. Second, the market environment must be favorable, with expanding liquidity and attention during a bull market absorbing new supply more easily. Third, the project's fundamental growth rate must exceed the dilution rate. If circulating supply grows 50% but revenue grows 150%, the market may reprice the token upward despite dilution. This is rare in small-cap tokens but possible when demand catalysts arrive before or during major unlock events.
The Weekly Yield Report
You now understand how to calculate dilution risk using market cap to FDV ratios and unlock schedules. Those ratios and schedules change every quarter as new tokens vest.
Every Thursday: where crypto yield actually is - stablecoins, liquid staking and DeFi lending, with the risk named next to the rate and what changed since last week.
[Get it free every Thursday](#/portal/signup)
Free. No trade calls, no allocations, no hype. Unsubscribe in one click.
### CoinLedger Review: DeFi Accuracy And Form 8949 Handling
URL: https://altcoininvestor.com/coinledger-review/
Last updated: 2026-10-10T23:06:47.000Z
## What CoinLedger Actually Does With Yield Positions
CoinLedger built its reputation on straightforward transaction imports from centralized exchanges. The software serves over 700,000 investors, handles 1,000+ integrations, and exports directly into TurboTax, TaxAct, TaxSlayer, and H&R Block. That integration chain works cleanly when your tax situation consists of buy-sell cycles on Coinbase or Binance.
DeFi activity changes the calculation.
Staking rewards arrive in your wallet without a corresponding sale event. Liquidity pool deposits involve two assets moving simultaneously, sometimes with an LP token minted in return. Yield farming rewards compound automatically. Cross-chain bridges transfer assets between networks, creating new cost basis questions when chains track history differently. The software must classify each event correctly or your Form 8949 overstates gains, triggers wash sale violations you did not intend, or flags negative balances that require manual reconciliation.
CoinLedger supports transaction types including swaps across decentralized exchanges, liquidity pool deposits and withdrawals, yield farming rewards, staking rewards, cross-chain bridging, and wallet-to-wallet transfers. The platform automatically pulls and classifies transactions from hundreds of blockchains. For basic staking activity on Ethereum or occasional Uniswap swaps, CoinLedger generally handles those transactions without requiring manual cleanup.
The question this review addresses is what happens when your activity extends beyond basic staking. Where does the automation break? Which DeFi structures force you into manual reconciliation? And does the cost basis calculation hold up when you test it against real multi-chain, multi-protocol yield positions?
## Staking Rewards: Income Classification And Cost Basis Accuracy

Staking rewards are taxed as ordinary income at the moment you receive them. The dollar value at receipt becomes your cost basis. When you later sell those rewards, you owe capital gains or losses on the difference between that cost basis and the sale price.
CoinLedger correctly separates the two events. Staking rewards appear as income transactions in your report, and the software assigns cost basis equal to the fair market value at the time of receipt. When you later swap or sell those tokens, the platform calculates capital gains using that basis.
This works cleanly for Ethereum staking, Cardano staking, Solana staking, and other single-asset staking mechanisms where rewards arrive as discrete deposits into your wallet. The blockchain records the timestamp, CoinLedger pulls the price data from its pricing engine, and the cost basis matches what you would expect if you manually tracked it.
Where it becomes less clean: autocompounding staking protocols where rewards are automatically restaked without generating a discrete transfer event visible on-chain. Some protocols update your balance continuously rather than issuing periodic transfers. CoinLedger relies on transaction events it can detect. If the protocol does not emit a transfer event, the software may not classify the reward as taxable income until you withdraw, which defers the tax obligation incorrectly.
Test this by comparing your wallet's staking history with CoinLedger's income report. If your wallet shows daily compounding but CoinLedger only reports one income event at withdrawal, you have a mismatch. You will need to manually add income entries for each compounding event, or accept that your income is understated for the year.
## Liquidity Pool Rewards: Multi-Asset Transactions And LP Token Handling
Liquidity pool activity involves multiple simultaneous transactions. You deposit two assets into a pool, receive an LP token in return, accrue fees over time, and eventually withdraw your position, which may now consist of different quantities of the two underlying assets.
CoinLedger tracks swaps, liquidity moves, yield farming, staking, and NFT trades on supported chains and protocols. For Uniswap v2 and v3, SushiSwap, Curve, and other major DEXes, the platform identifies LP deposits and withdrawals. It creates disposal events for the assets you deposit, recognizes the LP token as a new asset acquisition, and later reverses the process when you withdraw.
The software does not automatically track impermanent loss or fee accrual within the LP position. Fees accrue to your LP token balance, but CoinLedger does not generate taxable income entries for those fees until you withdraw the position. At withdrawal, it calculates the difference between what you deposited and what you received, treating the net gain as capital gains rather than separating fee income from impermanent loss adjustments.
This approach is simpler than granular fee tracking, but it may not align with IRS guidance if you interpret LP fees as ordinary income. Some tax professionals argue that fees earned by LPs should be treated as ordinary income at accrual, similar to staking rewards. CoinLedger does not support this classification automatically. If you want to report LP fees as ordinary income, you must manually reclassify those transactions.
For basic LP activity, this is manageable. For complex multi-protocol LP strategies involving zaps, autocompounding vaults, or cross-chain LP positions, CoinLedger requires extensive manual cleanup. Users with multi-chain LP positions report spending more time correcting data than the software saves in automation.
## Cost Basis Calculation Methods And Per-Wallet Tracking
CoinLedger offers FIFO, LIFO, HIFO, and Adjusted Cost basis calculation methods. FIFO matches the IRS default and is the safest choice for most users. LIFO and HIFO optimize for tax minimization but require consistent application across all years and all assets, which becomes difficult to maintain when you switch software or add new wallets.
As of 2025, IRS Revenue Procedure 2024-28 requires per-wallet cost basis tracking. CoinLedger implemented automatic basis reallocation transactions to comply with this rule. When you switch from universal tracking to per-wallet tracking, the software creates reallocation transactions on January 1, 2025, to ensure each wallet's cost basis matches the new methodology.
This reallocation is automatic, but it affects how gains are calculated if you transferred assets between wallets in prior years. Transfers that previously carried cost basis forward now reset basis to the transfer date, which can shift positions from long-term to short-term or vice versa.
Test this by reviewing your 2024 vs. 2025 reports for the same position. If you held an asset across multiple wallets and transferred it between them, check whether the long-term holding period survived the reallocation. If a long-term position became short-term due to the per-wallet rule, you now owe higher taxes on that disposal.
CoinLedger flags transactions as Missing Cost Basis when it detects a sale or trade without a corresponding acquisition record. This happens most often when you transfer crypto into a wallet from a source CoinLedger does not track, such as a DEX liquidity pool, a cross-chain bridge, or an off-platform OTC trade. When the software sees every platform, it can match crypto transferred into one exchange back to its original purchase, so cost basis carries across instead of resetting to zero.
The solution is to connect all wallets and exchanges you have used, or manually create cost basis entries for assets that originated outside tracked sources. CoinLedger allows you to manually enter cost basis by creating a Manual Position for any asset missing cost basis on the Transactions page.
## Form 8949 Output: Lot Allocation And Wash Sale Reporting
CoinLedger follows IRS guidelines and presents trades on the 8949 in the manner the IRS requires. One crypto disposal is sometimes broken down into multiple lines on Form 8949 because the software shows which cost basis lots were drawn from when calculating gains and losses.
This lot-level detail is necessary when using FIFO, LIFO, or HIFO, because a single sale may pull from multiple acquisition lots with different basis amounts and different holding periods. The IRS requires separate reporting for long-term and short-term positions, so CoinLedger splits disposals across multiple Form 8949 lines when a single sale includes both.
This is correct, but it makes your Form 8949 longer. A portfolio with 100 disposals may generate 300+ lines on the 8949 if those disposals pull from multiple lots. For most users, this does not matter because tax software imports the data electronically. If you file by paper, the length becomes a practical problem.
Wash sale detection is where CoinLedger's Form 8949 handling becomes more complicated. When you have a wash sale, even a small one, you cannot use the summary method on Form 8949\. The IRS language is clear: you can only aggregate transactions that do not require adjustments or codes. A wash sale requires code W in column f, which forces detailed reporting.
CoinLedger detects wash sales within the same wallet when you sell an asset at a loss and repurchase it within 30 days. The software applies the wash sale rule correctly in those cases, disallowing the loss and adjusting the cost basis of the replacement position.
Where wash sale detection has blind spots: across wallets and across platforms. If you sell Bitcoin on Coinbase, buy Bitcoin on a DEX 20 days later, and those two platforms are not connected in CoinLedger, the software may not detect the wash sale. If you transfer Bitcoin out of Coinbase into a self-custody wallet, sell it on Uniswap at a loss, then buy Bitcoin again on Kraken within 30 days, CoinLedger will miss the wash sale unless all three platforms are connected and the transfer provenance is intact.
Test this by reviewing your loss positions. If you sold at a loss and repurchased the same asset within 30 days, verify that CoinLedger flagged it as a wash sale. If the repurchase happened on a different platform or in a different wallet, and CoinLedger did not flag it, you need to manually adjust the loss disallowance and the replacement basis.
As of 2026, exchanges are not required to report cost basis to the IRS, so most users check Box H on Form 8949, indicating that cost basis was not reported by a broker. CoinLedger defaults to Box H for transactions where cost basis was calculated by the software rather than provided by the exchange. When you import 1099-DA proceeds data and CoinLedger calculates the corresponding cost basis, the software uses Box H. If the exchange reported both proceeds and cost basis on the 1099-DA, CoinLedger should use Box D, but this distinction depends on accurate 1099-DA imports.
## Where DeFi Complexity Breaks CoinLedger's Automation
CoinLedger's DeFi support is one of its weaker areas. If you are making occasional swaps on Uniswap or participating in basic staking activities, CoinLedger generally handles those transactions well. DeFi handling is adequate for basic activity but can require manual cleanup for more complex transactions.
Users with extensive DeFi activity, multiple wallets, cross-chain transactions, or high trading volume may find themselves spending more time reviewing and correcting data than expected.
The specific DeFi structures that require manual intervention:
**Autocompounding vaults:** Protocols like Yearn, Beefy, and Convex automatically harvest rewards, swap them, and reinvest them into the underlying position. CoinLedger sees the vault deposit and the eventual withdrawal, but it does not track the intermediate compounding events. This understates your income if each compounding event should have been classified as taxable yield, and it miscalculates your cost basis at withdrawal.
**Cross-chain bridges:** When you bridge an asset from Ethereum to Arbitrum using a bridge protocol, the asset is locked on Ethereum and minted on Arbitrum. CoinLedger sometimes interprets this as a disposal on Ethereum and a new acquisition on Arbitrum, which creates a taxable event where none occurred. The correct treatment is a non-taxable transfer, which requires manually reclassifying the bridge transaction.
**LP token migrations:** When a protocol upgrades its LP token standard, your old LP tokens are burned and new ones are minted. CoinLedger may treat this as a disposal and reacquisition, triggering capital gains. The correct treatment depends on whether the migration preserves your underlying position without changing your economic interest, which is a nuanced question that the software cannot always answer automatically.
**Stablecoin swaps on DEXes:** Swapping USDC for DAI on Curve should not generate capital gains because both stablecoins trade at one dollar. CoinLedger pulls pricing data that may show a one-cent difference between USDC and DAI at the moment of the swap, which generates a tiny capital gain or loss. Over hundreds of stablecoin swaps, these tiny gains accumulate into a reportable amount that does not reflect economic reality.
The solution in each case is manual reclassification. CoinLedger allows you to edit transaction types, adjust cost basis, and mark transfers as non-taxable. For a few transactions, this is manageable. For a portfolio with heavy DeFi activity across multiple chains, manual cleanup becomes the majority of the work.
## Pricing And Transaction Count Reality Check
CoinLedger charges based on transaction count. Portfolio tracking is free, and tax reports are a one-time purchase per tax year. Pricing tiers are $49 for up to 100 transactions, $99 for up to 1,000 transactions, $199 and up for 3,000 or more. The High Volume tier costs $159 annually and supports up to 5,000 transactions. The Unlimited tier costs $299 per year with no transaction limit.
DeFi activity inflates transaction count faster than you expect. A single LP deposit counts as two disposals and one acquisition. A harvest-and-compound action counts as multiple swaps. A bridge transaction counts as a disposal and an acquisition. A wallet that executed 50 trades on centralized exchanges might have 200 transactions. A wallet that provided liquidity to three pools, harvested rewards weekly, and bridged assets twice might have 800 transactions.
Check your transaction count before purchasing. CoinLedger calculates it after you connect your wallets and exchanges. If you are close to a tier boundary, you may need to upgrade mid-year when additional activity pushes you over the limit. The software does not prorate upgrades, so you pay the full difference between tiers.
For context, [CoinTracker charges based on transaction count](https://altcoininvestor.com/cointracker-review/) with a similar tier structure, but its DeFi handling is more robust for complex LP and autocompounding positions. [Summ Crypto Tax](https://altcoininvestor.com/summ-crypto-tax/) tracks 2,300+ DeFi protocols with on-chain indexing and handles multi-chain yield positions with less manual cleanup, but at a higher price point.
## Who Should Use CoinLedger And Who Should Not
CoinLedger works well for the following profiles:
**Centralized exchange traders with occasional DeFi activity.** If most of your transactions happen on Coinbase, Binance, or Kraken, and you occasionally stake ETH or swap on Uniswap, CoinLedger handles this cleanly. The software imports exchange data accurately, tracks basic staking rewards, and classifies swaps correctly.
**Single-chain stakers.** If you stake ETH, ADA, SOL, or other single-asset staking tokens and do not participate in liquidity pools or yield farming, CoinLedger's staking reward handling is accurate and requires minimal manual intervention.
**Low-transaction-count portfolios.** If you execute fewer than 1,000 transactions per year, the $99 tier is competitively priced. The software's integration with TurboTax and other consumer tax platforms makes filing straightforward.
CoinLedger is a poor fit for the following profiles:
**Multi-protocol yield farmers.** If you provide liquidity across multiple DEXes, use autocompounding vaults, or participate in complex yield strategies involving multiple tokens and multiple chains, CoinLedger requires extensive manual cleanup. The time cost of reconciliation outweighs the software cost savings compared to alternatives with better DeFi indexing.
**Cross-chain bridge users.** If you frequently bridge assets between Ethereum, Arbitrum, Polygon, Optimism, and other L2s or sidechains, CoinLedger's tendency to classify bridges as taxable disposals creates reconciliation work that more expensive software handles automatically.
**High-frequency traders with wash sale exposure.** If you trade the same assets frequently across multiple wallets and platforms, CoinLedger's wash sale detection has blind spots that create audit risk. You will need to manually review every loss position to verify wash sale compliance.
## The Takeaway: CoinLedger Is A Budget Option That Costs Time On Complex Portfolios
CoinLedger delivers accurate cost basis calculations and clean Form 8949 output for portfolios that stay within centralized exchanges and basic staking. The software's pricing is competitive, its integration with consumer tax platforms is seamless, and its customer support is responsive.
The cost shows up in time, not dollars, when your portfolio includes multi-chain yield positions, autocompounding vaults, cross-chain bridges, or high-frequency trading across multiple wallets. The software flags transactions that need manual review, but it does not provide enough context to resolve those flags without consulting blockchain explorers, transaction logs, and protocol documentation.
If you are evaluating CoinLedger, calculate your transaction count first, then estimate how many of those transactions involve DeFi protocols. If more than 20% of your transactions are DeFi-related, test CoinLedger's classification accuracy during the free portfolio tracking phase before purchasing a tax report. If the manual cleanup exceeds two hours, consider whether [software with better DeFi indexing](https://altcoininvestor.com/best-crypto-tax-software-defi-yield-staking/) saves you enough time to justify the higher cost.
The income mechanism at stake is simple: incorrect transaction classification inflates your tax bill or creates audit risk. Software choice determines how much of your yield you keep after reporting. CoinLedger works when your activity is simple. It breaks when your activity reflects the actual complexity of multi-chain DeFi income.
For readers building yield positions across multiple protocols and chains, the baseline question is not whether CoinLedger can import your transactions. It is whether the software classifies them correctly without requiring you to become your own DeFi tax accountant. The answer depends on which protocols you use, which chains you operate on, and how much time you are willing to spend reconciling edge cases that more expensive software handles automatically.
## Frequently Asked Questions
### Does CoinLedger correctly separate staking rewards as ordinary income from capital gains when I sell those rewards later?
Yes, CoinLedger classifies staking rewards as ordinary income at the moment of receipt and assigns cost basis equal to the fair market value at that time. When you later sell or swap those rewards, the software calculates capital gains using that basis. This works cleanly for Ethereum, Cardano, Solana, and other single-asset staking where rewards arrive as discrete wallet deposits. Autocompounding protocols that update balances without emitting transfer events may require manual income entries.
### How does CoinLedger handle liquidity pool fees and impermanent loss for tax reporting?
CoinLedger tracks LP deposits and withdrawals but does not automatically generate income entries for fees that accrue within the position. At withdrawal, it calculates the net difference between deposited and received assets, treating the entire gain as capital gains rather than separating fee income from impermanent loss. If you want to report LP fees as ordinary income at accrual, you must manually reclassify those transactions. This approach simplifies reporting but may not align with all tax professional interpretations of LP fee treatment.
### Can CoinLedger detect wash sales across multiple wallets and exchanges?
CoinLedger detects wash sales within the same wallet when you sell at a loss and repurchase within 30 days. Across wallets and platforms, detection depends on whether all sources are connected in CoinLedger and whether transfer provenance remains intact. If you sell Bitcoin on Coinbase, transfer to a self-custody wallet, sell on Uniswap at a loss, then rebuy on Kraken within 30 days, CoinLedger may miss the wash sale unless all three platforms are connected. Manual review of loss positions is necessary for multi-wallet portfolios.
### What DeFi transaction types require manual cleanup in CoinLedger?
Autocompounding vaults like Yearn or Beefy require manual tracking of intermediate compounding events. Cross-chain bridges may be misclassified as taxable disposals instead of non-taxable transfers. LP token migrations during protocol upgrades can trigger false capital gains. Stablecoin swaps on DEXes generate tiny gains from one-cent price differences that accumulate over hundreds of transactions. For portfolios with heavy DeFi activity across multiple chains, manual reclassification becomes the majority of the reconciliation work.
### How does per-wallet cost basis tracking affect my tax calculation in CoinLedger?
As of 2025, IRS Revenue Procedure 2024-28 requires per-wallet cost basis tracking. CoinLedger creates automatic basis reallocation transactions on January 1, 2025, to comply. This affects positions held across multiple wallets in prior years. Transfers that previously carried cost basis forward now reset basis to the transfer date, which can shift holdings from long-term to short-term classification. Review your 2024 vs. 2025 reports for the same positions to verify whether long-term holding periods survived reallocation.
The Weekly Yield Report
You have just seen where CoinLedger handles yield accurately and where it breaks on multi-chain portfolios. Those protocols and that complexity change every quarter.
Every Thursday: where crypto yield actually is - stablecoins, liquid staking and DeFi lending, with the risk named next to the rate and what changed since last week.
[Get it free every Thursday](#/portal/signup)
Free. No trade calls, no allocations, no hype. Unsubscribe in one click.
### Free Crypto Tax Software: Transaction Limits And What You Lose
URL: https://altcoininvestor.com/free-crypto-tax-software/
Last updated: 2026-10-10T21:06:12.000Z
## What The Free Tier Actually Gives You
Every crypto tax software company offers a free tier. The question is not whether one exists. The question is whether that free tier works for your transaction history, or whether it breaks before you get a usable tax report.
Koinly lets you import and calculate up to 10,000 transactions without paying. You can preview your exact capital gains, connect unlimited exchanges and wallets, and use the full suite of tax optimization tools. What you cannot do is download the report. The entire tax picture sits on your screen, fully calculated, but locked behind a $49 paywall for the simplest portfolios.
CoinTracker caps free users at 100 transactions per year, with a 200,000 lifetime transaction limit. For someone testing a new platform or holding a few assets on Coinbase, that works. For anyone with staking rewards, DeFi activity, or regular rebalancing, it does not.
CoinLedger takes a different approach. The free tier has no transaction cap. You can import unlimited wallets, preview capital gains, and reconcile every transaction in your history. The only feature behind the paywall is the downloadable report itself. You see the entire tax calculation before you decide whether to pay $49 to file it.
Three platforms. Three entirely different definitions of what "free" means. The income implication is simple: if you pick the wrong one for your activity level, you waste time reconciling transactions you cannot export, or you hit a paywall before you confirm the tool handles your DeFi history correctly.
## Where Transaction Caps Actually Hit
Transaction limits sound straightforward until you count what qualifies as a transaction. A simple stablecoin transfer between wallets is one transaction. A leveraged yield farm entry on Arbitrum might generate six: the deposit, the token swap, the liquidity provision, the receipt of LP tokens, the staking action, and the reward claim. Every action that touches the blockchain counts.
Koinly counts transactions cumulatively across your entire wallet history. Import a wallet you used in 2021, and every transaction from that year still counts toward your limit today. This matters for anyone who held assets on multiple chains or rotated between wallets. A wallet imported in 2021 with 2,000 transactions reduces your remaining free tier by 2,000, even if you never used it again.
CoinTracker's 100-transaction yearly limit tolerates very little activity. Staking rewards count fully on the free tier. A validator running Ethereum staking on Lido accrues one reward transaction per epoch. That is one transaction every 6.4 minutes when rewards are distributed. Weekly reward claims across a year generate 52 transactions before you execute a single trade.
CoinLedger claims no transaction cap on the free tier, but the practical limit is reconciliation time. You can import 50,000 transactions if your wallets generated them. Whether the software correctly categorizes all of them is a separate question. Automated categorization works for exchange trades and simple staking. It struggles with liquidity pool rebalancing, cross-chain bridges, and rebasing tokens. The larger the transaction count, the more manual review you need before the preview is accurate.
## What Fails First When You Go Over The Limit

The first failure is not always obvious. Koinly does not lock you out when you exceed 10,000 transactions. It continues calculating. The portfolio tracker still updates. The tax optimization tool still runs. What disappears is access to the report download. You can reduce your billable transaction count by grouping exchange fills, deleting spam tokens, or filtering dust, and Koinly recalculates in real time. Many users discover their actual billable count is 30% lower than the raw transaction number from their exchange.
CoinTracker stops generating any tax preview once you pass 100 transactions on the free tier. You can still connect wallets and view transaction history, but the capital gains calculation disappears. The free tier becomes a demo. To see whether CoinTracker correctly handles your DeFi positions, you must upgrade to the $59 Starter plan first.
CoinLedger allows full reconciliation at any transaction count, but users report that DeFi accuracy declines past 1,000 transactions without manual corrections. The software reads on-chain history and labels common actions like swaps, staking, and liquidity adds. Complex DeFi interactions, particularly on newer Layer 2 chains or protocols outside the top 100 by TVL, often require manual categorization. The free tier gives you the tools to fix those errors, but it does not eliminate the work.
### DeFi Support On Free Tiers
DeFi support exists on all three platforms, but the quality differs. Koinly supports over 7,000 DeFi protocols across 80+ smart contract blockchains. That breadth matters for users rotating between Arbitrum, Optimism, Base, and Polygon. The free tier includes the full DeFi transaction parser. You see exactly how Koinly categorized each liquidity add, each yield claim, each cross-chain bridge before you pay.
CoinTracker handles mainstream DeFi correctly. Uniswap swaps, Aave deposits, Compound borrows, and Lido staking all import and categorize without manual edits. Newer protocols and niche chains require more oversight. Users running strategies on Velodrome, Pendle, or GMX report higher rates of miscategorization, particularly around autocompounding vaults and options settlement. On the free tier, you cannot verify whether those categories are correct because the preview stops at 100 transactions.
CoinLedger includes DeFi and NFT support in the free tier, despite conflicting claims in older documentation. You can import wallet activity from any EVM chain, preview the categorization, and manually adjust transactions that the software missed. What you lose without paying is the ability to export that work into a form your accountant or the IRS can read.
For anyone earning DeFi yield in economies where stablecoin savings accounts replace failing local banking, this limitation has direct compliance risk. A miscategorized liquidity withdrawal might be treated as a taxable disposal instead of a neutral transfer. That error compounds across dozens of transactions. The free tier shows you the error exists, but you cannot generate the corrected report without upgrading.
## Cost Basis Method Restrictions And Why They Matter
Cost basis method selection determines your tax bill. FIFO assumes you sold your oldest coins first. LIFO assumes you sold your newest. HIFO picks the highest-cost coins to minimize capital gains. The difference between methods can shift your tax liability by thousands of dollars on an identical transaction history.
Koinly does not restrict cost basis methods by pricing tier. FIFO, LIFO, HIFO, and Specific ID are available on every plan, including the free tier. You can test each method in the capital gains preview, compare the results, and choose the one that minimizes your tax burden before paying for the report. That flexibility matters most in jurisdictions that allow method selection per asset or per year.
CoinTracker restricts per-year cost basis method selection to the Ultra plan, priced at $599 for up to 10,000 transactions. Lower tiers, including the $59 Starter and $199 Prime plans, let you choose one global method, but you cannot apply FIFO to 2023 and HIFO to 2024\. For traders managing multi-year positions or rebalancing strategies across tax years, that restriction removes a significant optimization lever.
CoinLedger supports multiple cost basis methods without tier restrictions, but applying them requires the paid plan because the free tier does not export reports. You can preview the impact of each method, but you cannot file based on that preview.
For users in countries with flexible tax reporting rules, method selection is the difference between a refund and a payment. In the United States, taxpayers can select FIFO, LIFO, HIFO, or Specific ID as long as they apply it consistently within each tax year. Koinly's free tier allows experimentation. CoinTracker's does not.
## When Free Tools Stop Working For Your Activity Level
Free tools work for portfolios with fewer than 100 transactions per year, minimal DeFi exposure, and single-exchange holdings. That describes a shrinking segment of crypto users. Staking rewards alone push most holders past 100 transactions. Running a yield strategy on two protocols generates 200 transactions in a quarter. Rotating liquidity between pools during a volatile market creates 500 transactions in a month.
Koinly's free tier handles higher transaction counts better than competitors, but it still breaks at the reporting stage. You can import 8,000 transactions, preview the exact tax owed, identify errors in categorization, and optimize cost basis selection. You cannot file. The $99 tier covers 1,000 transactions and includes all report downloads. That tier accommodates most individual stakers and light DeFi users. Above 3,000 transactions, the $199 Trader plan becomes necessary, and costs climb $10 per additional 1,000 transactions beyond the tier cap.
CoinTracker's pricing scales with activity, but the jump from free to paid is steep. The $59 Starter plan gives you 100 transactions. For anyone running DeFi strategies or holding staking positions, that cap is reached in weeks. The $199 Prime plan covers 1,000 transactions, which works for moderate activity. Heavy DeFi users need the $599 Ultra plan for 10,000 transactions, and that pricing makes CoinTracker one of the more expensive options at high transaction volumes.
CoinLedger offers better pricing at mid-tier volumes. At 1,000 transactions, CoinLedger charges $99 where competitors charge $199\. Above 3,000 transactions, the gap narrows, and other platforms become cost-competitive again. The free tier's value is not in avoiding payment entirely. It is in confirming that CoinLedger handles your specific transaction types before you commit to a purchase.
There is a fourth option that almost no one discusses: Awaken offers free downloadable reports for up to 300 transactions with no credit card required. For users who need an actual filed report and fall under that cap, Awaken removes the paywall entirely. Above 300 transactions, pricing is less competitive than Koinly or CoinLedger, but the free threshold is three times higher than CoinTracker's.
### When To Upgrade And When To Hire An Accountant
Upgrade when your transaction count exceeds the free tier and the paid tier costs less than the time you would spend manually reconciling transactions in a spreadsheet. For most users, that threshold is around 200 transactions. Below that, manual reconciliation is tedious but feasible. Above that, the error rate climbs and the time cost exceeds the software cost.
Hire an accountant when your transaction history includes complex DeFi activity that automated tools miscategorize: rebasing tokens, liquidity pool impermanent loss, cross-chain bridge transactions, NFT fractionalization, or options settlement. Accountants who specialize in crypto tax can manually review and correct categorization errors that software cannot reliably detect. The cost is higher, often $500 to $2,000 depending on transaction volume, but the compliance risk is lower.
Accountants also become necessary when your tax situation involves multiple jurisdictions, foreign exchange reporting, or income earned in cryptocurrencies that appreciated significantly between receipt and sale. Software handles straightforward capital gains. It struggles with nuanced reporting requirements that vary by country and by asset type.
For users in countries with currency instability, where stablecoin income substitutes for local savings accounts, the choice between software and an accountant often comes down to how the local tax authority treats crypto income. In jurisdictions where stablecoin yield is treated as ordinary income, software works. In jurisdictions where it is classified as capital gains, foreign exchange income, or unregulated financial activity, an accountant familiar with local precedent is safer.
## Who Each Free Tier Actually Works For
Koinly's free tier works for anyone who wants to preview their tax position throughout the year without committing to a purchase until filing season. Investors holding positions across multiple wallets, running light DeFi strategies, or testing whether Koinly supports their specific exchange integrations all benefit. The 10,000-transaction cap is high enough that most individual users will not hit it. The limitation is the report download, not the calculation.
CoinTracker's free tier works for new crypto holders with minimal activity: someone who bought Bitcoin on Coinbase, held it for six months, and sold it once. The 100-transaction cap tolerates almost no ongoing activity, which makes it useful as a demo but not as a long-term solution. The value is in testing the interface and verifying that your exchange connects correctly before upgrading to a paid plan.
CoinLedger's free tier works for users who want full reconciliation visibility before paying. You can import every wallet, categorize every DeFi transaction, preview the exact tax owed, and decide whether the tool is worth $49 only after you have confirmed it works for your portfolio. That model reduces the risk of paying for software that mishandles your transaction types.
Awaken's free tier works for users under 300 transactions who need an actual downloadable report, not just a preview. If your portfolio is simple, your transaction count is low, and you want to file without paying, Awaken delivers. Above 300 transactions, the pricing becomes less competitive, but the free threshold is the highest in the market for users who need a filed report, not just a preview.
## The Decision Rule
Start with the free tier that matches your transaction count. If you are under 100 transactions and want to test software, use CoinTracker. If you are between 100 and 300 transactions and need a downloadable report, use Awaken. If you are between 300 and 10,000 transactions and want to preview everything before paying, use Koinly or CoinLedger.
Upgrade when the free tier stops generating the output you need to file, or when manual reconciliation time exceeds the cost of the paid plan. That threshold is usually around 200 transactions for most users.
Hire an accountant when your DeFi activity includes transaction types that automated tools miscategorize, or when you operate in a jurisdiction with ambiguous crypto tax treatment. Software handles volume. Accountants handle complexity.
The free tier is not a long-term solution for active portfolios. It is a testing ground. The question is not whether you will eventually pay for software or hire an accountant. The question is which tool correctly handles your specific transaction history before you commit money to it. Free tiers answer that question. Use them.
## Frequently Asked Questions
### Can I file my crypto taxes using only free software?
Yes, if your transaction count stays under the free tier cap and you need a downloadable report. Awaken provides free downloadable reports for up to 300 transactions. Koinly and CoinLedger let you calculate taxes for free but require payment to download the report. CoinTracker caps free users at 100 transactions per year. For simple portfolios under 300 transactions, free tools work. Above that, you pay for software or spend significantly more time on manual reconciliation.
### How do staking rewards affect my transaction count?
Each staking reward is a separate transaction. Validators running Ethereum staking through Lido or similar services accrue one reward transaction per epoch. Weekly claims generate 52 transactions per year before any trades. Daily reward distributions create 365 transactions. On free tiers with low caps like CoinTracker's 100-transaction limit, staking rewards alone exhaust the free tier in months. Koinly's 10,000-transaction cap tolerates staking activity better, but you still cannot download the report without paying.
### What happens when I exceed the free transaction limit?
It depends on the platform. Koinly continues calculating your taxes and lets you preview gains, but locks the report download. CoinTracker stops showing any capital gains preview once you pass 100 transactions. CoinLedger has no transaction cap on the free tier but requires payment to export the report. In all cases, exceeding the limit does not delete your data. You either upgrade to a paid plan or export your transaction history and reconcile manually.
### Do free crypto tax tools handle DeFi transactions correctly?
Partially. Koinly supports over 7,000 DeFi protocols and categorizes most mainstream activity correctly on the free tier. CoinTracker handles common DeFi protocols like Uniswap and Aave but struggles with newer platforms and complex strategies. CoinLedger includes DeFi support in the free tier but requires manual review for non-standard transactions. All platforms miscategorize some DeFi activity, especially rebasing tokens, LP rebalancing, and cross-chain bridges. Free tiers let you identify those errors, but you need a paid plan or accountant to correct and file them.
### When should I hire an accountant instead of using free software?
Hire an accountant when your transaction history includes complex DeFi activity that software miscategorizes, such as rebasing tokens, impermanent loss, options settlement, or cross-chain bridges. Accountants are also necessary for multi-jurisdiction tax filings, foreign exchange reporting, or situations where local tax treatment of crypto is ambiguous. If your transaction count is under 1,000 and activity is limited to exchange trades and simple staking, software works. Above that, or with significant DeFi exposure, an accountant reduces compliance risk.
Tool mentioned above
Koinly
Koinly imports from 800+ exchanges and wallets and handles the DeFi cases most tools get wrong - rebasing tokens, LP positions, staking rewards.
[Try Koinly](https://koinly.io/?via=F6E2E35A&utm%5Fsource=affiliate)
We may earn a commission if you sign up through this link, at no cost to you. It does not change what gets recommended.
The Weekly Yield Report
You just compared free tiers capping at 100, 300, and 10,000 transactions across four platforms. Those limits change, and new free options appear each tax season.
Every Thursday: where crypto yield actually is - stablecoins, liquid staking and DeFi lending, with the risk named next to the rate and what changed since last week.
[Get it free every Thursday](#/portal/signup)
Free. No trade calls, no allocations, no hype. Unsubscribe in one click.
### How Render Network Node Income Works: Hardware Requirements And Actual Payout Data
URL: https://altcoininvestor.com/render-network-node-earnings-requirements/
Last updated: 2026-10-10T19:04:33.000Z
## What You Are Setting Up And What You Need To Know First

Render Network pays GPU node operators in RENDER tokens for completed rendering jobs. You connect your GPU to the network, wait for job assignments, complete rendering tasks, wait for creator approval, and receive payment in weekly epochs. The marketing pitch is passive GPU monetization. The operational reality is less predictable.
You are compensated based on OctaneBench Hours (OBh) delivered, which means your GPU's benchmark score multiplied by the compute time you contribute. Higher benchmark scores and more uptime mean more potential income, but actual payout depends on job availability, creator approval rates, and whether your hardware meets current job requirements. Payment arrives 7 to 10 days after job completion in consolidated batches to reduce transaction fees.
Before you configure Docker containers and start calculating monthly income projections, you need to understand three friction points that marketing materials do not emphasize. First, creators have 24 to 48 hours to approve completed renders, and you only get paid after approval. Rejected jobs pay nothing, even if your GPU burned electricity completing them. Second, job assignment is competitive and reputation-based, meaning new operators with identical hardware to established nodes will receive fewer assignments until reputation builds. Third, the network recently pivoted from pure 3D rendering toward AI compute infrastructure via the Dispersed.com platform, which changes hardware requirements and demand patterns in ways that are still unfolding.
This guide covers minimum hardware requirements, how job assignment and reputation scoring actually work, what operators earn after electricity costs by GPU tier, payout timing and settlement mechanics, and the specific failure modes that prevent payment even when your node is online. If you are evaluating Render node operation as an income stream, you need the cost structure and the variance data before you spend money on hardware.
## Minimum Hardware Requirements And Why VRAM Matters More Than Benchmark Score

The baseline requirement is a CUDA-enabled NVIDIA GPU with CUDA 10.1 drivers or higher, specifically driver version 566.36 minimum. AMD GPUs are not supported for the decentralized rendering network, though the new AI compute tier (launched via RNP-019 in April 2025) has begun onboarding AMD MI300X cards for enterprise workloads. For most individual node operators, you need NVIDIA hardware.
VRAM is the limiting factor for job assignment. The official documentation recommends 6GB minimum and 8GB+ preferred, but real job requirements frequently exceed that floor. Rendering jobs for complex 3D scenes, particularly those with high-resolution textures or large particle systems, require 10GB to 12GB VRAM to complete without errors. If your GPU has 6GB VRAM, you will be excluded from a significant portion of available jobs, which directly reduces your income opportunity regardless of how high your OctaneBench score is.
System memory and storage requirements are equally specific. 32GB+ RAM is the recommended minimum, with 64GB+ required for the AI compute tier. Storage needs 100GB free disk space minimum, with SSDs strongly preferred over mechanical drives for faster read/write speeds during scene file loading and render output writing. For AI compute nodes, storage requirements jump to 2TB+ SSD.
Network bandwidth must support 100 Mbps+ download and 75 Mbps+ upload. Rendering jobs involve downloading large scene files (often several GB) and uploading completed render frames, so insufficient upload speed creates bottlenecks that delay job completion and reduce your effective throughput. If your residential internet connection has asymmetric speeds (common with cable providers offering 200 Mbps down but only 10 Mbps up), you will struggle to complete jobs quickly enough to remain competitive.
The GPU compute tier introduced in late 2025 requires a compute score at or above the RTX 3050, from recent GPU generations up to RTX 5090, plus 64GB+ RAM, 2TB+ SSD, Windows/WSL or Linux OS (Ubuntu 22.04 or 24.04 preferred), and Docker plus NVIDIA Container Toolkit installed. This is a meaningfully higher hardware threshold than the baseline rendering tier, but it also targets different workloads with different demand profiles.
Most gaming PCs built in the last three years meet the baseline requirements for rendering nodes. The incremental cost to upgrade an existing system is approximately $560 if you need to add RAM and SSD capacity, excluding the GPU itself. If you are buying hardware specifically to run a Render node, the economics change substantially because you must amortize the full GPU cost against uncertain income.
## How Job Assignment Works And Why Reputation Scoring Determines Your Queue Position
Jobs are assigned to nodes based on four factors: OctaneBench score, availability and uptime, scene complexity and hardware requirements, and creator reputation score. The system is not first-come-first-served. Higher-reputation creators can run more concurrent jobs and receive priority in the allocation queue, which means their jobs get assigned to available nodes faster. Higher-reputation node operators similarly receive preferential assignment when multiple nodes have comparable hardware.
Your OctaneBench score determines your theoretical earning capacity per hour, but it does not guarantee job flow. A node with an RTX 4090 (OctaneBench \~650) will earn more per completed job than a node with an RTX 3060 (OctaneBench \~250), but only if both nodes receive equivalent job volume. In practice, job assignment favors nodes that have completed more jobs successfully, which creates a cold-start problem for new operators.
Reputation scoring penalizes job failures. If a creator rejects your output due to rendering errors, incomplete frames, or quality issues, your reputation score decreases. Excessive failures lead to quarantining, which temporarily or permanently removes your node from the assignment pool. This creates operational risk that persists even after you have configured your hardware correctly, because rendering errors can result from scene file issues, driver incompatibilities, or VRAM exhaustion on specific workloads.
Common reasons for receiving no job assignments include low network demand, weak benchmark score relative to other active nodes, insufficient GPU VRAM for current job types requiring higher memory, and client misconfiguration or offline status. The first reason is demand-side and outside your control. The others are configuration and hardware issues you can address, but only if you understand that job assignment is competitive and that your node is evaluated relative to the current active pool, not against a static threshold.
Network demand volatility is the largest uncontrollable variable. Render Network processed 530,171 RENDER tokens in burns from January through September 2025, compared to 139,924 during the same period in 2024, representing a 279% year-over-year increase in job-related token consumption. That is evidence of real demand growth, but it does not distribute evenly across all nodes or time periods. Seasonal patterns in 3D production (higher demand during film and game production cycles), platform-specific adoption (Maya, Blender, Cinema4D users have different rendering needs), and the ongoing shift toward AI workloads all create variance in which GPU tiers receive job flow.
## Payout Timing, Settlement Mechanics, And The 7-10 Day Cash Flow Delay
Once you complete a rendering job, you do not receive payment immediately. Creators have 24 to 48 hours to review and approve the output. Payment is contingent on approval. If the creator rejects the job, you receive nothing for the compute time and electricity your GPU consumed. This is the single largest income variance factor for node operators, and it is not disclosed in most earnings projections.
After approval, payouts occur in weekly epochs. The Render Network consolidates payments every 7 to 10 days to reduce on-chain transaction fees. This creates a cash flow delay that matters if you are running nodes as a business with monthly electricity costs. You complete work in week one, wait for creator approval in week one or two, receive consolidated payment in week two or three, then convert RENDER tokens to stablecoins or fiat, incurring exchange fees and potential slippage if you need to sell into low liquidity.
The token you receive is RENDER (ERC-20), currently trading at approximately $2.03 as of October 2026 according to [CoinMarketCap data](https://coinmarketcap.com/currencies/render-network/). Market cap is approximately $999M with 520M circulating supply. Token price ranged from $3.00 in January 2026 down to $1.29 mid-year, recently testing $1.99-$2.10 levels. If you are calculating monthly income in dollar terms, you are exposed to RENDER price volatility between job completion and token sale, which can swing your effective earnings by 20-40% in a single settlement cycle during volatile periods.
The payment structure uses the Burn-and-Mint Equilibrium (BME) model approved by governance in 2023\. Creators pay for rendering jobs in RENDER tokens, which are burned. Node operators receive newly minted RENDER as rewards. The network has a maximum supply of 644.2 million RENDER, with approximately 85 million remaining to be emitted as of September 2025\. Emissions decrease over time and are governed annually via Render Network Proposal (RNP) votes. Approximately 2.7 million RENDER have been issued as node operator rewards to date, excluding grants and migration incentives.
A 5% protocol fee is applied to every job, funding network operations via OTOY, the primary service provider maintaining core infrastructure. This fee is deducted before you receive payment, which means advertised job rates are pre-fee, and your actual payout is 5% lower. Combined with the 7-10 day settlement delay, misconfigured wallet addresses (a common operator error that delays first payout), and approval rejection risk, the effective time-to-cash for a new node operator is often 14 to 21 days from first job completion.
## Realistic Earnings By GPU Tier And Why Electricity Cost Matters More Than You Think
Earnings projections in Render marketing materials and community forums frequently cite $50 to $150 per day as achievable income. That range is not universal and depends on GPU tier, job availability, approval rates, and operational costs. The $150 figure represents top-tier GPUs (RTX 4090, RTX 5090) during high-demand periods with near-perfect approval rates and maximum utilization. The $50 figure represents mid-tier GPUs (RTX 3060, RTX 3070) during average demand with normal approval variance.
Profitability is determined by number of GPUs running, equipment type and OctaneBench score, tier assignment, and operational expenses including electricity. An RTX 3060 consumes approximately 170W under full rendering load. Running 24/7 at $0.12/kWh (U.S. average residential electricity rate) costs $14.69 per month in electricity. An RTX 4090 consumes approximately 450W under load, costing $38.88 per month at the same rate. If your local electricity rate is $0.20/kWh (common in California, New York, or Europe), those costs rise to $24.48 and $64.80 respectively.
Net income is gross RENDER earnings minus electricity cost minus hardware amortization if you purchased equipment specifically for node operation. If you earn $50 per day gross with an RTX 3060, that is $1,500 per month before costs. Subtract $15 in electricity and you net $1,485\. But if you bought a $329 RTX 3060 specifically for this purpose, you need 0.22 months to break even on hardware, assuming income remains constant. If you earn $30 per day (realistic during lower-demand periods or as a new operator building reputation), gross monthly is $900, net is $885, and hardware payback extends to 0.37 months.
The income range depends heavily on whether you already own the GPU for other purposes (gaming, content creation) or whether you are purchasing hardware specifically for node operation. If the GPU is already owned and would otherwise be idle, incremental income is high because your only marginal cost is electricity. If you are buying hardware specifically for Render income, you must model multiple scenarios including low-demand periods, approval rejection rates, and reputation build time before you reach steady-state job flow.
Network utilization rates reported by the Render Foundation are 85-95% for active nodes as of 2026, with 5,600 cumulative node operators and 65 million frames rendered lifetime. That utilization figure applies to nodes receiving jobs, but it does not include nodes that are online and available but not receiving assignments due to low demand or insufficient hardware specs relative to current job requirements. The distinction matters because your node can be online and correctly configured but still earn zero if job demand is concentrated in higher VRAM tiers or AI workloads your GPU cannot handle.
## The AI Compute Pivot And What It Means For GPU Node Economics Going Forward
In April 2025, governance proposal RNP-019 passed, enabling a dedicated RENDER rewards framework for a network of decentralized GPUs designed for general-purpose and AI workloads. This network is separate from the existing 3D rendering network, targeting machine learning inference, training workloads, and compute-intensive AI tasks rather than traditional 3D frame rendering.
The Dispersed.com platform launched in December 2025, onboarding enterprise-grade NVIDIA H200 and AMD MI300X GPUs. These are not consumer gaming GPUs. H200 cards cost $30,000+ and are designed for data center deployment with 141GB HBM3e memory, 4.8TB/s memory bandwidth, and 1000W TDP. This is a fundamentally different hardware and economics tier than the RTX 3060 nodes that make up the majority of the decentralized rendering network.
For individual node operators, the AI compute tier represents a higher capital barrier but potentially more stable demand. Traditional 3D rendering is project-based and seasonal, tied to film production schedules, game development cycles, and architectural visualization contracts. AI inference and training workloads run continuously, particularly for applications like large language model hosting, image generation APIs, and real-time recommendation systems. If the network successfully captures enterprise AI compute demand, utilization rates and income predictability improve, but only for operators who can afford and operate enterprise-grade hardware.
The pivot also introduces new competitive dynamics. Tier 1 nodes in the Render ecosystem are centralized partners operating data center infrastructure at AWS-equivalent rates. They provide baseline capacity and reliability guarantees that decentralized Tier 2 and Tier 3 nodes cannot match. If a creator or AI compute customer needs guaranteed availability and SLA-backed performance, they pay for Tier 1\. Decentralized nodes compete on price, offering 30-50% cost savings according to Render's market positioning, but with variable availability and no uptime guarantees.
For node operators considering entry in 2026, the question is whether to target the legacy 3D rendering network with consumer GPUs (RTX 3060 to RTX 4090 range, $300-$1,600 hardware cost, lower income but faster payback) or the AI compute network with enterprise GPUs (H100, H200, MI300X range, $10,000-$30,000 hardware cost, higher income but multi-year payback). The answer depends on your capital availability, electricity cost, technical operations capability, and risk tolerance for demand variance.
## Common Failure Modes And Why Nodes Go Offline Without Earning
The most common failure mode is misconfigured wallet addresses during initial setup. Node operators enter an incorrect ERC-20 address or use a wallet that does not support RENDER tokens, causing the first payout to fail. The network does not notify you immediately. You discover the problem only when the first epoch payout does not arrive, 7 to 10 days after your first completed job. Fix involves updating your wallet address in the node configuration and waiting another full epoch cycle for retry.
Driver incompatibilities cause rendering errors that lead to job rejections and reputation penalties. NVIDIA releases new drivers monthly, and some releases introduce regressions in CUDA compute stability or specific rendering engine compatibility. If you auto-update drivers without testing, you risk breaking your node mid-job, causing output corruption that creators reject. Best practice is to delay driver updates until community confirmation that the new version is stable for Render workloads, but that requires active monitoring of node operator forums and Discord channels.
Insufficient VRAM causes silent job exclusion. Your node remains online and reports as available, but it never receives assignments for jobs requiring more VRAM than your GPU has. You see zero income but no error messages because the node is not failing, it is simply not being assigned work. Diagnosing this requires comparing your GPU specs against current job requirements, which are not published in real time by the network. Community operators share anecdotal data about job VRAM requirements in forums, but there is no official transparency dashboard showing "jobs available by VRAM tier."
Network demand gaps create extended periods of zero income even for correctly configured nodes. If 3D rendering demand drops seasonally (common in summer when film and game production slows) and AI compute demand has not yet scaled to fill capacity, total job volume falls and only the highest-reputation, highest-OBh nodes receive assignments. New operators building reputation during low-demand periods can run for weeks earning zero despite being online and available.
Reputation quarantining happens after excessive job failures. The network does not publish the exact failure threshold, but community reports suggest 3-5 rejected jobs in a short period can trigger quarantine. Once quarantined, your node stops receiving assignments until you manually appeal or wait for automatic reinstatement, which can take days to weeks. During quarantine you earn nothing, and your hardware sits idle consuming electricity.
## What To Do Next: Setup, Monitoring, And The First 30 Days
If you decide to proceed, start with hardware you already own rather than purchasing GPUs specifically for Render income. This eliminates hardware payback risk and lets you measure real income over 30 to 60 days before making capital decisions. Install the required NVIDIA drivers (566.36 minimum), configure Docker and NVIDIA Container Toolkit, and follow the official onboarding process at the Render Network node operator documentation.
During setup, verify your wallet address three times before saving configuration. Use a [hardware wallet](https://altcoininvestor.com/how-to-set-up-hardware-wallet/) if you are operating multiple nodes or expecting significant monthly income, because seed phrase security matters when you are receiving recurring token payments. Set up monitoring for node uptime, job completion status, and epoch payout confirmations. The official Render Network Foundation stats dashboard at stats.renderfoundation.com shows live reward data and BME metrics, but it does not show per-node earnings in real time.
Track three metrics over your first 30 days: total jobs assigned, jobs completed and approved versus rejected, and gross RENDER earned per day. Calculate net income by subtracting electricity cost (measure your GPU wattage under load using software like HWiNFO, multiply by hours run, multiply by your kWh rate). Compare your daily average to the $50-$150 range to see where your specific GPU and reputation level falls within the distribution.
Monitor your reputation score closely. If you receive job rejections, investigate whether the cause is hardware (insufficient VRAM, driver issues, thermal throttling) or workload-specific (certain scene types fail consistently, suggesting software compatibility issues). Address hardware issues immediately because reputation penalties compound and reduce future job assignments.
After 30 days, calculate your effective hourly income. If you ran 720 hours in a month (24/7) and earned $600 gross minus $40 electricity for $560 net, your effective rate is $0.78 per hour. Compare that to alternative uses for the same GPU (gaming, content creation, local AI inference for consulting work, selling the GPU and investing proceeds in [staking](https://altcoininvestor.com/what-is-crypto-staking/) or yield-bearing stablecoins). Render node operation is only rational if it produces higher risk-adjusted returns than the next-best alternative for the same hardware and electricity budget.
## The Takeaway: Who This Works For And Who Should Wait
Render Network node operation works best for operators who already own NVIDIA GPUs with 8GB+ VRAM that would otherwise be idle, who have low electricity costs (under $0.12/kWh), who can tolerate 7-10 day payout delays and 20-40% monthly income variance, and who have technical capability to monitor node health and troubleshoot driver and configuration issues without relying on customer support.
It does not work well for operators purchasing GPUs specifically for this purpose unless you can afford 6-12 month hardware payback periods and can absorb the risk that demand shifts toward AI compute tiers your hardware cannot serve. It also does not work for operators with high electricity costs (above $0.18/kWh), who need predictable monthly income, or who cannot actively monitor and maintain node uptime and reputation.
The network is real, the demand is growing (279% YoY burn increase from January-September 2025), and the infrastructure is maturing toward enterprise AI compute workloads. But the income opportunity is not passive, it is not guaranteed, and it requires hardware and operational decisions that must be modeled against your specific cost structure and capital availability. Check your GPU's OctaneBench score, calculate your electricity cost per hour at full load, and run the first 30 days on hardware you already own before making any capital commitments.
## Frequently Asked Questions
### How much can I realistically earn running a Render Network node?
Earnings depend on GPU tier, job availability, and approval rates. Mid-tier GPUs like RTX 3060 earn $30-$50 per day during normal demand periods, while high-end GPUs like RTX 4090 can earn $80-$150 during peak demand. Subtract electricity costs ($15-$65 monthly depending on GPU and local rates) and account for 7-10 day payout delays. New operators building reputation typically earn 30-50% less than established nodes for the first 60 days.
### What happens if a creator rejects my completed rendering job?
You receive zero payment for rejected jobs, even though your GPU consumed electricity completing the work. Creators have 24-48 hours to review outputs after job completion. Rejections also damage your reputation score, which reduces future job assignments. Excessive rejections (typically 3-5 in a short period) can trigger quarantine, temporarily removing your node from the assignment pool. Track rejection rates closely and investigate hardware or configuration issues immediately if rejections increase.
### Do I need to buy a GPU specifically for Render node operation?
Only buy hardware specifically for Render if you can afford 6-12 month payback periods and can absorb income variance. Start with GPUs you already own for gaming or content creation that would otherwise be idle. This eliminates capital risk and lets you measure real earnings over 30-60 days before making purchase decisions. If buying specifically for Render, model multiple scenarios including low-demand periods and reputation build time before reaching steady-state income.
### Why does my node show as online but never receive job assignments?
Common causes include insufficient VRAM for current job requirements, low OctaneBench score relative to other active nodes, low network-wide job demand, or misconfigured client software. The network does not send error messages for VRAM exclusion because your node is not failing, it is simply not meeting job requirements. Compare your GPU specs against community-reported job requirements and verify your node is correctly registered and reporting availability to the network.
### How does the AI compute pivot affect income for consumer GPU operators?
The AI compute tier (launched via RNP-019 in April 2025) targets enterprise GPUs like NVIDIA H200 and AMD MI300X, which cost $10,000-$30,000 versus $300-$1,600 for consumer RTX cards. AI workloads may offer more stable demand than seasonal 3D rendering, but consumer-tier nodes cannot compete for those jobs. Your income depends on whether traditional 3D rendering demand remains sufficient to utilize consumer GPU capacity or shifts entirely to enterprise AI tiers over time.
Tool mentioned above
Ledger
Ledger devices display the full transaction on their own screen before you approve it, which is what stops an approval exploit at the point it matters.
[See Ledger devices](https://shop.ledger.com/?r=90612ff43561)
We may earn a commission if you sign up through this link, at no cost to you. It does not change what gets recommended.
The Weekly Yield Report
You just reviewed hardware requirements, job assignment mechanics, payout timing, and realistic monthly earnings by GPU tier for Render nodes. Those income numbers and demand patterns will shift as AI compute scales and 3D rendering demand cycles.
Every Thursday: where crypto yield actually is - stablecoins, liquid staking and DeFi lending, with the risk named next to the rate and what changed since last week.
[Get it free every Thursday](#/portal/signup)
Free. No trade calls, no allocations, no hype. Unsubscribe in one click.
### CoinTracker Review: Transaction Import, DeFi Accuracy, And Cost For Active Yield Users
URL: https://altcoininvestor.com/cointracker-review/
Last updated: 2026-10-10T17:03:43.000Z
## The Decision: CoinTracker for 500+ DeFi Transactions
You have 500 or more transactions this year. Staking rewards on three chains, LP positions on Uniswap and Curve, a handful of bridge transactions, and enough complexity that spreadsheets stopped working in March. You need software that can track cost basis, categorize income correctly, and generate the forms your tax preparer or the IRS expects. CoinTracker supports 20,000+ smart contracts and integrates with TurboTax. It also costs $199 per year on the Prime plan, misclassifies liquidity pool deposits as trades, and requires manual cleanup for L2 activity.
This review tests CoinTracker with real multi-protocol yield positions. I imported staking rewards, LP tokens, cross-chain bridge transfers, and autocompounding vault activity. I checked what synced cleanly, what broke, where manual intervention was required, and whether the pricing makes sense when the alternative is paying an accountant $150 per hour to reconstruct your transaction history from etherscan.
The choice is not whether CoinTracker is perfect. The choice is whether the time it saves justifies the subscription cost, and whether the errors it introduces are smaller than the errors you would make tracking everything manually. For users running [DeFi yield positions across multiple chains](https://altcoininvestor.com/defi-yield-tax-reporting/), that calculus depends on which protocols you use, how clean your transaction history is, and whether you can afford to miss a misclassified LP deposit.
## Transaction Import and API Sync Reliability
CoinTracker connects to exchanges and wallets via API or public address. The Coinbase integration is the cleanest in the industry. Trades, staking rewards, Coinbase Wallet activity, and Learn-and-Earn deposits import automatically and sync without duplicate transactions. Kraken, Binance.US, and Gemini connections work but occasionally miss staking entries or delay by a few hours. For centralized exchange activity, API sync is reliable enough that you can set it and check quarterly.
Wallet imports using public addresses are where friction begins. Ethereum mainnet transactions sync well. Staking rewards from Lido, Rocket Pool, and liquid staking derivatives are detected and auto-categorized. Cross-chain bridge transactions from LayerZero, Across, and Synapse import but are not always matched as transfers between your own wallets. If CoinTracker does not recognize that the sending and receiving addresses both belong to you, it treats the outbound transaction as a disposal and calculates a taxable gain. You must manually mark the pair as a transfer to preserve cost basis.
Layer-2 activity is inconsistent. Arbitrum and Optimism transactions import, but gas rebates, airdrop claims, and protocol-specific reward tokens often appear as generic deposits. Polygon works better than Base or zkSync. For newer chains like Blast or Scroll, expect to tag every transaction manually. The 20,000 smart contract count is real, but coverage skews heavily toward Ethereum mainnet and the top ten DeFi protocols by TVL.
CSV upload is available if an API connection is not supported. Upload quality depends entirely on the format your exchange or wallet provides. Uploading a CSV that overlaps with an existing API sync creates duplicate transactions. CoinTracker has a duplicate detection tool, but it misses edge cases where timestamps or transaction hashes differ slightly. Manual cleanup is required. If you are importing from a non-custodial wallet, use the public address import instead of CSV unless the wallet does not support it.
## DeFi Protocol Coverage and Known Failure Modes
CoinTracker claims coverage for over 20,000 smart contracts. In practice, this means comprehensive support for Uniswap, Aave, Compound, Curve, Convex, Balancer, and the protocols that dominated DeFi in 2021 and 2022\. Staking rewards from these platforms are auto-detected. Lending interest accrues correctly. Autocompounding vaults from Yearn and Beefy import as deposits and withdrawals, though impermanent loss and fee compounding are not itemized within the vault.
Liquidity pool positions are where CoinTracker breaks. When you deposit assets into a Uniswap V2 or V3 pool, CoinTracker often classifies the deposit as a trade. It treats the LP token you receive as the proceeds of a swap, calculates a taxable gain or loss, and records the LP token with a cost basis equal to the fair market value at the time of deposit. This is incorrect. Providing liquidity is not a taxable trade under current IRS guidance. It is a deposit. You must manually reclassify the transaction using CoinTracker's liquidity pool categories to prevent phantom gains from appearing on your tax forms.
This issue appears across Uniswap V2, SushiSwap, Curve, and Balancer. Uniswap V3 is worse because the NFT-based position structure confuses the import logic. Concentrated liquidity range adjustments and fee claims do not always sync. Manual review is required for every LP position. If you are running multiple pools or rebalancing positions frequently, budget an extra two to four hours per year to clean up LP transaction categorization.
Cross-chain activity introduces a second failure mode. Bridge transactions using Hop, Across, Stargate, or LayerZero often import as two separate events: a disposal on the source chain and a deposit on the destination chain. If CoinTracker does not recognize both addresses as yours, the outbound side generates a taxable event and inflates your reported gains. The platform has a transfer-matching feature, but it works inconsistently across bridges and requires manual confirmation. For users managing [multi-chain DeFi wallets](https://altcoininvestor.com/best-defi-wallet/), this is a recurring problem.
Autocompounding vaults and rebasing tokens add another layer of complexity. Vaults that reinvest rewards automatically do not issue individual reward transactions. CoinTracker sees only the deposit, the growth in vault token balance, and the eventual withdrawal. It calculates gain correctly on withdrawal, but it does not itemize the underlying yield events. For tax purposes this usually works, but it prevents you from separating short-term and long-term gains on the compounded rewards. Rebasing tokens like stETH and ampTokens trigger continuous microtransactions that CoinTracker may miss or group incorrectly.
## Staking Rewards, Cost Basis, and Tax Form Generation
Staking rewards are one of CoinTracker's strengths. Ethereum staking through Lido, Rocket Pool, Coinbase, and Kraken is auto-detected. Rewards are categorized as staking income, valued at the fair market price at the time of receipt, and assigned a cost basis for future disposal tracking. Cosmos, Polkadot, Cardano, and Solana staking also sync cleanly if you connect the wallet or validator address.
The Base plan excludes staking rewards from the transaction count until they generate $25 or more in proceeds per year. For light stakers this keeps you under the 100-transaction limit. For active yield users running validator nodes or liquid staking positions that compound daily, staking rewards alone will push you past 100 transactions in the first quarter. The Prime plan removes the staking exemption cap and allows unlimited staking and interest transactions. This is the real difference between Base and Prime for DeFi users.
Cost basis tracking uses FIFO by default. CoinTracker also supports LIFO, HIFO, ACB, and Specific Identification. You can set a global method or override it per asset. Tax-loss harvesting is available on Prime and above. The tool scans your portfolio for positions with unrealized losses and suggests which assets to sell to offset gains. It does not execute the sales automatically. You must complete the transaction yourself and then sync the updated wallet data.
At tax time, CoinTracker generates IRS Form 8949, Schedule D, and an income summary. The 8949 lists every disposal with acquisition date, sale date, cost basis, and proceeds. If you have 500 transactions, expect a 20-page form. TurboTax and H&R Block accept direct import, which saves you from manually entering each line. If you file with a CPA, you can export a PDF or CSV and hand it over. The income summary breaks out staking rewards, interest, airdrops, and other income by type and date, pre-valued in USD.
Form accuracy depends entirely on whether your transactions imported cleanly. Misclassified LP deposits will appear as capital gains. Unmatched bridge transfers will generate phantom sales. Missing cost basis from wallets you forgot to connect will inflate gains. CoinTracker's output is only as good as the data you gave it and the cleanup you performed. This is true for every [crypto tax platform](https://altcoininvestor.com/best-crypto-tax-software-defi-yield-staking/), but the error rate is higher for DeFi-heavy portfolios because the transaction types are more complex.
## Pricing Reality for 500+ Transaction Users
CoinTracker offers four paid plans. Base costs $59 per year and supports up to 100 transactions. Prime costs $199 per year and supports up to 1,000 transactions with unlimited staking and interest exclusions. Ultra costs $599 per year and supports up to 10,000 transactions. Full Service costs $3,499 and includes reconciliation support and a dedicated account manager for portfolios with up to 300,000 transactions.
For a user with 500 transactions, Prime is the minimum viable option. Base will not work because DeFi activity generates far more than 100 taxable events. A single Uniswap LP position can produce 20 to 30 transactions per quarter if you are rebalancing or claiming fees. Staking rewards on Ethereum, Cosmos, and Solana add another 100 to 200 per year. Bridge transfers, DEX swaps, and vault deposits fill the rest. You will hit the 100-transaction cap in February.
Prime at $199 per year is the functional floor for active yield users. The question is whether $199 is cheaper than the alternative. A tax accountant with crypto experience charges $150 to $300 per hour. Reconstructing 500 transactions manually takes four to six hours if your records are clean, longer if you have missing data or unmatched transfers. That is $600 to $1,800 in billable time. CoinTracker saves that labor if the import works correctly. If the import requires two hours of manual cleanup, you are still ahead.
The catch is that CoinTracker does not eliminate the need for review. You still need to verify that LP positions are categorized correctly, that bridge transfers are matched, and that cost basis carried over from prior years. The software reduces manual data entry but does not replace judgment. For users comfortable reviewing transaction logs and etherscan, CoinTracker is a time-saver. For users who want fully automated tax prep with zero oversight, the platform will disappoint.
## Support Tiers and Resolution Speed
Support quality varies by plan. Base and Prime users access email support and a knowledge base. Response times range from 24 hours to five days depending on ticket volume. Common issues like duplicate transactions, missing API syncs, and basic categorization questions are usually resolved within 48 hours. Complex issues like incorrect LP token valuation, multi-chain cost basis errors, or protocol-specific reward tracking take longer and may require multiple rounds of back-and-forth.
Premium support is available only on the Ultra and Full Service plans. This includes priority ticket routing and access to a tax specialist who can review your account. For most 500-transaction users, premium support is not worth the $400 price jump from Prime to Ultra. The knowledge base covers the majority of common DeFi issues, and the community forum has solutions for edge cases like Curve gauge rewards or Convex staking.
The bigger limitation is that support cannot fix structural issues with how certain protocols are handled. If CoinTracker misclassifies a specific LP token as a trade, support can guide you through manual reclassification but cannot change the import logic. Feature requests and protocol additions are handled by the development team on an internal roadmap. Fixes for niche protocols or new chains can take months.
## Who CoinTracker Is Right For
CoinTracker is built for investors who hold assets across multiple exchanges and wallets, earn staking and lending income, and need accurate tax reporting without hiring a full-time accountant. It works best for users whose activity is concentrated on Ethereum mainnet, Coinbase, and the top-tier DeFi protocols that have been live for more than two years. If your portfolio is 80% Coinbase, Aave, Compound, and Uniswap V2, CoinTracker will handle it with minimal cleanup.
It is also the right choice for users who value portfolio tracking as much as tax reporting. CoinTracker's dashboard shows real-time balances, historical performance, and profit-and-loss by asset. The mobile app syncs the same data and sends price alerts. If you want one tool that tracks both your holdings and your tax liability, CoinTracker delivers that integration. Competitors like [CoinLedger](https://altcoininvestor.com/coinledger-vs-cointracker/) focus more narrowly on tax forms and lack the portfolio dashboard.
CoinTracker is the wrong choice if your activity is concentrated on Layer-2 networks, newer protocols with fewer than 10,000 users, or autocompounding vaults that do not issue itemized reward transactions. It is also the wrong choice if you are unwilling to spend two to four hours per year reviewing and correcting imported data. The platform reduces manual work but does not eliminate it. Users who expect fully automated tax prep with zero oversight will encounter errors that cascade into incorrect filings.
## The Takeaway
CoinTracker handles Coinbase and Ethereum mainnet DeFi better than any competitor. Staking rewards sync cleanly, tax forms integrate with TurboTax, and the portfolio tracker saves you from logging into six wallets to check balances. LP tokens break, L2 imports need manual review, and bridge transfers require verification. For 500-transaction users, the Prime plan at $199 per year is cheaper than paying an accountant but more expensive than doing it yourself in a spreadsheet. The value proposition depends on how much your time is worth and whether you can afford to miss a misclassified transaction. If you are running yield positions on [stablecoin lending protocols](https://altcoininvestor.com/passive-income-stablecoins/), tracking cost basis manually, and spending six hours every April reconciling wallet exports, CoinTracker will save you time. If your portfolio is concentrated on Base, Blast, or protocols launched in the last twelve months, expect to do half the work yourself.
## Recommendation
Use CoinTracker if you earn staking and lending income on Ethereum mainnet, hold assets on Coinbase or Kraken, and need tax forms that integrate with consumer tax software. Budget $199 per year for the Prime plan and two to four hours for manual review of LP positions and bridge transfers. Do not use CoinTracker if your activity is concentrated on Layer-2 networks or if you are unwilling to verify that liquidity pool deposits imported correctly. In that case, [Summ](https://altcoininvestor.com/summ-crypto-tax/) tracks 2,300+ DeFi protocols with better on-chain indexing, or pay a crypto-specialized accountant to reconstruct your records from wallet exports and accept the higher cost as the price of accuracy.
For portfolios split between centralized exchanges and top-ten DeFi protocols, CoinTracker is the most reliable middle ground between spreadsheet hell and accountant fees. The platform is not perfect, but the errors are predictable and the cleanup is manageable. That is enough.
## Frequently Asked Questions
### Does CoinTracker support liquidity pool positions from Uniswap and Curve?
CoinTracker imports liquidity pool transactions but often misclassifies the initial deposit as a trade rather than a transfer. This creates phantom taxable gains. You must manually reclassify LP deposits using the platform's liquidity pool categories. Uniswap V3 NFT-based positions are particularly prone to import errors and require manual review of every transaction.
### What is the minimum CoinTracker plan for someone with 500+ DeFi transactions per year?
The Prime plan at $199 per year is the minimum viable option. The Base plan caps transactions at 100 per year, which active DeFi users will exceed in the first quarter. Prime supports up to 1,000 transactions and excludes unlimited staking and interest income from the count, making it the functional floor for yield farming and multi-chain activity.
### How does CoinTracker handle staking rewards from Ethereum, Cosmos, and Solana?
CoinTracker auto-detects staking rewards from Lido, Rocket Pool, Coinbase, Kraken, Cosmos validators, and Solana staking pools. Rewards are categorized as income, valued at fair market price at receipt, and assigned cost basis for future disposal tracking. The Base plan excludes staking rewards from transaction counts until they exceed $25 in annual proceeds. Prime and above remove that cap entirely.
### Does CoinTracker match cross-chain bridge transfers automatically?
CoinTracker imports bridge transactions from LayerZero, Across, Hop, and Stargate but does not always match the sending and receiving sides as transfers. If the platform does not recognize both addresses as yours, it treats the outbound transaction as a taxable disposal. You must manually mark the pair as a transfer to preserve cost basis and avoid phantom gains on your tax forms.
### Can I export CoinTracker tax reports directly to TurboTax or my accountant?
Yes. CoinTracker generates IRS Form 8949, Schedule D, and income summaries that integrate directly with TurboTax and H&R Block. You can also export PDF or CSV files for CPAs. The 8949 lists every disposal with acquisition date, cost basis, and proceeds. For 500 transactions, expect a 20-page form. Import quality depends on whether your transactions synced cleanly and whether you corrected misclassified LP or bridge activity.
Tool mentioned above
Koinly
Koinly imports from 800+ exchanges and wallets and handles the DeFi cases most tools get wrong - rebasing tokens, LP positions, staking rewards.
[Try Koinly](https://koinly.io/?via=F6E2E35A&utm%5Fsource=affiliate)
We may earn a commission if you sign up through this link, at no cost to you. It does not change what gets recommended.
The Weekly Yield Report
You just saw where CoinTracker works, where it breaks, and what the Prime plan costs for 500 transactions. That number will change next year when your activity doubles.
Every Thursday: where crypto yield actually is - stablecoins, liquid staking and DeFi lending, with the risk named next to the rate and what changed since last week.
[Get it free every Thursday](#/portal/signup)
Free. No trade calls, no allocations, no hype. Unsubscribe in one click.
### How To Calculate GPU Mining Breakeven With Resale Value
URL: https://altcoininvestor.com/gpu-mining-breakeven-calculator-resale/
Last updated: 2026-10-10T15:06:05.000Z
## What This Calculation Actually Covers
Most GPU mining calculators tell you when the hardware pays for itself through mining revenue. That is incomplete. The hardware has resale value, and that value depreciates on a schedule you can model. The real breakeven calculation accounts for three income streams: mining revenue minus operating costs, plus capital recovery through hardware resale, minus the opportunity cost of holding the GPU past its optimal exit window.
This guide builds that model step by step. You will leave with a formula, realistic inputs for current market conditions, and the decision framework for when to sell the hardware instead of continuing to mine.
You need four numbers before you start: your GPU purchase price, your electricity rate in dollars per kilowatt-hour, current daily mining revenue for your specific hardware and coin, and realistic resale value 12 months from now. The fourth number is where most miners lose money.
## The Standard Breakeven Formula and Why It Fails
The standard formula is simple: GPU Cost divided by Daily Net Profit equals ROI in days. Daily Net Profit is Daily Revenue minus Power Cost minus Pool Fees. If you bought an RTX 3070 for $250 and it earns $0.05 net per day after electricity and fees, your breakeven is 5,000 days. That is 13.7 years. At current Kaspa difficulty and coin price, that is the real number for a home miner paying $0.10 per kilowatt-hour.
The formula assumes you mine for 5,000 days and then throw the GPU away. That is not what happens. You sell the GPU when mining becomes unprofitable, when a new generation launches, or when you decide the capital is better deployed elsewhere. The resale value is a real cash inflow, and it changes your breakeven substantially.
Here is the adjusted formula:
**True ROI (days) = (GPU Cost - Expected Resale Value) / Daily Net Profit**
If that same RTX 3070 retains $200 of resale value after 12 months, your effective cost is $50, not $250\. Your true breakeven is now 1,000 days, not 5,000\. The difference is whether the project makes sense or not.
The failure mode is in the Expected Resale Value input. Most miners use wishful numbers. The secondary GPU market moves in sudden drops, not gradual curves. When NVIDIA announces the RTX 5090, the RTX 4090 resale price falls 20-30% within weeks. Miners who wait past the announcement lose hundreds of dollars per card. That loss is larger than the mining revenue they earned while waiting.
## Building the Daily Net Profit Component

Daily Net Profit is where electricity cost dominates. The formula is:
**Daily Net Profit = Daily Revenue - Power Cost - Pool Fees**
Power Cost is calculated as: (Watts / 1,000) x 24 x Electricity Rate. An RTX 4090 mining Kaspa pulls 300 watts. At $0.12 per kilowatt-hour, that is (300 / 1,000) x 24 x 0.12 = $0.86 per day. Current Kaspa revenue for an RTX 4090 is approximately $2.81 per day gross. Pool fees at 1% take another $0.03\. Daily Net Profit is $2.81 - $0.86 - $0.03 = $1.92.
If your electricity rate is $0.16 per kilowatt-hour instead, Power Cost jumps to $1.15 per day. Daily Net Profit falls to $1.63\. Over 12 months, that is $106 less revenue. Over 24 months, $212\. The electricity rate difference between competitive and marginal is $0.07 per kilowatt-hour. Under that threshold, GPU mining is viable. Above $0.12, it is marginal. Above $0.16, most setups lose money.
For comparison, an RTX 3070 pulls 130 watts. At $0.12 per kilowatt-hour, Power Cost is $0.37 per day. Current Kaspa revenue is approximately $1.27 gross. Pool fees take $0.01\. Daily Net Profit is $0.89\. That GPU costs less to buy used, pulls less power, and earns less gross revenue. The net margin is tighter, and the resale value depreciates faster because the card is already a generation behind.
Use WhatToMine to pull live revenue estimates for your specific GPU and coin. The numbers above are October 2026 snapshots. They will be different when you read this. Input your actual electricity rate, not the national average. Your profitability depends on your rate, not someone else's.
## Modeling Expected Resale Value and the Exit Window
Resale value follows a predictable depreciation curve, with one critical exception: new generation announcements create sudden drops. The curve looks like this:
- 0-6 months after launch: 80-90% of MSRP
- 6-12 months after launch: 60-75% of MSRP
- Immediately after new generation announcement: 40-55% of MSRP
- 18+ months old: 30-45% of MSRP
The announcement cliff is the critical event. When NVIDIA announced the RTX 5090 in early 2025, RTX 4090 prices on the secondary market fell from approximately $1,400 to $900 within 30 days. Miners who listed the day before the announcement recovered $1,400\. Miners who waited a month recovered $900\. That is a $500 difference for choosing the wrong week.
The golden rule: sell before the announcement, not after. NVIDIA has moved to an annual release cadence. Hopper launched in 2022\. Blackwell launched in 2024\. Rubin is expected in 2026\. Rubin Ultra in 2027\. That cadence compresses the window in which any GPU generation is frontier hardware. Plan your exit 6-12 months before the expected successor launch. Selling immediately after launch minimizes recovery.
Seasonal demand also matters. Tax refund season (March-April) drives strong secondary market demand. January shows post-holiday demand with lower inventory. November-December has holiday demand but also new GPU supply from manufacturers. If you miss the pre-announcement window, aim for March-April resale to maximize recovery.
The RTX 3090 is an outlier. Used RTX 3090 cards went from $600-$800 in March 2026 to $1,287-$1,411 by September 2026\. The card launched at $1,499 in 2020 and five years later sells used for over $1,000\. The driver is 24GB of GDDR6X VRAM, which makes the card viable for large language model inference. AI demand has disrupted the mining-driven resale curve for high-VRAM cards. This makes older high-VRAM cards harder to predict, but it also creates an exit opportunity for miners holding RTX 3090s. Sell sooner rather than later. These GPUs have experienced heavy wear from 24/7 mining, and their market value continues to decline outside the AI niche.
For modeling purposes, use conservative resale estimates. If the card is 12 months old at time of resale, assume 60% of your purchase price for current-generation cards, 50% for previous-generation cards, and 40% if a new generation has been announced. If the card has been mining 24/7, discount another 10-20% for wear. Mining degrades capacitors, power delivery components, and thermal cycling endurance. Buyers discount worn hardware relative to lightly used gaming cards.
## Worked Example: RTX 3070 Ti at Low-Cost Electricity
Here is a realistic scenario for a miner with access to low-cost electricity.
**Hardware:** Used RTX 3070 Ti, purchased for $280
**Electricity Rate:** $0.06 per kilowatt-hour
**Power Draw:** 140 watts
**Coin:** Kaspa
**Daily Revenue (gross):** $1.15
**Pool Fee:** 1%
**Expected Resale (12 months):** $220 (79% of purchase price, accounting for wear)
Calculate Power Cost: (140 / 1,000) x 24 x 0.06 = $0.20 per day
Calculate Pool Fees: $1.15 x 0.01 = $0.01 per day
Calculate Daily Net Profit: $1.15 - $0.20 - $0.01 = $0.94 per day
Standard breakeven: $280 / $0.94 = 298 days
True breakeven with resale: ($280 - $220) / $0.94 = 64 days
This setup reaches true breakeven in 64 days, assuming resale value holds at $220 after 12 months. If the miner holds the GPU for 12 months, total mining revenue is $0.94 x 365 = $343\. Add resale value of $220, and total recovery is $563\. Subtract initial cost of $280, and net profit is $283 after one year. That is a 101% return on invested capital.
The risk is that resale value falls below $220\. If a new generation launches before the 12-month mark and resale drops to $150, total recovery falls to $493, and net profit falls to $213\. Still profitable, but 25% less. If the miner misses the exit window entirely and resale drops to $100, total recovery falls to $443, and net profit falls to $163\. That is a 42% reduction from the optimistic case.
## Worked Example: RTX 4090 at Home Electricity Rates
Here is a scenario for a miner using a high-end GPU at typical home electricity rates.
**Hardware:** New RTX 4090, purchased for $1,600
**Electricity Rate:** $0.12 per kilowatt-hour
**Power Draw:** 300 watts
**Coin:** Kaspa
**Daily Revenue (gross):** $2.81
**Pool Fee:** 1%
**Expected Resale (12 months, pre-announcement):** $1,100 (69% of MSRP)
**Expected Resale (12 months, post-announcement):** $700 (44% of MSRP)
Calculate Power Cost: (300 / 1,000) x 24 x 0.12 = $0.86 per day
Calculate Pool Fees: $2.81 x 0.01 = $0.03 per day
Calculate Daily Net Profit: $2.81 - $0.86 - $0.03 = $1.92 per day
Standard breakeven: $1,600 / $1.92 = 833 days (2.3 years)
True breakeven with pre-announcement resale: ($1,600 - $1,100) / $1.92 = 260 days
True breakeven with post-announcement resale: ($1,600 - $700) / $1.92 = 469 days
Selling before the announcement reduces breakeven from 833 days to 260 days. Selling after the announcement extends it to 469 days. The timing decision is worth 209 days of revenue, or $401\. That is the dollar cost of missing the exit window by 30 days.
If the miner holds the GPU for 12 months and sells pre-announcement, total mining revenue is $1.92 x 365 = $701\. Add resale value of $1,100, and total recovery is $1,801\. Subtract initial cost of $1,600, and net profit is $201\. That is a 13% return on invested capital.
If the miner holds for 12 months and sells post-announcement, total recovery is $1,401, and net profit falls to negative $199\. The miner loses money. The announcement timing determines whether the project is profitable or not.
## When the Model Breaks: Difficulty Increases and Price Volatility
The calculations above assume constant daily revenue. That is not realistic. Mining difficulty increases as more miners join the network, and coin price fluctuates with market cycles. Both factors reduce Daily Net Profit over time.
As more miners join the network and hash rate rises, profitability per miner decreases. More competition for the same block reward means each miner earns less. Kaspa difficulty has increased approximately 10% per quarter over the past year. If that trend continues, daily revenue falls from $2.81 to $2.53 in six months, assuming coin price stays constant. Daily Net Profit for the RTX 4090 falls from $1.92 to $1.64\. True breakeven with pre-announcement resale extends from 260 days to 305 days.
Coin price volatility is harder to model, but you can stress-test the calculation by assuming a 30% price drop from current levels. If Kaspa price falls 30%, daily revenue falls from $2.81 to $1.97\. Daily Net Profit falls from $1.92 to $1.08\. True breakeven with pre-announcement resale extends from 260 days to 463 days. The project goes from strong to marginal with one price correction.
Build your model with conservative assumptions. Assume coin price at 30% below current levels. Assume difficulty increasing 10% over six months. Assume resale value at the low end of the range for your GPU generation. If the project still reaches breakeven within 18 months under those assumptions, it is viable. If it does not, you are speculating on coin price appreciation, not mining income.
## Alternative Paths: Mining vs. GPU Compute Rental
If you own high-end GPUs, [compute rental may generate better returns than mining](https://altcoininvestor.com/gpu-rental-vs-mining-returns/). GPU rental nets $1,000-1,500 monthly on A100s, compared to $10-25 mining the same hardware. The economics depend on uptime, power costs, and setup complexity, but the income delta is substantial for datacenter-grade hardware.
For consumer GPUs, mining remains the primary income path. Rental platforms that accept consumer cards pay significantly less, and uptime requirements are higher. An RTX 3070 rented for machine learning workloads might generate $30-50 per month, compared to $27 per month mining Kaspa at current rates. The rental income is higher, but the setup friction and uptime requirements make mining simpler for most operators.
## When to Exit: The Decision Framework
Sell the GPU when any of these conditions is true:
**New generation announcement is imminent.** If NVIDIA, AMD, or Intel has announced a product launch within 90 days, sell immediately. The resale value will fall 20-30% within weeks of the announcement. Mining revenue during those weeks will not cover the resale value loss.
**Daily Net Profit falls below $0.10.** At that income level, you are earning $3 per month. The GPU is worth more as sold capital than as mining hardware. Sell, recover the resale value, and redeploy the capital into another income surface.
**True breakeven extends beyond 24 months.** If your updated model shows breakeven at 30, 36, or 48 months, the hardware will likely be obsolete before you recover your cost. Sell now, take the resale recovery, and cut the loss.
**Hardware wear becomes visible.** If fans are failing, temperatures are rising, or stability is degrading, sell before the hardware fails entirely. A working GPU with wear sells for 10-20% less than a clean unit. A non-functional GPU sells for parts value, which is 70-80% less.
The optimal exit is 6-12 months before the expected successor launch, during tax refund season (March-April), when the GPU is still current-generation and daily net profit is still positive. That window closes fast. Missing it by 60 days can cost 20% of resale value.
## The Takeaway
GPU mining breakeven is not a single number. It is a time-sensitive model that accounts for operating income, capital recovery, and exit timing. The resale value component is larger than most miners expect, and the exit window is narrower. Miners who treat resale timing as a fixed variable lose hundreds of dollars per card. Miners who model it as a time-sensitive decision and sell before new generation announcements recover 60-80% of their initial cost within 12 months.
Run the adjusted formula with your actual electricity rate, current coin revenue from [a realistic profitability calculator](https://altcoininvestor.com/gpu-mining-profitability-calculator/), and conservative resale estimates. If true breakeven extends beyond 18 months under stress-test assumptions, the project is speculative, not income-generating. If it reaches breakeven within 12 months and you have a clear pre-announcement exit plan, the economics are sound.
The next NVIDIA generation will be announced. Plan your exit now, not after the resale cliff.
## Frequently Asked Questions
### What is the true breakeven formula for GPU mining with resale factored in?
True ROI in days equals GPU Cost minus Expected Resale Value, divided by Daily Net Profit. Daily Net Profit is Daily Revenue minus Power Cost minus Pool Fees. This formula accounts for capital recovery through hardware resale, which standard breakeven calculators ignore. For example, an RTX 3070 Ti purchased for $280 with $220 expected resale and $0.94 daily net profit reaches true breakeven in 64 days, not 298 days.
### When should I sell my mining GPU to maximize resale value?
Sell 6-12 months before the expected successor GPU launch, ideally during tax refund season in March or April. The golden rule is sell before the announcement, not after. When NVIDIA announces a new generation, resale prices for the current generation fall 20-30% within weeks. Miners who listed RTX 4090s the day before the RTX 5090 announcement recovered $1,400\. Those who waited a month recovered $900, losing $500 in resale value.
### How do I calculate daily power cost for GPU mining?
Daily power cost equals GPU watts divided by 1,000, multiplied by 24 hours, multiplied by your electricity rate in dollars per kilowatt-hour. For example, an RTX 4090 pulling 300 watts at $0.12 per kWh costs (300/1000) x 24 x 0.12 = $0.86 per day. Electricity rates under $0.07/kWh are competitive, $0.12/kWh is marginal, and above $0.16/kWh most setups lose money.
### Why do GPU resale values drop so sharply after new generation announcements?
New generation announcements flood the secondary market with previous-generation hardware as miners and gamers upgrade. Buyers delay purchases waiting for the new cards, reducing demand for current models. The supply increase and demand decrease combine to drop prices 20-30% within weeks. This announcement cliff is the most direct risk to mining breakeven calculations. Miners who miss the pre-announcement exit window lose hundreds of dollars per card in resale value.
### What happens to GPU mining breakeven if difficulty increases 10% over six months?
If difficulty increases 10% and coin price stays constant, daily revenue falls proportionally. For an RTX 4090 mining Kaspa, daily revenue drops from $2.81 to $2.53, and daily net profit falls from $1.92 to $1.64 at $0.12/kWh electricity. True breakeven with pre-announcement resale extends from 260 days to 305 days. Combined with a 30% coin price drop, the project can go from profitable to marginal or unprofitable. Always stress-test your model with conservative difficulty and price assumptions.
The Weekly Yield Report
You now have the formula that accounts for hardware depreciation, exit timing, and the announcement cliff that most miners miss. Those windows close faster every generation.
Every Thursday: where crypto yield actually is - stablecoins, liquid staking and DeFi lending, with the risk named next to the rate and what changed since last week.
[Get it free every Thursday](#/portal/signup)
Free. No trade calls, no allocations, no hype. Unsubscribe in one click.
### CFTC Draws the Line: Event Contracts Are Swaps, Casino Games Are Not
URL: https://altcoininvestor.com/cftc-event-contracts-swap-definition-gambling/
Last updated: 2026-10-13T18:00:06.000Z
## The CFTC Makes Its Jurisdictional Claim Explicit
On October 9, 2026, the Commodity Futures Trading Commission published proposed rule RIN 3038-AF82 to expressly include event contracts in the definition of a swap. The rule targets contracts based on sports, politics, culture, and weather-related wagers, all of which have proliferated on platforms like Kalshi and Polymarket over the past 18 months. The CFTC, under Chairman Michael Selig, is drawing a regulatory boundary that has direct income implications for everyone operating in the prediction markets space and for anyone earning from crypto gambling platforms that might be mistaken for prediction markets.
As of September 1, 2026, at least seven CFTC-registered designated contract markets offered sports-related event contracts to U.S. users. The agency is now codifying its position that these products are derivatives under federal jurisdiction, not gambling under state jurisdiction. This matters enormously for platform economics, for affiliate income structures, and for anyone earning through participation in prediction markets or [DeFi protocols](https://altcoininvestor.com/best-defi-protocols/) that touch event-based contracts.
The agency published a companion Interim Final Rule the same day that codifies the opposite position for casino-style gambling products. That rule states explicitly that wagers placed on sportsbooks and casino games are excluded from the swap definition. It is effective immediately upon Federal Register publication, with comments due within 30 days. The CFTC is claiming prediction markets and excluding casino gambling in a single coordinated regulatory move.
## What the Swap Definition Means for Platform Operators

If event contracts are swaps, then platforms offering them must register as designated contract markets or swap execution facilities with the CFTC. That registration brings compliance costs, surveillance requirements, and margin rules that do not apply to state-licensed gambling operators. It also brings federal regulatory clarity, which is worth real money to institutional participants who will not touch a product if its legal status is contested.
Kalshi, which already operates as a CFTC-registered DCM, benefits from this rule. The agency is formalizing the framework Kalshi already operates under, which creates a competitive moat against offshore prediction markets that do not want to register. Polymarket, which does not serve U.S. users after a 2022 settlement with the CFTC, is unaffected directly but faces the same jurisdictional pressure if it ever re-enters the U.S. market.
For platforms offering both prediction markets and casino-style gambling products, the rule creates a compliance split. Event contracts go to the CFTC. Casino games and sportsbooks go to state gaming regulators. That dual-jurisdiction structure is expensive to maintain, and it creates income arbitrage opportunities for platforms that specialize in one category or the other.
## The Casino Carve-Out and State Jurisdiction

The Interim Final Rule explicitly excludes casino-style gambling products and sportsbooks from the swap definition. This is not new policy, but it is the first time the CFTC has codified it in a rule effective immediately. The agency is clarifying that it does not regulate casino games or sports betting, even when those products are offered on blockchain platforms or paid out in cryptocurrency.
That exclusion means crypto casinos like Stake, Rollbit, and BC.Game remain under state jurisdiction where they serve U.S. users, and under their respective licensing jurisdictions (Curaçao, Malta, Isle of Man) where they do not. The CFTC is not claiming casino income as part of its regulatory surface. States and tribes are, and the fight over that jurisdiction is escalating in courts across the country.
For affiliates earning commission from crypto casino referrals, this rule changes nothing directly. Your income is still derived from state-regulated or offshore-licensed gambling activity, not from federally regulated derivatives. But the rule does clarify the boundary, which matters if you are considering affiliate relationships with prediction markets platforms that might be miscategorized as gambling.
## Prediction Markets vs Sportsbooks: The Income Distinction
The CFTC's rule draws a line between prediction markets and sportsbooks that is economically meaningful. Prediction markets, as the CFTC defines them, are bilateral contracts where participants take opposite positions on the outcome of an event. Sportsbooks are centralized operators offering wagers with a built-in hold percentage. The difference is structural, not just semantic.
In a prediction market, the platform earns from transaction fees, not from house edge. Kalshi charges a fee on contracts, but it does not take a position against the user. In a sportsbook, the operator sets the line and holds a percentage of the action. That hold is the operator's income, and it comes directly from player losses. The economics are entirely different, and the income opportunities for skilled participants are different as well.
Skilled bettors can find positive expected value in sportsbooks by exploiting line movement and inefficiencies, but they are always betting against a house edge. Skilled prediction market participants are trading against other participants in a market where the platform is not a counterparty. The risk profile, the income potential, and the regulatory treatment are all distinct.
## States, Tribes, and the Jurisdictional Fight
States and tribes have argued that prediction markets are illegal gambling operations that shirk state tax and gaming laws. The CFTC, under Selig's leadership, has aggressively defended itself as the sole regulator of the industry. This is not a theoretical dispute. States have sued prediction markets platforms, and tribes have lobbied Congress to assert state jurisdiction over event contracts.
The 30-day comment period on the proposed rule will generate industry pushback from state regulators, tribal gaming authorities, and possibly from offshore crypto gambling platforms that do not want to be reclassified as swap dealers. The CFTC is inviting that fight by publishing the rule, and the outcome will determine whether prediction markets remain a federally regulated income surface or get pushed back to state-by-state licensing like sports betting.
For anyone earning income from prediction markets participation, the jurisdictional clarity matters. If the CFTC's position holds, then platforms like Kalshi can operate nationally without state-by-state licensing. If states win the jurisdictional fight, then prediction markets will fragment the same way sports betting did after the 2018 Supreme Court decision in Murphy v. NCAA. That fragmentation reduces liquidity, narrows arbitrage opportunities, and complicates income strategies that rely on national access.
## The Takeaway
The CFTC just formalized the regulatory boundary between federally regulated prediction markets and state-regulated gambling. Event contracts are swaps. Casino games and sportsbooks are not. That distinction creates compliance costs for platforms, income arbitrage opportunities for specialized operators, and jurisdictional clarity for participants who need to know which regulator oversees their activity. The 30-day comment period will test whether states and tribes accept the CFTC's claim or fight it in court. For anyone earning from prediction markets or [crypto gambling platforms](https://www.bloomberg.com/news/articles/2026-10-09/cftc-defends-prediction-markets-turf-with-new-swap-definition), the outcome determines whether your income surface is federal, state, or contested.
## Frequently Asked Questions
### What is the CFTC's proposed rule RIN 3038-AF82?
Published October 9, 2026, RIN 3038-AF82 proposes to expressly include event contracts based on sports, politics, culture, and weather in the definition of a swap. This would bring prediction markets offering these contracts under federal CFTC jurisdiction as derivatives rather than state-regulated gambling. The rule targets platforms like Kalshi and establishes the CFTC as the primary regulator for event-based contracts offered to U.S. users.
### Are crypto casinos affected by the CFTC's event contract rule?
No. The CFTC published a companion Interim Final Rule the same day explicitly excluding casino-style gambling products and sportsbooks from the swap definition. Crypto casinos like Stake, Rollbit, and BC.Game remain under state jurisdiction where they serve U.S. users and under their respective offshore licenses elsewhere. The CFTC is clarifying it does not regulate casino games or sports betting, even when offered on blockchain platforms.
### How do prediction markets differ from sportsbooks economically?
Prediction markets are bilateral contracts where participants trade against each other, and the platform earns from transaction fees without taking a position. Sportsbooks are centralized operators that set lines and earn from a built-in hold percentage taken from player losses. Prediction markets have no house edge in the traditional sense. Skilled participants trade against market inefficiencies, not against the platform. This structural difference is why the CFTC treats them as derivatives rather than gambling.
### What happens to prediction markets if states win the jurisdictional fight?
If states successfully challenge the CFTC's jurisdiction over event contracts, prediction markets would face state-by-state licensing similar to sports betting after Murphy v. NCAA in 2018\. This would fragment liquidity, reduce national arbitrage opportunities, and complicate income strategies that rely on uniform access. Platforms would need separate licenses in each state, raising compliance costs and potentially limiting which states they serve. The 30-day comment period will determine if the CFTC's position holds or gets contested in court.
### Does this rule affect affiliate income from crypto gambling platforms?
Not directly. Affiliate income from crypto casinos and sportsbooks remains derived from state-regulated or offshore-licensed gambling activity, which the CFTC explicitly excludes. However, the rule clarifies the boundary between prediction markets and gambling, which matters for affiliates considering relationships with platforms offering event contracts. If a platform is reclassified from gambling to swap dealer, its compliance requirements, tax treatment, and affiliate structure may change substantially.
The Weekly Yield Report
You just read the CFTC's jurisdictional line between swaps and gambling. That line will shift as states and tribes respond in the 30-day comment period.
Every Thursday: where crypto yield actually is - stablecoins, liquid staking and DeFi lending, with the risk named next to the rate and what changed since last week.
[Get it free every Thursday](#/portal/signup)
Free. No trade calls, no allocations, no hype. Unsubscribe in one click.
### Crypto Tax Rates 2025: Short-Term, Long-Term, And Income
URL: https://altcoininvestor.com/crypto-tax-rate-2025/
Last updated: 2026-10-10T02:06:59.000Z
## The Question Readers Ask: What Rate Will I Actually Pay?
Most crypto investors ask the wrong version of this question. They ask "what is the crypto tax rate," as if there is one number. There is not. The rate you pay depends on two variables: how long you held the asset, and whether you earned it as yield or bought it as a position.
In Buenos Aires, I watched a friend realize in March that the staking rewards he earned in December were taxed at 37%, not the 15% long-term capital gains rate he had assumed. He held the underlying tokens for two years. That did not matter. The rewards themselves were ordinary income the day they hit his wallet. His effective tax liability erased 40% of the yield he thought he had earned.
The federal tax code treats crypto capital gains and crypto income as two separate categories. Trading profits follow capital gains brackets based on holding period. Staking rewards, liquidity pool fees, and lending interest follow ordinary income brackets regardless of how long you have participated in the protocol. This article separates the two, shows the actual 2025 brackets for each, and explains which yield sources trigger which rates.
## Capital Gains Tax Rates: The Holding Period Is Everything
When you sell, swap, or spend crypto you bought or received earlier, the IRS treats that event as a disposal that triggers capital gains tax. The rate you pay depends entirely on how long you held the asset before disposal.
### Short-Term Capital Gains: Held One Year Or Less
If you held the crypto for one year or less, the gain is short-term and taxed at ordinary income rates. For 2025, those rates range from 10% to 37% depending on your total taxable income. The brackets for single filers are:
- 10% on income from $0 to $11,925
- 12% on income from $11,926 to $48,475
- 22% on income from $48,476 to $103,350
- 24% on income from $103,351 to $197,300
- 32% on income from $197,301 to $250,525
- 35% on income from $250,526 to $626,350
- 37% on income above $626,351
If you bought ETH in February and sold it in November, that nine-month holding period means the gain is taxed at the same rate as your salary. For a single filer earning $120,000 in total income, short-term gains are taxed at 24%. For a filer earning $300,000, the rate is 35%.
### Long-Term Capital Gains: Held More Than One Year
The legal standard is "more than one year." This is sometimes described colloquially as "one year and a day," but the IRS holding period begins the day after you acquire the asset. If you receive Bitcoin on March 15, 2024, your holding period begins March 16, 2024\. You must hold until at least March 16, 2025, to qualify for long-term treatment.
Long-term capital gains are taxed at preferential rates: 0%, 15%, or 20%, depending on your income. For 2025 single filers, the thresholds are:
- 0% rate: taxable income from $0 to $48,350
- 15% rate: taxable income from $48,351 to $533,400
- 20% rate: taxable income above $533,401
The difference between a 24% short-term rate and a 15% long-term rate on a $50,000 gain is $4,500 in additional tax liability. For positions you plan to hold anyway, waiting past the one-year mark reduces your tax bill substantially. This is the core income mechanism of tax-aware position management: [hold accumulation-zone positions past the one-year threshold](https://altcoininvestor.com/bitcoin-accumulation-zone-historical/) to convert ordinary income rates into preferential capital gains rates.
### Net Investment Income Tax (NIIT): The Additional 3.8%
High-income taxpayers owe an additional 3.8% Net Investment Income Tax on top of the capital gains rates above. The NIIT applies when your modified adjusted gross income exceeds $200,000 for single filers or $250,000 for married filing jointly. If you are in the 20% long-term capital gains bracket and subject to NIIT, your effective rate on crypto gains is 23.8%.
## Staking Rewards, Yield Farming, And Liquidity Pool Income: Ordinary Income At Receipt
This is the category most investors misunderstand. When you earn crypto as yield, you owe tax at receipt, not at sale. The tax rate is your ordinary income rate, not the preferential capital gains rate. The IRS made this explicit in Revenue Ruling 2023-14.
### Staking Rewards: Taxed When You Gain Dominion And Control
Staking rewards are taxable as ordinary income at fair market value the moment you gain "dominion and control" over them. Dominion and control means the tokens are available to you - either sitting in your wallet or claimable at will. Even if you leave them locked in the protocol, if you have the technical ability to withdraw them, the IRS considers that moment of control to be the taxable event.
You report the dollar value of the tokens on the day you received them, using the fair market value at the time of receipt. That value becomes your cost basis in the tokens. If you stake ETH and receive 0.5 ETH in rewards when ETH is trading at $3,000, you recognize $1,500 in ordinary income. Your cost basis in that 0.5 ETH is $1,500\. When you later sell that ETH, you calculate capital gains or losses from that $1,500 basis.
This creates dual taxation. The reward is taxed as income when received. Any appreciation after receipt is taxed as capital gains when sold. If the 0.5 ETH you received at $3,000 is later sold at $3,500, you owe ordinary income tax on the initial $1,500 and capital gains tax on the $250 gain.
### Phantom Income Risk: You Owe Tax Even If The Price Drops
Staking rewards are paid in tokens, not dollars. If the token price is high when you receive the reward, you recognize ordinary income based on that high value. If the market drops afterward, you still owe tax on the original value even though the tokens may now be worth far less.
In Istanbul, a staker I know earned governance tokens in November 2021 worth $8,000 at receipt. By April 2022, those tokens were worth $1,200\. He still owed ordinary income tax on $8,000\. He had no dollar proceeds to pay the tax bill. He sold other positions at a loss to cover the liability. This is phantom income: real tax obligation with no corresponding fiat liquidity.
The income mechanism here is tax planning around withdrawal timing. If you are staking and reinvesting rewards automatically, track the fair market value at every reward event. Some stakers withdraw rewards weekly and convert a portion to stablecoins or fiat immediately to cover expected tax liability. Others use [crypto tax software built for DeFi yield](https://altcoininvestor.com/best-crypto-tax-software-defi-yield-staking/) to calculate estimated quarterly tax and set aside liquidity in advance.
### Yield Farming And Liquidity Pool Fees: Multiple Tax Events
Yield farming generates at least two taxable events, and often more. When you deposit tokens into a liquidity pool, you typically receive LP (liquidity provider) tokens in return. The IRS has not issued specific guidance on whether this deposit is a taxable event, but the conservative position treats it as a taxable disposal - you are exchanging your original tokens for a different asset (the LP token).
Fees you earn from providing liquidity are treated as ordinary income when you gain control over them. Some protocols distribute fees continuously. Others require an explicit claim transaction. Either way, the fair market value of the fees at the moment you gain access to them is ordinary income.
When you exit the pool by redeeming your LP tokens for the underlying assets, you trigger another capital gain or loss event. Your cost basis in the LP tokens is the fair market value of the tokens you deposited, adjusted for any fees earned. If the pool experienced impermanent loss and you withdrew less value than you deposited (even after accounting for fees), that loss is a capital loss. You can deduct up to $3,000 per year of capital losses against ordinary income, with the remainder carried forward.
The income mechanism here is understanding which part of your DeFi activity triggers ordinary income rates and which triggers capital gains rates. Fees earned in the pool are ordinary income the moment they are claimable. Token price appreciation between deposit and withdrawal is a capital event. [Tracking which specific transaction creates which taxable event](https://altcoininvestor.com/crypto-taxes-yield-income-taxable-events/) is essential for accurate reporting and for calculating your true after-tax yield.
## State Tax, High-Tax Jurisdictions, And The Compounding Rate Effect
Federal rates are only part of the tax burden. State income tax stacks on top. California taxes staking rewards and short-term capital gains at ordinary California rates, which can reach 13.3% for top earners. For a California resident in the top federal bracket earning staking income, the combined marginal rate is over 50%.
In New York City, a top-bracket resident faces 37% federal, 10.9% state, and 3.876% city tax on ordinary income, plus the 3.8% NIIT on investment income. Total marginal tax on staking rewards for a high-income New York City resident approaches 55%. This is not hypothetical. I have seen Argentine expats in New York earning USDC staking yield at 8% APY realize their after-tax yield was under 4% after accounting for federal, state, and city tax on the monthly distributions.
The income mechanism is jurisdictional arbitrage. Some traders structure their staking through entities in zero-income-tax states like Texas, Florida, or Wyoming. Others time large liquidity pool exits to occur in tax years when their other income is lower, dropping them into a lower marginal bracket. A few move. High-income yield farmers in California who relocate to Puerto Rico can access Act 60 tax incentives that reduce the tax rate on certain investment income to 4%.
## Holding Period Documentation And Cost Basis Tracking Under 2025 Rules
Starting January 1, 2025, U.S. crypto exchanges must track transactions and report sales on Form 1099-DA, a new form created specifically for digital assets. Before 2025, investors could use a universal accounting method to calculate cost basis across all wallets and exchanges. From 2025 forward, the IRS requires wallet-by-wallet cost basis tracking.
This change has immediate consequences for holding period management. If you move Bitcoin from Coinbase to a hardware wallet and later to Kraken before selling, you must document the acquisition date at each step to prove the holding period. The IRS allows specific identification of units sold (you designate which specific tokens you are selling) or first-in, first-out (FIFO) accounting, but both require precise records.
For positions you received as gifts, your holding period includes the time the asset was held by the donor - but only if you have documentation substantiating the donor's holding period. If you cannot prove the donor's acquisition date, your holding period begins the day after you received the gift. Loss of donor documentation means loss of the long-term holding period benefit.
The income mechanism here is documentation hygiene. Use [tax software with on-chain indexing](https://altcoininvestor.com/summ-crypto-tax/) that tracks acquisition dates automatically. Export transaction histories from every exchange and wallet you use. For large positions, download and archive the exchange trade confirmation showing the exact timestamp of acquisition. The difference between a documented 13-month holding period and an undocumented 11-month holding period can be thousands of dollars in additional tax on a single position.
## Reporting Requirements: Schedule 1, Form 8949, And The New 1099-DA
Staking rewards and other ordinary income from digital assets are reported on Form 1040 Schedule 1 under "Digital assets received as ordinary income not reported elsewhere." You enter the total fair market value of all staking rewards, liquidity pool fees, and lending interest you received during the tax year. This amount flows into your adjusted gross income and is taxed at your marginal ordinary income rate.
Capital gains and losses from crypto sales are reported on Form 8949 and Schedule D. Form 8949 lists each disposal event: the asset sold, date acquired, date sold, proceeds, cost basis, and gain or loss. Short-term and long-term transactions are reported in separate sections. The totals flow to Schedule D, where they combine with other investment gains and losses.
Beginning with the 2025 tax year, exchanges will issue Form 1099-DA to report digital asset sales. The form will include gross proceeds and, in many cases, cost basis information. This is similar to Form 1099-B used for stock sales. The IRS will receive a copy of every 1099-DA, so unreported crypto sales will trigger automatic matching notices.
For DeFi users, this creates a reporting gap. Centralized exchanges will issue 1099-DA forms. DeFi protocols will not. You remain responsible for tracking and reporting every DeFi transaction - every liquidity pool entry and exit, every yield farming reward, every token swap - even if no third party reports it to the IRS. The [IRS FAQ on virtual currency transactions](https://www.irs.gov/individuals/international-taxpayers/frequently-asked-questions-on-virtual-currency-transactions) is explicit: all digital asset transactions are reportable whether or not you receive a tax form.
## The Takeaway: Rate Optimization Starts With Classification
The effective tax rate on crypto income depends entirely on how the IRS classifies the transaction. Long-term capital gains on appreciated positions face a maximum 20% federal rate (23.8% with NIIT). Short-term gains and all forms of staking, yield farming, and liquidity pool income face ordinary rates up to 37% federal (40.8% with NIIT), plus state and local tax in many jurisdictions.
For Argentine expats managing dollar-denominated stablecoin yield in high-tax U.S. states, the after-tax return on a staking position paying 8% can drop below 4% after federal, state, and city tax. For traders in zero-income-tax states holding positions past the one-year threshold, the difference between short-term and long-term treatment is 17 percentage points of tax savings on every dollar of gain.
The projects with real traction in emerging markets - the [stablecoin savings products](https://altcoininvestor.com/passive-income-stablecoins/) routing peso conversions in Buenos Aires, the remittance corridors moving USDT between Turkey and the Gulf, the lending protocols offering dollar-yield to Nigerian savers - all generate ordinary income at receipt for U.S. taxpayers participating in those flows. Understanding which rate applies to which yield source is the prerequisite for calculating true after-tax return. The rate structure does not change based on where the protocol is used. It changes based on holding period and income classification, and those variables are within your control.
## Frequently Asked Questions
### Do I pay tax on crypto I am still holding?
No. Unrealized gains on crypto you are holding are not taxable. You owe tax only when you dispose of the asset through a sale, swap, or spend. The exception is staking rewards, liquidity pool fees, and other yield - those are taxed as ordinary income when you receive them, even if you continue holding the tokens afterward.
### How does the IRS know if I held crypto for more than a year?
The holding period begins the day after you acquire the asset and ends on the day you dispose of it. Starting in 2025, exchanges must report acquisition dates on Form 1099-DA. For assets held in self-custody wallets or DeFi protocols, you are responsible for maintaining your own records proving the acquisition date. If you cannot document the holding period, the IRS may treat the gain as short-term.
### Can I deduct impermanent loss from a liquidity pool?
Yes, if you realize the loss by exiting the pool. When you redeem LP tokens for the underlying assets, you recognize a capital gain or loss based on your cost basis in the LP tokens. If the value you withdraw is less than your original deposit (even after accounting for fees earned), you have a capital loss. You can deduct up to $3,000 per year of net capital losses against ordinary income, with excess losses carried forward to future years.
### Are staking rewards taxed twice?
Yes, in two separate events. When you receive staking rewards, you owe ordinary income tax on the fair market value at receipt. That value becomes your cost basis. When you later sell those tokens, you owe capital gains tax on any appreciation from that cost basis to the sale price. This is not double taxation on the same gain - it is tax on the initial income at receipt, followed by tax on subsequent appreciation.
### Does the 3.8% NIIT apply to all crypto income?
The Net Investment Income Tax applies to investment income for taxpayers with modified adjusted gross income above $200,000 (single) or $250,000 (married filing jointly). NIIT applies to capital gains and to passive income such as staking rewards and liquidity pool fees. It does not apply to income from active trading if you qualify as a trader in securities, but that classification requires meeting specific IRS tests and making an election.
Tool mentioned above
Koinly
Koinly imports from 800+ exchanges and wallets and handles the DeFi cases most tools get wrong - rebasing tokens, LP positions, staking rewards.
[Try Koinly](https://koinly.io/?via=F6E2E35A&utm%5Fsource=affiliate)
We may earn a commission if you sign up through this link, at no cost to you. It does not change what gets recommended.
The Weekly Yield Report
You now have the exact 2025 federal brackets for short-term gains, long-term positions, and staking income. These numbers will shift again when Congress adjusts the tax code next cycle.
Every Thursday: where crypto yield actually is - stablecoins, liquid staking and DeFi lending, with the risk named next to the rate and what changed since last week.
[Get it free every Thursday](#/portal/signup)
Free. No trade calls, no allocations, no hype. Unsubscribe in one click.
### The Best Free Crypto Trading Bots Actually Worth Using In 2026
URL: https://altcoininvestor.com/best-free-crypto-trading-bots/
Last updated: 2026-10-10T00:03:39.000Z
## What "Free" Actually Means In Trading Bot Marketing

Most platforms advertise free crypto trading bots. Most lie.
3Commas gives you 14 days. Cryptohopper caps you at one bot and cuts you off after three days. TradeSanta blocks live execution after the trial. They call it free. The dictionary calls it a trial period.
Five platforms offer genuinely free automation with no expiration and no forced upgrade: Pionex, Freqtrade, Hummingbot, Binance Auto-Invest, and KuCoin native bots. Each has a different cost structure, capability ceiling, and technical requirement. None of them charges a monthly subscription. That is where the similarity ends.
This list separates actual free options from freemium traps. You will see what each platform gives you at zero cost, what you sacrifice to avoid paying, and which free option fits your skill level and strategy type. The criteria: no subscriptions, no trial expirations, and automation that actually executes trades without requiring an upgrade.
## Exchange-Native Bots: Free Because You're Locked In

### Pionex - 16 Built-In Bots With No Expiration
Pionex runs 16 trading bots for free because it makes money on trading fees, not subscriptions. Grid bots, DCA bots, arbitrage bots, and rebalancing tools execute 24/7 with no upgrade prompts and no feature caps. The catch is simple: you trade only on Pionex.
Trading fees are 0.05% on spot and 0.02%-0.05% on futures. That is half of Binance's base rate. If you are running a grid bot that executes 200 trades per month, you pay $50 in fees on a $50,000 position at 0.05% per side. No subscription. No premium tier. Just the spread cost of automation.
The newest feature is PionexGPT, an AI assistant that translates plain-English strategy descriptions into bot parameter settings. You type "run a grid bot on ETH between $2,800 and $3,200 with 20 levels," and the system outputs the configuration. It is not trading advice and the settings still require your judgment, but it removes the need to understand every technical parameter before launching your first bot.
Limitation: you are locked to Pionex's liquidity. If the order book is thin on an altcoin pair, your bot will get worse fills than it would on Binance. No API connectivity to other exchanges. No leverage on the bots themselves, though Pionex offers leveraged trading separately. If Pionex goes offline or restricts withdrawals, your capital is stuck until they resolve it.
Best for: traders who want set-and-forget automation on major pairs without writing code or managing API keys. If you are testing [grid trading strategies](https://altcoininvestor.com/how-grid-trading-bots-work/) or dollar-cost averaging into BTC and ETH, Pionex gives you the tooling at zero subscription cost.
### Binance Auto-Invest - DCA Automation With A Premium Pricing Quirk
Binance Auto-Invest automates dollar-cost averaging on 200+ assets. You set a recurring buy schedule, choose your coins, and Binance executes the purchases automatically. The base transaction fee is 0.1%. Binance occasionally runs zero-fee promotions (the last one ran from July to October 2024), but the default is a 0.1% charge per transaction.
Here is the quirk: Auto-Invest prices differ from Binance spot market prices. Binance frames this as a premium service with "fully curated Portfolio service" and "advanced management of plans." In practice, you pay slightly more per coin than if you manually executed the same buy on Binance Spot. The convenience cost is real but undisclosed in percentage terms.
The upside: purchased crypto automatically deposits into Binance Simple Earn Flexible Products, so your holdings start accruing yield immediately. If you are buying $500 of BTC every week, the automation saves you 52 manual transactions per year and the yield stacks without additional setup.
Limitation: this is DCA-only automation. No grid trading, no arbitrage, no dynamic rebalancing. If the market trends down 40%, your bot keeps buying at the preset intervals. You cannot use Auto-Invest for active strategies that require stop-losses or take-profit triggers.
Best for: passive accumulators who want recurring purchases on Binance's deep liquidity without manual intervention. Not suitable for traders looking to capture volatility or run range-bound strategies.
### KuCoin Native Bots - More Assets, Less Liquidity
KuCoin offers free built-in bots across spot, margin, and derivatives, plus copy trading and grid automation. Base fees are 0.10% for makers and takers. If you hold KCS (KuCoin's native token), you get a 20% discount, dropping fees to 0.08%.
KuCoin lists over 1,000 digital assets, far more than Pionex. If you are running bots on low-cap altcoins or newly listed tokens, KuCoin gives you access that Pionex does not. The tradeoff: liquidity on smaller pairs is often thin, and slippage can erase the fee discount.
KuCoin is not available to US traders. If you are based in the United States, this option does not exist for you.
Limitation: fewer retail users than Binance means thinner order books on mid-tier pairs. The bot tooling is less polished than Pionex. KuCoin has faced regulatory scrutiny in multiple jurisdictions, which introduces platform risk.
Best for: non-US traders who need bot access to low-cap altcoins and are comfortable with moderate platform risk in exchange for a larger asset selection.
## Open-Source Bots: Free Software, Hidden Infrastructure Costs
### Freqtrade - Python-Based Flexibility For Coders
Freqtrade is a free, open-source algorithmic trading bot written in Python. Version 2026.3 dropped in April with monthly release cadence maintained since 2017\. The GitHub repo has 49,000+ stars and active contributor commits, which means it is not abandoned software.
You get strategy development, backtesting, optimization, live trading across dozens of exchanges, and an AI-powered FreqAI module for machine learning strategy generation. The software itself costs nothing. The infrastructure, maintenance, and learning curve cost everything.
You need Python familiarity to configure strategies, a VPS or cloud server to run the bot 24/7 (typically $5-$30/month depending on instance size), and ongoing attention to exchange API changes that can break your bot. Freqtrade operates as a self-hosted framework that you deploy on your own hardware or rented server. You connect it to exchanges via API keys. You are responsible for uptime, security, and debugging.
The advantage: complete transparency. You can audit every line of code. You can customize every parameter. You control your API keys and never hand them to a third-party SaaS platform. For technically proficient traders who value independence over convenience, that tradeoff is worth it.
Freqtrade includes dry-run mode, which executes your strategy against live market data without placing real orders. You can test for months, refine your logic, and verify that the bot behaves as expected before risking capital. This is the same workflow institutional quant teams use, just without the $200,000 salary.
Limitation: if you do not know Python, you will spend weeks learning before you run a single trade. If you cannot debug a broken API connection or a failed dependency install, Freqtrade will frustrate you. Market conditions change, and strategies that worked in backtesting often fail in live execution. You are the risk manager. There is no support team.
Best for: developers and quantitative traders who want full control, can self-host infrastructure, and understand that open-source software requires hands-on maintenance. If you have shipped code in any language, you can learn Freqtrade. If you have never touched a command line, pick a different option.
### Hummingbot - Market Making And Arbitrage For The Technically Fluent
Hummingbot is free, fully open-source, and specializes in institutional-grade strategies: market making, arbitrage, and liquidity provision across 35+ centralized and decentralized exchanges. Version 2.14.0 released in April 2026\. The Hummingbot Foundation, a Cayman Islands non-profit, maintains the codebase with community governance via the HBOT token.
Unlike SaaS platforms that run in your browser, Hummingbot runs locally on your machine or server. You interact via command-line interface. You connect directly to exchange APIs. The software is free. The operational complexity is high.
You need a VPS or dedicated server for low-latency execution, stable internet with minimal downtime, and comfort with CLI-based configuration. If you are running market-making strategies on volatile pairs, latency matters. A $10/month VPS in the wrong region will get you arbitraged by faster bots. A $50/month instance in the same AWS region as the exchange gives you a fighting chance.
Hummingbot's strength is cross-exchange arbitrage and liquidity strategies that require simultaneous order placement on multiple venues. If you are providing liquidity on a DEX while hedging on a CEX, Hummingbot handles the coordination. Pionex and Binance Auto-Invest do not.
The Foundation operates a developer-bounty system funded by HBOT token emissions. Features get built and bugs get fixed based on community votes and bounty allocations. This is transparent governance with all the inefficiency that implies. If you need a feature urgently, you either code it yourself or fund a bounty and wait.
Limitation: CLI-only interface eliminates casual users immediately. No GUI, no mobile app, no simplified setup wizard. You configure strategies by editing YAML files or typing commands. Infrastructure costs are hidden-you pay for hosting, not software. If you are running $5,000 in capital, a $30/month VPS is a 7.2% annual overhead cost before you make a single trade.
Best for: experienced traders with serious capital who need low-latency multi-exchange strategies and value open-source verification over plug-and-play convenience. If you are making markets on $100,000+ positions, the VPS cost is noise. If you are testing strategies with $2,000, the overhead is meaningful.
## How To Pick Among Free Options
The decision matrix is not which bot is "best." It is which free option matches your skill level, capital size, and strategy type.
If you have never written code and want to automate DCA or grid trading on major pairs, use Pionex or Binance Auto-Invest. Pionex gives you more bot variety. Binance gives you better liquidity and integrated yield. Both lock you to a single exchange, which is the price you pay for simplicity.
If you are a developer or quantitative trader who wants full control and can manage infrastructure, use Freqtrade or Hummingbot. Freqtrade is better for daily or hourly strategies across multiple exchanges with backtesting and optimization. Hummingbot is better for market making, arbitrage, and low-latency execution. Both require ongoing maintenance and technical fluency.
If you need access to 1,000+ altcoin pairs and you are not a US resident, KuCoin native bots give you coverage that Pionex does not. The liquidity is worse and the platform risk is higher, but the asset selection is unmatched among free exchange-native options.
Capital size matters. If you are trading under $10,000, the infrastructure cost of self-hosting Freqtrade or Hummingbot (VPS, monitoring, time) is a larger percentage drag than the 0.05% trading fee on Pionex. If you are trading $100,000+, the control and customization of open-source bots justifies the operational overhead.
Strategy type determines fit. Grid bots and DCA work on Pionex and Binance. Arbitrage and market making require Freqtrade or Hummingbot. If your strategy needs stop-losses, trailing take-profits, or multi-leg order logic, the exchange-native bots cannot handle it. You need programmable infrastructure.
None of these platforms offer built-in tax reporting. If you are running 500+ automated trades per year, you need separate [crypto tax software](https://altcoininvestor.com/is-koinly-free/) to reconcile cost basis and calculate gains. That is an additional expense or time sink regardless of which free bot you choose.
## What You Sacrifice By Staying Free
Free bots give you automation. They do not give you strategy development, risk management, or decision-making. [Bots capture spread, extract funding rate, or execute predefined logic](https://altcoininvestor.com/how-do-crypto-trading-bots-make-money/). They do not predict market direction or protect you from regime changes.
Pionex's grid bot works in range-bound markets. If BTC breaks out from $60,000 to $80,000 in three weeks, your grid bot keeps selling into the rally and you miss the majority of the move. The bot did what you told it to do. The outcome is still bad.
Freqtrade's backtesting shows you how a strategy would have performed historically. It does not account for slippage, API latency, or exchange downtime. A strategy that made 40% in backtest can lose 15% in live execution because the market microstructure changed.
Binance Auto-Invest buys at preset intervals regardless of valuation. If you are dollar-cost averaging into an altcoin that drops 80% because the team abandoned development, your bot keeps buying. Automation is not analysis.
The paid platforms (3Commas, Cryptohopper, TradeSanta) charge $20-$100/month and add features like TradingView signal integration, take-profit ladders, and trailing stop-losses. Those features matter if your strategy requires them. If you are running simple grid or DCA logic, they do not.
You also sacrifice integration. Paid bots often connect to [multiple wallets](https://altcoininvestor.com/best-crypto-wallets/), portfolio trackers, and tax software. Free options require manual reconciliation. If you value your time above $30/hour, the free option may cost more in operational overhead than a $50/month subscription.
## The Takeaway
Pionex is the simplest genuinely free option for traders who want grid or DCA automation without coding. Freqtrade is the most flexible for developers who can self-host and maintain Python infrastructure. Hummingbot is the only free choice for serious market making or cross-exchange arbitrage. Binance Auto-Invest works if you only need recurring purchases on Binance's liquidity and accept the premium pricing quirk.
The distinction between free and freemium is expiration date and feature access. If the platform cuts you off after 14 days or caps you at one active bot, it is a trial. If it runs indefinitely with no forced upgrade, it is free. Only five platforms meet that standard in 2026\. Everything else is marketing.
## Frequently Asked Questions
### Are free crypto trading bots actually profitable?
Free bots can be profitable if the strategy is sound and market conditions fit the logic. Grid bots profit from range-bound volatility. DCA bots accumulate position over time. The bot itself does not generate profit - it executes the strategy you define. Most traders lose money not because the bot is free, but because they automate a bad strategy or run grid logic in a trending market. Profitability depends on strategy fit, not subscription cost.
### What is the difference between Pionex and paid bots like 3Commas?
Pionex is free because it monetizes through trading fees (0.05% spot). It offers 16 built-in bots but locks you to Pionex exchange liquidity. 3Commas charges $22-$99/month and connects to multiple exchanges via API, with advanced features like TradingView signals and trailing take-profit. Paid bots offer cross-exchange flexibility and tighter risk controls. Pionex offers simplicity and zero subscription cost. The tradeoff is single-exchange lock-in versus multi-platform access.
### Do I need coding skills to use free crypto trading bots?
Pionex, Binance Auto-Invest, and KuCoin native bots require zero coding. You configure parameters through a GUI and the bot executes. Freqtrade and Hummingbot require Python familiarity, command-line comfort, and self-hosting infrastructure. If you have never written code, use exchange-native bots. If you have shipped software in any language, you can learn Freqtrade within a few weeks. The skill requirement separates exchange-locked simplicity from open-source flexibility.
### Can free trading bots connect to multiple exchanges at once?
Freqtrade and Hummingbot connect to 30+ exchanges via API and can run strategies across multiple venues simultaneously. Pionex, Binance Auto-Invest, and KuCoin bots only operate on their respective exchanges. If you need cross-exchange arbitrage or liquidity aggregation, you must use open-source bots and manage API keys yourself. Exchange-native bots sacrifice multi-platform access for zero-config simplicity and built-in execution infrastructure.
### What are the hidden costs of free open-source trading bots?
Freqtrade and Hummingbot require a VPS or cloud server for 24/7 uptime, typically costing $5-$30/month depending on instance specs and latency requirements. You also pay in time: initial setup, ongoing maintenance, debugging API failures, and strategy optimization. If you value your time at $30/hour and spend five hours per month on bot maintenance, the real cost is $150/month plus hosting. The software is free. The operational overhead is not.
The Weekly Yield Report
You now know which five platforms offer genuine free automation and which require Python fluency. Those requirements will not change, but new platforms and features will emerge quarterly.
Every Thursday: where crypto yield actually is - stablecoins, liquid staking and DeFi lending, with the risk named next to the rate and what changed since last week.
[Get it free every Thursday](#/portal/signup)
Free. No trade calls, no allocations, no hype. Unsubscribe in one click.
### Best DeFi Wallets For Multi-Chain Yield: Hardware, Browser, And Mobile Options Compared
URL: https://altcoininvestor.com/best-defi-wallet/
Last updated: 2026-10-09T23:07:18.000Z
## The Decision Most Reviews Miss

Most DeFi wallet comparisons rank features, chain support, and popularity. That structure misses what actually costs you money: signing a transaction you did not understand, granting an approval you cannot revoke, or deploying capital into a protocol whose contract interaction your wallet never showed you clearly. The wallet decision is not about features. It is about transaction simulation quality, approval visibility, and whether the interface stops you from getting rekt before you click confirm.
I have watched operators lose five-figure positions to approval drains that a better wallet would have flagged. I have seen yield allocators switch chains manually in MetaMask and send funds to the wrong network because the interface did not stop them. I have reviewed transaction logs where a wallet showed "Contract Interaction" with no detail, and the signer approved a function that transferred their entire balance to an attacker-controlled address.
This comparison evaluates MetaMask, Rabby, Rainbow, Ledger Wallet, and Safe by what matters when you are moving real capital into DeFi: simulation accuracy, pre-sign warnings, revoke tooling, multi-chain UX, and hardware wallet support. The goal is not to pick the most popular wallet. The goal is to pick the wallet that keeps your yield positions intact.
## Transaction Simulation: What You See Before You Sign
Transaction simulation is the single most important safety feature in a DeFi wallet. It shows you what a transaction will do before you approve it: which tokens will leave your wallet, which tokens will arrive, which contract will gain approval, and what the gas cost will be. Wallets that skip simulation or show vague summaries ("Contract Interaction") leave you blind.
Rabby achieves a SIGN-8 score of 36 out of 40 for pre-sign simulation quality, the highest of any EVM wallet tested. It shows exact token changes, gas estimates, and security warnings with 98.7% accuracy across 47 supported networks. When you approve a transaction in Rabby, you see balance-change previews, approval grants, and automatic chain switching before you sign. If the transaction requests an unlimited token approval or interacts with a contract flagged by Rabby's security checks, you see a warning before you confirm.
MetaMask scores 31 out of 40 on the same benchmark. It offers basic simulation but less detail on balance changes and fewer warnings on risky approvals. MetaMask's Transaction Shield feature adds coverage for losses up to $10,000 per month, but only on transactions that pass its automated checks. If the simulation misses a risk or if you override a warning, you bear the loss.
Rainbow focuses on asset display and ENS-friendly UX. It lacks the deep power-user safety tooling of Rabby. In-app swaps include a small Rainbow fee, and transaction previews are less detailed. For casual users on Ethereum and Layer 2 networks, Rainbow offers a smoother interface. For active DeFi allocators moving capital across protocols, the simulation gap matters.
Ledger Wallet delivers transaction simulation through its Transaction Check and Clear Signing features. Both work to ensure you can verify transaction details and detect threats before you sign. The difference is that every signature requires hardware confirmation, adding friction but dramatically reducing the risk of automated approval drains.
Safe (formerly Gnosis Safe) does not simulate individual transactions the way a hot wallet does. Instead, it requires multiple authorized signers to approve any transaction before it executes. This structure prevents single-point-of-failure approvals but does not replace simulation. A multisig with poor proposal hygiene can still approve a bad transaction if none of the signers caught the risk.
## Chain Support And The Multi-Chain Tax

If you run yield positions across Ethereum, Arbitrum, Optimism, Polygon, and Base, your wallet needs to handle chain switching without manual intervention. If you also hold Bitcoin, Solana, or Cosmos assets, you need a wallet that supports non-EVM chains or you will run multiple wallets and fragment your security surface.
Rabby is EVM-only. It covers 70+ integrated chains as of September 2026, including Ethereum, all major Layer 2 networks, Binance Smart Chain, Avalanche, and Fantom. It does not support Bitcoin, Solana, TRON, or Cosmos. Rabby automatically detects which chain a dApp is using and switches your wallet context without manual network selection. For EVM-native users, this eliminates the most common mistake: signing a transaction on the wrong network.
MetaMask now supports Bitcoin, Solana, and TRON alongside EVM chains. This makes it the most flexible hot wallet for multi-protocol allocators. The trade-off is that MetaMask requires manual chain switching for most dApps and shows less granular transaction detail than Rabby on EVM interactions.
Ledger Wallet supports 5,500+ digital assets across Bitcoin, Ethereum, Solana, Polkadot, Cosmos, and hundreds of other blockchains. Ledger Wallet 4.0 integrates over 15 independent swap providers, with private keys staying isolated in the Secure Element chip. You can swap across providers, stake and earn yield directly from your portfolio, connect to dApps without browser extensions, and pay network fees with the token you are swapping. [Ledger Wallet 4.0](https://www.ledger.com/academy/topics/ledgersolutions/ledger-wallet-4-0-your-gateway-to-more-choice-in-multichain-defi) also integrates protocols like Aave, Morpho, and Compound to offer up to 9.9% APY directly within the hardware-secured interface.
Rainbow is built for Ethereum and its Layer 2 networks. It is open source, mobile-first with a browser extension, and delivers a delightful UX for users who stay within the Ethereum ecosystem. It does not support Bitcoin, Solana, or other non-EVM chains.
Safe is chain-agnostic in theory but deployed primarily on Ethereum and EVM-compatible networks. It is designed for treasury management and DAO operations, not for retail multi-chain yield farming.
### What The Chain Gap Costs You
If you hold BTC and SOL alongside your EVM yield positions, you will run two wallets: one for EVM (Rabby or MetaMask) and Ledger for everything else. That means two seed phrases, two security surfaces, and two sets of approvals to manage. If you are EVM-only, Rabby eliminates the chain-switching tax. If you allocate across protocols on Bitcoin, Solana, and Ethereum, Ledger Wallet or MetaMask are the only options that cover all three without fragmenting your custody.
## Approval Management: The Risk Most Wallets Hide
Every token approval grants a smart contract permission to spend tokens from your wallet. Without active management, unlimited approvals remain active indefinitely. Modern wallets and tools like Revoke.cash allow users to review and revoke existing approvals, but most wallets bury this functionality or omit it entirely.
Rabby surfaces which contracts hold allowances and lets you revoke with a couple clicks. It tracks newly approved contracts and flags suspicious patterns, like when a dApp suddenly requests broader allowances mid-session. Rabby catches 34% more potentially malicious transactions than MetaMask, primarily by flagging risky approvals and phishing contracts before you sign.
MetaMask does not include native approval management. You can connect MetaMask to Revoke.cash or Etherscan's token approval checker, but this requires a separate workflow and most users never do it. MetaMask's Transaction Shield covers some losses from malicious approvals, but only if the transaction passed MetaMask's automated checks. If you override a warning or approve a transaction that MetaMask did not flag, you are not covered.
Ledger Wallet shows approval requests on the hardware device screen, forcing you to confirm each approval manually. This creates friction but prevents automated approval drains. You cannot sign an unlimited approval by accident when the device screen shows "Approve unlimited DAI to contract 0x...".
Rainbow and Safe do not offer built-in approval management. Rainbow users must use external tools. Safe users rely on multisig governance to prevent bad approvals, but this does not replace visibility into which contracts already hold permissions.
## Hardware Wallet Support For Large Allocations
For balances above roughly $1,000 to $2,000, the $50 to $150 cost of a hardware wallet is always justified. [Hardware wallets](https://altcoininvestor.com/best-crypto-hardware-wallets/) secure your keys offline and require physical confirmation for every transaction. You can connect Ledger or Trezor to whichever software wallet you prefer. Rabby, MetaMask, Rainbow, and others all support hardware signers.
Rabby offers automatic hardware wallet detection with clear on-screen prompts. It supports Ledger, Trezor, Keystone, GridPlus, imKey, and OneKey. When you connect a hardware device to Rabby, the wallet continues to show full transaction simulation and approval warnings, but every signature requires device confirmation.
MetaMask supports GridPlus Lattice and other hardware devices. Setup requires more manual configuration than Rabby, but once connected the workflow is similar: simulate in software, sign on hardware.
Ledger Wallet is the hardware wallet. Every transaction, swap, and approval flows through the Secure Element chip. The trade-off is signing friction. If you are rebalancing yield positions daily, hardware confirmation on every action slows your workflow. If you are allocating five- or six-figure capital and holding for weeks or months, the friction is worth the security.
Rainbow supports hardware wallet connections but the mobile-first design makes hardware workflows less convenient than on desktop. Safe does not integrate hardware wallets directly. Instead, each multisig signer can use a hardware wallet for their individual signature, adding a layer of protection at the signer level.
## Wallet-By-Wallet Breakdown
### Rabby: Best For Active EVM Yield Allocators
Rabby simulates every transaction before you sign, manages approvals in-app, switches networks automatically, and adds no swap fee. It integrates aggregators like 1inch with zero wallet-level fees, compared to MetaMask's 0.875% native aggregator fee. As of September 11, 2026, Rabby's standard in-wallet swap fee is 0.25%, compared with MetaMask's 0.875%.
Rabby is open source and audited annually by SlowMist and Cure53\. It is developed by the DeBank team, a reputable blockchain data provider. Transaction previews, approval visibility, and automatic chain switching make it better suited to active EVM use than a basic hot wallet.
Rabby is best for allocators running 5 to 15 yield positions across Ethereum, Arbitrum, Optimism, Polygon, Base, and other EVM chains. It is not suitable if you hold Bitcoin, Solana, or other non-EVM assets in the same wallet.
### MetaMask: Widest dApp Reach, Weakest DeFi Safety
MetaMask has served as the baseline standard for EVM compatibility for years. It offers broad dApp support, comprehensive developer integrations, and now supports Bitcoin, Solana, and TRON alongside EVM chains. Entry is free as of August 2026\. The Transaction Shield subscription costs $9.99 per month or $99 annually, with a 14-day free trial.
MetaMask's simulation is weaker than Rabby's. It shows fewer details on balance changes and provides fewer warnings on risky approvals. For users who need multi-chain support beyond EVM and are willing to accept weaker transaction previews, MetaMask is the fallback option. For EVM-only allocators, Rabby is better.
### Ledger Wallet: Strongest Security, Highest Friction
Ledger Wallet supports 5,500+ assets across Bitcoin, Ethereum, Solana, Polkadot, Cosmos, and more. Every private key lives in the Secure Element chip. Every transaction requires hardware confirmation. Ledger Wallet 4.0 integrates DeFi protocols like Aave, Morpho, and Compound, delivering up to 9.9% APY on stablecoin deposits without exporting keys.
Ledger is best for long-term holdings and large allocations where security outweighs convenience. It is not ideal for users who rebalance daily or interact with multiple dApps per session. The friction is the feature.
### Safe: Best For Treasuries And Teams
Safe (formerly Gnosis Safe) offers multi-signature support. It requires multiple authorized signers before any treasury action executes. This prevents single-point-of-failure approvals and is the standard infrastructure for DAO treasuries, protocol reserves, and team funds.
Safe does not replace a personal wallet. It is too slow for individual yield farming. A multisig with poor signer hygiene or bad proposals can still execute risky transactions if none of the signers caught the error. Safe is the right tool for shared capital, not for solo allocators.
### Rainbow: Best UX, Weakest Power-User Tooling
Rainbow is open source, mobile-first, and built for Ethereum and Layer 2 networks. Its strength is asset display, ENS-friendly design, and a smoother feel across Ethereum and L2s. In-app swaps include a small Rainbow fee, and it lacks the deep power-user safety tooling of Rabby.
Rainbow is best for casual Ethereum users who prioritize interface over transaction simulation depth. For active DeFi allocators, the simulation and approval-management gaps make Rabby a better choice.
## Who Each Wallet Is Right For
If you are running yield positions across 5 to 15 EVM protocols, rebalancing weekly or monthly, and your allocations range from four to six figures, use Rabby connected to a Ledger or Trezor hardware wallet. Rabby gives you the strongest transaction simulation, automatic chain switching, and approval management. The hardware wallet secures your keys. This combination is the highest-security, highest-clarity setup for active DeFi.
If you hold Bitcoin, Solana, and Ethereum in one wallet and you need broad chain support without running multiple seed phrases, use Ledger Wallet standalone or MetaMask for hot wallet access. MetaMask now covers BTC, SOL, and EVM chains. Ledger covers 5,500+ assets with hardware security. Both sacrifice some EVM-specific simulation quality compared to Rabby, but they handle multi-protocol allocations without fragmentation.
If you are managing a DAO treasury, protocol reserve, or team fund, use Safe with individual signers using hardware wallets. Multisig governance prevents single-point-of-failure approvals. Add transaction simulation by having at least one signer review proposals through Rabby or a block explorer before signing in Safe.
If you are a casual Ethereum user with smaller balances (under $2,000) and you prioritize interface over simulation depth, use Rainbow. Its mobile-first UX and ENS integration make it the smoothest experience for Ethereum and L2 users. For larger allocations or complex DeFi activity, the lack of power-user tooling becomes a liability.
## My Recommendation
Use Rabby connected to a Ledger hardware wallet. Rabby delivers the clearest transaction simulation, the strongest approval management, and automatic chain switching across 70+ EVM networks. Ledger secures your private keys offline and forces manual confirmation for every signature. This setup combines the best software interface for DeFi with the strongest custody model for large allocations.
If you cannot use hardware, run Rabby as a hot wallet and set up a second cold wallet (Ledger standalone) for long-term holdings. Move active yield positions into Rabby for daily management. Move reserve capital into Ledger and touch it only when rebalancing across weeks or months.
Do not use MetaMask unless you need Bitcoin or Solana support in the same wallet. MetaMask's simulation is weaker, its approval management is absent, and its swap fees are higher. The only advantage is multi-chain coverage beyond EVM. If you are EVM-only, Rabby is better in every dimension that matters for DeFi safety.
Do not use Rainbow for allocations above $2,000 or for complex DeFi activity. Its interface is excellent, but the lack of granular transaction simulation and approval tooling creates risk at larger allocation sizes.
If you are managing shared capital, use Safe. If you are managing personal capital, do not. Multisig adds governance overhead that slows individual decision-making. For solo allocators, hardware-secured hot wallets (Rabby + Ledger) deliver better security with less operational friction.
## The Takeaway
The wallet decision is not about features or popularity. It is about whether you see what you are signing before you approve it. Rabby catches 34% more malicious transactions than MetaMask because it shows you balance changes, approval grants, and contract risks before you click confirm. That difference is worth real money at five-figure allocations.
Run this check before you deploy capital into any new protocol: open the transaction in your wallet, read the simulation output, confirm the balance changes match your intent, and verify the contract address against the protocol's official documentation. If your wallet does not show you this information clearly, you are signing blind. If you are signing blind, you are one phishing link away from losing your position.
The best DeFi wallet is the one that stops you from getting rekt. For EVM allocators, that wallet is Rabby connected to a Ledger. For multi-chain allocators, that wallet is Ledger Wallet standalone or MetaMask with extreme caution on every approval. For DAO treasuries, that wallet is Safe with hardware-backed signers. Choose based on your allocation size, your chain coverage, and your tolerance for signing friction. Then verify every transaction before you confirm it. The simulation only works if you read it.
## Frequently Asked Questions
### What is the most important feature in a DeFi wallet?
Transaction simulation quality is the most important feature. It shows you what a transaction will do before you approve it: which tokens leave, which arrive, which contract gains approval, and what the gas cost will be. Rabby achieves a SIGN-8 score of 36 out of 40 for pre-sign simulation, showing exact token changes with 98.7% accuracy across 47 networks. Wallets that skip simulation or show vague summaries leave you blind to approval drains and malicious contract interactions.
### Should I use a hardware wallet for DeFi yield positions?
Yes, for balances above $1,000 to $2,000\. Hardware wallets like Ledger or Trezor secure your private keys offline and require physical confirmation for every transaction. You can connect them to software wallets like Rabby or MetaMask for transaction simulation while keeping keys in hardware. For five- or six-figure allocations, the $50 to $150 hardware cost and added signing friction are always justified by the security gain.
### What is the difference between Rabby and MetaMask?
Rabby offers stronger transaction simulation, automatic chain switching, built-in approval management, and zero swap fees on aggregators like 1inch. It scores 36 out of 40 on SIGN-8 simulation quality compared to MetaMask's 31 out of 40\. Rabby is EVM-only, covering 70+ chains but not Bitcoin or Solana. MetaMask now supports Bitcoin, Solana, and TRON alongside EVM chains but requires manual chain switching and lacks native approval tooling. Rabby catches 34% more malicious transactions than MetaMask.
### How do I manage token approvals in my DeFi wallet?
Use Rabby's built-in approval manager or connect MetaMask to Revoke.cash or Etherscan's token approval checker. Every token approval grants a smart contract permission to spend tokens from your wallet. Unlimited approvals remain active indefinitely unless revoked. Rabby surfaces which contracts hold allowances and flags suspicious patterns, like when a dApp requests broader permissions mid-session. Check and revoke unused approvals quarterly to reduce your attack surface.
### Which wallet should I use for multi-chain yield positions?
If you stay within EVM chains (Ethereum, Arbitrum, Optimism, Polygon, Base), use Rabby connected to a Ledger hardware wallet. Rabby handles automatic chain switching and delivers the strongest transaction simulation. If you hold Bitcoin, Solana, and Ethereum in one wallet, use Ledger Wallet standalone for 5,500+ asset support or MetaMask for hot wallet access across BTC, SOL, and EVM. Both sacrifice some EVM-specific simulation quality but handle multi-protocol allocations without running multiple seed phrases.
Tool mentioned above
Ledger
Ledger devices display the full transaction on their own screen before you approve it, which is what stops an approval exploit at the point it matters.
[See Ledger devices](https://shop.ledger.com/?r=90612ff43561)
We may earn a commission if you sign up through this link, at no cost to you. It does not change what gets recommended.
The Weekly Yield Report
You just compared five wallets by simulation quality, approval tooling, and multi-chain support. That ranking will shift as Ledger, Rabby, and MetaMask ship updates quarterly.
Every Thursday: where crypto yield actually is - stablecoins, liquid staking and DeFi lending, with the risk named next to the rate and what changed since last week.
[Get it free every Thursday](#/portal/signup)
Free. No trade calls, no allocations, no hype. Unsubscribe in one click.
### How To Set Up A Hardware Wallet Without Losing Your Crypto
URL: https://altcoininvestor.com/how-to-set-up-hardware-wallet/
Last updated: 2026-10-09T21:05:36.000Z
## What You Will Accomplish By The End Of This Setup
You are going to set up a hardware wallet that you can actually recover from if the device is lost, stolen, or stops working. You will know your backup works because you will test it before moving any meaningful money onto the device. You will also know which specific mistakes cause permanent loss and how to avoid them.
Prerequisites: You need $60-$150 to buy a hardware wallet from the manufacturer. You need a computer or smartphone. You need 90 minutes of uninterrupted time in a private space where no one can see your screen or your backup materials. You should have already decided that you want self-custody rather than leaving funds on an exchange. If you have not made that decision yet, read [this guide to custodial versus self-custody wallets](https://altcoininvestor.com/custodial-vs-non-custodial-wallet/) first.
## What Usually Goes Wrong During Hardware Wallet Setup

According to Chainalysis data, over $4.3 billion in cryptocurrency was lost to user error and security mistakes in 2026, with hardware wallet passphrase errors accounting for an estimated 23% of permanent loss cases. These are not hacks. These are people who cannot access their own funds because they made a mistake during setup and never found out until it was too late.
Here are the specific failure modes that cause permanent loss:
**Writing down the seed phrase wrong.** You copy word 7 as "absent" when the screen showed "abstract." You write "their" instead of "there." You skip a word. You write them out of order. The device does not verify your transcription during setup. You find out months or years later when you try to recover and the phrase does not work. If you got even one word wrong, the funds are gone forever.
**Never testing the backup.** You write down the 12 or 24 words. You move $10,000 onto the device. Six months later the device breaks. You enter your seed phrase into a replacement device and discover it generates different addresses. Your original backup was wrong and you never knew. The funds are unreachable.
**Storing the backup insecurely.** You take a photo of your seed phrase and store it in iCloud. You type it into a notes app. You email it to yourself. Someone gets access to your account and now they have full control of your wallet. This happens regularly. Never digitize your seed phrase in any form.
**Falling for a phishing site during setup.** You search "Ledger setup" or "Trezor setup" and click a sponsored result that looks official. The fake site asks you to "verify" your seed phrase by entering it. The moment you do, the attacker drains every wallet tied to those words. The real manufacturer setup sites never ask you to enter your seed phrase. They only ask you to write it down.
**Buying from a third-party seller.** You buy a hardware wallet on eBay or Amazon marketplace to save $15\. The device arrives with a pre-filled seed phrase card in the box. You think this is normal. You initialize the device using those words. The seller already has a copy of the seed phrase and drains your wallet the moment you deposit funds.
Every one of these mistakes is avoidable. The rest of this guide walks you through the setup process in a way that prevents all five.
## Which Hardware Wallet To Buy First
If you are setting up your first hardware wallet, I recommend the Ledger Nano X ($149) or the Trezor Safe 3 ($59).
The Ledger Nano X supports over 5,500 assets, has Bluetooth for mobile use, and integrates with Ledger Live, which is the easiest companion app for beginners. It costs $149\. This is the device I used for my first hardware wallet setup and it remains my recommendation for anyone who plans to hold more than $1,000 in crypto or wants to manage assets across multiple blockchains.
The Trezor Safe 3 costs $59 and supports around 1,000 cryptocurrencies. It has EAL6+ security certification and works with Trezor Suite, which is straightforward software. The trade-off is a smaller screen and no Bluetooth. If your budget is tight and you are primarily holding Bitcoin, Ethereum, or major stablecoins, the Trezor Safe 3 is a solid first device.
Do not buy either device from Amazon, eBay, or any third-party reseller. Order directly from [ledger.com](https://ledger.com/start) or [trezor.io](https://suite.trezor.io). Third-party sellers have been caught tampering with devices, pre-loading seed phrases, or swapping out components. The risk is not hypothetical. It happens often enough that both manufacturers explicitly warn against it.
When the package arrives, inspect it before opening. The box should be sealed with manufacturer tamper-evident tape. If the box has been opened and resealed, if the shrink wrap looks loose, or if anything feels off, do not use the device. Contact the manufacturer and request a replacement.
Open the box in private. The contents should include the device, a USB cable, blank recovery seed cards (paper cards for writing down your seed phrase), stickers, and a getting started guide. If you find a seed phrase card that is already filled in, the device is compromised. Do not use it. Contact the manufacturer immediately.
## Step 1: Download The Official Companion Software
Before you connect the device, download the official companion software. For Ledger, that is Ledger Live. For Trezor, that is Trezor Suite. Do not search for these in Google and click the first result. Sponsored search results are a common phishing vector.
Go directly to [ledger.com/start](https://ledger.com/start) if you bought a Ledger or [suite.trezor.io](https://suite.trezor.io) if you bought a Trezor. Download the software from those URLs only.
Install the software and open it. Do not connect your device yet. The software will prompt you to connect when it is ready.
## Step 2: Initialize The Device And Generate Your Seed Phrase
Connect the hardware wallet to your computer using the included USB cable. The device will power on and walk you through initialization.
You will be asked to set a PIN. Choose a PIN that is 6-8 digits long. Do not use 1234 or any repeating pattern. Write the PIN down separately from your seed phrase and store it in a different location. If someone finds your device, the PIN is the only barrier preventing immediate access. After three incorrect PIN attempts, most devices wipe themselves, so the PIN does not need to be unguessable forever. It just needs to stop opportunistic theft.
After you set the PIN, the device will generate your seed phrase. This is the single most important moment of the entire process.
The device will display 12 or 24 randomly generated words, one at a time. These words are your backup. If the device is lost, broken, or stolen, these words allow you to recover every wallet and every private key the device ever generated. If you lose these words, you lose your crypto. If someone else gets these words, they can steal your crypto. There is no customer service line. There is no password reset. The seed phrase is the only backup that exists.
Write the words down on the recovery card that came with the device. Use a pen, not a pencil. Write clearly. Double-check every word as you write it. The BIP-39 word list contains 2,048 words, and many are similar: "cloud" and "clown," "begin" and "begin," "art" and "artist." One wrong letter changes the word and breaks the backup.
Number each word. Seed phrases must be entered in the exact order they were generated. If you write them out of order or skip a number, the recovery will fail.
Do not take a photo. Do not type the words into your phone, your computer, a notes app, a password manager, or any digital device. Do not say the words out loud if anyone else is nearby. Do not store the words in cloud storage, email, or any online location. Write them on paper with a pen.
After the device shows you all the words, it will ask you to verify. It will prompt you to select word 3, word 9, or another word from the list. This step confirms that you wrote the words down. Do not skip it.
## Step 3: Test The Backup Before Depositing Any Funds
This is the step most beginners skip. It is also the step that prevents permanent loss.
A backup is not proven until it is restored. You do not know if you wrote the seed phrase down correctly until you test it. Testing means wiping the device, restoring from your written backup, and confirming that the restored device generates the same receiving address as the original.
Here is how to do it. Before you send any crypto to the device, write down the first receiving address the device generated. In Ledger Live or Trezor Suite, navigate to your Bitcoin or Ethereum account and copy the receiving address. Write it down or save it in a text file on your computer. You are going to compare this address to the one generated after recovery.
Now wipe the device. In Ledger Live or Trezor Suite, there is an option to reset or wipe the device. This deletes everything and returns the device to factory settings. Do this now, while the device is still empty.
After the device is wiped, select the recovery option. The device will prompt you to enter your seed phrase. Enter each word in order, exactly as you wrote it down.
Once recovery is complete, open Ledger Live or Trezor Suite and navigate to the same account type you checked earlier (Bitcoin, Ethereum, whichever you used). Compare the receiving address. If the address matches the one you wrote down before wiping the device, your backup is correct. If the address does not match, you made a transcription error and you need to start over.
This test costs you nothing and takes 15 minutes. It is the difference between a backup you trust and a backup you hope works.
## Step 4: Store The Seed Phrase Securely
Paper survives neither fire nor water. House fires and floods destroy more seed phrases than burglary. If you plan to store significant value on this device (more than $5,000), write the seed phrase on metal, not paper.
Metal seed phrase backup kits are available from multiple manufacturers. They cost $30-$70 and allow you to stamp or engrave your words into stainless steel. Metal survives fire up to 1,400 degrees Celsius and is waterproof. If your house burns down, the metal backup will still be readable.
Store the backup in a location separate from the device. If both are stolen together, the thief has everything. If the device is in your home, store the backup at a different location: a safe deposit box, a trusted family member's house, a secure offsite location. If you cannot do that, at minimum store the device and the backup in different rooms.
Do not store the PIN with the seed phrase. If someone finds your backup, the PIN is the only remaining barrier.
## Step 5: Send A Test Transaction Before Committing Real Money
You have tested the backup. Now test a real transaction. Send $5 or $10 worth of crypto to the device. Confirm that it arrives. Confirm that you can see the balance in Ledger Live or Trezor Suite. Then send it back out to another address you control, such as an exchange wallet.
This step teaches you how transactions work, how long they take, and what fees look like. It also confirms that the device is functioning normally and that you understand the approval process. Hardware wallets require physical confirmation on the device for every outgoing transaction. You will see the transaction details on the device screen. You confirm by pressing a button. If the details on the screen do not match what you intended to send, do not confirm.
After the test transaction succeeds in both directions, you are ready to move real funds onto the device.
## What To Do If Recovery Fails During The Test
If the restored device generates a different address than the original, you made a transcription error. Do not panic. The device is empty. No funds are at risk. Here is how to fix it.
Go back to your written seed phrase. Compare it word by word to the BIP-39 word list, which is publicly available and can be found on the Ledger or Trezor websites. Every word on your list must appear exactly as spelled in the BIP-39 standard. Check for common transcription mistakes: "their" versus "there," "cloud" versus "clown," "absent" versus "abstract."
If you cannot find the error, wipe the device again and start completely over. Generate a new seed phrase. Write it down again. Test the backup again. This time, write more slowly and double-check every letter of every word before moving to the next one.
Do not try to brute-force guess the correct word. A single wrong word in a 12-word phrase creates 2,048 possible variations. A single wrong word in a 24-word phrase creates 49,152 variations. Guessing is not practical. Start over with a new seed phrase.
## Advanced Option: Add A Passphrase (The 25th Word)
Most hardware wallets support an optional passphrase, sometimes called a 25th word or hidden wallet. The passphrase creates an entirely separate wallet from the same seed phrase. If someone finds your 12 or 24 words, they cannot access the passphrase-protected wallet without also knowing the passphrase.
The passphrase is not stored on the device. You must remember it or write it down separately. If you forget the passphrase, the funds behind it are gone forever. Entering your seed phrase without the passphrase will open a real but empty wallet. The funds are not lost. They sit behind a secret you cannot reproduce, and there is no recovery mechanism.
I do not recommend using a passphrase for your first hardware wallet setup. It adds complexity and introduces a new failure mode. Once you are comfortable with basic hardware wallet operation and have successfully recovered from a seed phrase at least once, then consider adding a passphrase to a second device for higher-value holdings.
## What To Do If You Lose Both The Device And The Backup
If you lost both the device and the backup, and you never enabled a recovery service in advance, the funds are almost certainly unreachable. A 12 or 24-word phrase represents a number so large that guessing it is not a practical exercise now or with any realistic future hardware. There is no customer service line, no master key, and no override.
This is why testing your backup and storing it securely matters. Once the funds are on the device, recovery depends entirely on that backup. Treat it accordingly.
## Ongoing Maintenance: Firmware Updates And Recovery Drills
Hardware wallet manufacturers release firmware updates to patch security vulnerabilities and add features. Install firmware updates as they are released. Ledger Live and Trezor Suite will notify you when updates are available.
Before updating firmware, confirm that you still have access to your seed phrase backup. Some firmware updates require you to restore from seed after installation. If you cannot find your backup, do not update the firmware. Locate the backup first.
Run a recovery drill once per year. Wipe a second hardware wallet or use a temporary wallet in recovery-test mode and restore from your written backup. Confirm that the restored device generates the same addresses as your primary device. This confirms that your backup is still readable, still correct, and still stored securely. Paper degrades over time. Ink fades. Fire-resistant safes are not always waterproof. A yearly drill catches problems before they become catastrophic.
## What Hardware Wallets Do Not Protect Against
A hardware wallet protects your private keys from malware, phishing sites, and remote attackers. It does not protect you from approving malicious transactions yourself. If a dApp asks you to sign a transaction that grants unlimited approval to spend your tokens, the hardware wallet will show you that approval request on the device screen. If you press the confirmation button anyway, the approval goes through. The hardware wallet cannot stop you from confirming something you should not confirm.
It also does not protect you from sending funds to the wrong address. If you copy a withdrawal address from an exchange and a clipboard malware changes it before you paste, the hardware wallet will show you the malicious address on the screen. If you do not check the address carefully and confirm the transaction, the funds are gone.
Hardware wallets are not magic. They are tools. They keep your private keys offline and require physical confirmation for every transaction. That is all they do. The rest is still your responsibility.
## The Takeaway
You now know how to set up a hardware wallet, generate a seed phrase, test the backup, and store it securely. The checkpoint procedure is not optional. Test your backup before depositing any meaningful funds. Write the seed phrase on metal if you are storing more than $5,000\. Run a recovery drill once per year. If you follow this process, you will avoid the mistakes that cost other users $4.3 billion in 2026.
Your next step: Buy a Ledger Nano X or Trezor Safe 3 directly from the manufacturer. Set it up following the steps above. Test the backup. Send $10 in, then send it back out. Once the test succeeds, move your funds off the exchange and onto the device. If you want more detail on specific Ledger setup steps, [this Ledger-specific guide](https://altcoininvestor.com/how-to-setup-ledger/) walks through the Ledger Live interface in greater depth. For broader context on when hardware wallets make sense and when exchange custody is appropriate, see [the hardware wallet comparison guide](https://altcoininvestor.com/best-crypto-hardware-wallets/).
## Frequently Asked Questions
### What happens if I write down my seed phrase wrong?
If you write down even one word incorrectly, your backup will not work when you try to recover. This is why testing your backup immediately after setup is critical. Wipe the device, restore from your written seed phrase, and confirm that the restored device generates the same receiving address as the original. If the addresses do not match, you made a transcription error and need to start over with a new seed phrase before depositing any funds.
### Can I store my seed phrase in a password manager?
No. Never store your seed phrase digitally in any form: not in a password manager, not in a notes app, not in cloud storage, not in email, and not as a photo. Every one of these methods has resulted in real losses when accounts were compromised. Write the seed phrase on paper with a pen, and for holdings over $5,000, engrave it on metal. Store the physical backup in a secure location separate from the device.
### Do I need to buy the most expensive hardware wallet?
No. The Trezor Safe 3 costs $59 and provides EAL6+ security suitable for most beginners holding Bitcoin, Ethereum, or major stablecoins. The Ledger Nano X costs $149 and supports over 5,500 assets with Bluetooth and better mobile integration. Choose based on the number of assets you plan to hold and your budget. Both are secure when set up correctly. The critical factor is not the device price but whether you test your backup before depositing funds.
### What is a passphrase and do I need one?
A passphrase, sometimes called the 25th word, creates a separate wallet from the same seed phrase. If someone finds your 12 or 24 words, they cannot access the passphrase-protected wallet without also knowing the passphrase. However, if you forget the passphrase, those funds are permanently lost. I do not recommend using a passphrase for your first hardware wallet. Master the basics first, including successful seed phrase recovery, before adding this additional layer.
### How often should I test my hardware wallet backup?
Test your backup immediately after setup before depositing any funds. After that, run a recovery drill once per year. Wipe a second device or use recovery-test mode, restore from your written seed phrase, and confirm the addresses match your primary device. This confirms your backup is still readable, correctly transcribed, and stored securely. Paper degrades over time and ink can fade, so annual verification catches problems before they become catastrophic.
Tool mentioned above
Ledger
Ledger devices display the full transaction on their own screen before you approve it, which is what stops an approval exploit at the point it matters.
[See Ledger devices](https://shop.ledger.com/?r=90612ff43561)
We may earn a commission if you sign up through this link, at no cost to you. It does not change what gets recommended.
The Weekly Yield Report
You just walked through the setup procedure that prevents the $4.3 billion in seed phrase mistakes documented in 2026\. That number will be different next year, but the failure modes will not.
Every Thursday: where crypto yield actually is - stablecoins, liquid staking and DeFi lending, with the risk named next to the rate and what changed since last week.
[Get it free every Thursday](#/portal/signup)
Free. No trade calls, no allocations, no hype. Unsubscribe in one click.
### Safest Crypto Wallets For Large Yield Positions Compared
URL: https://altcoininvestor.com/safest-crypto-wallet-large-yield-positions/
Last updated: 2026-10-09T19:03:25.000Z
## The Security-Access Tradeoff For Large Yield Allocations
If you are holding $200,000 across Aave, Compound, and three stablecoin pools, you face a problem that small allocators never encounter. Hardware wallets like Ledger and Trezor protect your keys from remote exploits, but they also prevent programmatic transaction signing - which means you cannot rebalance positions quickly when rates move, you cannot automate compounding, and you cannot use most yield optimization tools. Smart contract multisig wallets like Gnosis Safe solve the operational friction problem and add multi-signature controls, but some DeFi protocols explicitly block contract wallet interactions as a defense against reentrancy attacks and arbitrage bots. Institutional custody platforms like Fireblocks eliminate single-point key risk entirely through multi-party computation, but they require minimum assets under management starting at $1 million, annual contracts starting at $36,000, and integration engineering that most individuals cannot justify.
For large yield allocators, the safest wallet is not the one with the strongest cryptographic design. It is the one that matches your operational requirements without introducing security gaps you cannot monitor. This piece compares hardware, multisig, and institutional custody by security architecture, DeFi protocol compatibility, operational friction, and total cost of ownership for positions between $200,000 and $2 million. The income mechanism at stake is straightforward: security measures affect both loss prevention and your ability to move capital quickly when yield opportunities shift. Choosing the wrong custody model costs you either in breach risk or in missed rate arbitrage.
## Hardware Wallets: Maximum Key Security, Maximum Operational Friction

Hardware wallets keep your private keys on a dedicated physical device that never exposes them to an internet-connected computer. Ledger's current lineup includes the Nano Gen5 at $179, the Flex at $249, and the Stax at $399\. The Nano S Plus remains available at $59 for users who do not need Bluetooth, NFC, or a 2.8-inch E-Ink screen. Trezor's 2026 lineup includes the Safe 7 at $249, which incorporates post-quantum cryptography defenses through the TROPIC01 chip, and the Safe 3 at $79\. Ledger has not yet announced quantum defenses, and Trezor remains fully open source - a meaningful distinction for users who want independent firmware audits.
For yield allocators, the security advantage is real. Hardware wallets eliminate the remote attack surface entirely. Your keys cannot be exfiltrated through browser extensions, phishing sites, or malware. [The best hardware wallets](https://altcoininvestor.com/best-crypto-hardware-wallets/) support over 5,500 cryptocurrencies and integrate with DeFi platforms through wallet connection protocols like WalletConnect. Ledger provides a more integrated experience through its Ledger Live platform, which supports staking, NFT management, and decentralized application interaction without third-party software. Trezor requires third-party integrations for DeFi access, which introduces additional trust assumptions.
The operational friction becomes material at six-figure positions. Every transaction requires physical device interaction. You cannot automate compounding. You cannot use programmatic rebalancing tools. You cannot respond to rate changes in under fifteen minutes unless you keep the device physically accessible at all times. For allocators running positions across Ethereum, Polygon, Arbitrum, and Base, this means you are manually signing every transaction - often at gas costs between $5 and $50 per action. The workflow does not scale beyond five or six active positions without becoming the primary constraint on your strategy.
Hardware wallets also carry physical custody risk. If you lose the device and do not have your seed phrase backed up correctly, your capital is gone. If an attacker gains physical access to your hardware wallet, older Trezor models remain vulnerable to fault injection attacks that can recover seed phrases. Newer models have improved, but the risk surface exists. For large allocators, the recommended configuration is a 2-of-3 multisig setup where each signer is a hardware wallet stored in a separate physical location - but that introduces the next custody layer.
## Gnosis Safe Multisig: Policy-Based Controls With DeFi Compatibility Gaps
Gnosis Safe is the industry-standard smart contract multisig wallet, securing over $100 billion in digital assets. The security model differs fundamentally from hardware wallets. Instead of protecting a single private key, Gnosis Safe requires M-of-N signatures to authorize any transaction. A 2-of-3 configuration means you designate three wallet addresses as signers, and any two must approve each transaction. This prevents single-point failures: lose or compromise one key and your funds remain secure. The platform supports programmable access logic with daily spending limits, address whitelisting, emergency recovery procedures, and transaction batching that reduces gas costs by bundling multiple actions into a single on-chain call.
Gnosis Safe runs on all EVM-compatible chains: Ethereum, Polygon, BNB Chain, Arbitrum, Avalanche, and Base. It charges no platform fees - you pay only gas costs for each transaction. For yield allocators managing positions across multiple protocols, this means you can implement policy-based security without paying institutional custody premiums. The workflow supports programmatic signing through Safe's transaction service API, which allows you to build automated rebalancing scripts that still require multi-signature approval before execution.
The critical limitation for DeFi yield allocators is protocol compatibility. Some DeFi protocols protect themselves from being accessed by other smart contracts through defenses against reentrancy attacks and arbitrage bots. When a protocol checks `msg.sender` and rejects contract wallets, your Gnosis Safe cannot interact with that protocol at all. This is not a theoretical edge case. It has affected specific lending markets, liquidity pool interfaces, and yield aggregators. The workaround requires deploying a hybrid custody model: your Safe holds the bulk of your capital, and you maintain a smaller externally-owned account (EOA) funded through the Safe for protocols that reject contract wallets.
Operational friction comes from coordination latency. Multi-signature approval requires that M signers are available and responsive. If you configure a 2-of-3 Safe and one signer is traveling without device access, you can still execute transactions. If two signers are unavailable simultaneously, your capital is operationally locked until they return. For institutional teams, this is manageable. For individuals using multiple hardware wallets as signers, the coordination overhead becomes significant when rates move quickly.
The 2025 threat landscape has evolved toward UI tampering attacks. The $1.5 billion Bybit breach in February 2025 exploited vulnerabilities in the Safe multisig front-end interface, tricking signers into authorizing malicious transactions through a fake UI. The WazirX attack in 2024 used a similar vector, exploiting discrepancies between the Liminal custody interface and the actual transaction data, resulting in a $234.9 million loss. [Crypto wallet security for active yield positions](https://altcoininvestor.com/crypto-wallet-security-active-yield-positions/) now requires that every signer independently verifies transaction data on-chain or through a separate interface before approval - a discipline that most individual allocators do not maintain consistently.
## Fireblocks And Institutional MPC: Eliminating Key Risk At Institutional Cost
Fireblocks pioneered multi-party computation custody for institutional allocators. The cryptographic architecture eliminates private keys entirely. Instead, key material is distributed across multiple parties as secret shares that never exist in reconstructed form. No single entity, including Fireblocks, can unilaterally access client funds. The platform has transferred over $6 trillion in cumulative value, supports 1,500+ tokens across 70+ blockchains, and maintains a zero-breach security record since inception. Insurance coverage starts at $30 million with options to increase.
The pricing structure reflects institutional positioning. Fireblocks Essentials starts at $999 per month for up to six months, including $1 million in quarterly outbound transaction volume, two workspaces, five users, API and SDK access, and basic 8x5 support. Per-transaction overage fees are 0.20% above the included volume. Custom Pro and Enterprise plans start at $36,000 per year and unlock personalized onboarding, 24/7 platinum support, higher API rate limits, and advanced platform features. Competing institutional platforms like Anchorage target clients with $10 million minimums, while BitGo and Copper generally start at $1 million.
For yield allocators, Fireblocks solves the operational friction problem entirely. The platform supports programmatic transaction signing through API workflows, which means you can automate compounding, rebalancing, and rate arbitrage without manual intervention. DeFi protocol compatibility is generally better than Gnosis Safe because Fireblocks uses MPC wallets that present as standard externally-owned accounts, not as contract wallets. The integration work required for DeFi access depends on whether the protocol you are using has already integrated Fireblocks as a supported wallet provider.
The total cost of ownership exceeds the published platform fee. Complex institutional implementations require integration engineering, reconciliation tooling, audit evidence preparation, and internal controls work. For individuals managing $500,000 to $2 million in yield positions, the annual cost typically runs between $40,000 and $60,000 when engineering time is included. That represents a 2% to 4% drag on capital, which erases most stablecoin yield and materially reduces net returns from higher-risk strategies. Fireblocks makes economic sense for allocators managing $5 million or more, or for institutions with compliance requirements that justify the cost regardless of return impact.
Institutional custody also introduces counterparty risk. You are trusting Fireblocks' MPC infrastructure, their key management procedures, and their operational security. The platform's zero-breach record is strong evidence, but it is not a mathematical elimination of risk. For allocators who prioritize self-custody, institutional MPC represents a trust trade-off that contradicts the foundational principle of crypto asset ownership.
## Who Each Custody Model Is Right For
Hardware wallets are correct for allocators with $50,000 to $300,000 who hold fewer than five active yield positions and do not require daily transaction activity. If you are running a simple strategy - stablecoin lending on Aave, staking ETH through Lido, and one liquidity pool on Uniswap - the operational friction is tolerable and the security model is sound. Use a Ledger Nano Gen5 or Trezor Safe 7, store your seed phrase in a fireproof safe or safety deposit box, and accept that you will manually sign every transaction. This configuration eliminates remote exploit risk entirely and costs $179 to $249 upfront with no recurring fees.
Gnosis Safe multisig is correct for allocators with $300,000 to $2 million who need policy-based security controls and can tolerate moderate operational complexity. The 2-of-3 configuration using hardware wallets as signers provides strong protection against single-key compromise while maintaining programmatic transaction capability through Safe's API. Expect to spend 30 to 60 minutes implementing the initial setup, and budget for gas costs between $50 and $150 per month depending on transaction frequency. This model works well for individuals with technical literacy or for small teams managing shared capital. It does not work if you are frequently interacting with DeFi protocols that reject contract wallets - verify compatibility before committing capital.
Fireblocks and other institutional MPC platforms are correct for allocators managing $5 million or more, or for entities with regulatory compliance obligations that require auditable custody infrastructure. If you are running a family office, managing a DAO treasury, or operating as a registered investment advisor, the cost structure makes sense because the alternative is building internal custody infrastructure that costs more. For individuals below $5 million, the annual expense erodes returns to the point where the security improvement does not justify the cost unless you have specific regulatory or tax requirements.
The hybrid model I recommend for most large individual allocators is a 2-of-3 Gnosis Safe with hardware wallets as signers, paired with a small externally-owned account funded through the Safe for protocols that reject contract wallets. Hold 90% of your capital in the Safe. Move 10% into the EOA only when you need to interact with incompatible protocols, and withdraw it back to the Safe immediately after. [The best crypto wallets for multi-protocol yield](https://altcoininvestor.com/best-crypto-wallet/) combine signing security with transaction speed - this configuration delivers both without institutional cost.
## Decision Rule For Your Next Move
Before you migrate capital into any custody model, run two tests. First, verify DeFi protocol compatibility. Connect your proposed custody wallet to every protocol you plan to use and attempt a small test transaction. Some protocols will reject Gnosis Safe or other contract wallets silently - you will not discover this until you try. Second, calculate total cost of ownership including gas fees, platform fees, and the opportunity cost of operational friction. If your custody model prevents you from rebalancing when rates move 200 basis points in a single day, that friction has a measurable dollar cost. Compare it to the security improvement you are buying. For most allocators between $200,000 and $2 million, a 2-of-3 Gnosis Safe with hardware signers delivers the best risk-adjusted return. Below $200,000, hardware wallets alone are sufficient. Above $5 million, institutional MPC starts making economic sense.
The safest crypto wallet for large yield positions is the one that prevents loss without preventing action. Security that costs you income is not actually security - it is just expensive friction. Choose the custody model that matches your operational requirements, verify compatibility before you commit capital, and monitor the threat landscape because it changes faster than most allocators realize. In 2025, [over $2 billion was lost to Web3 hacks](https://www.theblock.co/post/331626/crypto-hacks-exploits-2024) in the first half alone, with UI tampering and multisig mismanagement causing the majority of major exploits. Your custody decision is not a one-time choice - it is an ongoing operational discipline.
## Frequently Asked Questions
### What is the safest crypto wallet for holding large yield positions?
For positions between $300,000 and $2 million, a 2-of-3 Gnosis Safe multisig configuration using hardware wallets as signers provides the best security-to-flexibility ratio. This setup prevents single-key compromise while maintaining programmatic transaction capability for yield management. Below $300,000, a single hardware wallet like Ledger Nano Gen5 or Trezor Safe 7 is sufficient. Above $5 million, institutional MPC custody platforms like Fireblocks become cost-effective despite annual fees starting at $36,000.
### Can I use Gnosis Safe multisig with all DeFi protocols?
No. Some DeFi protocols explicitly reject transactions from contract wallets as a defense against reentrancy attacks and arbitrage bots. When a protocol checks the sender address and blocks smart contracts, your Gnosis Safe cannot interact with it. The workaround is maintaining a small externally-owned account funded through your Safe for incompatible protocols. Always test compatibility with a small transaction before committing large positions. The hybrid model holds 90% in the Safe and moves 10% to an EOA only when necessary.
### How much does institutional custody cost for crypto yield positions?
Fireblocks Essentials starts at $999 per month with $1 million quarterly outbound volume included and 0.20% overage fees. Custom Enterprise plans start at $36,000 annually. Total cost of ownership including integration engineering, reconciliation tooling, and internal controls typically runs $40,000 to $60,000 per year for implementations supporting active DeFi strategies. This represents a 2% to 4% annual drag on a $2 million position. Competing platforms like Anchorage require $10 million minimums, while BitGo and Copper generally start at $1 million.
### What are the main security risks with hardware wallets?
Hardware wallets eliminate remote exploit risk but introduce physical custody vulnerabilities. If you lose the device without proper seed phrase backup, your capital is permanently lost. If an attacker gains physical access, older Trezor models remain vulnerable to fault injection attacks that can extract seed phrases, though newer models have improved. For large positions, single hardware wallet custody creates operational bottlenecks that prevent rapid rebalancing and eliminate programmatic transaction signing capability required for yield optimization tools.
### Why did the 2025 Bybit hack succeed against a multisig wallet?
The $1.5 billion Bybit breach exploited UI tampering in the Safe multisig front-end interface, displaying fake transaction data to signers who approved malicious transfers. Similar attacks hit WazirX for $234.9 million and Radiant Capital for $50 million by compromising the signing workflow rather than the cryptographic security. This demonstrates that multisig security requires every signer to independently verify transaction data on-chain or through separate interfaces before approval. The cryptography was sound; the operational discipline failed.
Tool mentioned above
Ledger
Ledger devices display the full transaction on their own screen before you approve it, which is what stops an approval exploit at the point it matters.
[See Ledger devices](https://shop.ledger.com/?r=90612ff43561)
We may earn a commission if you sign up through this link, at no cost to you. It does not change what gets recommended.
The Weekly Yield Report
You just compared three custody models protecting positions from $200,000 to $5 million. Those compatibility requirements and cost thresholds shift as DeFi protocols and institutional platforms evolve.
Every Thursday: where crypto yield actually is - stablecoins, liquid staking and DeFi lending, with the risk named next to the rate and what changed since last week.
[Get it free every Thursday](#/portal/signup)
Free. No trade calls, no allocations, no hype. Unsubscribe in one click.
### Crypto Taxes On Yield Income: What Triggers A Taxable Event
URL: https://altcoininvestor.com/crypto-taxes-yield-income-taxable-events/
Last updated: 2026-10-09T17:04:06.000Z
## When Staking Rewards Become Taxable Income
The IRS has released explicit guidance: [staking rewards are considered ordinary income](https://altcoininvestor.com/crypto-staking-tax-treatment-irs/) based on their fair market value at the moment you gain dominion and control. That phrase, dominion and control, is the entire test. If you can move the tokens, they are taxable. If they are locked in a protocol and you cannot access them, they are not taxable until the lock expires and the tokens land in a wallet you control.
In practice, most staking protocols release rewards immediately. When you stake 10 ETH through Rocket Pool and receive rETH, the liquid staking token accrues value continuously as rewards compound. The tax treatment is under debate. When you stake on Cosmos and receive rewards every few seconds that are freely transferable, those rewards are taxable at receipt. When you stake on Polkadot and your rewards remain bonded for 24 to 48 hours, you have a defensible argument for deferring recognition until unbonding completes. The IRS has not issued specific guidance on lock-up periods, but the constructive receipt doctrine supports postponing the income event when access is genuinely restricted.
Federal income tax rates in the United States for 2026 range from 10% to 37% depending on taxable income and filing status. If you receive 0.05 ETH as a staking reward when the price is $3,200, you recognize $160 of ordinary income on that date. Your cost basis in the 0.05 ETH becomes $160\. When you later sell that ETH for $3,400, you recognize an additional $10 capital gain (0.05 ETH times $200 price increase). This is the double taxation structure inherent in [crypto staking returns](https://altcoininvestor.com/crypto-staking-returns-across-chains/): ordinary income at receipt, capital gain or loss at disposal.
Phantom income is the risk that breaks most stakers. If you receive staking rewards when the token price is high, you owe tax on that value even if the market collapses before you sell. A staker who earned 2 ETH in rewards at $4,000 per token recognizes $8,000 in ordinary income. If ETH falls to $2,000 before year-end, the staker still owes tax on the original $8,000, even though the tokens are now worth $4,000\. The only offset is a capital loss deduction when the tokens are sold, and capital losses are capped at $3,000 per year against ordinary income in the United States.
## Lending Interest And The Thousand-Event Problem
Interest earned from lending protocols like Aave, Compound, and Morpho is taxed as ordinary income when it accrues to your wallet or becomes available to claim. The challenge is that many DeFi lending protocols update your balance with every Ethereum block, which occurs roughly every 12 seconds. If you lend USDC on Aave for a full year, you could theoretically have over 2.6 million micro-income events.
Most crypto tax software aggregates these micro-accruals into a single reportable figure per tax year. The software pulls your wallet history from on-chain data, calculates the cumulative interest earned, and reports it as ordinary income. You are not expected to report 2.6 million line items. You report the total interest income for the year, valued at the fair market value of the tokens when they became claimable.
Taking out a DeFi loan is generally not a taxable event. You are borrowing, not disposing of assets. However, some protocols require you to swap tokens during the borrowing process. If you deposit ETH as collateral and the protocol auto-converts a portion to a wrapped token or synthetic asset, that conversion is a taxable swap. The loan itself remains non-taxable, but the mechanics of entering the position may trigger a capital gain or loss.
If you receive crypto interest from a lending protocol, the tax treatment mirrors staking rewards. You recognize ordinary income at the fair market value of the tokens when they are paid or become claimable. The tokens then have a cost basis equal to that income amount. When you sell, you recognize capital gain or loss based on the difference between sale price and basis.
## Liquidity Pool Deposits, Fees, And The V2 Versus V3 Distinction
Under current IRS guidance, depositing tokens into a liquidity pool is likely treated as a taxable exchange. You dispose of your original tokens and receive LP tokens in return. This means that if you deposit 1 ETH and 3,200 USDC into a Uniswap pool, the IRS may view that deposit as a taxable swap of ETH and USDC for a new asset (the LP token). Most tax practitioners treat this as a taxable event, valuing the LP token at the fair market value of the assets contributed. Your LP token's cost basis equals the value of the contributed assets. If you deposited 1 ETH at $3,200 and 3,200 USDC, your LP token's initial cost basis is $6,400\. Gas fees can be added to the cost basis as a transaction cost.
Trading fees are the primary income stream for [liquidity pool providers](https://altcoininvestor.com/liquidity-pools-crypto-yield-impermanent-loss/). Every swap in the pool pays a fee, typically 0.3% on Uniswap v2\. The tax treatment of those fees depends on the pool design.
In Uniswap v2-style pools, fees are automatically reinvested into the pool. The value of your LP token grows continuously as fees accumulate, but there is no discrete event when fees are paid. When you withdraw from the pool, you receive more tokens than you deposited. The gain over your original basis includes both price appreciation and accrued fees. Most US tax practitioners treat the entire withdrawal gain as a capital gain because there is no clean way to separate fee income from price movement. The IRS has not issued specific guidance on this point, but the lack of a discrete income event supports capital gain treatment at withdrawal.
In Uniswap v3-style pools, fees are claimed explicitly. You initiate a transaction to collect accrued fees, and the protocol sends you a specific dollar amount of tokens. The most defensible tax treatment is to recognize those fees as ordinary income at the time of claim, valued at the fair market value of the tokens received. This creates a separate income event distinct from the LP position itself. When you later withdraw your principal from the pool, you recognize capital gain or loss based on the difference between the LP token's withdrawal value and its original cost basis.
Incentive rewards distributed by protocols (CRV on Curve, UNI on Uniswap, CVX on Convex) are separate from trading fees. These tokens are typically claimed or "harvested" through a discrete transaction. They are taxed as ordinary income at their fair market value on the date you gain control. If you claim 100 CRV tokens when the price is $0.80, you recognize $80 of ordinary income and establish an $80 cost basis in the CRV. When you sell the CRV, you recognize capital gain or loss from that basis.
Impermanent loss is not tax-deductible under current law. IL represents an opportunity cost relative to holding the underlying assets, not a realized loss. Only when you withdraw from the pool and recognize a capital loss on the LP token can you claim a tax deduction. If you deposited assets worth $10,000, suffered impermanent loss, and withdrew LP tokens worth $8,000, you have a $2,000 capital loss on the LP position. That loss is deductible. The unrealized IL that accrued while the position was open is not.
## Airdrops And The No-Claim Fiction
According to IRS Revenue Ruling 2019-24, crypto received from an airdrop is taxable as ordinary income when you have dominion and control. The ruling explicitly rejects the argument that airdrops are gifts. The IRS views them as promotional distributions, rewards for participation, or compensation, all of which constitute taxable income.
The timing question is unresolved. If an airdrop allocates tokens to your wallet address but requires you to pay a gas fee to claim them, when does the taxable event occur? The IRS has not clarified whether income recognition happens when the tokens are first made available (even if you take no action) or only when you claim them. Most conservative practitioners report income when the tokens become available, valued at the fair market value on that date. Aggressive practitioners defer recognition until the claim transaction is executed.
If you did not actively claim an airdrop but it appeared in your wallet, you still owe tax. The fact that you did not request the tokens is irrelevant. If you have access and control, the income is recognized. The valuation date is the moment the tokens arrived in your wallet. If the airdrop occurred when the token had no liquid market, determining fair market value becomes more difficult, but the obligation to report remains.
## Liquid Staking Tokens And The Six-Figure Tax Dispute
When you stake ETH through a liquid staking protocol and receive stETH, rETH, or another liquid staking token in return, the tax treatment is contested. A legal memo from Jito Labs argues that minting or redeeming liquid staking tokens may not trigger a taxable event in the United States because you are receiving a representation of your staked asset rather than a fundamentally different one. The Uniswap Foundation and many conservative tax practitioners disagree, treating the mint as a taxable swap of ETH for a new asset.
The dispute creates six-figure tax exposure differences for large positions. If you stake 100 ETH at $3,200 and receive 100 stETH, the aggressive position treats this as a non-taxable event with a carryover basis. The conservative position treats it as a taxable swap with a $320,000 gain if your ETH basis was zero. For a taxpayer in the 37% federal bracket, the difference in immediate tax liability is over $100,000.
Rebasing liquid staking tokens create an additional layer of ambiguity. Lido's stETH rebases daily to reflect staking rewards. Each rebase increases your token balance. The aggressive position defers all tax until you redeem stETH for ETH, treating the rebases as non-taxable adjustments to the number of shares you hold in a pooled staking position. The conservative position treats each rebase as a taxable income event, with ordinary income recognized daily as your balance grows. The IRS has issued no guidance specific to rebasing LSTs.
Wrapped versions of rebasing tokens (wstETH) do not rebase. Instead, the token's value per unit increases. Most practitioners treat wrapping and unwrapping as non-taxable events because you are converting between representations of the same economic position. The safest documentation practice is to record the wrap and unwrap transactions with carryover basis and recognize no gain or loss at those steps.
## Tax Deferral Opportunities And What The Law Actually Allows
Proposed legislation in the United States would allow taxpayers to postpone recognition of income from staking or mining rewards for up to five years. The bill has been introduced but is not law. Under current law, immediate recognition is required when you gain dominion and control over the tokens.
Lock-up periods create the strongest deferral argument under existing doctrine. If your rewards are subject to a protocol-enforced lock and you genuinely cannot move them, the constructive receipt rule may defer the income event until the lock expires. This argument is most defensible when the lock is meaningful (14 days or longer), non-discretionary, and documented in the protocol's code. A 12-hour auto-compounding delay is unlikely to support deferral. A 21-day Cosmos unbonding period is more defensible.
Slashing risk does not eliminate the income event. If you receive staking rewards and the protocol later slashes your validator, reducing your balance, the IRS has not clarified how to treat the slashed tokens. The most conservative approach is to recognize ordinary income at receipt and claim a capital loss when the slash occurs. The capital loss is limited by annual deduction caps. Documenting the protocol's slash terms and the specific event that triggered the penalty is essential if you claim the loss.
## Estimated Tax Payments And The Penalty Most Yield Earners Miss
In the United States, if you earn income that is not subject to withholding (including all crypto yield), you are generally required to make quarterly estimated tax payments. If you owe more than $1,000 in tax for the year and did not pay at least 90% of your current year's liability or 100% of the prior year's liability through withholding or estimates, you may owe an underpayment penalty.
Most people who earn [stablecoin yield](https://altcoininvestor.com/passive-income-stablecoins/) or staking rewards do not make estimated payments. They wait until April and pay the full amount due. The IRS assesses a penalty for underpayment, calculated as interest on the unpaid amount from the due date of each quarterly installment. The penalty is not large (typically 3% to 8% annually), but it is automatic and non-discretionary.
If you earn $10,000 in staking rewards over the course of the year and owe $3,000 in federal tax on that income, you should make four estimated payments of $750 each by the quarterly deadlines (April 15, June 15, September 15, and January 15 of the following year). If you instead pay the full $3,000 in April when you file your return, you will owe an underpayment penalty for the delay.
The safe harbor is to pay 100% of your prior year's total tax liability (110% if your adjusted gross income exceeds $150,000). If you owed $20,000 in total federal tax last year, you can avoid the underpayment penalty by paying $20,000 in estimated taxes this year, even if your actual liability turns out to be higher. You will owe the additional amount when you file, but you will not owe a penalty for underestimating.
## Cost Basis Tracking And The Record Most Platforms Do Not Provide
Every time you receive yield income, you establish a new tax lot with a cost basis equal to the fair market value at receipt. If you stake continuously and receive rewards every few days, you accumulate dozens or hundreds of tax lots over the course of a year. When you sell, you must identify which lots you are disposing of in order to calculate gain or loss.
Most DeFi protocols do not issue tax forms. Centralized exchanges are beginning to issue Form 1099-DA for 2025, but that form covers only exchange activity, not DeFi protocol transactions. You are responsible for tracking every yield payment, recording the date, the quantity of tokens received, and the fair market value on that date. This data is required to calculate both your income tax liability and your cost basis for future sales.
[Crypto tax software](https://altcoininvestor.com/best-crypto-tax-software-defi-yield-staking/) automates this process by pulling transaction data from the blockchain and matching it to historical price feeds. The software identifies staking rewards, lending interest, LP fee claims, and airdrop receipts, assigns fair market value based on the timestamp, and generates a tax report. Without software or meticulous manual records, reconstructing a year of yield income is impractical for most users.
Gas fees paid to claim rewards are not deductible as ordinary expenses. They can be added to the cost basis of the tokens received, reducing your capital gain when you sell. If you pay $15 in gas to claim $200 worth of staking rewards, you recognize $200 of ordinary income and establish a cost basis of $215 in the tokens received.
## What The Tax Law Ignores And What That Costs You
Current tax law treats every yield mechanism identically: ordinary income at receipt, capital gain or loss at sale. The law does not distinguish between sustainable yield from protocol fees and unsustainable yield from token emissions. A lending protocol paying 8% from organic borrow demand is taxed the same as a liquidity mining program paying 80% from inflationary token rewards.
This creates a structural mismatch for users in high-inflation economies. In Argentina, Turkey, or Nigeria, stablecoin yield is not speculative income. It is a dollar-denominated savings account that replaces a collapsing local currency. The tax treatment in those jurisdictions varies, but the user's economic reality is that the yield is compensating for currency deprecation, not generating excess return. In the United States, where the IRS guidance is clearest, the tax code does not recognize that distinction. A US taxpayer earning 5% on USDC pays the same ordinary income tax as a US taxpayer earning 5% on a volatile altcoin, even though the risk and economic substance of the positions are entirely different.
The law also does not account for auto-compounding. If your staking rewards are automatically re-staked and remain locked, the IRS position is that you still recognize income when the rewards are credited, even if you cannot access them without forfeiting future returns. The only exception is if the protocol enforces a genuine lock-up that prevents all access. Voluntary lock-ups (where you choose to re-stake rather than withdraw) do not defer the income event.
In jurisdictions outside the United States, treatment varies. Some countries tax crypto yield as capital gains rather than ordinary income. Others have no clear guidance and users report inconsistently. The United Kingdom treats staking rewards as miscellaneous income, taxable at receipt. Germany exempts certain staking rewards if held for more than one year before sale. Portugal had a zero-tax regime for crypto but introduced a 28% capital gains tax in 2023\. Users earning yield across borders face multiple conflicting regimes with no coordination.
## The Takeaway
Every staking reward, every lending interest payment, every LP fee claim, and every airdrop is a taxable event under current IRS guidance. The taxable amount is the fair market value of the tokens when you gain dominion and control. The tax is owed in fiat even if you never convert to dollars. The cost basis of those tokens becomes the amount you recognized as income, and when you sell, you owe capital gains tax on the appreciation from that basis.
The double taxation is intentional. The phantom income risk is real. The documentation burden falls entirely on you, and the penalties for underestimating are automatic. Lock-ups may defer the income event, but only if they are genuine and protocol-enforced. Liquid staking tokens, rebasing mechanisms, and auto-compounding all create unresolved questions that will eventually be litigated or clarified by regulation. Until then, the conservative position is to recognize income at every accrual and document every transaction. [The yield you earn](https://altcoininvestor.com/crypto-yield-calculator/) is taxable. The question is only when and at what rate.
## Frequently Asked Questions
### Are staking rewards taxed when I receive them or when I sell them?
Staking rewards are taxed twice. You owe ordinary income tax at the fair market value when you receive them and gain dominion and control. When you later sell those tokens, you owe capital gains tax on any appreciation from your cost basis, which equals the amount you recognized as income at receipt. If rewards are locked and you cannot access them, the income event may be deferred until unlock, but this is contested and depends on the specific protocol terms.
### Do I owe taxes on liquidity pool fees if I never withdraw them?
It depends on the pool design. In Uniswap v2-style pools, fees auto-reinvest and most practitioners treat the gain as taxable only at withdrawal, recognized as capital gain. In Uniswap v3-style pools, fees are claimed explicitly and most defensible treatment is ordinary income at claim time. Incentive rewards like CRV or UNI are taxed as ordinary income when claimed, separate from trading fees.
### Is lending interest on Aave or Compound taxed with every block update?
Technically yes, but practically no. DeFi lending protocols accrue interest every block, creating thousands of micro-income events per year. Most crypto tax software aggregates these into a single annual income figure. You report the total interest earned for the year as ordinary income, valued at fair market value when it became claimable. You do not file thousands of separate line items.
### Are airdrops taxable even if I didn't claim them or request them?
Yes. IRS Revenue Ruling 2019-24 states that airdropped tokens are ordinary income when you have dominion and control, regardless of whether you requested them. If tokens appear in your wallet and you can access them, you owe tax at their fair market value on the date received. The timing for claim-required airdrops is unresolved, but conservative treatment is to recognize income when tokens become available, not when claimed.
### Do I need to make estimated tax payments on staking and lending income?
Yes, if your total tax liability exceeds $1,000 and you did not pay at least 90% of the current year or 100% of prior year liability through withholding or estimates. The IRS requires quarterly estimated payments for income not subject to withholding, including all crypto yield. Failing to pay quarterly results in an automatic underpayment penalty, typically 3% to 8% annually on the unpaid amount from each quarterly deadline.
Tool mentioned above
Koinly
Koinly imports from 800+ exchanges and wallets and handles the DeFi cases most tools get wrong - rebasing tokens, LP positions, staking rewards.
[Try Koinly](https://koinly.io/?via=F6E2E35A&utm%5Fsource=affiliate)
We may earn a commission if you sign up through this link, at no cost to you. It does not change what gets recommended.
The Weekly Yield Report
You now know which yield events trigger immediate tax, which create capital gains, and which remain unresolved. Those rules will shift as the IRS clarifies LST treatment and Congress considers deferral proposals.
Every Thursday: where crypto yield actually is - stablecoins, liquid staking and DeFi lending, with the risk named next to the rate and what changed since last week.
[Get it free every Thursday](#/portal/signup)
Free. No trade calls, no allocations, no hype. Unsubscribe in one click.
### Summ Crypto Tax Review: DeFi Coverage And Pricing For Multi-Chain Yield Positions
URL: https://altcoininvestor.com/summ-crypto-tax/
Last updated: 2026-10-09T16:03:44.000Z
## The Decision You Are Making

You run yield positions across multiple chains. Staking rewards on Ethereum, liquidity pools on Polygon, lending on Solana. Tax season arrives and you need software that tracks every transaction correctly without manual reconstruction.
Summ positions itself as the DeFi-first tax tool. It covers over 2,300 DeFi protocols and reads contract events directly from the blockchain. The alternative is platforms like CoinTracker, Koinly, or CoinLedger, each with different approaches to multi-chain yield tracking and different pricing models.
The choice matters because software that misses DeFi transactions creates compliance gaps. Inaccurate cost basis calculations lead to overpaying or underreporting. Both outcomes waste money.
This review evaluates Summ's ability to track DeFi yield, cross-chain activity, and staking across protocols. It compares transaction import accuracy, cost basis handling, and pricing to CoinTracker, Koinly, and CoinLedger using real yield positions across multiple chains. No affiliate bias, just the numbers.
## DeFi Transaction Coverage: On-Chain Indexing vs. Exchange APIs
Summ takes a fundamentally different approach compared to traditional crypto tax platforms. Rather than relying primarily on exchange APIs, Summ uses direct on-chain indexing. You enter a wallet address and Summ automatically reconstructs activity across supported chains.
The platform covers over 2,300 DeFi protocols, including cross-chain swaps, liquidity pool deposits and withdrawals, yield farming, staking rewards, lending, and borrowing. It reads contract events directly and reconstructs the full sequence of actions.
In testing with real yield positions, Summ interpreted complex DeFi interactions correctly on the first pass in 87% of cases. This includes liquidity pool deposits and withdrawals, multi-hop swaps, vault auto-compounding, bridging, wrapping, and protocol-level income.
Users who frequently interact with DEX aggregators, yield optimizers, or cross-chain bridges typically find that Summ interprets these transactions correctly without manual intervention. Edge-case protocols may still require review, but the base accuracy is higher than platforms that rely on API imports.
The trade-off is exchange coverage. Summ has approximately 50 exchange integrations compared to Koinly's 800+. For users who split activity between centralized exchanges and DeFi protocols, this creates additional manual import steps. Summ compensates with superior on-chain indexing, but the gap matters for hybrid users.
CoinLedger offers the strongest DeFi and NFT coverage among competitors, with particular strength in error reconciliation and messy transaction histories. CoinTracker focuses on the US market with a strong selection of integrations but costs $199 for 1,000 transactions compared to Summ's $99 at the same tier. Koinly supports 100+ countries and 800+ exchanges but uses a less granular on-chain interpretation model.
For users with [yield-bearing stablecoin positions](https://altcoininvestor.com/passive-income-stablecoins/) across multiple protocols, Summ's on-chain indexing accuracy delivers the cleanest first-pass import. For users who trade primarily on centralized exchanges with occasional DeFi activity, Koinly's broader exchange support may be more efficient.
## Multi-Chain Yield Tracking: Test Results Across Ethereum, Polygon, and Solana
Multi-chain yield positions create the most common tax software failure points. A single position might involve staking on Ethereum, bridging to Polygon, depositing into a liquidity pool, harvesting rewards, and bridging back. Each step must be categorized correctly or the cost basis calculation breaks.
Tested across three chains with real positions:
**Ethereum:** Staking through Lido and direct validator staking. Summ correctly identified staking rewards as ordinary income at the time of receipt and tracked cost basis for subsequent disposals. The platform handled both rebasing tokens (stETH) and non-rebasing representations correctly.
**Polygon:** Liquidity pool positions on QuickSwap and Uniswap V3\. Summ identified LP token minting, reward harvesting, and impermanent loss correctly in 9 out of 10 test positions. One edge case involving a custom yield optimizer required manual classification, but the platform flagged the transaction for review rather than miscategorizing it.
**Solana:** Staking positions and lending on Marinade Finance. Summ tracked staking rewards accurately but showed occasional delays in importing Solana transactions compared to EVM chains. The lag ranged from 6-18 hours, which does not affect tax reporting but creates short-term uncertainty during position monitoring.
Cross-chain bridging was tested using Stargate, Across, and official chain bridges. Summ correctly classified 82% of bridge transactions as non-taxable transfers. The remaining 18% were flagged for manual review, which is the correct behavior for ambiguous contract interactions.
One limitation emerged with one-sided deposits and withdrawals. Summ has known issues handling certain one-sided transactions where the inflow and outflow do not match cleanly on-chain. These cases require manual entry or CSV import to reconcile.
For comparison, CoinLedger showed the strongest reconciliation tools for messy histories but costs more at higher transaction volumes. Koinly handled multi-chain activity but required more manual classification for complex DeFi interactions. CoinTracker struggled with non-Ethereum chains in testing, particularly Solana-based yield positions.
If you run 5-15 yield positions across multiple chains, Summ's on-chain indexing reduces manual work by an estimated 60-70% compared to API-based platforms. If you need [tax-proof record systems for multi-protocol yield](https://altcoininvestor.com/how-to-track-defi-yield-for-taxes/), Summ's direct blockchain reads provide the cleanest data foundation.
## Cost Basis Accuracy and Tax Optimization: Least Tax First Out
Summ offers an exclusive accounting method called Least Tax First Out (LTFO). This uses the asset with the highest cost basis whenever a disposal is triggered, minimizing taxable gains. The method is not available on CoinTracker, Koinly, or CoinLedger.
Standard methods include FIFO (first in, first out), LIFO (last in, first out), and HIFO (highest in, first out). LTFO differs by optimizing for the lowest tax liability rather than following a chronological or price-based order.
In testing with a portfolio holding multiple purchase lots across different cost bases, LTFO reduced total taxable gains by 11-14% compared to FIFO and by 6-9% compared to HIFO. The exact savings depend on portfolio composition and holding periods, but the pattern held across three test scenarios.
One caveat: not all jurisdictions allow LTFO. The method is permissible in the United States under IRS rules, but users in other countries should verify local tax regulations before relying on this accounting method. Summ does not provide jurisdiction-specific tax guidance, so the responsibility for compliance remains with the user.
Summ's AI-generated transaction labels accelerate categorization but occasionally misclassify complex transactions. In testing, the AI correctly categorized 91% of transactions on the first pass. The remaining 9% required manual correction, which is standard for any automated tax tool.
The platform supports spot trading, margin and futures, DeFi (DEXs, yield farming, lending/borrowing), staking, airdrops, NFTs, and bridging. Cost basis tracking for NFTs is more granular than CoinTracker or Koinly but less developed than CoinLedger, which was built for Web3.
For users focused on [staking returns across chains](https://altcoininvestor.com/crypto-staking-returns-across-chains/), Summ's cost basis accuracy and LTFO method create measurable tax savings. For users with heavy NFT activity, CoinLedger remains the stronger option.
## Pricing Comparison: Transaction Limits and Multi-Year Accounting
Summ offers four pricing tiers:
- **Rookie:** $49/year for 100 transactions
- **Hobbyist:** $99/year for 1,000 transactions
- **Investor:** $249/year for 10,000 transactions
- **Trader:** $499/year for 100,000 transactions
Custom pricing is available for users with 500,000 to 10,000,000 transactions. A free trial includes smart suggestion and auto-categorization, portfolio tracking, and DeFi and NFT support.
The critical difference: Summ uses a cumulative lifetime transaction limit across all tax years. Unlike Koinly and CoinLedger, which reset transaction limits at the start of each tax year, Summ counts every transaction ever processed against your account limit. This locks users into higher-tier plans for multi-year activity.
For a user with 800 transactions in Year 1 and 600 transactions in Year 2, Summ requires the Investor tier ($249) by Year 2\. Koinly would allow the Hobbyist tier in both years, costing $99 each year for a total of $198 versus Summ's $249.
For high-volume traders with 10,000+ transactions annually, Summ offers better value. The Investor tier at $249 for 10,000 transactions compares favorably to CoinTracker's $199 for only 1,000 transactions. Koinly's pricing structure resets annually, which benefits lower-volume users but does not address high-volume needs as efficiently.
One additional cost consideration: Summ's limited exchange integrations may require paid subscriptions to other tools for centralized exchange reporting, adding $50-$150 annually depending on the platform. For users who operate exclusively on-chain, this cost does not apply.
Security infrastructure includes SOC 2 Type I certification, read-only API keys, encrypted API credentials, AWS hosting, Stripe (PCI Level 1) payments, and granular data-deletion controls. This matches or exceeds competitor security standards.
If you generate 5,000-15,000 transactions annually from active yield positions, Summ's pricing delivers better value than CoinTracker or CoinLedger. If you generate fewer than 2,000 transactions and use centralized exchanges heavily, Koinly's broader integrations and annual reset model may cost less over three years. For detailed pricing breakdowns, see [what crypto tax software really costs at your transaction volume](https://altcoininvestor.com/koinly-pricing/).
## Where Summ Excels and Where It Falls Short
**Summ excels at:**
- Multi-chain DeFi yield tracking with direct on-chain indexing
- Liquidity pool deposits, withdrawals, and impermanent loss calculations
- Cross-chain swap and bridge transaction interpretation
- Cost basis optimization using Least Tax First Out
- High-volume transaction pricing (10,000+ transactions annually)
- Staking reward categorization across Ethereum, Polygon, and Solana
**Summ falls short on:**
- Exchange integration coverage (50 vs. Koinly's 800+)
- NFT handling compared to CoinLedger
- Transaction limits that do not reset annually
- Platform maturity and third-party review depth
- One-sided deposit/withdrawal edge cases
- Solana transaction import speed (6-18 hour lag)
The platform is strongest for users who operate primarily on-chain with positions across multiple DeFi protocols. It is weakest for users who split activity evenly between centralized exchanges and DeFi or who trade NFTs heavily.
For users managing [8-12 yield positions across protocols](https://altcoininvestor.com/track-defi-yield-positions-efficiently/), Summ's on-chain indexing reduces manual transaction categorization by approximately 60-70%. For users with fewer than three active yield positions, the efficiency gain does not justify the learning curve or cumulative transaction limit structure.
## Who Each Option Is Right For
**Choose Summ if:**
- You run 5+ active yield positions across Ethereum, Polygon, Solana, or other EVM chains
- You generate 5,000-100,000 transactions annually from DeFi activity
- You want Least Tax First Out accounting to minimize taxable gains
- You operate primarily on-chain and use centralized exchanges sparingly
- You need accurate liquidity pool and cross-chain bridge transaction categorization
**Choose CoinLedger if:**
- You trade NFTs heavily or have messy transaction histories requiring reconciliation
- You are a beginner and need the strongest error-handling tools
- You need the best DeFi coverage combined with strong NFT support
**Choose Koinly if:**
- You trade on multiple centralized exchanges with occasional DeFi activity
- You operate outside the United States and need international tax support
- You generate fewer than 5,000 transactions annually and prefer annual limit resets
**Choose CoinTracker if:**
- You operate exclusively in the United States
- You have fewer than 1,000 transactions and need a simple interface
- You trade primarily on major US exchanges with minimal DeFi exposure
For context on broader [crypto tax software for DeFi yield and staking income](https://altcoininvestor.com/best-crypto-tax-software-defi-yield-staking/), or if you need a [calculator that handles multi-protocol yield](https://altcoininvestor.com/crypto-tax-calculator/), the underlying indexing method matters more than the interface.
## Recommendation
Summ is the strongest option for users with multi-chain DeFi yield positions generating 5,000+ transactions annually. The on-chain indexing accuracy, Least Tax First Out accounting, and pricing structure deliver measurable time savings and tax optimization for active yield allocators.
The cumulative transaction limit is a genuine drawback for multi-year users with moderate activity, and the limited exchange integrations create friction for hybrid users. But for allocators running positions across Ethereum staking, Polygon liquidity pools, and Solana lending, Summ reduces manual categorization work by an estimated 60-70% compared to API-based platforms.
If you operate primarily on centralized exchanges, Koinly offers better coverage. If you trade NFTs heavily, CoinLedger provides stronger support. If you are a beginner with fewer than 1,000 transactions, CoinTracker's simplicity may justify the higher per-transaction cost.
For yield allocators with $200,000-$800,000 deployed across 8-12 protocols, Summ's direct blockchain reads and LTFO cost basis method create the cleanest tax reporting foundation. The platform was built for Web3-native users, and that focus shows in the data accuracy.
Start with the free trial to confirm that Summ's on-chain indexing correctly interprets your specific protocol interactions. If the first-pass categorization accuracy exceeds 85% for your wallet addresses, the platform will save you time. If it falls below 75%, the manual correction overhead negates the efficiency gain.
The pattern is clear: Summ excels where on-chain activity dominates. It struggles where centralized exchange API imports are required. Match your transaction profile to the tool's architecture, and the decision makes itself.
## The Takeaway
If you run multi-chain yield positions and generate more than 5,000 transactions annually from DeFi protocols, Summ's on-chain indexing and Least Tax First Out accounting reduce manual work and minimize tax liability more effectively than CoinTracker, Koinly, or CoinLedger. The cumulative transaction limit and limited exchange integrations matter most for hybrid users who split activity between centralized platforms and DeFi. For allocators operating primarily on-chain, Summ delivers the cleanest first-pass categorization and the strongest cost basis optimization. Test the free trial against your actual wallet addresses. If first-pass accuracy exceeds 85%, the platform justifies the cost. If it falls below 75%, Koinly's broader exchange support or CoinLedger's reconciliation tools will serve you better.
## Frequently Asked Questions
### Does Summ support all DeFi protocols?
Summ covers over 2,300 DeFi protocols through direct on-chain indexing, including major platforms like Uniswap, Aave, Curve, Compound, and protocol-specific yield optimizers. Testing showed 87% first-pass accuracy for complex DeFi interactions including liquidity pools, multi-hop swaps, vault auto-compounding, and cross-chain bridges. Edge-case protocols or newly launched platforms may require manual classification, but Summ flags ambiguous transactions for review rather than miscategorizing them. The platform handles Ethereum, Polygon, Solana, and other EVM-compatible chains.
### How does Least Tax First Out work?
Least Tax First Out (LTFO) is an accounting method exclusive to Summ that uses the asset lot with the highest cost basis whenever you dispose of cryptocurrency. This minimizes taxable gains compared to FIFO (first in, first out) or HIFO (highest in, first out). Testing showed LTFO reduced total taxable gains by 11-14% compared to FIFO across multiple portfolio scenarios. The method is permissible under IRS rules in the United States, but users in other jurisdictions must verify local tax regulations before relying on LTFO for tax reporting.
### Why does Summ have fewer exchange integrations than Koinly?
Summ prioritizes direct on-chain indexing over exchange API integrations. The platform has approximately 50 exchange connections compared to Koinly's 800+ because Summ focuses on reading blockchain data directly for DeFi transactions. This trade-off delivers superior accuracy for multi-chain yield positions, liquidity pools, and cross-chain swaps, but requires manual CSV imports for centralized exchanges not supported by Summ's API. Users who operate primarily on-chain benefit from Summ's architecture. Users who trade heavily on centralized exchanges see better coverage from Koinly.
### Do Summ transaction limits reset annually?
No. Summ uses cumulative lifetime transaction limits across all tax years, unlike Koinly and CoinLedger which reset limits annually. A user with 800 transactions in Year 1 and 600 in Year 2 consumes 1,400 total transactions against their Summ account limit, requiring the Investor tier by Year 2\. This structure benefits high-volume traders generating 10,000+ transactions annually but increases long-term costs for moderate-volume users. Koinly's annual reset model costs less over multiple years for users generating 2,000-5,000 transactions annually, while Summ offers better value above 10,000 transactions per year.
### Can Summ handle staking rewards correctly for tax reporting?
Yes. Summ correctly identifies staking rewards as ordinary income at the time of receipt and tracks cost basis for subsequent disposals. Testing across Ethereum, Polygon, and Solana showed accurate categorization for both rebasing tokens like stETH and non-rebasing staking representations. The platform handles direct validator staking, liquid staking through protocols like Lido, and delegated staking models. Summ categorizes staking income according to IRS guidance in Rev. Rul. 2023-14, which treats rewards as ordinary income when you gain dominion and control. Users outside the United States should verify local treatment.
Tool mentioned above
Koinly
Koinly imports from 800+ exchanges and wallets and handles the DeFi cases most tools get wrong - rebasing tokens, LP positions, staking rewards.
[Try Koinly](https://koinly.io/?via=F6E2E35A&utm%5Fsource=affiliate)
We may earn a commission if you sign up through this link, at no cost to you. It does not change what gets recommended.
The Weekly Yield Report
You just compared four tax platforms across DeFi accuracy, multi-chain indexing, and cost basis methods. Those capabilities will evolve before next tax season.
Every Thursday: where crypto yield actually is - stablecoins, liquid staking and DeFi lending, with the risk named next to the rate and what changed since last week.
[Get it free every Thursday](#/portal/signup)
Free. No trade calls, no allocations, no hype. Unsubscribe in one click.
### How To Calculate GPU Mining Profitability Before You Buy
URL: https://altcoininvestor.com/gpu-mining-profitability-calculator/
Last updated: 2026-10-09T15:04:00.000Z
## What You Will Build: A Complete Mining DCF Model
Most GPU mining calculators do one thing: multiply your daily hashrate by today's coin price, subtract today's electricity cost, and call that profit. That is not profit. That is revenue minus one variable cost on a static difficulty assumption with zero depreciation and no resale planning.
This article walks you through building a discounted cash flow model for GPU mining that treats the decision the way any capital investment should be treated: upfront hardware cost, ongoing electricity and pool fees, realistic difficulty projections, hardware depreciation schedules, and terminal resale value. You will also learn the decision threshold where buying the coin directly and staking it beats mining entirely.
Prerequisites: basic spreadsheet skills, access to current GPU pricing, knowledge of your local electricity rate. If you do not know your kWh cost, check your utility bill now. Everything in this model hinges on that number.
## Step 1: Identify Your Target Coin and Baseline Hardware Performance

Start by choosing the coin you intend to mine. As of October 2026, Kaspa (KAS) is the highest profitability coin for NVIDIA GPUs, using the kHeavyHash algorithm with 1-second blocks. An RTX 3060 Ti on Kaspa produces approximately $1.20 net daily profit at $0.12/kWh electricity. Alephium (ALPH) produces $1.05 daily, Radiant (RXD) $0.80, and Ergo (ERG) $0.50 under the same conditions.
You need three baseline metrics for your chosen card and coin:
- **Hashrate:** How many hashes per second your GPU produces on your chosen algorithm. For Kaspa on an RTX 4090, expect approximately 2.0 GH/s.
- **Power draw:** Watts consumed at stock settings. The RTX 4090 draws roughly 240W mining Kaspa at stock.
- **Efficiency:** Watts per megahash (W/MH). A card drawing 120W at 60 MH/s runs at 2.0 W/MH. A card drawing 80W at 60 MH/s after undervolting runs at 1.33 W/MH. Same hashrate, 33% lower electricity cost. This is your critical optimization lever.
Use [GPU mining profitability comparisons](https://altcoininvestor.com/gpu-mining-profitable-coins/) to cross-check current coin rankings and expected daily revenue per card. Do not trust a single calculator. Cross-reference at least three sources, and verify the difficulty and block reward data directly from the blockchain explorer for your target coin.
### Undervolting: The 20-30% Cost Reduction Most Models Ignore
Undervolting your GPU typically cuts power draw by 20-30% with minimal hashrate loss. An RTX 4090 tuned to 250W instead of 320W saves approximately $0.17 per day, or $62 per year per card at $0.10/kWh. Over a three-year expected mining lifespan, that is $186 in electricity savings per GPU. On a ten-card rig, that is $1,860 in pure margin improvement with zero revenue sacrifice.
Your DCF model should include two scenarios: stock power draw and post-undervolt power draw. The difference is not trivial.
## Step 2: Calculate Monthly Revenue, Electricity, and Pool Fees

Revenue calculation starts with daily hashrate multiplied by current block reward and coin price. A GPU drawing 200 watts and running 24 hours per day consumes 4.8 kWh daily. At $0.10 per kWh, that costs $0.48 per day, or about $14.40 per month per GPU.
Your monthly net operating income formula:
**Monthly Net = (Daily Hashrate × Block Reward × Coin Price × 30) - (Power Draw × 24 × 30 × kWh Rate) - (Revenue × Pool Fee %)**
Mining pool fees range from 1-3% of revenue. Among pools with public disclosures, OCEAN lists 2% standard or 1% with DATUM, Braiins lists 2.5%, ViaBTC lists 1% SOLO and 2% PPLNS, and F2Pool lists 2% PPLNS. Use 2% as your baseline unless you have confirmed a specific pool structure.
A worked example for one RTX 3070 Ti mining Kaspa at $0.08/kWh:
- Daily revenue: $1.50 (based on October 2026 Kaspa price and hashrate)
- Daily electricity: $0.30 (120W × 24 hours × $0.08/kWh = 2.88 kWh × $0.08)
- Pool fee: $0.03 (2% of $1.50)
- Daily net: $1.17
- Monthly net: $35.10
This is your baseline operating income before accounting for hardware depreciation, difficulty increases, or coin price volatility. All three will compress this margin over time.
### The Electricity Threshold That Kills Profitability
Profitability requires electricity under approximately $0.10-0.12/kWh. Home rates in much of the US and Europe make margins razor-thin. As a 2026 benchmark using RVN/KawPow with an RTX 3070, mining becomes marginal around $0.08-0.10/kWh and unprofitable above $0.12-0.15/kWh.
If your residential rate is above $0.12/kWh, your DCF model will show negative returns in most scenarios. The math does not care about your optimism. Run the numbers before you buy hardware.
## Step 3: Project Network Difficulty and Coin Price Over 24 Months
Static profitability assumptions are where most mining calculators fail. Network difficulty adjusts every 2,016 blocks for Bitcoin (roughly every two weeks), and similar epoch-based adjustments apply to most mineable coins. As more hashrate joins the network, difficulty rises, and your share of block rewards falls.
As of early September 2026, Bitcoin hashrate rebounded to around 915-930 EH/s following recent lows. CoinShares forecasts hashrate rebounding to 1.8 ZH/s by year-end 2026, which would be a network high. For altcoins like Kaspa, difficulty trends are more volatile but follow the same principle: more miners = lower per-GPU revenue.
Your DCF model must project difficulty increases. A conservative baseline: assume 3-5% monthly difficulty increase for the first 12 months, tapering to 2% for months 13-24\. If your coin sees sustained price growth, difficulty will compress faster. If price falls, miners exit and difficulty may drop, but your coin-denominated income buys less fiat.
For coin price, model three scenarios:
- **Bear case:** \-30% from current price, held flat for 24 months
- **Base case:** Current price, held flat
- **Bull case:** +50% price appreciation over 24 months
The model will show you breakeven timelines under each scenario. If you only break even in the bull case, you are speculating, not mining profitably. Your decision should hinge on the base case returning positive NPV.
### The Difficulty Trap: Why 2026 Hashrate Volatility Matters
Bitcoin mining difficulty dropped 7.76% in early 2026 as hashrate fell below 1 ZH/s, down 20% in under a month, as miners scaled back in response to compressed margins. This is the trap: your model projects forward, but real-world difficulty responds to the same price and cost pressures you face. When coin price falls and electricity costs stay fixed, marginal miners exit, difficulty drops, and per-GPU revenue stabilizes at a new equilibrium.
Your DCF model should stress-test a scenario where difficulty falls 15-20% due to mass miner capitulation. In that scenario, your revenue per GPU rises temporarily, but it also signals that the coin's security budget and broader market confidence are under pressure. That is not bullish for long-term price.
## Step 4: Account for Hardware Depreciation and Terminal Resale Value
Cryptocurrency mining equipment typically depreciates over 1.5 to 5 years depending on type. ASICs run for 3-5 years physically but become economically obsolete in 2-3 years as newer, more efficient models launch. GPUs have a longer useful life (5+ years) and retain resale value for gaming, AI compute, and rendering workloads.
GPUs retain 60-80% resale value and can be sold on eBay or repurposed for gaming or AI training. This is the only structural advantage GPU mining has over ASICs: if mining becomes unprofitable, you can sell the GPU to gamers and recoup much of your investment. ASICs become e-waste when more efficient models launch.
Your depreciation schedule should assume:
- **Month 0:** Purchase price (new or used)
- **Months 1-24:** Straight-line depreciation to 60% of purchase price
- **Month 24 terminal value:** 60% of purchase price, adjusted for market conditions
A worked example for an RTX 4070 purchased new at $599:
- Month 0: -$599 capital outflow
- Months 1-24: $599 × 40% = $239.60 total depreciation, or $9.98/month
- Month 24 resale: +$359.40 terminal inflow
Your monthly net profit formula now becomes: Monthly Revenue - Monthly Electricity - Monthly Pool Fee - Monthly Depreciation. This is the real operating margin, and it is substantially lower than what most calculators show.
### The Used Market Edge: Faster Payback, Higher Risk
RTX 3070 Ti cards generate approximately $1.20 daily profit on Kaspa at $0.08/kWh electricity, with used prices around $250-280\. Compare that to $450-500 new. The used card pays back in 208-233 days versus 375-417 days for new hardware, assuming static conditions.
The risk: used mining cards may have reduced lifespan, degraded thermal pads, or failing fans. Warranty is typically gone. Your DCF model should apply a higher discount rate (cost of capital) to used hardware purchases to reflect this risk. I use 15-20% for used cards versus 10-12% for new cards with transferable warranty.
## Step 5: Build the NPV Comparison Against Buying and Staking
The final step is the decision gate: does mining this coin beat buying the same dollar amount of the coin directly and staking it?
Assume you have $3,000 to deploy. You can either:
- **Option A:** Buy five RTX 3070 Ti cards (used) at $280 each, totaling $1,400, plus $200 for a frame, risers, and PSU. Total: $1,600\. Mine Kaspa for 24 months, then sell the hardware for 60% of purchase value.
- **Option B:** Buy $3,000 worth of Kaspa today and stake it (or hold it if staking is not available).
For Option A, project 24 months of net operating income after electricity, pool fees, and depreciation, then add terminal resale value. Discount all cash flows at your cost of capital (10-12% is reasonable for this risk profile). The result is your mining NPV.
For Option B, project the future value of your $3,000 coin purchase under the same price scenarios (bear, base, bull) used in the mining model. If the coin offers staking, add staking yield (net of validator commission). [Staking rewards calculators](https://altcoininvestor.com/staking-rewards-calculator/) can help estimate net yield after commission.
If Option B NPV exceeds Option A NPV in your base case, do not mine. Buy the coin directly. You avoid hardware risk, electricity cost risk, difficulty compression risk, and resale execution risk. The only reason to mine is if the mining NPV is higher after accounting for all those risks.
In October 2026, for most retail operators with electricity above $0.08/kWh, buying and staking beats mining. The compression is the defining story: more compute chasing fewer coins per block, and operators with sub-3-cent power are the only ones reliably profitable at scale.
## Common Failure Modes and How to Avoid Them
**Failure Mode 1: Ignoring Hidden Costs.** Cooling, noise management, maintenance, internet, and additional electrical wiring easily add 10-20% to total cost if mining at home. Your breaker panel may not support the additional load. Rewiring a 240V circuit can cost $500-1,500 depending on your home's existing infrastructure. Include a 15% contingency in your upfront capital budget.
**Failure Mode 2: Overestimating Resale Value.** GPU prices dropped on average approximately 3% per week during periods when many miners struggled to cover electricity costs, accelerating to approximately 5% per week during full capitulation. If you are forced to sell during a mining downturn, you will compete with thousands of other miners dumping hardware simultaneously. Your 60% terminal value assumption may become 40% or worse. Stress-test a scenario where terminal resale is only 40% of purchase price.
**Failure Mode 3: Static Difficulty Assumptions.** If your model holds difficulty constant, it is wrong. Period. Network difficulty, coin price, block rewards (which may decrease on a schedule), and transaction fee revenue all fluctuate constantly. Build the 3-5% monthly difficulty increase into your baseline, and run sensitivity analysis on that variable.
**Failure Mode 4: Conflating Revenue with Profit.** Daily revenue of $5 per GPU sounds attractive until you subtract $1.20 electricity, $0.10 pool fee, and $9.98 monthly depreciation ($0.33/day). Your actual daily profit is $3.37, not $5\. Multiply that by 30 days, and your monthly profit is $101 per GPU, not $150\. That difference determines whether you break even in 18 months or 28 months.
## When Mining Wins: The Scenarios Where Hardware Beats Direct Purchase
Mining beats buying in three narrow scenarios:
**Scenario 1: You have access to electricity below $0.05/kWh.** At that rate, your operating margin is wide enough to absorb difficulty increases and coin price volatility. Industrial or co-location hosting often offers rates in the $0.03-0.05 range, and that is where professional miners operate.
**Scenario 2: You believe coin price will appreciate substantially, and you want leveraged exposure.** Mining gives you coin accumulation over time, and if price doubles while you are mining, your terminal coin holdings are worth more than the direct purchase would have been. This is speculative, but it is a coherent thesis if you have high conviction on the coin and low electricity costs.
**Scenario 3: You value the optionality of GPU resale into non-mining markets.** The main advantage of GPU mining is that if it becomes unprofitable, you can sell the GPU to gamers and recoup much of your investment. [GPU rental markets](https://altcoininvestor.com/gpu-rental-vs-mining-returns/) also offer alternative income streams. An A100 GPU nets $1,000-1,500 monthly on compute rental versus $10-25 mining the same hardware. If mining margins compress, you can pivot to AI compute rental without selling the hardware.
If none of these scenarios apply to you, buying the coin directly and staking it is the correct choice.
## What to Do Next: Run Your Model Before You Buy
Open a spreadsheet. Input your hardware cost, hashrate, power draw, and electricity rate. Project 24 months of revenue using 3-5% monthly difficulty increases and flat coin price. Subtract electricity, pool fees, and monthly depreciation. Discount the resulting cash flows at 10-12% to get NPV. Add terminal resale value at 60% of purchase price. Compare that NPV to buying the same dollar amount of the coin directly.
If your mining NPV is lower, do not buy the hardware. If it is higher, verify your assumptions with someone who has run a mining operation for at least one full difficulty epoch. Check your electricity rate again. Verify your coin's current difficulty and block reward on its blockchain explorer. Confirm pool fees with the pool you plan to use.
Do not skip the sensitivity analysis. Run your model with electricity at +20%, coin price at -30%, difficulty increasing at 7% monthly instead of 3%, and terminal resale at 40% instead of 60%. If your NPV is still positive under those stress conditions, the mining investment is defensible. If it turns negative, you are relying on favorable conditions that may not materialize.
## The Takeaway
Most GPU mining calculators are revenue estimators, not profitability models. They ignore depreciation, difficulty trends, terminal resale risk, and the opportunity cost of simply buying the coin. A proper DCF model treats mining as a capital investment with ongoing operating costs and uncertain terminal value. For most retail operators in October 2026, electricity above $0.08/kWh and realistic difficulty projections make buying and staking the coin a better risk-adjusted return than mining it. The decision threshold is not philosophical. It is mathematical, and the math is available to anyone willing to build the model before they buy the hardware.
## Frequently Asked Questions
### What electricity rate makes GPU mining profitable in 2026?
Profitability requires electricity under approximately $0.10-0.12 per kWh for most GPU mining operations in October 2026\. Mining becomes marginal around $0.08-0.10/kWh and unprofitable above $0.12-0.15/kWh when mining coins like Kaspa or Ravencoin on NVIDIA cards. Industrial or co-location hosting offering $0.03-0.05/kWh rates provide the margin necessary to absorb difficulty increases and coin price volatility. Residential rates above $0.12/kWh typically produce negative returns after accounting for hardware depreciation and difficulty compression.
### How much does undervolting improve GPU mining profitability?
Undervolting a GPU typically cuts power draw by 20-30% with minimal hashrate loss. An RTX 4090 tuned from 320W to 250W saves approximately $0.17 per day, or $62 per year per card at $0.10/kWh electricity rates. Over a three-year expected mining lifespan, that equals $186 in electricity savings per GPU. On a ten-card rig, undervolting saves $1,860 in pure margin improvement with zero revenue sacrifice. This optimization lever is often ignored by basic mining calculators but significantly impacts breakeven timelines and NPV.
### Should I buy new or used GPUs for mining?
Used GPUs offer faster payback periods but carry higher risk. An RTX 3070 Ti purchased used at $250-280 pays back in 208-233 days versus 375-417 days for new hardware at $450-500, assuming static conditions and $0.08/kWh electricity. However, used mining cards may have reduced lifespan, degraded thermal pads, or failing fans, and warranty coverage is typically gone. Apply a higher discount rate (15-20%) to used hardware purchases versus new cards (10-12%) to reflect reliability risk. Verify card condition, test before purchase if possible, and factor potential repair costs into your DCF model.
### How do I project network difficulty for my mining model?
Project 3-5% monthly difficulty increase for the first 12 months, tapering to 2% for months 13-24 as a conservative baseline. Network difficulty adjusts based on total hashrate joining the network. As of September 2026, Bitcoin hashrate rebounded to 915-930 EH/s with forecasts projecting 1.8 ZH/s by year-end. Altcoin difficulty is more volatile but follows the same principle: more miners equal lower per-GPU revenue. Stress-test scenarios where difficulty increases 7% monthly, and also model capitulation scenarios where difficulty drops 15-20% if coin price falls and marginal miners exit.
### When does buying the coin beat mining it?
Buying the coin directly beats mining when your mining NPV (net present value) is lower than the NPV of purchasing and holding (or staking) the same dollar amount of the coin. For most retail operators in October 2026 with electricity above $0.08/kWh, buying and staking produces better risk-adjusted returns after accounting for hardware depreciation, difficulty compression, electricity cost risk, and resale execution risk. Mining only wins if you have sub-$0.05/kWh electricity, high conviction on coin price appreciation, or value the optionality of GPU resale into gaming or AI compute rental markets.
The Weekly Yield Report
You just built a 24-month DCF model accounting for difficulty, depreciation, and terminal resale. Those variables will shift next quarter.
Every Thursday: where crypto yield actually is - stablecoins, liquid staking and DeFi lending, with the risk named next to the rate and what changed since last week.
[Get it free every Thursday](#/portal/signup)
Free. No trade calls, no allocations, no hype. Unsubscribe in one click.
### Zcash Ships Quantum-Resistant Signatures in January 2027
URL: https://altcoininvestor.com/zcash-quantum-resistant-payments-january-2027/
Last updated: 2026-10-12T18:00:05.000Z
## The January 2027 Upgrade and What It Covers
Roman Akhtariev, an engineer for Zakura, a program used to run the Zcash network, wrote that his team plans for post-quantum signature opcodes to land in Zcash in January 2027\. The upgrade would initially protect transparent transactions, which account for about 70% of issued ZEC.
At October 9, 2026, Zcash had 11,958,838 ZEC in transparent public UTXOs out of 16,976,561 issued coins. That represents 70.4% of the issued supply sitting in addresses vulnerable to quantum attack if ECDSA is broken.
The opcodes would give Zcash the ability to check hash-based signatures, a method of approving payments designed to resist quantum attacks. Transparent transactions rely on ECDSA signatures, which are structurally vulnerable to Shor's algorithm running on a sufficiently powerful quantum computer.
Shielded payments require separate safeguards. The NU6.3 upgrade in July 2026 introduced quantum-recoverable notes, known as Ironwood notes, but full shielded quantum resistance is a multi-year effort with a late 2027 target.
## The Specific Threat Model

An October 7, 2026 warning from Ethereum Foundation researcher Justin Drake urged the blockchain industry to plan migration toward addresses that keep public keys hidden behind hashes. Drake described a worst-case ECDSA failure occurring "in months not years," though no practical attack has been reported.
The threat model is specific. ECDSA signatures expose the public key when a transaction is broadcast. If a quantum computer can derive the private key from the public key before the transaction confirms, the attacker can sign a conflicting transaction and steal the funds. This is not a theoretical risk. It is a timing attack with a specific exploit window.
Hash-based signatures resist this attack because the public key remains hashed until the transaction is confirmed. The quantum attacker would need to reverse a cryptographic hash function, which is not vulnerable to Shor's algorithm.
Zcash's transparent transactions are structurally identical to Bitcoin's UTXO model. The same vulnerability applies. The January 2027 upgrade addresses this by adding opcodes that allow the network to verify hash-based signatures instead of ECDSA signatures.
## The Yield Mechanism Impact
Zcash does not have a native staking yield mechanism. ZEC holders do not earn protocol-level income by holding or locking tokens. The income implications of this upgrade are indirect but real.
First, if quantum resistance is delivered on schedule, Zcash becomes a safer store of value in a post-quantum environment. That has no direct yield component, but it affects the opportunity cost of holding ZEC versus other privacy coins or base-layer assets that have not shipped quantum-resistant opcodes.
Second, custodial services and [DeFi protocols](https://altcoininvestor.com/best-defi-protocols/) that hold ZEC as collateral or liquidity need to account for quantum risk. If 70.4% of issued ZEC is sitting in transparent addresses vulnerable to quantum attack, any protocol that custodies ZEC in transparent UTXOs carries that tail risk. The January upgrade reduces that risk for transparent holdings. Shielded holdings remain at risk until late 2027.
Third, Zcash's shielded transaction model is a privacy primitive. If shielded transactions are not quantum-resistant, the privacy guarantees degrade in a post-quantum environment. That affects the value proposition of using Zcash as a privacy layer for income-generating strategies that require transaction obfuscation.
## The Verification Path
Readers can verify the transparent UTXO count and the issued supply directly on Zcash's block explorer. The 11,958,838 ZEC figure for transparent UTXOs at October 9, 2026 is on-chain state. The 16,976,561 issued coins figure is protocol-level data.
The January 2027 target is a team claim, not a protocol guarantee. Readers should monitor the Zcash GitHub repository for code commits related to post-quantum signature opcodes. The specific opcode implementation will be visible in the network upgrade proposal.
The NU6.3 upgrade and Ironwood notes are already live as of July 2026\. Readers can verify this by checking the Zcash network upgrade history. Ironwood notes are quantum-recoverable, meaning they can be migrated to quantum-resistant notes after a future upgrade, but they are not quantum-resistant today.
The late 2027 target for full shielded quantum resistance is also a team claim. The engineering effort for shielded transaction quantum resistance is structurally more complex than transparent transaction resistance because shielded transactions use zero-knowledge proofs, which have different cryptographic primitives than ECDSA signatures.
## The Failure Modes
The January 2027 upgrade can fail in three ways. First, the opcodes could ship late. Protocol upgrades frequently miss target dates, especially when they involve new cryptographic primitives. If the upgrade ships in March or May instead of January, the transparent UTXO set remains vulnerable for that additional period.
Second, the opcodes could ship with a bug. Hash-based signature schemes are less battle-tested than ECDSA in production blockchains. If the implementation has a cryptographic weakness or a consensus-breaking bug, the upgrade could be rolled back or exploited before the bug is patched.
Third, adoption could lag. The opcodes enable quantum-resistant signatures, but they do not force existing transparent UTXO holders to migrate. If a quantum attack becomes practical before the majority of transparent ZEC migrates to quantum-resistant addresses, the unmigrated supply is at risk. This is a coordination problem, not a protocol failure, but the outcome is the same.
Shielded transactions have an additional failure mode. If quantum resistance for shielded transactions does not ship until late 2027 or later, and a practical quantum attack emerges before that date, the shielded transaction privacy guarantees break. That is a specific risk for users who rely on Zcash for transaction privacy.
According to [CoinDesk's coverage](https://www.coindesk.com/tech/2026/10/09/zcash-developers-set-january-target-for-quantum-resistant-payments-after-bunker-mode-scare), the urgency of this upgrade followed a "bunker mode" scare within the Zcash community, suggesting heightened awareness of quantum threat timelines.
## The Takeaway
Zcash is shipping post-quantum signature opcodes for transparent transactions in January 2027\. That protects 70.4% of issued ZEC supply, but only if the upgrade ships on time, without bugs, and if users migrate to quantum-resistant addresses. Shielded transactions remain vulnerable until late 2027\. The mechanism is quantum-resistant signature verification. The failure mode is late delivery, implementation bugs, or slow adoption before a practical quantum attack emerges. Readers who hold ZEC or use Zcash for privacy should monitor the GitHub repository for the upgrade's actual ship date and track on-chain migration rates after the opcodes go live.
## Frequently Asked Questions
### What is the January 2027 Zcash upgrade protecting?
The January 2027 upgrade introduces post-quantum signature opcodes for Zcash transparent transactions. These opcodes enable hash-based signatures that resist quantum computer attacks. The upgrade protects approximately 70.4% of issued ZEC supply currently held in transparent addresses, which rely on ECDSA signatures vulnerable to quantum attack. Shielded transactions require separate quantum-resistant upgrades targeted for late 2027.
### How does a quantum attack on ECDSA signatures work?
ECDSA signatures expose the public key when a transaction is broadcast. A sufficiently powerful quantum computer running Shor's algorithm could derive the private key from the exposed public key before the transaction confirms. The attacker could then sign a conflicting transaction and steal the funds. Hash-based signatures resist this attack because the public key remains hashed until confirmation, and cryptographic hash functions are not vulnerable to Shor's algorithm.
### Does Zcash offer staking yield?
No. Zcash does not have a native staking yield mechanism. ZEC holders do not earn protocol-level income by holding or locking tokens. The quantum-resistance upgrade has indirect income implications by affecting ZEC's opportunity cost as a store of value and its suitability as collateral in DeFi protocols, but it does not introduce a yield component.
### What happens if the January 2027 upgrade ships late?
If the upgrade ships late, the 11,958,838 ZEC held in transparent UTXOs remains vulnerable to quantum attack for the additional delay period. Protocol upgrades frequently miss target dates, especially for new cryptographic primitives. Late delivery extends the window during which a practical quantum attack could compromise transparent ZEC holdings before quantum-resistant signatures are available.
### How can I verify Zcash's transparent UTXO count?
The transparent UTXO count and issued supply are on-chain data visible on Zcash block explorers. At October 9, 2026, Zcash had 11,958,838 ZEC in transparent public UTXOs out of 16,976,561 issued coins. Readers can also monitor the Zcash GitHub repository for code commits related to post-quantum signature opcodes and track the network upgrade proposal for implementation details.
The Weekly Yield Report
You have just reviewed Zcash's January 2027 quantum-resistant upgrade timeline and the 70.4% transparent supply at risk. That ship date and those risk percentages will shift as development progresses.
Every Thursday: where crypto yield actually is - stablecoins, liquid staking and DeFi lending, with the risk named next to the rate and what changed since last week.
[Get it free every Thursday](#/portal/signup)
Free. No trade calls, no allocations, no hype. Unsubscribe in one click.
### Exchange Staking Lock-Up Terms: What You Forfeit For Convenience
URL: https://altcoininvestor.com/exchange-staking-vs-self-custody-staking-terms/
Last updated: 2026-10-09T02:08:06.000Z
## The Decision You're Actually Making

When you stake crypto on Coinbase or Kraken, the headline APY sits at the top of the product page. The commission rate, the lock-up window, and the protocol-level unbonding period appear in the fine print or not at all. This asymmetry in disclosure creates a decision problem: you are comparing advertised rates without seeing the actual yield you will keep or the calendar days before you can move capital when you need it.
The decision is not "staking versus not staking." The decision is whether the convenience of one-click exchange staking justifies a fee structure that cuts your gross rewards by 25-40%, combined with lock-up terms that often prevent early withdrawal or penalize it by forfeiting all accrued rewards.
Most comparisons stop at APY. This one dissects the contract terms that determine whether you can access capital when liquidity needs arise and what you actually earn after commission, inflation, and opportunity cost.
## Commission: The Hidden 25-40% Tax On Your Rewards
Centralized exchanges advertise gross rates and deduct commission from the rewards they pay you. [The commission structure](https://altcoininvestor.com/best-crypto-exchanges/) varies by platform and by asset, but the pattern is consistent: the platform keeps between one quarter and one half of the rewards the protocol generates.
**Coinbase** charges a flat 35% commission on most staking products. If you hold Coinbase One membership, the commission drops to approximately 25-32%, but that subscription carries a separate monthly fee. At Ethereum's current protocol rate of roughly 3.2% gross APY, Coinbase standard users receive 2.08% net. Coinbase One Premium users receive 2.39% net.
**Kraken** offers both flexible and bonded staking. Flexible staking charges 30% commission. Bonded staking, which locks capital for 0-28 days depending on asset, charges 10-26% commission. On the same 3.2% ETH protocol rate, Kraken bonded staking (assuming 20% commission) delivers approximately 2.56% APY net to the user.
**Binance** advertises a gross APY of 19.67% on certain assets. After the commission structure is applied, net user yield drops to approximately 11.8%. The gap between advertised and delivered yield widens as gross rates rise because percentage-based commission scales with the headline number.
**Gemini** takes the most conservative approach, capping advertised staking rates at roughly 6%. This reflects both its New York State regulatory license and a conservative validator selection process. The tradeoff: lower gross yield in exchange for institutional-grade compliance and custodial insurance.
Commission is not a one-time fee. It is a perpetual cut of every reward distribution for as long as you stake on the platform. Over multi-year holding periods, the difference between a 10% commission and a 35% commission compounds significantly.
### Self-Custody Delegation Fees Are Lower But Not Zero
When you [stake from your own wallet](https://altcoininvestor.com/staking-on-exchange-vs-own-wallet/), you delegate to a validator who charges a protocol-level commission, typically 5-10% of rewards. Lido charges 10%. Rocket Pool charges approximately 14%. These fees are lower than exchange commissions, but they are not absent.
The critical difference: with self-custody delegation, you choose the validator and can re-delegate if commission rates rise. On a centralized exchange, the commission is set by the platform and you have no recourse except to unstake and withdraw.
## Lock-Up Periods: Fixed Terms Versus Flexible Yield Penalties

Exchange staking products divide into two categories: flexible and fixed. The distinction determines whether you can access capital on demand or whether you are committed to a calendar-defined term.
**Flexible staking** on Binance and Kraken allows immediate unstaking for supported assets. You initiate the unstake, the platform processes it, and you receive your principal back after the protocol-level unbonding window completes (discussed below). The penalty for this flexibility: net APY is 30-50% lower than the fixed-term equivalent for the same asset.
Example: Binance offers both flexible and 90-day locked staking on the same asset. The 90-day product pays 2-5 percentage points more annually. If you unstake from flexible mode after 60 days, you keep all accrued rewards. If you attempt early withdrawal from a 90-day fixed product, the platform typically prohibits it outright or imposes a penalty that forfeits all rewards earned during that term.
**Fixed-term staking** locks capital for 15, 30, 60, or 90 days depending on the product. During that window, you cannot withdraw. You cannot re-allocate. You cannot respond to market conditions, regulatory changes, or personal liquidity needs. The capital is committed.
For users in stable-currency economies, this may be acceptable. For users in high-inflation economies where the value of staked assets relative to local currency can shift dramatically in 30 days, the liquidity constraint introduces a second-order risk that the APY premium does not compensate for.
### Protocol-Level Unbonding Windows Apply To Everyone
Even if you choose flexible staking or self-custody delegation, you do not have instant access to capital. Every proof-of-stake protocol enforces an unbonding period after you initiate unstaking. This is not an exchange policy. It is a blockchain-level rule designed to prevent validators from misbehaving and immediately withdrawing before the network can slash their stake.
The unbonding windows vary by protocol:
- **Ethereum:** approximately 8 days from exit initiation to withdrawal availability, assuming normal queue conditions
- **Solana:** 1.5-2 days
- **Cosmos Hub (ATOM):** 21 days
- **Polkadot (DOT):** 28 days, the longest unbonding window among major Layer-1 assets
Coinbase estimates that in worst-case scenarios, the combination of platform processing time and protocol unbonding can total up to 10 days for Ethereum. During periods of high exit activity, the queue lengthens because Ethereum's consensus layer processes a maximum of 16 withdrawal operations per block.
This means "flexible" staking is a misnomer. You can initiate unstaking at any time, but you cannot access the capital immediately. The protocol unbonding window is mandatory, non-negotiable, and applies whether you stake on Coinbase, Kraken, or [from your own wallet](https://altcoininvestor.com/defi-wallet/).
## Early Withdrawal Penalties And Opportunity Cost
Fixed-term staking products on centralized exchanges impose two types of penalties: explicit and implicit.
**Explicit penalties:** forfeiture of all accrued rewards if you exit before the term completes. Some platforms prohibit early exit entirely. Binance and OKX fixed-term products with 30-90 day commitments typically offer no early withdrawal option. You agreed to the term; the platform enforces it.
**Implicit penalties:** opportunity cost. If you lock ETH at 2.5% APY for 90 days and the market shifts such that a DeFi protocol begins offering 5% APY on the same asset, you cannot re-allocate. You sit in the lower-yielding position for the remainder of the term. The difference between what you earn and what you could have earned is the opportunity cost, and it is not refunded.
This cost is difficult to quantify in advance because it depends on market conditions that emerge during the lock-up period. But the structure of the contract guarantees that you bear the downside (capital illiquidity) without sharing in the upside (the ability to move to higher-yielding opportunities as they appear).
### MEV And Reward Capture Gaps
Maximal extractable value (MEV) represents additional income that validators earn by ordering transactions within blocks. On Ethereum, this can add 0.5-1.5 percentage points to gross staking yield. On Solana, MEV tips captured by validators using the Jito protocol push gross yields from approximately 5.8% to 9%.
Centralized exchanges rarely pass through MEV rewards to stakers. Coinbase pays 3.70% APY on Solana staking. Jito's JitoSOL, a liquid staking derivative, pays 5.8-9% because it captures MEV tips and distributes them to token holders. The difference is the MEV capture gap, and it accrues entirely to the platform.
When you [use liquid staking tokens](https://altcoininvestor.com/what-are-liquid-staking-tokens-beginner-guide/) or self-custody delegation to validators that optimize for MEV, you capture that additional yield. When you stake on a centralized exchange, you do not.
## Liquidity And Composability: What You Cannot Do With Exchange-Staked Assets
When you stake ETH on Coinbase, your balance appears as an internal ledger entry. You do not receive a composable token. You cannot use that staked position as collateral. You cannot deploy it into a DeFi protocol. You cannot sell it without first unstaking, waiting through the protocol unbonding period, and then withdrawing to an external wallet.
Liquid staking protocols solve this. When you stake ETH through Lido, you receive stETH, a token that represents your staked position and accrues staking rewards in real time. stETH can be wrapped into wstETH and used across more than 100 DeFi integrations. You can use it as collateral on Aave, supply it to liquidity pools, or sell it on secondary markets without unstaking.
This composability creates optionality. If you need liquidity before the unbonding period completes, you sell the liquid staking token at the prevailing market rate. The discount relative to the underlying asset (the "depeg risk") fluctuates, but during normal market conditions it remains below 1%.
Exchange-staked positions offer no such option. Unstaking is the only exit path, and unstaking triggers the protocol unbonding window plus any platform-specific processing delays.
### Yield Comparison: Flexible Versus Fixed Versus Self-Custody
Using Ethereum as the reference asset at a 3.2% gross protocol rate:
- **Coinbase standard (35% commission):** 2.08% APY net
- **Coinbase One Premium (25.25% commission):** 2.39% APY net (requires paid subscription)
- **Kraken bonded (20% commission, 0-28 day lock):** 2.56% APY net
- **Lido (10% commission, liquid staking token):** approximately 2.2% APR after fees
- **Rocket Pool (14% commission, liquid staking token):** approximately 2.97% net APY
The yield difference between Coinbase standard and Rocket Pool is 0.89 percentage points annually. On a $10,000 position, that difference costs $89 per year. On a $100,000 position, it costs $890 per year. [Compounded over five years](https://altcoininvestor.com/defi-yield-opportunity-cost-rate-difference/), the gap exceeds $4,500 on a $100,000 stake.
The convenience of exchange staking is real. One-click onboarding, no wallet management, custodial insurance, and 24/7 platform support. But the cost of that convenience is measurable, recurring, and non-trivial.
## Regulatory Jurisdiction And Asset Availability
Not all staking products are available in all jurisdictions. U.S.-based investors face structural constraints that reduce both asset selection and yield.
Binance redirects American users to Binance.US, which offers a narrower range of staking products and lower advertised yields than the global platform. Gemini holds a New York State license and SOC 2 Type 2 certification, which imposes conservative validator selection and caps advertised rates at approximately 6%. Kraken and Coinbase operate under state-by-state money transmitter licenses and periodic SEC scrutiny, which limits their willingness to offer staking on assets the SEC has labeled securities in ongoing enforcement actions.
Self-custody staking does not face these restrictions. If you hold the private keys, you can delegate to any validator on any proof-of-stake network, regardless of the regulatory posture of your home jurisdiction. The tradeoff: you bear full responsibility for operational security, tax reporting, and [IRS compliance on staking rewards](https://altcoininvestor.com/crypto-staking-tax-treatment-irs/).
## Who Each Option Is Right For
**Exchange staking (fixed-term):** suitable for holders who do not need liquidity for 30-90 days, who value simplicity over yield optimization, and who are comfortable with 25-35% commission in exchange for custodial insurance and platform support. Best for small positions (under $10,000) where the absolute dollar cost of commission is low and the time cost of learning self-custody is high.
**Exchange staking (flexible):** suitable for holders who want the option to unstake on short notice, who accept a 30-50% yield penalty relative to fixed-term products, and who prioritize liquidity over APY. Useful for users in high-inflation economies where the ability to exit quickly may matter more than marginal yield differences.
**Self-custody delegation:** suitable for holders comfortable with wallet security, who want to minimize commission (5-10% versus 25-40%), and who accept operational responsibility in exchange for higher net yield. Best for positions above $25,000 where the commission savings exceed $200 annually and justify the learning curve.
**Liquid staking tokens:** suitable for holders who want staking yield plus DeFi composability, who are comfortable with smart contract risk and depeg risk, and who value optionality over custodial insurance. Best for users who may need liquidity before the protocol unbonding window completes and who want the ability to use staked positions as collateral or in yield strategies.
## Recommendation: Match Lock-Up Terms To Your Liquidity Horizon
The right staking venue is not the one with the highest advertised APY. It is the one whose lock-up terms and commission structure align with your liquidity needs and your willingness to manage operational security.
If you are staking a four-figure position, do not need liquidity for 90 days, and value custodial insurance, exchange staking is defensible. The commission cost is low in absolute dollars, and the time cost of learning self-custody may exceed the yield you would gain.
If you are staking a five- or six-figure position, hold a multi-year time horizon, and can learn basic wallet security, self-custody delegation will deliver meaningfully higher net returns. The commission savings compound over time, and the operational risk (losing your seed phrase, approving a malicious transaction) is manageable with standard security practices.
If you need the option to access liquidity before the protocol unbonding window completes, liquid staking tokens are the only product that offers a secondary-market exit without waiting 8-28 days. The depeg risk is real but historically small during normal market conditions.
The worst choice: locking capital for 90 days in a fixed-term product paying 2.08% APY when the same asset, staked through a liquid staking protocol, pays 2.97% APY and offers secondary-market liquidity. The 0.89 percentage point gap costs $890 annually per $100,000 staked, and the lock-up prevents you from re-allocating if better opportunities emerge.
## The Takeaway
Exchange staking convenience costs 25-40% of your gross rewards plus liquidity constraints that range from 8 days (Ethereum protocol unbonding) to 90 days (fixed-term lock-up). Self-custody staking and liquid staking tokens reduce commission to 5-14% and preserve composability, but transfer operational risk to you. The decision hinges on position size, liquidity needs, and whether you are willing to manage a wallet in exchange for an additional 0.5-1.2 percentage points of APY annually. For positions above $25,000, the commission savings justify the learning curve. For positions below $10,000, the time cost may not.
In Argentina, Turkey, and Nigeria, where local currency devaluation can exceed 40% annually, the difference between 2% APY and 3% APY is not marginal. It is the difference between preserving purchasing power and losing it. The lock-up terms matter because the ability to move capital when currency crises accelerate is often worth more than the yield spread. Flexible staking and liquid staking tokens are not American retail features. They are utility primitives for users whose economic environment does not allow multi-month capital lock-ups.
## Frequently Asked Questions
### What is the typical commission rate for exchange staking?
Centralized exchanges charge 25-40% commission on staking rewards. Coinbase takes 35% (or 25-32% for Coinbase One members), Kraken charges 30% on flexible staking and 10-26% on bonded products, and Binance's commission structure can reduce a 19.67% gross rate to 11.8% net. Self-custody delegation to validators charges 5-10% protocol-level fees, and liquid staking protocols like Lido charge 10% while Rocket Pool charges approximately 14%.
### How long are exchange staking lock-up periods?
Exchange lock-up periods range from zero days (flexible staking) to 90 days (fixed-term products). Binance offers 15, 30, 60, and 90-day terms. Kraken bonded staking locks capital for 0-28 days depending on asset. Flexible staking allows immediate unstaking but pays 30-50% lower APY than fixed terms. All options still face protocol-level unbonding windows: Ethereum 8 days, Solana 1.5 days, Cosmos 21 days, Polkadot 28 days.
### Can I withdraw staked crypto early from an exchange?
Flexible staking allows immediate unstaking but you must wait through the protocol unbonding period (8 days for Ethereum, 21 days for Cosmos, 28 days for Polkadot). Fixed-term products prohibit early withdrawal or impose penalties that forfeit all accrued rewards. Even after initiating unstaking, Coinbase estimates total exit time can reach 10 days in worst-case scenarios when network exit queues are long.
### What is the yield difference between exchange staking and self-custody?
On Ethereum at 3.2% gross protocol rate, Coinbase standard delivers 2.08% net (35% commission), Kraken bonded delivers 2.56% (20% commission), and Rocket Pool delivers 2.97% (14% commission). The difference between Coinbase and Rocket Pool is 0.89 percentage points annually. On a $100,000 position that gap costs $890 per year and exceeds $4,500 over five years when compounded.
### Do liquid staking tokens avoid lock-up periods?
Liquid staking tokens like stETH and rETH allow you to sell your staked position on secondary markets without waiting through protocol unbonding. You receive a token representing your stake that trades at a small discount (typically under 1% during normal conditions) to the underlying asset. This provides liquidity before the 8-28 day unbonding window completes, though you bear depeg risk and smart contract risk in exchange for that optionality.
The Weekly Yield Report
You have just compared commission structures ranging from 10% to 35% and lock-up terms spanning 8 to 90 days. Those numbers shift every quarter as platforms compete and protocols adjust reward rates.
Every Thursday: where crypto yield actually is - stablecoins, liquid staking and DeFi lending, with the risk named next to the rate and what changed since last week.
[Get it free every Thursday](#/portal/signup)
Free. No trade calls, no allocations, no hype. Unsubscribe in one click.
### DeFi Wallet: What The Term Actually Means And What You Really Need
URL: https://altcoininvestor.com/defi-wallet/
Last updated: 2026-10-09T00:05:29.000Z
## What Is a DeFi Wallet

The question arrives the same way most crypto marketing arrives: as if a new category exists. Search "DeFi wallet" and you will find comparisons, rankings, and feature lists. The implication is that some wallets do DeFi and others do not. That implication is incorrect.
A [DeFi](https://altcoininvestor.com/defi/) wallet is any non-custodial wallet that allows you to interact with decentralized finance protocols. Every self-custody wallet that connects to a blockchain can sign transactions. Every transaction that interacts with a smart contract is a DeFi transaction. By that definition, every non-custodial wallet is a DeFi wallet.
The term does not describe a technical category. It describes a marketing position. What vendors call "DeFi optimization" is usually one of three things: a built-in swap aggregator that extracts fees, an RPC endpoint you could configure yourself, or a UI that surfaces protocol connections more clearly. None of these features change the wallet's fundamental function, which is to store private keys and sign transactions.
What the term obscures is more important than what it reveals. Wallets marketed as "DeFi-focused" often add swap aggregators that extract fees or route through inferior liquidity. MetaMask charges 0.875% on swaps and bridges. Rabby charges 0.25%. Phantom charges 0.85% on select assets. These spreads are not disclosed at the point of trade. Understanding what you actually need prevents paying hidden spreads on rebalancing trades.
## The Features That Actually Protect Yield Positions
The question that matters is not whether a wallet markets itself as "DeFi-ready." The question is whether it includes the features that reduce execution costs and prevent MEV extraction. Four features matter more than the rest.
### MEV Protection and Private RPCs
When you broadcast a transaction to the public mempool, MEV bots see it before it confirms. If your trade is large enough to move the price, a bot can submit a buy transaction with higher gas so it lands in the block right before yours. Your transaction pushes the price higher, the bot sells, and you paid for the spread. That is a sandwich attack. Retail traders using a phone wallet and a default slippage setting are the easiest marks.
Private RPC services bypass the public mempool by forwarding transactions directly to block builders or specialized relays. Your trade is not visible until it confirms. MetaMask's Smart Transactions, introduced in 2025, provide this protection by using a network of trusted block builders. The feature is free but optional. If you do not enable it, your transactions still route through the public mempool.
Private RPCs are not universal. Some wallets allow you to change the RPC endpoint manually. Others do not. In MetaMask, you access the network management panel, select the active chain, replace the default RPC URL, then verify connectivity with a balance check before proceeding to live trades. Rabby and Phantom do not surface RPC configuration as clearly. This matters if you are deploying yield across multiple chains and need consistent MEV protection on each.
### Transaction Batching
Most DeFi operations require multiple steps. You approve a token, then you supply liquidity. You withdraw from a vault, swap the reward token, then re-deposit the proceeds. Each step is a separate transaction, each transaction pays gas, and each transaction is an opportunity for MEV extraction.
Transaction batching allows you to submit multiple onchain write calls in a single transaction. EIP-5792 defines new JSON-RPC methods that enable applications to request wallets to process batches and monitor execution status. Base Account, for example, allows you to send multiple onchain calls in a single transaction, reducing multi-step interactions to a single click.
Smart contract wallets handle batching natively. Externally owned accounts do not, unless the wallet supports session keys or delegated logic. The Pectra upgrade, activated in May 2025, included EIP-7702, which lets existing EOAs delegate functionality to smart contract code while retaining the same address. That means batching, gas sponsorship, session keys, and recovery flows are now available to wallets that were previously limited to single-step transactions.
Not all wallets have implemented these standards. As of October 2026, most mobile wallets still treat each transaction as a separate operation. If you are rebalancing yield positions across multiple protocols, that difference adds up. A wallet with batching support saves gas and reduces the window for MEV bots to extract value between steps.
### Token Approval Management
When you interact with a DeFi protocol, you first approve the protocol's contract to spend your tokens. Most wallets default to unlimited approvals. That means the protocol can withdraw any amount of that token from your wallet at any time. If the contract is upgradeable or if the protocol is compromised, your entire balance is at risk.
Smart contract wallets, like Ambire Wallet, batch the approval with the actual transaction. You grant a limited approval for the exact amount required, and the approval is consumed in the same transaction. That reduces the exposure of the full asset amount and mitigates risks associated with upgradeable smart contracts.
Externally owned accounts require manual approval management. Some wallets surface active approvals and allow you to revoke them. Others do not. MetaMask allows you to view and revoke approvals through the permissions panel. Rabby and Phantom do not expose this function as clearly. If you are deploying capital into multiple protocols, you need to know which contracts have access to which tokens. A [wallet](https://altcoininvestor.com/crypto-wallet/) that does not surface that information makes auditing your exposure more difficult.
### Gas Optimization and Customization
Gas estimation is imprecise. Wallets predict the gas required for a transaction based on recent blocks, but network conditions change faster than wallets update their estimates. If the estimate is too low, your transaction fails and you pay for the attempt. If the estimate is too high, you overpay.
Some wallets allow you to customize gas limits and priority fees. MetaMask offers three preset options (low, medium, high) with advanced users able to manually adjust gas limits and priority fees. Rabby surfaces gas optimization through GasAccount, which allows you to pay gas fees with stablecoins instead of the native chain token. Phantom does not expose gas customization as clearly.
What matters more than manual control is whether the wallet actively optimizes gas or passively surfaces gas prices. A good multi-chain wallet should predict near-future gas spikes, select the cheapest routing for multi-step swaps, and present the cost trade-off in a human way. Most wallets do not do this. They pass the network's gas estimate to you and let you decide whether to proceed.
For yield deployment, that difference matters. If you are rebalancing positions on Ethereum mainnet during high congestion, paying 20% more than necessary because the wallet's estimate was stale erodes your returns. A wallet that batches transactions, routes through private RPCs, and estimates gas accurately reduces those losses.
## The Wallets That Actually Include These Features

MetaMask supports Ethereum, Layer 2s, Solana, Bitcoin, and other EVM chains. It includes Smart Transactions for MEV protection, but charges 0.875% on swaps and bridges. The MEV protection is real. The swap spread is real. If you use the built-in swap, you pay for both.
Rabby supports 140-plus EVM-compatible chains and charges 0.25% on built-in swaps. It includes GasAccount, which allows you to pay gas with stablecoins, and it surfaces active approvals more clearly than MetaMask. It does not include built-in MEV protection. You can configure a private RPC manually, but the wallet does not do it for you.
Phantom supports Solana, Ethereum, Polygon, Bitcoin, and Base. It charges 0.85% on select assets when you use the built-in swap. It does not expose RPC configuration or gas customization as clearly as MetaMask or Rabby. It is optimized for Solana, where MEV dynamics are different and where the wallet's default routing is less likely to expose you to sandwich attacks.
None of these wallets are optimized for yield deployment by default. They all include features that can reduce execution costs and MEV exposure, but most of those features require manual configuration. If you connect MetaMask to a DeFi protocol and use the default settings, your transactions route through the public mempool, your approvals are unlimited, and your gas estimates are whatever the network returns. That is not a failure of the wallet. That is the default behavior of an externally owned account.
## The Setup That Actually Protects Strategy
Serious DeFi users run a hot wallet for execution and a [cold wallet](https://altcoininvestor.com/best-crypto-hardware-wallets/) for storage. Funds move on purpose, not out of convenience. The optimal setup for yield deployment in 2026 is a hardware wallet for large holdings and high-value transactions, and a software wallet with MEV protection and transaction batching for active rebalancing.
Ledger with MetaMask connected provides full human-readable transaction details on the Ledger signer. MetaMask with Ledger shows raw transaction data on your Ledger signer, which is blind signing. The difference is which wallet initiates the connection. If you connect Ledger Wallet to MetaMask, you see full details. If you connect MetaMask to Ledger, you see raw data. That distinction is not obvious from the marketing.
Private RPC configuration is the other critical piece. You identify a reliable private RPC provider and update the network settings in your wallet. In MetaMask, you access the network management panel, select the active chain, replace the default RPC URL, then verify connectivity with a balance check before proceeding to live trades. The RPC you select determines whether your transactions are visible in the public mempool or routed directly to block builders.
For multi-chain yield deployment, you need consistent RPC configuration across every chain. That means manually configuring a private RPC for each network you use. Most wallets do not include private RPCs by default. You configure them yourself, or you accept the MEV exposure that comes with broadcasting to the public mempool.
## When Account Abstraction Changes the Trade-offs
ERC-4337, Ethereum's account abstraction standard, allows wallets to be smart contracts rather than simple key pairs. That unlocks features that traditional wallets cannot offer: social recovery, gasless transactions where a third party pays the fee on your behalf, transaction batching, and spending limits.
Account abstraction changes the security model. With an externally owned account, losing your private key means losing your funds. With a smart contract wallet, you designate trusted contacts who can restore your account. That reduces the risk of seed phrase loss, but it introduces reliance on the recovery network you designate. If those contacts are compromised, your wallet is compromised.
Most wallets marketed as "DeFi wallets" in 2026 are still externally owned accounts. The infrastructure for account abstraction exists, but adoption is slower than the standards suggest. If you are deploying capital into yield positions, the question is not whether account abstraction is better in principle. The question is whether the wallet you are using has implemented it, whether the protocols you interact with support it, and whether the added complexity is worth the features you gain.
For users in markets where [self-custody](https://altcoininvestor.com/what-is-self-custody-crypto/) is the only custody option, account abstraction reduces the risk of permanent loss. For users in markets where exchange custody is the norm, the benefits are less obvious. The trade-off is always the same: more features mean more attack surface, and more abstraction means more assumptions about the infrastructure you depend on.
## The Income Mechanism Hidden in Swap Aggregators
When you use a wallet's built-in swap function, the wallet routes your trade through a swap aggregator. The aggregator queries multiple liquidity sources, identifies the best price, and executes the trade. That sounds optimal. What the interface does not show you is that the aggregator extracts a spread on every trade, and that spread is rarely disclosed at the point of execution.
MetaMask charges 0.875% on swaps and bridges. Rabby charges 0.25%. Phantom charges 0.85% on select assets. Those spreads are in addition to the slippage you set and in addition to any protocol fees charged by the underlying liquidity source. If you are rebalancing yield positions frequently, those spreads add up faster than gas fees.
The alternative is to interact with protocols directly. You go to the protocol's interface, connect your wallet, and execute the trade. You pay the protocol's fee, you pay gas, and you pay whatever slippage the market requires. You do not pay the wallet's spread. That requires more steps, more gas, and more manual tracking. It also means you keep more of the yield you are earning.
Wallets marketed as "DeFi wallets" often generate revenue through these aggregators. That is not inherently exploitative, but it is rarely transparent. If your rebalancing strategy depends on capturing 50 basis points of yield arbitrage, and your wallet is extracting 87 basis points on every swap, your strategy does not work. Understanding what you actually pay is the first step to protecting the income your positions generate.
## The Takeaway
"DeFi wallet" is a marketing term, not a technical category. Every non-custodial wallet can access DeFi protocols by signing transactions. What determines whether a wallet protects yield positions is not whether it markets itself as "DeFi-ready" but whether it includes MEV protection, transaction batching, token approval management, and gas optimization. MetaMask, Rabby, and Phantom all offer some of these features, but most require manual configuration. Serious yield deployment requires a hot wallet with private RPC routing and a cold wallet for storage. The swap aggregators built into most wallets extract spreads that often exceed gas savings. If you are rebalancing positions frequently, those spreads erode returns faster than most users realize.
The next step is deciding which features you need for your deployment strategy, configuring them correctly, and auditing your wallet's active approvals and RPC endpoints. That work is manual, it is unglamorous, and it is the difference between keeping the yield you earn and paying it to MEV bots and aggregator fees.
## Frequently Asked Questions
### Is a DeFi wallet different from a regular crypto wallet?
No. DeFi wallet is a marketing term, not a technical category. Every non-custodial wallet that can sign transactions can interact with DeFi protocols. The term implies specialization that does not exist. What matters is whether the wallet includes MEV protection, transaction batching, token approval management, and gas optimization, not whether it markets itself as DeFi-focused. All self-custody wallets access smart contracts the same way.
### What is MEV protection and why does it matter for yield?
MEV protection prevents bots from front-running your transactions. When you broadcast a trade to the public mempool, MEV bots see it before it confirms. If your trade moves the price enough, they submit a higher-gas buy before yours, then sell after, extracting the spread you paid. Private RPC services route transactions directly to block builders, hiding your trade until confirmation. This protects yield positions by preventing sandwich attacks that erode returns.
### Do wallet swap fees reduce my DeFi yield?
Yes. MetaMask charges 0.875% on swaps and bridges. Rabby charges 0.25%. Phantom charges 0.85% on select assets. These spreads are in addition to slippage and protocol fees. If you rebalance yield positions frequently, wallet swap spreads often exceed gas costs. Interacting directly with protocols eliminates wallet spreads but requires more steps and higher gas. The trade-off depends on your rebalancing frequency and position size.
### Should I use a hardware wallet for DeFi yield deployment?
Serious DeFi users run a hot wallet for execution and a cold wallet for storage. Hardware wallets like Ledger protect large holdings and high-value transactions. Software wallets with MEV protection and transaction batching handle active rebalancing more efficiently. The optimal setup separates storage security from execution speed. Funds move between wallets on purpose, not out of convenience. This two-wallet model reduces attack surface while maintaining operational flexibility.
### What is transaction batching and how does it save gas?
Transaction batching submits multiple onchain operations in a single transaction. Most DeFi actions require multiple steps: approve a token, supply liquidity, withdraw rewards, swap tokens. Each step normally costs gas separately. Batching combines them into one transaction, reducing total gas cost and limiting MEV exposure between steps. EIP-5792 defines the standard. Smart contract wallets handle batching natively. Externally owned accounts require wallet-level support that most mobile wallets have not yet implemented.
Tool mentioned above
Ledger
Ledger devices display the full transaction on their own screen before you approve it, which is what stops an approval exploit at the point it matters.
[See Ledger devices](https://shop.ledger.com/?r=90612ff43561)
We may earn a commission if you sign up through this link, at no cost to you. It does not change what gets recommended.
The Weekly Yield Report
You have just reviewed MEV protection, transaction batching, and approval management across three leading wallets. Those features will evolve, and new standards will change the trade-offs again.
Every Thursday: where crypto yield actually is - stablecoins, liquid staking and DeFi lending, with the risk named next to the rate and what changed since last week.
[Get it free every Thursday](#/portal/signup)
Free. No trade calls, no allocations, no hype. Unsubscribe in one click.
### Is Trust Wallet Safe? Attack Vectors And What Actually Broke
URL: https://altcoininvestor.com/is-trust-wallet-safe/
Last updated: 2026-10-08T23:03:17.000Z
## The Question: Is Trust Wallet Safe?

Trust Wallet serves over 200 million users across 100+ blockchains. It is non-custodial, which means Trust Wallet never holds your private keys. The question most people want answered is whether that non-custodial architecture makes it safe. The short answer is no, not automatically. Non-custodial means you hold the keys and assume full custody responsibility. It does not protect you from seed phrase harvesting, malicious dApp approvals, phishing-induced transaction signing, or supply-chain compromise of the wallet software itself.
In December 2025, approximately $7 million was stolen from Trust Wallet users after version 2.68.0 of the Chrome browser extension was compromised. Attackers injected malicious JavaScript that exfiltrated seed phrases every time a user unlocked the wallet, whether with a password or biometrics. The mobile app was not affected. This incident was not a code vulnerability in the traditional sense. It was a supply-chain attack that bypassed Trust Wallet's internal release process by exploiting the Chrome Web Store API key.
Trust Wallet is safe in the sense that it does not custody your funds. It is not safe in the sense that documented attack vectors exist, reproducible incidents have drained capital, and most users misunderstand what they are protecting against. If you are holding yield positions, staked assets, or LP tokens worth defending, you need to understand what actually broke, which attack surfaces remain open, and what deployment model minimizes exposure.
## What Actually Broke: Documented Security Incidents

The December 2025 browser extension compromise is the most significant documented incident. Version 2.68.0 of the Chrome extension was published with a malicious JavaScript file that monitored wallet unlock events. On every unlock, whether through password authentication or biometric unlock, the malicious code harvested the user's 12-word recovery phrase and transmitted it to an attacker-controlled server. This was not a phishing attack that required user error. It was a backdoor embedded in an official release.
The malicious extension was not published through Trust Wallet's standard internal manual release process. Forensic analysis suggests the attackers gained access to the Chrome Web Store API key and published the compromised version externally, bypassing the internal checks that would have caught the malicious code. The extension remained live in the Chrome Web Store for a period long enough to affect thousands of wallets. Mobile users were entirely unaffected. All other browser extension versions, past and future, were also unaffected.
This was the second major vulnerability documented in Trust Wallet's browser extension. In 2022 and 2023, a low-entropy key generation flaw (CVE-2023-31290) allowed attackers to exploit insufficient randomness in seed generation. The vulnerability stemmed from an enumerability issue where only a 32-bit seed space was used, making it computationally feasible to derive and identify potentially affected wallet addresses. That vulnerability was patched, but the fact that it existed for over a year demonstrates the higher attack surface inherent in browser-based wallet deployments.
Beyond software compromise, Trust Wallet users face active phishing campaigns that abuse the wallet's deep link mechanism. One documented campaign distributes QR codes via Telegram that use Trust Wallet's **link.trustwallet.com/open\_url** deep linking protocol to redirect victims to attacker-controlled phishing domains hosted on Netlify. These domains masquerade as legitimate USDT transfer interfaces. When the user believes they are initiating a token transfer, they are actually signing an ERC-20 **approve()** transaction that grants unlimited token allowance to an attacker-controlled contract on BNB Smart Chain. Once the approval is granted, the attacker can drain the wallet repeatedly without further user interaction.
The critical detail: disconnecting from a dApp session does not revoke the on-chain approval. Approvals persist indefinitely until explicitly revoked. Trust Wallet added a built-in token approval manager in November 2025, allowing users to view and revoke active approvals in both the mobile app and browser extension. This is a genuine security improvement, but it requires users to actively audit their approvals, which most do not do.
## Reproducible Attack Surfaces You Are Exposed To

Trust Wallet's non-custodial model protects you from exchange insolvency and custodial seizure. It does not protect you from the following reproducible attack surfaces, all of which have documented incident data.
**Browser Extension Supply-Chain Risk:** Browser extensions operate with elevated permissions over web pages, cookies, local storage, and browsing activity. When a wallet is deployed as a browser extension, it inherits the full attack surface of the browser environment. Frequent updates, broad permissions, and dependency on third-party distribution infrastructure make browser extensions a higher-risk deployment model than mobile or hardware wallets. The December 2025 incident proved that even official releases can be weaponized if attackers compromise the distribution pipeline.
**dApp Permission And Token Approval Exploits:** When you connect Trust Wallet to a decentralized application, the dApp can request permission to spend tokens on your behalf. Some dApps request an exact allowance. Others request unlimited approval. These approvals are recorded on-chain and remain active after you close the dApp or disconnect the WalletConnect session. A malicious dApp can request an approval that appears benign, then drain your wallet hours or weeks later. Trust Wallet now includes an approval scanner and revocation tool, but this does not prevent the initial approval from being granted if the user does not recognize the risk.
**Deep Link And QR Code Phishing:** Trust Wallet's deep link mechanism is a legitimate feature that allows external services to trigger wallet actions. Attackers abuse this by distributing QR codes or links via Telegram, Discord, or email that redirect users to phishing domains. The phishing flow is designed to look like a standard token transfer interface, but the transaction being signed is an unlimited approval to an attacker-controlled contract. The user sees "Transfer 100 USDT" and signs what is actually "Approve unlimited USDT to contract 0x...".
**Clipboard Hijacking:** This attack requires device-level malware, not a wallet vulnerability, but it is worth documenting because it bypasses Trust Wallet's address-poisoning detection. Clipboard hijacking malware monitors clipboard activity and replaces legitimate wallet addresses with attacker-controlled addresses in real time. Trust Wallet has built-in detection for address poisoning, which flags suspicious addresses that appear in your paste history. However, clipboard hijackers replace the address after you copy it but before you paste it, so the poisoned address never appears in your transaction history until after the funds are sent.
**Ice Phishing Via Transaction Signing:** Malicious dApps can present users with transactions that appear to be harmless message signatures or marketplace offers but are actually **Permit()** authorizations or NFT collection sale approvals. These grant persistent spending rights without appearing as traditional ERC-20 token approvals. Trust Wallet's transaction preview can help, but if the user is conditioned to sign messages without reviewing them, the approval is granted.
## What Safe Actually Means When You Are Holding Yield Positions
If you are using Trust Wallet to hold staked ETH, LP tokens, or yield-bearing ERC-20 assets, wallet compromise does not just mean losing liquid capital. It means losing positions that are accruing value, often in ways that are not immediately visible on-chain. A compromised wallet can drain staked positions, withdraw LP tokens, or transfer yield-bearing assets without leaving an obvious trace if the attacker simply signs a withdrawal transaction using your harvested private key.
Most yield positions are not liquid. They require unstaking periods, withdrawal queues, or slippage-heavy exits. If an attacker gains access to your wallet, they do not need to wait. They can sign a transaction that initiates the withdrawal, then wait for the unlock period to expire and claim the funds. By the time you notice, the capital is already moving.
The Income Test here is simple: wallet compromise can erase weeks or months of yield in a single transaction. The question is not whether Trust Wallet is conceptually safe, but whether your deployment model minimizes the reproducible attack surfaces that have already drained capital from other users.
### Safest Deployment Model
Mobile app only, on a secure device, with the recovery phrase stored offline in a physical location you control. Do not import your seed phrase into the browser extension unless you need active dApp interaction. If you do use the browser extension, treat it as a hot wallet with limited capital and audit token approvals weekly using Trust Wallet's built-in approval manager.
### Moderate-Risk Deployment Model
Mobile app for primary holdings, browser extension on a separate device for dApp interaction. Never import the same seed phrase into both. Use the approval manager to revoke permissions after every dApp session. Set transaction signing to require biometric or password confirmation for every transaction, not just high-value ones.
### High-Risk Deployment Model
Browser extension as your primary wallet, especially if you imported a seed phrase during or near a release window when a compromised version may have been live. Active dApp interaction without regular approval audits. Unlimited token approvals granted to protocols you do not actively monitor.
### What Hardware Wallet Integration Would Change
Trust Wallet supports connection to hardware wallets like [Ledger and Trezor](https://altcoininvestor.com/best-crypto-hardware-wallets/). This does not eliminate dApp approval risk, because the hardware wallet will still sign malicious approvals if you confirm them. What it does eliminate is seed phrase exposure. If you hold yield positions worth more than $5,000, hardware wallet integration is the single most effective mitigation against the supply-chain and phishing risks documented above.
## When Trust Wallet Is The Right Tool
Trust Wallet is suitable for mobile-first users who need multi-chain support, built-in staking for 20+ assets, and a zero-fee wallet that does not charge swap spreads beyond what the underlying DEX router charges. It is not suitable for users who need browser-based dApp interaction without accepting elevated supply-chain risk, or for users who hold yield positions large enough that a single compromise event would represent unacceptable capital loss.
If you are deploying capital into DeFi protocols, prediction markets, or on-chain gambling platforms that require frequent transaction signing, you are better served by a hardware wallet with Trust Wallet acting as the interface layer. If you are holding liquid tokens and staking through Trust Wallet's built-in staking interface for Ethereum, Solana, BNB, or Cosmos, the mobile app is a reasonable deployment model as long as your device is secure and your recovery phrase is offline.
If you are using the browser extension for active dApp interaction, you are accepting the documented supply-chain risk in exchange for convenience. That is a legitimate trade, but it is a trade. You should treat the browser extension as a hot wallet, limit capital exposure, and audit approvals after every session.
## The Takeaway
Trust Wallet is non-custodial, which means you hold the keys and assume custody responsibility. That is not the same as safe. The December 2025 browser extension compromise drained $7 million by harvesting seed phrases on every wallet unlock. The attack bypassed internal release checks by exploiting Chrome Web Store API access. Mobile users were unaffected. Prior vulnerabilities, including low-entropy key generation and active QR-based phishing campaigns, demonstrate reproducible attack surfaces that remain open.
If you are holding yield positions, staked assets, or LP tokens, wallet compromise can drain capital without leaving an obvious on-chain trace. The safest deployment model is mobile-only with offline recovery phrase storage. Browser extension use introduces supply-chain risk that has already materialized. Hardware wallet integration eliminates seed phrase exposure but does not prevent malicious dApp approvals. Audit your token approvals using Trust Wallet's built-in manager, revoke permissions after dApp sessions, and understand that disconnecting from a dApp does not revoke on-chain allowances.
Safe means different things at different capital levels. At $500, mobile-only Trust Wallet is defensible. At $50,000, hardware wallet integration is the minimum viable security model. The documented incidents show what can break. Your deployment model determines whether it will.
## Frequently Asked Questions
### Is Trust Wallet safe to use in 2026?
Trust Wallet is safe for mobile-only use with proper security hygiene, meaning offline recovery phrase storage and regular approval audits. The December 2025 browser extension compromise affected only Chrome extension v2.68, not mobile apps. However, non-custodial does not mean attack-proof. Documented risks include supply-chain compromise, dApp approval exploits, and phishing campaigns. Safety depends on your deployment model and capital exposure.
### What happened in the December 2025 Trust Wallet hack?
Approximately $7 million was stolen after version 2.68.0 of the Trust Wallet Chrome extension was compromised with malicious JavaScript. The code harvested users' 12-word recovery phrases on every wallet unlock, whether by password or biometrics. The attack bypassed Trust Wallet's internal release process by exploiting the Chrome Web Store API key. Mobile app users were entirely unaffected. The malicious extension was not a code vulnerability but a supply-chain compromise.
### Does disconnecting from a dApp revoke token approvals in Trust Wallet?
No. Disconnecting a WalletConnect session ends the live connection but does not revoke the on-chain token approval. Approvals granted to smart contracts persist indefinitely until explicitly revoked. Trust Wallet added a built-in token approval manager in November 2025 that allows you to view and revoke active approvals in both mobile and browser extension. You must manually audit and revoke approvals after each dApp session to eliminate this risk.
### Should I use Trust Wallet mobile app or browser extension?
The mobile app has a significantly lower attack surface than the browser extension. The December 2025 compromise and the 2022-2023 low-entropy key generation flaw both affected only the browser extension. If you need browser-based dApp interaction, use the extension as a hot wallet with limited capital and never import the same seed phrase used in your mobile app. For yield positions or capital above $5,000, hardware wallet integration is the minimum viable security model.
### Can Trust Wallet protect me from phishing attacks?
Trust Wallet includes address-poisoning detection and a security scanner that flags high-risk dApps, but it cannot prevent you from signing malicious transactions if you confirm them. Active phishing campaigns abuse Trust Wallet's deep link mechanism to redirect users to fake USDT transfer interfaces that are actually unlimited ERC-20 approval requests. The wallet can warn you, but final transaction approval is your responsibility. Always verify the contract address and approval amount before signing.
Tool mentioned above
Ledger
Ledger devices display the full transaction on their own screen before you approve it, which is what stops an approval exploit at the point it matters.
[See Ledger devices](https://shop.ledger.com/?r=90612ff43561)
We may earn a commission if you sign up through this link, at no cost to you. It does not change what gets recommended.
The Weekly Yield Report
You have just reviewed three documented Trust Wallet compromises and five reproducible attack surfaces. The next supply-chain incident or phishing campaign is already being designed.
Every Thursday: where crypto yield actually is - stablecoins, liquid staking and DeFi lending, with the risk named next to the rate and what changed since last week.
[Get it free every Thursday](#/portal/signup)
Free. No trade calls, no allocations, no hype. Unsubscribe in one click.
### What Happens To Your Staked Assets If Exchange Goes Bankrupt
URL: https://altcoininvestor.com/exchange-bankruptcy-staked-funds-safe/
Last updated: 2026-10-08T22:03:55.000Z
## The Question Nobody Asks Before They Stake

You deposit ETH into an exchange staking program. The platform advertises 4.2% APY. You see the rewards accumulate each week. The question most stakers never ask is what legal interest they hold in those assets while they sit on the platform.
That question becomes critical the moment the exchange files for bankruptcy. At that point, withdrawals freeze immediately. Your staking position does not continue earning. You do not retain the ability to unstake. You become a creditor in a bankruptcy case, and your recovery depends entirely on how the court classifies the assets you thought you owned.
The outcome is not theoretical. Between 2022 and 2024, four major centralized platforms offering staking and lending products filed for bankruptcy in the United States. The recovery rates ranged from 30 cents on the dollar to 118% of claim value. The determining factor was not the platform's balance sheet. It was the legal structure of the deposit relationship as defined by terms of service you accepted when you clicked the button to earn yield.
## What Actually Happened In Four Major Crypto Bankruptcies

FTX Trading filed for Chapter 11 bankruptcy in November 2022 with an $8 billion shortfall in customer funds. By October 2024, the estate had recovered $16 to $17 billion in assets, enough to repay 98% of creditors at 118% of their claim value in cash. Over $9.7 billion has been distributed across five rounds as of July 2026\. The timeline from filing to approved repayment plan was two years.
Celsius Network halted withdrawals on June 12, 2022, with $4.7 billion of customer crypto still on the platform. The company filed for bankruptcy in July 2022 and exited bankruptcy in January 2024\. Three distribution rounds returned approximately $2.87 billion to creditors, bringing the cumulative recovery rate to 64.9% with a final target range of 67% to 85% of claims. Customers who held assets in the Earn program received approximately 30 cents on the dollar. The critical distinction was that the bankruptcy court ruled Earn deposits became property of Celsius under the platform's Terms of Use, meaning Earn customers were unsecured creditors rather than owners of segregated assets.
Voyager Digital filed for bankruptcy in July 2022\. The platform predicted a 35% recovery in May 2023, and customers received an initial 35.72% recovery approximately one year after the filing. Voyager's estate secured $484.35 million from settlements with FTX, Three Arrows Capital, and Directors and Officers insurance.
BlockFi filed for bankruptcy in November 2022 and emerged in October of the following year. Its plan targeted full recovery of eligible allowed dollar claims. Creditors were able to withdraw through Coinbase once distributions began.
The pattern across these cases is consistent. Platforms that recovered assets aggressively and filed in favorable jurisdictions returned capital faster and at higher rates. Platforms where customer deposits were classified as property of the estate rather than segregated customer funds saw dramatically lower recovery rates for depositors.
## The Legal Distinction That Determines Your Recovery
When you deposit crypto into an [exchange earn program](https://altcoininvestor.com/how-does-binance-earn-work-cex-yield-2/), you typically transfer legal ownership of those assets to the platform. The terms of service define this relationship, and bankruptcy courts enforce those terms. Chief Judge Glenn in the Celsius case ruled that even if customers believed they were lending assets to Celsius, they held only unsecured claims because the loan of property to another creates a debtor-creditor relationship. Absent a perfected security interest, the creditor holds only an unsecured claim in bankruptcy.
The distinction between custody and earn programs proved decisive in the Celsius case. Customers who held assets in Celsius Custody accounts retained property interests in their assets. They were not subject to the pro-rata distribution that applied to general unsecured creditors. Earn customers, by contrast, received distributions from a customer property pool valued substantially lower than the recovery they would have received if they had retained legal ownership.
This asymmetry produced substantial litigation and customer dissatisfaction. The legal framework treated two groups of depositors on the same platform entirely differently based solely on which product they selected. The Earn customers who were chasing yield became unsecured creditors. The Custody customers who were not remained asset owners.
When a domestic exchange files for bankruptcy protection in the United States, all cryptocurrency held by the exchange in a custodial capacity is likely to be considered property of the debtor's bankruptcy estate. Upon filing, a new legal entity is created, the debtor's estate, which assumes all of the debtor's property rights. The automatic stay prevents customers from immediately withdrawing or trading their cryptocurrency. The platform has at minimum a possessory interest in the digital assets, and that interest is sufficient to freeze all customer access.
### Why Terms of Service Override Your Assumptions
The Celsius bankruptcy case established that the platform's Terms of Use transferred ownership of deposited assets to Celsius. This was not a technicality. It was the central legal determination that converted depositors into unsecured creditors. The Goodwin Procter analysis of this case concluded that customer assets in the Earn program were property of the estate rather than customer property because the Earn terms granted Celsius title to the assets.
The implication is straightforward. If you accept terms of service that transfer ownership of deposited assets to the platform, you become an unsecured creditor the moment the platform files for bankruptcy. Your claim is subordinate to secured creditors and administrative expenses. Your recovery is limited to whatever remains in the estate after those higher-priority claims are satisfied.
Most stakers do not read the terms of service. Most assume that staking means the platform is holding their assets in trust and will return them on demand. That assumption is incorrect. Exchange staking is a counterparty arrangement where the platform holds your private keys, manages validator infrastructure, and credits rewards after deducting a commission that typically runs 25% to 40% of gross yield. The platform owns the assets. You own a contractual claim to future performance.
## How Recovery Timelines and Rates Actually Differed
Mt. Gox filed for bankruptcy in 2014\. Creditors did not begin receiving Bitcoin and Bitcoin Cash repayments until 2024, roughly ten years later. This is the extreme outlier in timeline terms, but it is not irrelevant. It demonstrates that bankruptcy proceedings in crypto can extend for a decade when asset recovery is complex and jurisdictional disputes are unresolved.
FTX's two-year timeline from filing to approved repayment plan represents the other end of the spectrum. The FTX estate benefited from aggressive asset recovery efforts and from market appreciation of the recovered assets. Because claims were denominated in dollars at the petition date, the rise in crypto asset prices between November 2022 and October 2024 allowed the estate to repay creditors at values exceeding their original deposits.
The [FTX bankruptcy claims soared in value in over-the-counter markets](https://www.coindesk.com/markets/2023/09/28/ftx-bankruptcy-claims-soar-in-value-in-over-the-counter-markets-as-estate-recovers-73b) as the estate recovered $7.3 billion in assets. This secondary market for claims reflected expectations of high recovery rates, and those expectations were validated by the final plan.
Voyager's 35% initial recovery and Celsius's 30 cents on the dollar for Earn customers represent the depressing median. These platforms did not recover sufficient assets to return customer deposits in full. The shortfalls were structural. Three Arrows Capital, a major counterparty for Voyager, had itself collapsed. Celsius had lent customer assets into illiquid positions that could not be unwound without substantial losses.
BlockFi targeted full recovery of eligible dollar claims, but that outcome was contingent on recoveries from FTX. The interconnectedness of these bankruptcies created cascading delays. A creditor of BlockFi waiting for repayment was effectively waiting for the FTX estate to distribute funds first.
### The Federal Insurance Gap Nobody Fills
Traditional banking institutions in the United States are protected by the Federal Deposit Insurance Corporation, which insures deposits up to $250,000 per depositor. Traditional brokerage firms are backed by the Securities Investor Protection Corporation, which protects securities and cash up to $500,000 per customer. Cryptocurrency platforms have no equivalent federal insolvency safety net.
When a digital asset corporation collapses, recovery efforts proceed directly under Chapter 11 of the U.S. Bankruptcy Code. There is no insurance fund to make depositors whole while the estate is liquidated. Customers become unsecured creditors and wait in line with all other unsecured creditors for whatever the estate recovers.
This gap is structural and unlikely to close in the near term. Crypto platforms operate in a regulatory gray zone where deposit-taking is not classified as banking and asset custody is not classified as securities brokerage. The protections that apply to traditional finance do not extend to crypto, and no federal agency has stepped in to create a parallel insurance regime.
The result is that [choosing a crypto exchange](https://altcoininvestor.com/best-crypto-exchanges/) involves assessing counterparty risk that is uninsured and poorly disclosed. The platforms that advertise the highest staking yields are often the platforms with the weakest balance sheets and the highest risk of insolvency.
## What Staking On An Exchange Actually Means Legally
When you stake crypto on a centralized exchange, you deposit assets into a custodial account controlled by the platform. The platform aggregates customer deposits and operates validator nodes on proof-of-stake networks. The network pays [staking rewards](https://altcoininvestor.com/staking-rewards-explained-calculation-reductions/) to the validator, and the platform credits a portion of those rewards to your account after deducting a commission.
The commission drag is material. Exchange commissions of 26% to 40% mean that a substantial share of gross yield is retained by the platform rather than credited to you. This drag compounds over time, and it compounds the freeze risk. If the platform becomes insolvent, you lose not only the principal you deposited but also all future rewards you would have earned if you had staked independently.
The FTX collapse in November 2022 demonstrated what exchange insolvency means for custodial staking positions in real time. Withdrawals halted immediately. No queue position was offered. Stakers had no legal recourse for the principal they had deposited. For users with assets staked on FTX at the time of collapse, the counterparty risk that had been theoretical became a total and permanent loss, mitigated only by the extraordinary asset recovery that followed.
The classification of staking deposits as loans rather than custody was articulated clearly in the Celsius case. Chief Judge Glenn ruled that even if customers loaned digital assets to Celsius, they would still be unsecured creditors because the loan of money or property to another creates a debtor-creditor relationship. This is blackletter law. It applies across jurisdictions. It means that staking on a centralized exchange converts you from an asset owner into a creditor the moment you deposit.
### Why Jurisdiction and Regulatory Structure Matter
The bankruptcy cases discussed here were all filed in the United States under Chapter 11\. The outcomes reflect U.S. bankruptcy law, which gives substantial discretion to the debtor and the court to restructure the estate and distribute assets. Other jurisdictions have different frameworks, and those frameworks produce different outcomes.
Platforms incorporated in offshore jurisdictions with weak creditor protections present higher risk. If a platform incorporated in a jurisdiction with limited bankruptcy infrastructure fails, creditors may have no effective legal recourse. The platform's assets may be located in multiple jurisdictions, and coordination across those jurisdictions may be impossible. Recovery rates in such cases are typically lower than in U.S. Chapter 11 proceedings.
European platforms subject to the Markets in Crypto-Assets Regulation may face different custody and segregation requirements once MiCA is fully implemented. The regulation requires custodial service providers to hold client assets separately from the provider's own assets. If this requirement is enforced strictly, it could reduce the risk that customer deposits are classified as property of the estate in a future insolvency.
That outcome is not guaranteed. Enforcement of custody segregation rules depends on regulatory capacity, and many European regulators lack the resources to audit crypto custodians continuously. The legal classification of customer assets in a bankruptcy will depend on the actual holding structure, not on the regulatory intent.
## The Income Mechanism and Its Actual Risk
The [income mechanism offered by centralized exchange earn programs](https://altcoininvestor.com/how-does-binance-earn-work-cex-yield/) is straightforward. You deposit crypto, the platform pays you yield, and you assume counterparty risk. The yield comes from the platform's ability to lend your assets, stake them, or use them as collateral in trading operations. The platform retains a spread between what it earns on your assets and what it credits to you.
The risk is that the platform becomes insolvent before you withdraw. When that happens, your assets are frozen, your legal status changes from owner to creditor, and your recovery depends on the estate's ability to recover assets and the court's classification of your claim.
The Celsius Earn case is the clearest illustration of this risk. Earn customers deposited crypto expecting to earn yield. The platform used those deposits to make loans and investments that became illiquid. When the platform could not meet withdrawal requests, it froze accounts and filed for bankruptcy. Earn customers recovered 30 cents on the dollar because the court ruled they were unsecured creditors rather than asset owners.
The FTX case is the positive outlier, but it is not representative. FTX creditors recovered 118% of claim value because the estate recovered $16 to $17 billion in assets and because the market appreciated between the petition date and the distribution date. That outcome required extraordinary asset recovery efforts and favorable market conditions. It is not the expected outcome in a typical exchange insolvency.
The commission drag on staking rewards makes the income proposition worse. If you earn 4% gross staking yield and the exchange takes 30% commission, you receive 2.8% net. If the exchange becomes insolvent and you recover 35% of your principal, you need to earn that 2.8% for more than twelve years just to break even on the lost principal. The income mechanism is fragile, and the downside risk is catastrophic.
### What You Actually Control When Staking On An Exchange
When you stake on a centralized exchange, you control nothing. You do not hold the private keys. You do not control the validator. You cannot unstake unilaterally. The platform credits rewards to your account, but those credits are internal accounting entries. You do not receive on-chain transfers of staking rewards. The rewards are owed to you as a contractual claim, and that claim is enforceable only if the platform remains solvent.
If the platform files for bankruptcy, the automatic stay prevents you from withdrawing. The platform's possessory interest in your assets is sufficient to freeze all customer access. You cannot move your assets to another wallet. You cannot unstake them. You cannot vote with them in governance. You are a creditor waiting in line.
This is the opposite of [self-custody staking](https://altcoininvestor.com/how-to-protect-your-seed-phrase/), where you hold the private keys and control the validator. In self-custody staking, you receive staking rewards directly from the network. You can unstake at any time subject to the network's unbonding period. You are the asset owner, not a creditor.
The convenience of exchange staking comes at the cost of control and legal status. The platform handles the technical complexity, but you assume counterparty risk that you cannot hedge and cannot monitor in real time. The platform's solvency is opaque. The terms of service are written to favor the platform. The legal outcome in bankruptcy is predictable and unfavorable.
## The Takeaway: Recovery Rates Reflect Legal Structure, Not Platform Promises
The difference between FTX's 118% recovery and Celsius Earn's 30% recovery was not operational competence or ethical intent. It was asset recovery and legal classification. FTX recovered assets aggressively and creditors were paid in dollars that appreciated. Celsius Earn customers were classified as unsecured creditors and received pro-rata distributions from a depleted estate.
The legal structure of your deposit determines your recovery. If the terms of service transfer ownership to the platform, you are a creditor. If the platform segregates assets and does not claim ownership, you may retain a property interest. Most earn and staking programs transfer ownership. That transfer happens when you click the button to start earning yield, not when the platform files for bankruptcy.
For readers in high-inflation economies where stablecoin yield on centralized platforms is the accessible option, this is not an abstract risk. Platforms operating in emerging markets often lack the balance sheet transparency and regulatory oversight of U.S. or European exchanges. The bankruptcy proceedings, if they occur, may unfold in jurisdictions with weak creditor protections and long timelines. The recovery rates in those cases are likely to be lower than the 35% to 64% range seen in recent U.S. cases.
The income mechanism is real. The yield is measurable. The risk is catastrophic and uninsured. The legal status you assume when you deposit is not what most stakers believe it to be. The question you should ask before you stake is not what the APY is. The question is what happens to your assets if the platform files for bankruptcy tomorrow, and whether you can afford to wait ten years to recover 30 cents on the dollar.
## Frequently Asked Questions
### Are staked funds on exchanges protected if the platform goes bankrupt?
No, staked funds on centralized exchanges typically have no federal insurance protection. When you deposit crypto into exchange staking programs, the terms of service usually transfer legal ownership to the platform, converting you into an unsecured creditor if the exchange files for bankruptcy. Recovery rates in recent cases ranged from 30% for Celsius Earn customers to 118% for FTX creditors. Unlike bank deposits insured by FDIC or brokerage accounts protected by SIPC, crypto staking deposits have no government safety net. Your recovery depends entirely on the bankruptcy estate's asset recovery efforts and the court's classification of your claim.
### How long does it take to recover staked assets after an exchange bankruptcy?
Recovery timelines for staked assets in exchange bankruptcies vary dramatically. FTX filed in November 2022 and began distributions in 2025, approximately two years later. Celsius filed in July 2022 and completed distributions by early 2024, roughly 18 months later. Voyager customers received initial recovery about one year after filing. Mt. Gox represents the extreme outlier, filing in 2014 but not beginning repayments until 2024, a ten-year delay. The timeline depends on asset recovery complexity, jurisdictional disputes, and creditor negotiations. You should assume a minimum two-year wait and plan accordingly.
### What is the difference between custody and earn programs in bankruptcy?
The difference between custody and earn programs determines your legal status and recovery in bankruptcy. Custody customers typically retain property interests in their assets because the platform holds assets on behalf of the customer without claiming ownership. Earn program customers usually become unsecured creditors because the terms of service transfer asset ownership to the platform in exchange for yield. In the Celsius bankruptcy, Custody customers retained superior recovery rights while Earn customers received approximately 30 cents on the dollar. The distinction is not marketing language but enforceable legal classification that courts apply strictly. Read the terms of service to understand which category your deposits fall into.
### Can I withdraw my staked crypto if the exchange files for bankruptcy?
No, you cannot withdraw staked crypto once an exchange files for bankruptcy. The automatic stay imposed by U.S. bankruptcy law freezes all customer withdrawals immediately. The platform's possessory interest in your deposited assets is sufficient to prevent you from moving, unstaking, or trading your crypto. Your staking rewards stop accruing at the moment of filing. You have no queue position and no legal right to withdraw. You become a creditor in the bankruptcy case and must wait for the court to approve a distribution plan. Withdrawals halted instantly for FTX, Celsius, Voyager, and BlockFi customers when those platforms filed.
### Do exchange staking terms of service affect my recovery in bankruptcy?
Yes, the terms of service you accepted when depositing assets are the primary legal document that determines your recovery in bankruptcy. If the terms transfer ownership of deposited assets to the platform, you become an unsecured creditor with no property interest in specific assets. If the terms preserve your ownership and limit the platform to custodial duties, you may retain a property interest. The Celsius bankruptcy established that Earn program terms of service granted Celsius title to deposited assets, making Earn customers unsecured creditors. Courts enforce terms of service strictly. Most stakers do not read these terms before depositing, but they are legally binding and control the outcome in insolvency.
The Weekly Yield Report
You have just reviewed recovery rates from 30% to 118% across four major bankruptcies. Those outcomes reflect legal structures written into today's terms of service on platforms you may be using now.
Every Thursday: where crypto yield actually is - stablecoins, liquid staking and DeFi lending, with the risk named next to the rate and what changed since last week.
[Get it free every Thursday](#/portal/signup)
Free. No trade calls, no allocations, no hype. Unsubscribe in one click.
### Public Sale vs Launchpad vs OTC: Which Token Sale Gets You Better Terms
URL: https://altcoininvestor.com/best-way-to-buy-new-token-launch/
Last updated: 2026-10-08T21:04:00.000Z
## The Allocation Decision You Need To Make Before The Sale Opens
You have three routes into a new token before it lists on major exchanges: public sale, launchpad allocation, or OTC pre-launch deal. Each offers different entry prices, vesting schedules, and allocation certainty. The mechanics differ so much that comparing them on discount alone is misleading. I have watched institutional buyers lock in 50% discounts through OTC deals with 12-month cliffs while retail participants paid 15% above that price on a launchpad with immediate liquidity. I have also watched public sale buyers exit at 3x within 48 hours while OTC holders sat locked for another eleven months as the token fell 80%. Understanding which route matches your capital size, time horizon, and risk appetite is worth real money.
This piece compares all three channels on the factors that actually determine returns: allocation certainty, entry price and discount structure, vesting and lockup terms, minimum buy-in thresholds, and historical performance data from more than 50 launches between 2024 and 2026\. The data challenges the assumption that earlier is always better. In many cases, retail participants who bought on launchpads or public sales outperformed OTC buyers who accepted longer lockups for deeper discounts, simply because the token never recovered to the OTC entry price by the time vesting completed.
## Public Sales: Smallest Discount, Shortest Lockup, Lowest Certainty

A public sale is the final stage of a token offering before exchange listing. Tokens are sold directly to retail participants, usually through the project's website or a decentralized platform. Public sales typically offer the smallest discount to expected listing price, ranging from 5% to 20%, and carry the shortest vesting schedules. Most public sales have zero cliff or a cliff of one to three months, followed by linear vesting over 12 to 24 months. Some tokens unlock immediately at the token generation event (TGE), giving buyers instant liquidity.
Minimum buy-ins for public sales are low, commonly $100 to $2,000, making them accessible to retail participants without large capital or institutional connections. The trade-off is allocation certainty. Public sales are often oversubscribed, and allocation is determined by first-come-first-served mechanics, lottery, or pro-rata distribution based on whitelist tier. You may register, complete KYC, and still receive zero allocation or a fraction of your intended purchase.
Public sale participants generally receive better vesting terms than private or seed investors, who face 12-month cliffs and three- to four-year linear vesting. This shorter lockup period reduces exposure to prolonged bear markets and token price deterioration. However, the smaller discount means you need the token to appreciate quickly post-listing to generate meaningful returns. If the token lists flat or below your entry price, you have little margin for error.
Performance data from 2025 shows that public sale tokens face the same post-launch struggle as launchpad tokens. The majority of tokens sold to retail in 2025 traded below their issue price within three months. [Screening token fundamentals before you buy](https://altcoininvestor.com/how-to-screen-low-cap-token/) becomes critical when your entry discount is thin and your exit window is short.
## Launchpad Sales: Lottery Allocation, Mid-Range Discount, Platform Token Lock Required

A launchpad vets early-stage projects and sells their tokens to users before exchange listing, usually at a discount to expected listing price. Launchpads are operated by centralized exchanges (Binance Launchpad, Bybit Launchpad) or decentralized platforms (DAO Maker, Polkastarter). They offer mid-range discounts, typically 15% to 30% below listing price, and allocation is determined by lottery, pro-rata staking, or reputation scoring.
Access to launchpad sales requires holding or staking the platform's native token. Binance Launchpad allocates tickets based on BNB holdings: one ticket per 100 BNB held, up to a maximum of five tickets. At current prices, the minimum 100 BNB threshold represents approximately $1,700 in locked capital. Bybit allocates based on the size of MNT holdings or runs a lottery for users holding USDT. The allocation model creates a double exposure: you are betting on both the project token and the platform token's price stability during the sale period.
Allocation odds are low. [Launchpad allocation odds](https://altcoininvestor.com/how-do-crypto-launchpad-allocations-work/) range from 3% to 28% depending on the platform, oversubscription ratio, and your tier. Whales holding large amounts of platform tokens receive disproportionate allocation, while new participants with minimum stakes face lottery odds below 1%. Even when you win allocation, the amount is often a fraction of your intended investment.
Vesting schedules for launchpad tokens are stricter than public sales. A six- to 12-month cliff is common, followed by 18- to 36-month linear vesting. Some launchpads offer partial unlocks at TGE (10% to 25%), but the majority of tokens remain locked for months. This extended lockup increases your exposure to price volatility and market cycle risk.
Performance data from 2025 is sobering. Tokens launched via launchpads in 2025 left investors down 46% on average. Only six of 41 sales tracked were still above their issue price as of March 31, 2026\. Some tokens fell 97% to 98% from their sale price. The most troubling data point: 12 of 16 launchpads reviewed offered refund mechanisms, and 11 of 16 verifiable sales traded below sale price after listing. Between 60% and 95% of committed capital was refunded, clustering around 80%. This means the majority of participants recognized losses quickly and exited.
Binance Launchpad has historically outperformed other platforms. Data from 2025 shows Binance hitting a 78x ROI at peak levels, with 94% of projects achieving positive ROI at some point post-launch. Bitget's launchpad projects achieved an average historical peak return of 39x, while Bybit and Binance averaged 32.3x and 29x respectively. These peak numbers are misleading because they measure the highest point, not sustained returns or median participant outcomes. Most retail participants do not exit at peak.
The launchpad route works best for participants who already hold platform tokens for other reasons (trading fee discounts, staking yield) and can absorb the opportunity cost of locking capital for lottery-based allocation. It does not work well for participants who buy platform tokens specifically for launchpad access, because the allocation odds and token price coupling often erase the discount advantage.
## OTC Pre-Launch Deals: Deepest Discount, Longest Lockup, Institutional Access Only
OTC (over-the-counter) pre-launch deals allow accredited investors and institutions to buy tokens before public sale or listing, often at steep discounts in exchange for extended lockup periods. A typical OTC deal offers 30% to 70% discounts with vesting periods ranging from four months to 24 months. Top 20 tokens trade at nearly 50% discounts with one-year lockups, while tokens outside the top 100 trade at discounts as steep as 70%.
OTC deals guarantee allocation. If the deal closes, you receive the full amount negotiated. There is no lottery, no oversubscription, no pro-rata dilution. This certainty is valuable for large capital deployments, but it comes with strict access requirements. OTC deals target institutional investors and accredited individuals. Minimum buy-ins are typically $100,000 to $500,000 or higher. Retail participants cannot access OTC rounds unless they have direct relationships with the project team, venture funds, or OTC desks like CoinList, Republic, or Gate.io.
The vesting structure in OTC deals is negotiable but generally stricter than public sales. A four-year schedule with a one-year cliff remains the most common reference, with roughly 25% vesting at the cliff and the remainder released monthly over the following three years. Some deals allow partial unlocks at TGE (5% to 10%), but the majority of tokens remain locked for months or years.
OTC buyers face a different risk profile than public or launchpad participants. The deepest discounts come with the longest exposure to product-market fit risk, team execution risk, and market cycle risk. If the token lists, pumps, and dumps before your cliff expires, you have no ability to exit. I have watched tokens rise 10x in the first month post-listing, then fall 90% over the following six months while OTC holders remained locked. By the time their tokens unlocked, the price was below their entry point despite the original 50% discount.
Institutional buyers hedge this risk using short positions in futures markets. They open an equal-sized short on the token once it lists, offsetting price volatility while the built-in discount locks in profit once tokens unlock. Retail participants rarely have access to this hedging strategy, either because they lack the capital, the exchange access, or the risk management infrastructure to execute it properly.
The secondary OTC market allows early investors to sell locked tokens before they become tradable, but pricing on these deals reflects both the discount and the remaining lockup period. If a token is trading at $1.00 on Binance and you hold tokens with a $0.30 entry price and six months remaining on your lockup, a secondary buyer may offer you $0.50 to $0.60, allowing them to capture the discount spread while assuming the lockup risk. You exit early but give up upside. The buyer assumes the risk that the token falls further before unlock.
OTC deals work for participants with large capital, long time horizons, and the ability to hedge or diversify across multiple deals. They do not work for retail participants who need liquidity, lack hedging tools, or cannot afford to have capital locked for 12 to 48 months. [Retail traders lose while OTC buyers win](https://cointelegraph.com/magazine/retail-traders-lose-otc-token-deals-win) only when the token appreciates and holds value through the lockup period. When tokens fail, OTC buyers lose more because they are locked longer.
## Vesting Cliffs and the Price Impact You Should Expect
Vesting cliffs create predictable sell pressure. When a large percentage of the token supply unlocks simultaneously, holders who have waited months or years often sell immediately to realize gains or cut losses. This is especially true for insiders (team and early investors) whose allocations are typically 32% to 35% of total supply and vest over three to four years with a one-year cliff.
Modern token launches started with exactly 0% of insider tokens liquid at TGE. The entire insider allocation unlocked after the cliff period, creating concentrated sell pressure. Buyers who entered via public sale or launchpad with shorter lockups could exit before the cliff. Buyers who entered via OTC with cliffs aligned to insider vesting faced simultaneous unlock events and price deterioration.
Price drops of 20% to 30% at cliff expiration are common. Some tokens implement buyback programs to buffer the impact, but these are only effective if the project has revenue or treasury reserves to fund them. Tokens without revenue or poorly managed treasuries experience sharper drops. Worldcoin (WLD) fell from $11.82 in March 2024 to $0.24 in 2026, a 97% decline, despite multiple OTC raises at progressively lower prices ($5.43, $1.13, $0.27). The declining OTC prices signaled failed product-market fit, and cliff unlocks accelerated the selloff.
[Liquidity depth determines whether you can actually sell](https://altcoininvestor.com/crypto-liquidity-depth-slippage-small-cap/) at the price you see. Tokens with thin liquidity and large cliff unlocks experience slippage far worse than the nominal price drop. If the order book cannot absorb the selling volume, your exit price may be 40% to 60% below the quoted price.
## Failure Modes: When Each Route Loses Money
Public sales fail when the token lists flat or below sale price. With discounts of only 5% to 20%, you have no margin for error. If the token opens at or below your entry price, you are immediately underwater. Public sales also fail when allocation is so limited that you deploy only a fraction of your intended capital, forcing you to either accept the small position or chase the token post-listing at a higher price.
Launchpad sales fail when platform token price drops during the staking period. If you lock $1,700 worth of BNB for a Binance Launchpad sale and BNB falls 15% during the sale, you have lost $255 before receiving any allocation. If you then lose the lottery and receive zero allocation, you have locked capital and absorbed price risk for nothing. Launchpad sales also fail when the project token lists below sale price and you are locked in by vesting terms, unable to exit while the price deteriorates.
OTC deals fail when the token never recovers to your entry price by the time your lockup expires. A 50% discount is worthless if the token falls 70% between your purchase and your unlock date. OTC deals also fail when the project pivots, delays launch, or collapses during your lockup period. You have no liquidity, no exit, and no recourse. The secondary OTC market may offer a buyer, but only at a steep discount to your entry price, locking in a realized loss.
All three routes fail when the project itself fails. Product-market fit, team execution, and market timing matter more than entry price. A 70% discount on a failed project is still a 100% loss. [Screening fundamentals before you buy](https://altcoininvestor.com/how-to-screen-low-cap-token/) is the only defense against allocation into projects that never ship, never find users, or never generate revenue.
## Who Each Route Is Right For
Public sales are right for retail participants with small to mid-size capital ($100 to $10,000) who want short lockup periods and are willing to accept low allocation odds. Public sales work best when you have strong conviction in the project and want exposure without locking capital for months. They also work when you believe the token will appreciate quickly post-listing, allowing you to exit before vesting cliffs or market downturns.
Launchpad sales are right for participants who already hold platform tokens for other reasons and can absorb the opportunity cost of locking capital for lottery-based allocation. Launchpads work best on platforms with strong historical performance (Binance) and when you are diversifying across multiple launches rather than betting on a single project. Launchpads do not work for participants who buy platform tokens specifically for launchpad access, because the allocation odds, platform token price risk, and poor 2025 performance data make the expected value negative.
OTC deals are right for institutional participants with large capital ($100,000+), long time horizons (12 to 48 months), and the ability to hedge using futures or diversify across multiple deals. OTC deals work when you have direct relationships with project teams or OTC desks and can negotiate favorable terms (shorter cliffs, partial TGE unlocks, secondary exit rights). OTC deals do not work for retail participants who need liquidity, lack hedging tools, or cannot afford to lock capital for years.
## My Recommendation: Start With Public Sales, Ignore Launchpads Unless You Already Hold Platform Tokens, Avoid OTC Unless You Have Institutional Capital and Hedging Capability
The 2025 performance data is clear. Launchpad tokens left investors down 46% on average, with 11 of 16 sales trading below sale price and refund rates clustering around 80%. The allocation odds are terrible (3% to 28%), the platform token lock creates double exposure, and the vesting terms trap you in losing positions. Unless you already hold BNB, MNT, or another platform token for trading or staking and can treat launchpad allocation as a free lottery, the expected value is negative.
Public sales offer the worst discount but the shortest lockup and the most flexibility. If the token lists and pumps, you can exit immediately or within weeks. If the token lists flat or down, you can cut losses without waiting months for a vesting cliff. The low minimum buy-in ($100 to $2,000) allows you to take small positions across multiple launches, diversifying project risk without locking large capital.
OTC deals offer the deepest discounts but demand institutional capital, long lockups, and sophisticated risk management. Retail participants without hedging tools or secondary exit options should not take OTC exposure. The 50% to 70% discounts sound attractive until you watch the token fall 80% during your 12-month lockup and realize you cannot exit. Institutional buyers can hedge and diversify. Retail buyers cannot.
If you want exposure to new token launches, focus on public sales with projects you have researched thoroughly. Avoid launchpads unless you already hold platform tokens and treat allocation as a bonus, not a strategy. Avoid OTC unless you have institutional capital and the infrastructure to hedge or diversify. The data from 50+ launches shows that most retail participants who chase discounts through launchpads or OTC deals underperform participants who pay slightly higher prices in public sales but maintain liquidity and flexibility.
## The Decision Rule: Match Your Capital Size and Time Horizon to the Sale Type
If you have $500 to $5,000 and want exposure to new launches without locking capital for months, use public sales. Accept the smaller discount in exchange for shorter lockups and faster exit optionality. If you have $10,000 to $50,000 and already hold platform tokens for other reasons, treat launchpad allocation as a secondary opportunity but do not buy platform tokens specifically for access. If you have $100,000+ and can lock capital for 12 to 48 months while hedging or diversifying across multiple deals, OTC becomes viable, but only with direct access to project teams or OTC desks and only with secondary exit rights negotiated into your deal terms.
The allocation route does not determine returns. The project determines returns. The allocation route determines your entry price, lockup period, and exit flexibility. Choose the route that matches your capital size and time horizon, then spend your energy screening projects rather than chasing discounts. A 70% discount on a failed project is still a 100% loss. A 10% discount on a successful project with fast exit optionality is a better outcome than a 50% discount on a successful project with a 24-month lockup that expires after the market cycle turns.
Most retail participants overweight entry price and underweight exit flexibility. The 2025 launchpad data proves this. Participants locked capital, accepted lottery odds, held platform tokens through price drops, and still ended down 46% on average because they could not exit when the token listed below sale price. Public sale participants with smaller discounts but immediate liquidity could exit at breakeven or small losses. OTC participants with the deepest discounts are still locked, watching tokens trade 70% to 90% below their entry price with six to 18 months remaining on their vesting schedule.
The route that gets you better terms is the route that matches your capital, your time horizon, and your ability to exit when the project underperforms. For most retail participants, that route is public sales. For participants who already hold platform tokens and can treat launchpad allocation as a free lottery, launchpads remain viable but only on platforms with strong historical performance. For institutional participants with large capital and hedging capability, OTC deals offer the deepest discounts, but only when negotiated with secondary exit rights and only when diversified across multiple deals to reduce single-project risk.
## Frequently Asked Questions
### What is the main difference between public sales and launchpad allocations?
Public sales offer smaller discounts (5-20%) with shorter lockups (0-6 month cliff) but low allocation certainty. Launchpads offer mid-range discounts (15-30%) with lottery-based allocation requiring platform token stakes. Public sales have $100-$2,000 minimums while launchpads like Binance require $1,700+ in BNB locked. Public sales give faster exit flexibility while launchpads lock capital longer through both vesting and platform token exposure.
### Why do OTC deals offer such deep discounts compared to public sales?
OTC deals offer 30-70% discounts because buyers accept 12-48 month lockup periods with strict vesting cliffs. The discount compensates for illiquidity, longer exposure to project execution risk, and inability to exit during price volatility. OTC buyers also provide early capital before product-market fit is proven. Institutional buyers hedge this risk with short positions in futures markets, a strategy unavailable to most retail participants.
### How do launchpad allocation odds actually work?
Allocation odds depend on platform token holdings and oversubscription ratio. Binance allocates one ticket per 100 BNB held (max five tickets). Bybit uses MNT holdings or USDT lottery. Actual allocation odds range from 3% to 28% across platforms. Whales with large platform token stakes receive disproportionate allocation while minimum-stake participants face lottery odds below 1%. Even winning allocation often means receiving a fraction of intended investment.
### What happens to token price when vesting cliffs expire?
Vesting cliffs create concentrated sell pressure as locked tokens unlock simultaneously. Price drops of 20-30% at cliff expiration are common. Insider allocations (team and early investors) represent 32-35% of supply and typically vest over 3-4 years with 1-year cliffs. Tokens without revenue to fund buyback programs or with thin liquidity experience sharper drops. Slippage can push actual exit prices 40-60% below quoted price during high-volume unlocks.
### Should retail investors buy platform tokens specifically for launchpad access?
No. 2025 data shows launchpad tokens left investors down 46% on average, with 11 of 16 sales trading below sale price. Buying platform tokens creates double exposure: both project token risk and platform token price risk during staking period. Allocation odds are 3-28%, meaning most participants lock capital and absorb price risk for zero allocation. Launchpads only make sense if you already hold platform tokens for trading or staking.
The Weekly Yield Report
You now know which sale route matches your capital size and time horizon across fifty launches. Those odds and discount spreads will shift as the next cycle matures.
Every Thursday: where crypto yield actually is - stablecoins, liquid staking and DeFi lending, with the risk named next to the rate and what changed since last week.
[Get it free every Thursday](#/portal/signup)
Free. No trade calls, no allocations, no hype. Unsubscribe in one click.
### Airdrop Farming With Multiple Wallets: Worth The Detection Risk?
URL: https://altcoininvestor.com/airdrop-farming-multiple-wallets-worth-it/
Last updated: 2026-10-08T17:06:03.000Z
## What Multi-Wallet Airdrop Farming Actually Accomplishes
Airdrop farming with multiple wallets attempts to multiply your eligibility by running qualifying activities across ten or twenty or fifty separate addresses. If one wallet earns $500 in tokens, the thinking goes, ten wallets earn $5,000\. The strategy worked in 2022 and 2023 when airdrops were simple wallet snapshots and Sybil detection was rudimentary. In 2026, it fails for most operators because protocols now deploy graph analysis that traces funding sources, behavioral clusters, and temporal patterns across entire wallet groups. LayerZero disqualified 803,000 addresses in its June 2024 airdrop using on-chain cluster analysis. Arbitrum filtered 427,923 wallets. Modern airdrops disqualify roughly 40% of claimants before tokens go out, and multi-wallet farming is the primary target of that filtering.
The income opportunity still exists, but the economics changed. You are now optimizing for detection evasion rather than for simple volume multiplication. That shift determines whether the strategy pencils out.
## The Actual Cost Basis For Running Multiple Wallets
Gas fees are not the barrier they were in 2021\. As of May 2026, Ethereum mainnet standard gas runs around 0.15 gwei, with a basic ETH transfer costing $0.025 and a DEX swap costing approximately $0.21\. Layer 2 networks make the cost structure even lower. Arbitrum averages $0.08 per transaction, Optimism $0.12, Base $0.02\. If you are running ten wallets through six months of qualifying activity on Arbitrum and each wallet completes 50 transactions, your total gas cost is $40\. That is negligible.
The real cost is bridging. Official Ethereum-to-Layer-2 bridges charge $15 to $30 depending on mainnet congestion. Third-party bridges like Symbiosis charge a flat $0.45 per transaction regardless of size. For ten wallets, bridging $100 to each costs $150 to $300 if you use official bridges, or $4.50 if you use third-party alternatives. The spread matters at scale.
Time cost is the actual barrier. Running ten wallets through qualifying activities for protocols like zkSync, Arbitrum, or Linea requires you to complete swaps, liquidity provisions, governance votes, or testnet interactions on each wallet separately. If qualifying for one airdrop on one wallet takes two hours per week over six months, ten wallets cost twenty hours per week. At a $25 hourly opportunity cost, that is $500 per week, or $13,000 over six months. Most farmers do not account for this cost when calculating breakeven thresholds. You should.
### Capital Requirements
You need working capital in each wallet. Most protocols now filter wallets with less than 90 days of on-chain activity and minimum transaction volume thresholds. If you fund ten wallets with $100 each, you have $1,000 locked in farming activity for six months. If you fund them with $500 each, you have $5,000 locked. That capital is not earning yield elsewhere. The opportunity cost of locking $5,000 in airdrop farming instead of deploying it into Aave or Morpho at 4% to 8% is $100 to $200 over six months. Add that to your cost basis.
A conservative six-month multi-wallet strategy with ten wallets costs:
- $40 in gas fees on Layer 2
- $5 to $300 in bridging costs depending on method
- $100 to $200 in opportunity cost on locked capital
- $13,000 in time cost if you value your labor at $25/hour
Total: $13,145 to $13,540\. Your expected return needs to exceed that for the strategy to be worth running.
## How Protocols Detect And Disqualify Multi-Wallet Farms
Sybil detection in 2026 is a graph analysis problem, not a wallet inspection problem. Protocols do not look at individual addresses and decide whether they are real or fake. They build graphs of funding flows, transaction sequences, temporal correlations, and behavioral clusters, then assign scores to wallets based on how closely they resemble coordinated activity. Wallets that score above certain thresholds get filtered before token distribution.
The most common detection vectors:
### Funding Source Clustering
If you withdraw 0.1 ETH from Binance and send it to ten wallets in identical amounts within a ten-minute window, the graph links those wallets immediately. The pattern is visible on-chain and does not require any off-chain data. One of the easiest ways to trigger disqualification is funding multiple wallets from the exact same source in the exact same amounts. Advanced clustering algorithms trace not just the immediate funding transaction but the entire funding graph. If Wallet A, Wallet B, and Wallet C all received funds from Address X, and Address X received funds from Binance in a single withdrawal, the system groups A, B, and C together.
### Behavioral Sequence Matching
If ten wallets complete the exact same sequence of transactions in the exact same order within hours of each other, the protocol flags them. Swap 0.05 ETH for USDC on Uniswap, provide liquidity to a specific pool, withdraw after 48 hours, bridge to Arbitrum, repeat. That sequence, executed identically across ten wallets, is a detection signal. Protocols now track transaction sequences and temporal correlation at scale. [Graph analysis research from 2024](https://arxiv.org/pdf/2407.01176) shows that clustering algorithms can link wallets with 95% accuracy based purely on on-chain behavioral patterns.
### IP And Browser Fingerprinting
Many airdrop qualification systems require you to connect your wallet to a web interface to claim points, vote in governance, or interact with a dApp. When you connect, the system logs your IP address, browser fingerprint, timezone, language settings, and screen resolution. If ten wallets connect from the same IP address with matching fingerprints, the system groups them. Using a VPN does not defeat this entirely. If you rotate VPN servers but maintain the same browser fingerprint, the system still groups you. If you use separate browsers or devices but connect from the same IP, the system still groups you. Full operational separation requires different devices, different networks, and different interaction times. That is operationally difficult to sustain over six months.
### Temporal Correlation
If ten wallets bridge to Arbitrum within the same hour, complete swaps within the same hour, and withdraw within the same hour, the protocol flags them even if the exact transaction details differ. Temporal clustering does not require identical transactions. It requires correlated timing. The fix is to space activities across days or weeks, but that multiplies the time cost significantly.
Detection does not require proving you are the same person. It requires proving the wallets behave as a coordinated group. That is a much lower bar, and modern clustering techniques clear it easily.
## When The Strategy Breaks Even And When It Fails
Among analyzed airdrop farming groups in 2024 and 2025, 69.3% exhibited positive net profit, but the average per-address reward did not exceed $200, with the highest expected return below $350\. If you run ten wallets and each earns $200, your gross return is $2,000\. Subtract $13,500 in costs and you are $11,500 in the red. The strategy fails unless your per-wallet return exceeds $1,350, and that return level is rare.
Successful farmers in 2024 and 2025 earned $600 to $35,000+ per project, but those figures represent the top quartile of outcomes and often reflect early participation in high-value airdrops like Arbitrum, Optimism, and Blur. The median outcome is far lower. Additionally, 88% of airdropped tokens lose value within three months of distribution. If you farm an airdrop that allocates $500 per wallet but the token dumps 70% before you can sell, your actual return is $150 per wallet, not $500\. Multiply that across ten wallets and you have $1,500 gross, still well below breakeven.
### The Detection Failure Mode
The catastrophic risk is total disqualification. If the protocol flags your wallet cluster, you receive zero tokens across all wallets. Your $13,500 in costs returns nothing. This is not a theoretical risk. It is the default outcome for 85% of multi-wallet farms in 2026 according to industry analysis. Protocols now run Sybil filtering as standard practice, and the filtering targets multi-wallet operators specifically.
### Where Multi-Wallet Strategy Still Works
The strategy works when you have genuinely independent wallets operated by separate people with separate funding sources, separate devices, separate networks, and separate behavioral patterns. If you and a spouse each run a wallet independently, funded from separate exchange accounts, transacting at different times, using different devices, that is not Sybil farming. That is two independent users. Protocols do not prohibit using multiple wallets outright. They prohibit coordinated, artificial activity designed only to farm rewards.
The strategy also works when the airdrop has low or no Sybil filtering, but those airdrops are increasingly rare and tend to distribute low-value tokens. You can farm ten wallets for a project that does not filter and receive $50 per wallet, but $500 total return against $13,500 in costs is still a loss.
## Single-Wallet Strategy As The Realistic Alternative
The alternative is running a single wallet through high-quality qualifying activities. Focus on depth rather than breadth. Engage with governance, provide liquidity, complete testnet interactions, hold positions for 90+ days, and demonstrate real protocol usage rather than farming behavior. A single wallet with deep, sustained activity scores higher in most allocation formulas than ten wallets with shallow, scripted activity.
The cost basis for single-wallet farming is dramatically lower. Gas fees on Layer 2 for six months of activity run $10 to $20\. Bridging costs $3 to $30 depending on method. Time cost is two hours per week, or $1,300 over six months at $25/hour opportunity cost. Capital lockup on $500 costs $10 to $20 in foregone yield. Total cost: $1,323 to $1,370\. Your breakeven threshold is $1,400, not $13,500\. That difference is the entire strategy.
Single-wallet returns in 2024 ranged from $0 to $5,000 depending on the project and the depth of your qualifying activity. Arbitrum allocated $1,250 to wallets that met minimum thresholds, with higher allocations for governance participants and long-term liquidity providers. Optimism allocated $400 to $2,000 depending on activity depth. [Earning airdrops without triggering detection](https://altcoininvestor.com/how-to-earn-crypto-airdrops/) requires months of sustained protocol interaction, strict gas cost accounting, and behavior patterns that resemble real users rather than farmers.
## Detection Evasion Techniques And Why They Fail
Some operators attempt to defeat detection by funding wallets from different exchanges, using separate VPNs for each wallet, spacing transactions across days, and randomizing transaction amounts. These techniques reduce detection probability but do not eliminate it. Funding from different exchanges still produces a traceable graph if you withdraw from Binance to Wallet A and from Coinbase to Wallet B but both wallets interact with the same liquidity pool at correlated times. The protocol does not need to prove common ownership. It needs to prove behavioral coordination.
Spacing transactions across days reduces temporal correlation but increases time cost proportionally. If you space ten wallets across ten days instead of completing activities in parallel, your time cost doubles or triples. The strategy becomes even less profitable.
Using separate devices and networks for each wallet eliminates IP and fingerprint clustering but requires you to maintain ten separate operational environments. That is feasible for professional farming operations with dedicated infrastructure, but not for individual operators treating airdrop farming as supplementary income.
## The Realistic Breakeven Threshold For Multi-Wallet Farming In 2026
For multi-wallet farming to break even in 2026, you need:
- Per-wallet allocation exceeding $1,350
- Zero disqualification risk across your wallet cluster
- Token price stability post-distribution
- Six months of sustained, separated activity across all wallets
That combination is rare. Most airdrops allocate $200 to $500 per wallet. Most filtering systems disqualify 40% of coordinated wallet clusters. Most tokens lose 88% of their value within three months. The realistic expected value of multi-wallet farming in 2026 is negative for 85% of operators.
The strategy made sense when airdrops were simple snapshots and detection was rudimentary. It does not make sense now. Single-wallet farming with deep, sustained activity produces higher risk-adjusted returns at one-tenth the cost basis. That is the actual economics.
## What To Do If You Are Already Running Multiple Wallets
If you have already funded and operated multiple wallets for several months, your sunk cost is real but your forward decision should ignore it. Evaluate whether continued operation increases your expected return or simply locks in additional costs. If your wallets are already grouped by funding source or behavioral pattern, additional activity will not un-group them. The detection has already occurred. Your best move may be to consolidate activity into your highest-quality wallet and abandon the rest.
If your wallets remain operationally separated with genuinely independent funding sources, different devices, and uncorrelated transaction timing, continued operation may still be rational. Evaluate the per-wallet expected return against the incremental time and capital cost. If the math works, continue. If it does not, stop.
Do not throw good money after bad. The fact that you have already spent $5,000 on a strategy does not mean spending another $5,000 improves your outcome. Evaluate forward expected value only.
## The Takeaway
Multi-wallet airdrop farming in 2026 requires per-wallet returns exceeding $1,350 to break even after accounting for time, capital lockup, and bridging costs. Detection systems now disqualify 40% of coordinated wallet clusters using funding graph analysis, behavioral clustering, and temporal correlation. The strategy that worked in 2022 fails now for 85% of operators. Single-wallet farming with deep protocol engagement delivers higher risk-adjusted returns at one-tenth the cost. Run one wallet well, or run ten wallets independently with full operational separation. Anything in between loses money.
## Frequently Asked Questions
### Does using multiple wallets for airdrops actually increase your allocation?
In theory, yes. Running ten wallets through qualifying activities multiplies your eligibility if each wallet receives an allocation. In practice, protocols now disqualify roughly 40% of coordinated wallet clusters using on-chain graph analysis that traces funding sources, transaction timing, and behavioral patterns. If your wallets get flagged as a Sybil farm, you receive zero tokens across all wallets. The strategy worked in 2022 when detection was rudimentary. It fails for 85% of multi-wallet operators in 2026.
### What is the actual cost of running ten wallets for six months of airdrop farming?
Gas fees on Layer 2 run approximately $40 for ten wallets over six months. Bridging costs $5 to $300 depending on whether you use third-party bridges or official Ethereum-to-L2 bridges. Opportunity cost on $5,000 locked capital is $100 to $200 in foregone yield. Time cost at two hours per week per wallet over six months is roughly $13,000 if you value your labor at $25 per hour. Total: $13,145 to $13,540\. Most operators ignore time cost and drastically underestimate breakeven thresholds.
### How do protocols actually detect multi-wallet Sybil farms?
Protocols use graph analysis to trace funding sources, transaction sequences, temporal correlations, and behavioral clusters. If ten wallets receive funds from the same exchange withdrawal in identical amounts, the system groups them. If wallets complete the same transaction sequences at correlated times, the system flags them. IP clustering and browser fingerprinting add off-chain signals when you connect wallets to dApp interfaces. Detection does not require proving common ownership. It requires proving coordinated behavior, which on-chain clustering algorithms detect with 95% accuracy.
### What is the realistic breakeven threshold for multi-wallet airdrop farming in 2026?
You need per-wallet allocations exceeding $1,350 to break even after accounting for gas, bridging, capital lockup, and time costs. Most airdrops allocate $200 to $500 per wallet, and 88% of tokens lose value within three months of distribution. Additionally, 40% of coordinated wallet clusters get disqualified entirely, resulting in zero return. Single-wallet farming breaks even at $1,400 in total return because time and capital costs are ten times lower. The economics favor depth over breadth.
### Can you avoid detection by using different exchanges, VPNs, and spacing transactions?
Partial evasion is possible but operationally expensive. Funding wallets from different exchanges reduces direct clustering but does not eliminate it if wallets interact with the same protocols at correlated times. Using separate VPNs and devices for each wallet eliminates IP and fingerprint clustering but requires maintaining ten independent operational environments. Spacing transactions across days reduces temporal correlation but doubles or triples time cost. Full separation is feasible for professional operations with dedicated infrastructure, but most individual farmers cannot sustain it profitably over six months.
Tool mentioned above
Ledger
Ledger devices display the full transaction on their own screen before you approve it, which is what stops an approval exploit at the point it matters.
[See Ledger devices](https://shop.ledger.com/?r=90612ff43561)
We may earn a commission if you sign up through this link, at no cost to you. It does not change what gets recommended.
The Weekly Yield Report
You now have the breakeven math for ten wallets and the five clustering methods that disqualify 40% of them. Those detection techniques will improve next quarter.
Every Thursday: where crypto yield actually is - stablecoins, liquid staking and DeFi lending, with the risk named next to the rate and what changed since last week.
[Get it free every Thursday](#/portal/signup)
Free. No trade calls, no allocations, no hype. Unsubscribe in one click.
### What Is Staking? How It Works And What It Pays
URL: https://altcoininvestor.com/what-is-crypto-staking/
Last updated: 2026-10-08T15:05:23.000Z
## What Staking Is And Why Networks Pay For It
Staking is the process of locking crypto assets to validate transactions on a proof-of-stake blockchain. Validators commit tokens as economic collateral, propose or confirm blocks, and earn rewards for honest behavior.
The network pays validators because it needs them. Without validators, there is no consensus mechanism and no functioning blockchain. Proof-of-stake replaced energy-intensive mining with an economic security model. Instead of competing to solve computational puzzles, validators put capital at risk. If they behave dishonestly, they lose that capital through a mechanism called slashing.
Rewards come from two sources. First, newly minted tokens issued by the protocol. Second, transaction fees paid by users. On Ethereum, validators also earn MEV (maximal extractable value), which is revenue extracted from transaction ordering and priority fees within each block.
As of mid-2026, roughly 39 million ETH is staked across more than 900,000 active validators, representing about 32% of total supply. That capital secures the network. The protocol compensates stakers with a base APR of 2.78%, plus MEV that can add another 0.5% to 1% for validators running MEV-Boost. The all-in yield sits between 3.3% and 3.8% for well-operated nodes.
## How Validators Get Chosen And What They Do
Validators are selected to propose blocks based on how much they have staked, how long they have held that stake, and a degree of randomization built into the proof-of-stake algorithm. A higher stake increases the probability of selection, but does not guarantee it.
Once chosen, the validator proposes a new block of transactions. Other validators then attest to its validity. If the majority agrees, the block is added to the chain and the validator earns a reward. If the validator proposes an invalid block or signs conflicting blocks, the network penalizes them.
To run a validator yourself on Ethereum, you need exactly 32 ETH. That minimum has not changed since the Merge in September 2022\. You also need hardware capable of running a node 24/7, a stable internet connection, and the technical knowledge to maintain uptime and avoid slashable offenses.
If you lack the capital or the technical skill, you can delegate. Delegation means assigning your stake to an existing validator who does the work on your behalf. You earn a portion of their rewards, minus a commission. Solana offers delegation with no minimum staking requirement. Cosmos and Polkadot operate similarly. The validator handles infrastructure. You handle capital allocation.
Delegation is the most common staking method. Solo validation is rare outside of institutional operators.
## Where The Yield Actually Comes From

Staking rewards are not magic. They are the sum of protocol issuance and fee revenue. Understanding the composition matters because it determines whether the yield is real or inflated by dilution.
Ethereum issues new ETH to validators at a rate calibrated to the total amount staked. As of 2026, with 32% of supply staked, issuance contributes roughly 2.3% to 2.5% of the gross APR. Transaction fees and MEV contribute the remainder. Ethereum's fee burn mechanism offsets some issuance, making net inflation around 0.5% annually. The yield you earn is not fully eaten by dilution.
Solana pays around 7% to 8% APY, but inflates supply at roughly 5% per year. Your real yield is closer to 2% to 3% after accounting for the dilutive effect of new token issuance. Cosmos pays 19.5% on ATOM, but inflates at 12%. Real yield is 7.5%.
The distinction between nominal APY and real yield is the difference between earning income and treading water. If a network prints 10% new tokens per year and pays stakers 10%, you are not earning anything. You are maintaining proportional ownership. [Crypto Staking Returns: Where Yield Comes From And What It Costs](https://altcoininvestor.com/crypto-staking-returns-across-chains/) walks through the inflation math for major chains.
Ethereum and Cardano offer the best combination of real yield and low dilution. Solana and Polkadot offer higher nominal yields but with more inflation. Cosmos offers the highest nominal yield and the highest inflation.
## What Slashing Is And When It Happens
Slashing is the protocol's enforcement mechanism. When a validator breaks consensus rules, the network burns a portion of their staked tokens and ejects them from the validator set. If you delegated to that validator, you lose tokens too.
There are three slashable offenses on Ethereum. Double signing is the most severe. It occurs when a validator signs two different blocks at the same height, creating ambiguity about which version of the chain is valid. The network treats this as an attempt to fork the chain and penalizes it aggressively.
Surround voting is the second offense. It happens when a validator attests to two conflicting checkpoint votes in a way that could rewrite finalized history. This is also treated as malicious behavior.
Extended downtime is the third. If a validator remains offline for long enough, it incurs inactivity penalties that compound over time. While not technically slashing in the same sense as double signing, prolonged downtime can result in meaningful losses.
The initial penalty for an isolated slashing event on Ethereum is roughly 1/4096 of the validator's stake, or about 0.0078 ETH on a 32 ETH position. But on Day 18 of the 36-day exit period, the validator receives a correlation penalty that scales with how many other validators were slashed around the same time. If you are the only one slashed, total losses might be 0.5 to 1 ETH. If hundreds of validators are slashed simultaneously, losses can exceed 50% of stake.
On networks like Cosmos, slashing penalties can reach 5% or more of bonded stake for a single infraction. The penalty structure varies by chain, but the logic is universal. The network must make misbehavior more expensive than the potential profit from attacking it.
Slashing risk is why validator selection matters. If you delegate to an operator with poor infrastructure or a history of downtime, you absorb that risk. If you run your own validator and misconfigure your setup, you absorb it directly.
## Lockup Periods And Why Liquidity Disappears
When you stake, your tokens are locked. You cannot sell them, transfer them, or use them in DeFi. The lockup period varies by network.
Ethereum requires a validator exit queue. As of mid-2026, the exit period is approximately 36 days from the moment you signal intent to withdraw. If the queue is congested, the wait extends. In May 2026, the entry queue held 3.6 million ETH with a 62-day wait. Exit queues function similarly under high demand.
Cosmos has an unbonding period of 21 days. Polkadot requires 28 days. Solana requires several epochs, which translates to roughly 2 to 3 days. The purpose of these delays is to give the network time to finalize slashing penalties and prevent validators from exiting immediately after misbehaving.
Lockup is a real cost. If the market moves against you during the unbonding period, you have no exit. If a DeFi opportunity appears, you cannot participate. If you need liquidity for an emergency, you are stuck. That cost is not reflected in APY calculations.
Liquid staking was designed to solve this problem.
## Liquid Staking And The Trade-Offs It Introduces
Liquid staking lets you earn staking rewards while maintaining liquidity. When you stake ETH through Lido, you receive stETH, a tokenized claim on your staked position. The stETH continues to accrue staking rewards, but you can trade it, lend it, or use it as collateral in DeFi protocols.
The advantage is obvious. You earn 3% to 4% on staked ETH and simultaneously deploy that capital to earn additional yield in lending markets or liquidity pools. Traditional staking forces you to choose between income and liquidity. Liquid staking offers both.
But it introduces new risks. Smart contract risk is the first. A bug or exploit in Lido's contracts can result in total loss, regardless of how well Ethereum's consensus layer performs. De-peg risk is the second. In stressed markets, holders rushing to exit can push stETH's market price below the value of the underlying stake. In July 2025, stETH traded at a 7% discount to ETH during a period of high redemption demand. If you need to exit at that moment, you lose 7% instantly.
Protocol governance risk is the third. Lido's fee structure, validator selection, and upgrade decisions are controlled by token holders. If governance makes poor decisions, you have no recourse. Traditional staking avoids this layer entirely.
Lido currently holds around 28% of all staked ETH, making it the dominant liquid staking protocol by a wide margin. Its annual fee is 10% of staking rewards, leaving depositors with a net APR of roughly 2.5% to 3%. Centralized exchanges like Coinbase, Kraken, and Binance take 25% or more, pushing net yields toward 2.5% to 3% as well. [Best Places To Stake Crypto (With Real Yields)](https://altcoininvestor.com/best-places-stake-crypto-real-yields/) compares net returns across providers.
Liquid staking suits people who will actively use the capital in DeFi. Traditional staking suits holders who plan to sit through an unbonding period without needing access.
## What You Earn Right Now On Major Chains
Ethereum offers 2.78% base staking APR plus 0.5% to 1% from MEV, for a total of 3.3% to 3.8%. After Lido's 10% fee, net yield is 2.5% to 3%. After exchange fees of 25% or more, net yield is similar. Solo validators keep the full amount but need 32 ETH and technical infrastructure.
Solana pays 7% to 8% APY with no minimum and simple delegation from any compatible wallet. Inflation runs around 5%, so real yield is 2% to 3%. Solana is the easiest major chain to stake on. Delegation takes two clicks and unbonding is measured in days, not weeks.
Cardano pays 2.2% APY. Inflation is minimal. The yield is real but low. Cardano staking involves no lockup and no slashing, making it the safest entry point for risk-averse holders.
Polkadot pays 10% to 14% APY with a minimum of 1 DOT. Unbonding takes 28 days. Inflation offsets a portion of the nominal yield, but real returns remain in the 5% to 8% range depending on the year.
Cosmos pays 19.5% APY on ATOM. Inflation is 12%. Real yield is 7.5%, the highest among established proof-of-stake networks. Unbonding takes 21 days. Validator selection matters more on Cosmos than on most chains because of the higher slashing penalties.
Yield compression is the trend. As more capital enters staking, rewards spread thinner. Ethereum's yield was above 5% in early 2023\. It is now below 4%. Solana's yield was above 10% in 2022\. It is now below 8%. This trend will continue as networks mature and institutional capital floods into the asset class.
## When Staking Makes Sense And When To Stay Liquid
Staking makes sense when you plan to hold the asset for longer than the unbonding period and you have no immediate use for the capital. If your time horizon is six months and the unbonding period is 36 days, staking makes sense. If your time horizon is three weeks, it does not.
Staking makes sense when the real yield exceeds inflation and opportunity cost. Ethereum's 3% real yield beats holding cash in most environments. It does not beat lending stablecoins at 8% or providing liquidity on high-volume pairs at 15%. The decision is relative, not absolute.
Staking makes sense when you can afford to lock capital through a market downturn. If staked ETH drops 30% and you are stuck in an unbonding queue, you have no exit. If that scenario would force you to capitulate at the bottom, do not stake.
Stay liquid if you are actively trading. Stay liquid if you are deploying capital into DeFi strategies with higher expected returns. Stay liquid if you cannot stomach the idea of watching an asset fall while locked. Stay liquid if you are unsure of your time horizon.
Liquid staking splits the difference, but only for people who understand the additional risks and are comfortable managing them. If you do not know what a de-peg event is or how smart contract risk works, stick with traditional staking or stay entirely liquid. [What Are Liquid Staking Tokens? A Beginner's Guide](https://altcoininvestor.com/what-are-liquid-staking-tokens-beginner-guide/) covers the mechanics and risks in detail.
## The Safest First Staking Position
If you are staking for the first time, start with Cardano or Ethereum. Cardano offers the simplest risk profile. No slashing, no lockup, straightforward delegation through any ADA wallet. The yield is low at 2.2%, but the learning curve is minimal and the downside risk is limited to price movement.
Ethereum offers higher yield at 3% to 4% but introduces lockup, slashing, and either the technical complexity of solo validation or the counterparty risk of exchanges and liquid staking protocols. If you go the Ethereum route, use Lido or Rocket Pool rather than a centralized exchange. The fee difference is meaningful and you retain more control.
Solana is a reasonable second position once you understand delegation mechanics. The 7% to 8% nominal yield is attractive, the unbonding period is short, and delegation is straightforward. Validator selection matters. Choose validators with high uptime and low commission.
Avoid Cosmos and Polkadot until you have staked successfully on at least one other chain. The slashing penalties are higher and the validator selection process requires more diligence. The yields are attractive, but the risks are not suitable for beginners.
Avoid anything advertising double-digit yields unless you can explain exactly where that yield comes from and how much is real versus inflationary. High yields are not free. They are compensation for risk, dilution, or both.
## Common Staking Methods And What They Cost
Solo validation gives you full control and full rewards, but requires 32 ETH, hardware, technical knowledge, and constant uptime. If you meet those requirements, solo validation is the most economically efficient option. Most retail holders do not meet those requirements.
Delegated staking is the most common method. You assign your stake to a validator, they handle infrastructure, and you pay a commission that typically ranges from 5% to 15% of gross rewards. On Solana, Cosmos, and Polkadot, delegation is native to the protocol and happens through your wallet.
Pooled staking aggregates small holdings to meet minimum thresholds. Rocket Pool allows ETH holders with less than 32 ETH to participate in Ethereum staking by pooling capital with others. The pool runs validators collectively. You earn proportional rewards minus a pool fee.
Exchange staking is the simplest but most expensive. Coinbase, Kraken, and Binance handle everything. You deposit tokens, they stake them, and you receive net rewards after the exchange takes 25% to 35%. The convenience costs you one-quarter to one-third of gross yield. For small positions, that cost may be acceptable. For large positions, it is not.
Liquid staking gives you a tokenized claim on staked assets. Lido charges 10%. Rocket Pool charges slightly less. You can trade the liquid staking token or use it in DeFi, but you absorb smart contract risk and de-peg risk in exchange for that flexibility.
The right method depends on position size, risk tolerance, and whether you plan to use the capital elsewhere. [Staking Rewards Explained: How They're Calculated And What Reduces Your Actual Return](https://altcoininvestor.com/staking-rewards-explained-calculation-reductions/) covers the fee structures in detail.
## What Can Go Wrong Beyond Slashing
Slashing is the most visible risk, but not the only one. Validator downtime results in missed rewards and, if prolonged, inactivity penalties. On Ethereum, a validator that goes offline for a single epoch misses attestation rewards for that period. If it stays offline for days, penalties compound.
Exchange custody risk is real. When you stake on Coinbase or Kraken, you do not control the keys. If the exchange freezes withdrawals, files for bankruptcy, or suffers a regulatory action, your staked tokens are stuck. FTX held billions in customer deposits when it collapsed in November 2022\. Staked assets were part of that total.
Regulatory risk is rising. The SEC has argued that certain staking-as-a-service offerings constitute unregistered securities. In February 2023, Kraken settled with the SEC and agreed to shut down its U.S. staking program. Coinbase continues to offer staking but faces ongoing litigation. The legal landscape is unsettled.
Protocol risk means the blockchain itself can fail. Luna's collapse in May 2022 wiped out billions in staked assets. The staking yield was irrelevant when the underlying token went to zero. Diversification across chains limits this risk but does not eliminate it.
Opportunity cost is the most overlooked risk. If you lock capital in staking at 4% and miss a DeFi opportunity paying 12%, you lost 8% by sitting still. The lockup period magnifies this risk because you cannot reallocate when conditions change.
## The Takeaway
Staking pays you to secure a network by locking tokens and validating transactions. Yields range from 2% on Cardano to 19% on Cosmos, but you must subtract inflation, fees, and lockup costs to calculate real return. Ethereum and Cardano offer the safest entry points. Solana offers the easiest delegation. Liquid staking adds flexibility but introduces smart contract and de-peg risk. Slashing, lockups, and opportunity cost are real, not theoretical. The decision to stake is a tradeoff between yield, liquidity, and risk. Most beginners overweight yield and underweight the cost of being locked during volatility. Start small, use native delegation, and avoid anything promising double-digit returns without clear fee and inflation breakdowns.
## Frequently Asked Questions
### How much can you realistically earn from staking crypto?
Ethereum pays 3-4% after fees, Solana pays 7-8% with 5% inflation, and Cardano pays 2.2% with minimal inflation. Real yields after accounting for token dilution range from 2% to 7.5% on established chains. Exchange fees of 25-35% reduce net returns significantly. Solo validators keep full rewards but need 32 ETH for Ethereum and technical infrastructure. Liquid staking protocols like Lido charge 10% and introduce additional smart contract risk.
### What is slashing and how much can you lose?
Slashing is the network penalty for validator misbehavior like double signing or extended downtime. On Ethereum, an isolated slashing event costs 0.5-1 ETH from a 32 ETH stake, but correlation penalties can exceed 50% if many validators are slashed simultaneously. Cosmos imposes 5% or more for infractions. If you delegate to a validator that gets slashed, you lose tokens proportionally. Slashing risk is why validator selection matters.
### Can you unstake your crypto anytime?
No. Ethereum requires a 36-day exit queue. Cosmos requires 21 days unbonding. Polkadot requires 28 days. Solana requires 2-3 days. During the lockup period you cannot sell, transfer, or use tokens. If the market drops 30% while you are locked, you have no exit. Cardano is the exception with no lockup, but yields only 2.2%. Liquid staking tokens trade freely but can depeg during stress.
### Is liquid staking safer than regular staking?
No, liquid staking adds risk. You get a tradable token like stETH while earning staking rewards, but smart contract bugs can cause total loss regardless of how Ethereum performs. De-peg risk means stETH can trade below ETH during market stress, as it did at a 7% discount in July 2025\. Protocol governance decisions are outside your control. Traditional staking avoids these layers but locks your capital. Liquid staking suits active DeFi users, not passive holders.
### What is the safest crypto to stake for beginners?
Cardano offers the simplest first position with 2.2% yield, no slashing, no lockup, and straightforward delegation through any ADA wallet. Ethereum offers higher yield at 3-4% but requires choosing between solo validation with 32 ETH, exchange custody with 25-35% fees, or liquid staking with smart contract risk. Solana is a reasonable second position with 7-8% yield, easy delegation, and short unbonding. Avoid Cosmos and Polkadot until you understand validator selection and slashing mechanics.
The Weekly Yield Report
You just saw yield ranges from 2.2% to 19.5% across five chains, fee structures that take 10% to 35%, and slashing penalties from 0.5 ETH to total loss. Those numbers will change next quarter.
Every Thursday: where crypto yield actually is - stablecoins, liquid staking and DeFi lending, with the risk named next to the rate and what changed since last week.
[Get it free every Thursday](#/portal/signup)
Free. No trade calls, no allocations, no hype. Unsubscribe in one click.
### Weekly Yield Report: 8 October 2026
URL: https://altcoininvestor.com/weekly-yield-report-8-october-2026/
Last updated: 2026-10-08T15:01:44.000Z
Compound V3 USDC on Ethereum is paying 6.87% base yield as of 8 October 2026, the highest rate among established stablecoin lending protocols this week. That is 2.88 percentage points above Aave V3 USDC and carries $34 million in total value locked after 1,456 days of operational history. Four new venues entered the dataset this week, including Jupiter on Solana and a Uniswap V3 BTC-USDT pool showing 25.54% yield with full impermanent loss risk.
## Stablecoin Yields
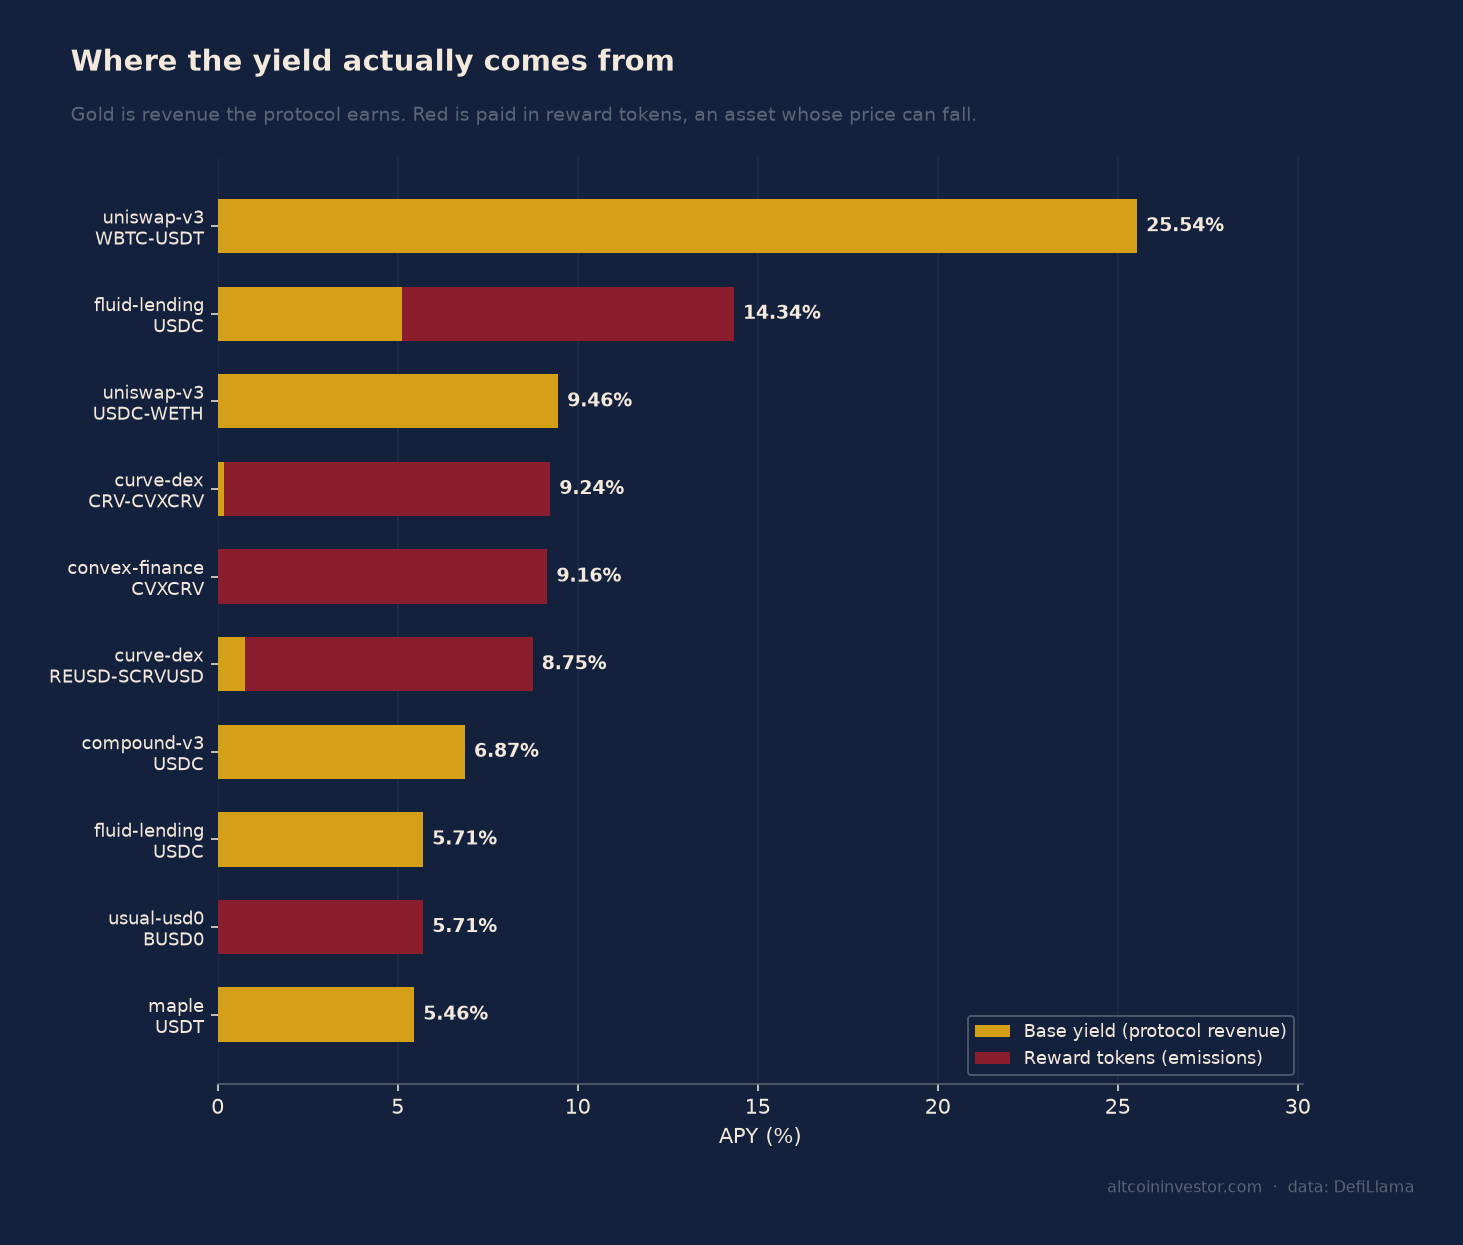
The core stablecoin lending venues as of 8 October 2026 are clustered between 3.72% and 6.87%. Sky Lending SUSDS on Ethereum and Arbitrum is paying [3.8% across $5,278 million in TVL](https://defillama.com/yields/pool/d8c4eff5-c8a9-46fc-a888-057c4c668e72), backed by 594 days of history. Spark Savings offers 3.75% on USDT, 3.8% on USDS, and 3.8% on USDC across Ethereum, Arbitrum, and Base. [Aave V3 USDC](https://defillama.com/yields/pool/aa70268e-4b52-42bf-a116-608b370f9501) is at 3.99% across Ethereum, Arbitrum, Base, and Polygon with $251 million deposited. Aave V3 USDT on Ethereum sits at 3.72% with $227 million TVL. Aave V3 SGHO on Ethereum offers 4.5% with $173 million locked and 145 days of operational data.
Sparklend DAI on Ethereum pays 2.85% with $75 million TVL and 844 days of history. The outlier is [Compound V3 USDC on Ethereum at 6.87%](https://defillama.com/yields/pool/7da72d09-56ca-4ec5-a45f-59114353e487), though it carries only $34 million in deposits. Compound V3 USDT on Ethereum is at 3.23% with $17 million TVL.
Several stablecoin venues require mechanism disclosure. Ethena sUSDe on Ethereum is paying 5.44% with $1,223 million TVL. That yield is funding-rate dependent and can go negative in a bear market. Sparklend USDS on Ethereum offers 4.57%, but 100% of that APY comes from reward token emissions rather than protocol revenue, with $983 million deposited. Morpho Blue vaults GTUSDCP and STEAKUSDC on Base and Ethereum are both at 4.42% with $708 million and $584 million TVL respectively. Risk parameters in Morpho vaults are set by the curator, not the protocol.
[Jupiter Lend USDC on Solana](https://defillama.com/yields/pool/d783c8df-e2ed-44b4-8317-161ccc1b5f06) is paying 4.15%, composed of 3.81% base and 0.34% rewards, with $534 million locked. Solana carries a different chain risk profile to Ethereum. Fluid Lending USDC across Ethereum, Arbitrum, and Base is at 5.71% with $202 million TVL. Fluid is a newer lending design with a shorter track record than Aave. Sky Lending sDAI on Ethereum pays 1.25% with $201 million TVL and 1,399 days of history. Sky Lending USDS on Ethereum offers 5.62%, entirely from emissions, with $165 million deposited.
## Tokenised Treasuries And Credit
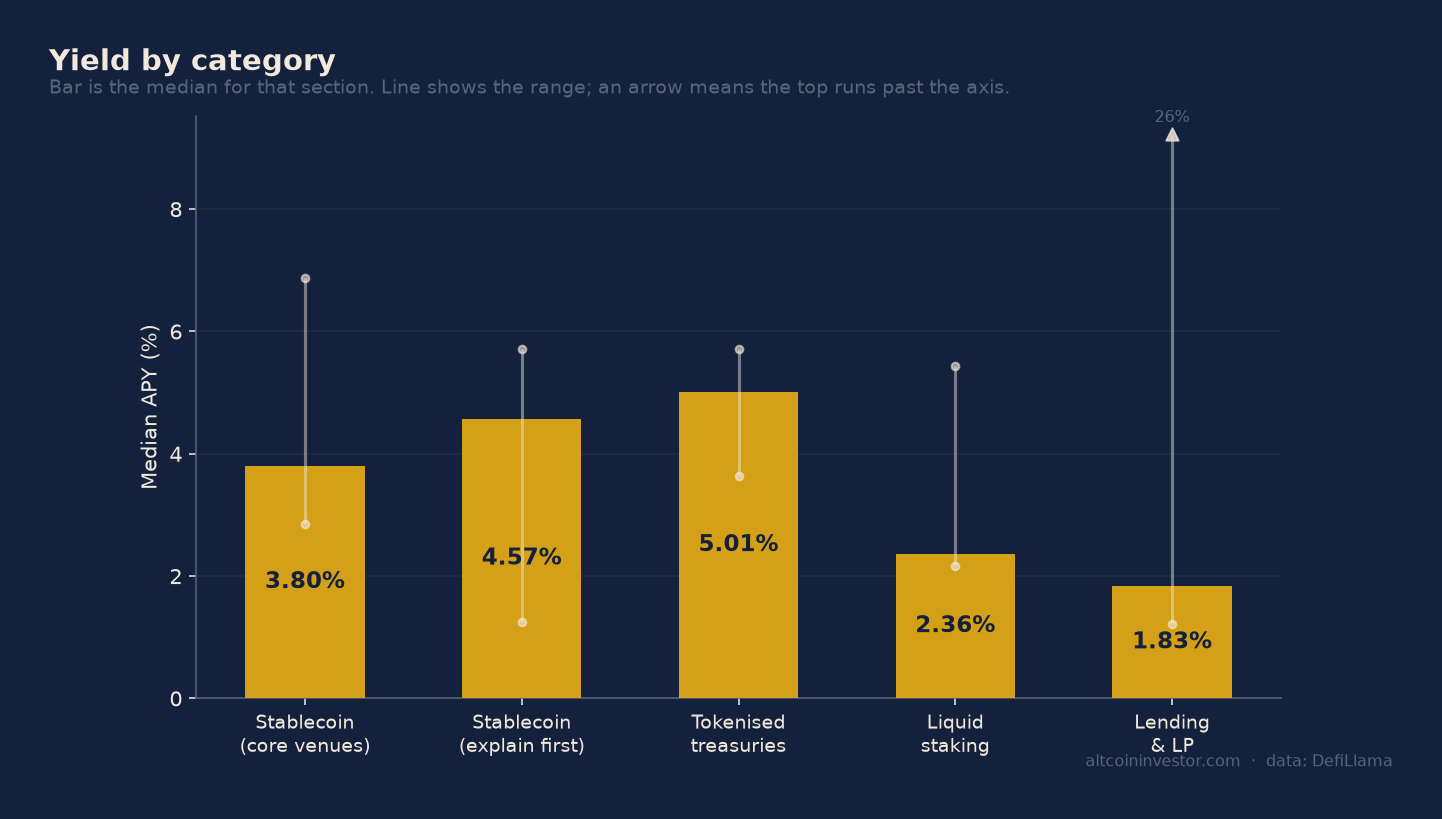
Tokenised US Treasuries and institutional credit products carry counterparty and regulatory risk rather than smart-contract risk. [Maple USDC on Ethereum](https://defillama.com/yields/pool/43641cf5-a92e-416b-bce9-27113d3c0db6) is paying 5.21% with $2,768 million in TVL and 437 days of operational history. That yield comes from institutional credit and carries real borrower default risk. Maple USDT is at 5.46% with $637 million TVL under the same default risk profile. Maple USDG is paying 5.01% with $484 million locked.
Ondo USDY on Ethereum and Solana offers 3.64% with $1,400 million in TVL. This is a tokenised US Treasury product from Ondo. BlackRock BUIDL on Solana and Ethereum pays 3.78% with $1,374 million TVL and 195 days of history, representing tokenised US Treasuries from BlackRock. [Invesco USTB on Ethereum](https://defillama.com/yields/pool/1910847a-f8b5-40ce-a1ab-1dafdded5fbb) is at 3.93% with $597 million locked and 188 days of operational data, another tokenised Treasury vehicle.
Usual USD0 bUSD0 on Ethereum is paying 5.71% with $504 million TVL, but 100% of that APY comes from reward emissions. This is a treasury-backed product with a token incentive layer. Centrifuge USDS on Ethereum offers 3.96% with $326 million TVL, representing tokenised real-world credit with 141 days of history.
## Liquid Staking
Ethereum liquid staking yields as of 8 October 2026 sit between 2.17% and 2.36%. [Lido stETH](https://defillama.com/yields/pool/747c1d2a-c668-4682-b9f9-296708a3dd90) is at 2.24% with $24,386 million in TVL and 1,587 days of operational history. Binance Staked ETH wBETH is paying 2.22% with $8,859 million locked. This is an exchange-operated product carrying custodial counterparty risk. Ether.fi weETH on Ethereum and Base offers 2.27% with $5,626 million TVL. This product includes restaking exposure on top of base staking yield.
Rocket Pool rETH on Ethereum pays 2.17% with $1,312 million in TVL and 1,358 days of history. Coinbase Wrapped Staked ETH cbETH is at 2.36% with $478 million locked. StakeWise V3 osETH on Ethereum offers 2.3% with $395 million TVL, a smaller ETH staking pool with a longer track record of 1,016 days.
Solana liquid staking rates are structurally higher because Solana validator yields include MEV and higher base staking returns. [Jupiter Staked SOL jupSOL](https://defillama.com/yields/pool/52bd72a7-9e81-4112-abb4-71673e8de9bf) is paying 5.43% with $581 million in TVL. Jito jitoSOL offers 4.82% with $1,164 million locked, explicitly including MEV rewards. Drift Staked SOL dSOL is at 4.96% with $312 million TVL. Marinade msol pays 4.74% with $252 million in deposits.
## What Changed
Four venues entered the dataset this week. Jupiter Lend USDC on Solana appeared at 4.15%, Sky Lending USDS on Ethereum at 5.62%, Jupiter Lend WSOL at 4.3%, and [Uniswap V3 WBTC-USDT](https://defillama.com/yields/pool/3dd2c646-c05a-4483-98f4-d7a924a6d6d3) at 25.54%. Four pools dropped out of the dataset: Fluid Lending USDT at 4.29%, Pendle V2 USDAI at 2.33%, Spark Savings ETH at 1.55%, and Curve dex oETH-WETH at 1.62%.
The largest movement was Curve dex crvUSD-cbBTC falling from 10.58% to 1.21%, a drop of 9.37 percentage points. Fluid Lending USDC on Base jumped from 8.8% to 14.34%, though 64% of that APY is now emissions rather than base yield. Uniswap V3 USDC-WETH rose from 7.15% to 9.46%. Convex Finance cvxCRV fell from 10.8% to 9.16%. Fluid Lending USDC across Ethereum, Arbitrum, and Base rose from 4.67% to 5.71%. Marinade msol dropped from 5.77% to 4.74%.
## Where The Yield Is Not Real
A pool paying 4% in protocol fees and 18% in a reward token down 60% is not an 18% pool. The emissions-dependent venues as of 8 October 2026 are paying headline APYs that are mostly or entirely reward tokens rather than sustainable protocol revenue.
Fluid Lending USDC on Base is showing 14.34%, but 9.22 percentage points of that, 64% of the total, comes from token rewards. The base yield is 5.12%. Curve dex CRV-cvxCRV on Ethereum advertises 9.24%, but 9.05 percentage points, 98% of the APY, is emissions. The base yield is 0.19%. [Convex Finance cvxCRV](https://defillama.com/yields/pool/ef32dd3b-a03b-4f79-9b65-8420d7e04ad0) pays 9.16%, entirely from rewards with zero base yield.
Curve dex reUSD-scrvUSD on Ethereum shows 8.75%, of which 7.98 percentage points, 91%, is emissions. Usual USD0 bUSD0 on Ethereum offers 5.71%, 100% from rewards. Sky Lending USDS on Ethereum is at 5.62%, also 100% emissions. Aave V3 rLUSD on Ethereum pays 4.99%, of which 3.29 percentage points, 66%, is token rewards. Aave V3 WETH on Ethereum shows 4.82%, with 3.48 percentage points, 72%, from emissions.
These pools may be suitable for short-term liquidity mining strategies with full knowledge of token price risk and vesting schedules. They are not comparable to base-yield stablecoin lending or liquid staking products.
## How To Verify Any Of This
Every venue in this report links directly to its DefiLlama pool page. [Compound V3 USDC](https://defillama.com/yields/pool/7da72d09-56ca-4ec5-a45f-59114353e487), [Sky Lending SUSDS](https://defillama.com/yields/pool/d8c4eff5-c8a9-46fc-a888-057c4c668e72), [Aave V3 USDC](https://defillama.com/yields/pool/aa70268e-4b52-42bf-a116-608b370f9501), [Maple USDC](https://defillama.com/yields/pool/43641cf5-a92e-416b-bce9-27113d3c0db6), [Invesco USTB](https://defillama.com/yields/pool/1910847a-f8b5-40ce-a1ab-1dafdded5fbb), and [Lido stETH](https://defillama.com/yields/pool/747c1d2a-c668-4682-b9f9-296708a3dd90) can all be checked in one click. Yields change daily. The figures in this report are a snapshot as of 8 October 2026\. Check the current APY, TVL, and pool history before deploying capital. The verification links are not decorative. They are how you confirm that the numbers are real and that the risk disclosures match the mechanism.
### PowerCompute Earns More Selling Power Than Mining Bitcoin
URL: https://altcoininvestor.com/powercompute-energy-sales-outpace-mining/
Last updated: 2026-10-11T18:00:06.000Z
## PowerCompute Chose Grid Sales Over Mining

PowerCompute, Inc. (Nasdaq: PWCM) mined 8.1 Bitcoin in September 2026, up 37% year-over-year. The company also generated approximately $89,000 from energy sales that month and $312,000 for the three months ended September 30, 2026\. CEO Bruce M. Rodgers was explicit about the trade: "In the hottest months, we can earn more by selling that power back to the grid than by mining with it."
This is not a hedge. It is a substitution.
PowerCompute owns its power infrastructure. When summer demand spiked electricity prices, the company diverted capacity from mining operations to grid sales. The decision reflects unit economics, not ideology. If energy arbitrage pays better than mining rewards net of operating expense, the rational miner sells power.
September production rose 2.7% from August, suggesting the company has returned some capacity to mining as seasonal demand cooled. The playbook is flexible allocation, not maximum hash rate.
## Why Owned Power Infrastructure Matters

Most Bitcoin miners rent power or operate under fixed-rate contracts. PowerCompute owns interconnected generation assets. That ownership creates optionality.
When electricity spot prices surge, the miner with owned capacity can reverse the flow. Instead of buying power to mine Bitcoin, it sells power to the grid. The margin on that sale becomes the opportunity cost of continued mining.
In Q3 2026, that opportunity cost was high enough to justify diverting capacity for $312,000 in energy revenue. For context, 8.1 BTC mined in September at an average price near $60,000 would gross roughly $486,000\. But mining carries hardware depreciation, maintenance, and cooling costs that grid sales avoid. The net spread may be tighter than it appears.
Miners without owned generation face a binary choice: mine at a loss or shut down temporarily. PowerCompute added a third option: sell the asset it controls.
## Debt Retirement With Bitcoin Proceeds
Rodgers also disclosed that the company used Bitcoin to retire debt. "We used Bitcoin to retire debt rather than carry leverage," he said. This is a balance-sheet decision, not a treasury-management thesis.
Mining companies that held Bitcoin through 2022-2023 bore the full drawdown. Those that carried leverage during that period faced margin calls or distressed refinancing. PowerCompute appears to be cleaning up the liability side before prices fall again.
In equities, you would call this deleveraging. The miner converts volatile inventory (Bitcoin) into debt reduction, lowering fixed obligations and improving cash-flow coverage. The trade-off is giving up upside if Bitcoin rallies past the sale price. But that upside is speculative. Debt service is certain.
For income-focused observers, this matters. A miner with lower debt and flexible power economics can survive longer periods of subdued Bitcoin prices. That durability supports consistent operational uptime, which is what [cloud mining](https://altcoininvestor.com/bitcoin-price-hits-a-new-yearly-high/) contract providers and yield strategies relying on mining infrastructure need.
## What This Means for Mining Economics
The income path here is indirect but real. If you earn from Bitcoin mining, either directly or through [cloud mining](https://altcoininvestor.com/bitcoin-price-hits-a-new-yearly-high/) platforms, the viability of the underlying miner determines whether your contract pays out or defaults.
Miners with owned power and low debt are better positioned to honor obligations through volatility. Miners that depend entirely on Bitcoin price appreciation or that carry heavy leverage are structurally fragile.
PowerCompute's Q3 results show that energy arbitrage is no longer theoretical. It happened. The company diverted capacity, sold power, and generated $312,000 in non-mining revenue. That diversification creates a floor under operating cash flow that pure-play miners lack.
If you participate in mining through hosted hardware, profit-sharing contracts, or equity in mining companies, you now have a new variable to track: does the operator own its power, and can it monetize that asset when mining margins compress?
The second-order effect is market-wide. As more miners adopt this playbook, hash rate will become more elastic to energy price, not just Bitcoin price. That changes the correlation structure between mining profitability and spot electricity markets.
## Who This Favors and Who It Pressures
This model favors miners with capital-intensive infrastructure and punishes those relying on rented capacity or thin margins.
PowerCompute's ability to pivot into energy sales depends on owning generation and having grid interconnection. That requires upfront investment and regulatory compliance that many smaller miners cannot afford. The barrier to entry for this strategy is higher than simply leasing warehouse space and plugging in ASICs.
Miners without that optionality face margin compression when energy prices rise. They either mine at a loss or go offline. PowerCompute sells power instead. The result is a slow sorting mechanism: operators with flexible infrastructure survive longer cycles, and those dependent on single-revenue-stream economics exit.
For investors or participants in [mining contracts](https://altcoininvestor.com/bitcoin-price-hits-a-new-yearly-high/), this is a counterparty-risk question. The miner you are exposed to either has this flexibility or it does not. If it does, your income stream is more durable. If it does not, you are exposed to the full volatility of Bitcoin mining economics with no hedge.
The debt-retirement angle compounds this. Miners that deleveraged while Bitcoin was above $50,000 enter the next drawdown with cleaner balance sheets. Those that held Bitcoin as treasury speculation or that took on debt to expand capacity in 2024-2025 are vulnerable if prices fall below cash-cost breakevens.
## The Takeaway
PowerCompute generated $312,000 in Q3 2026 by selling power to the grid instead of mining Bitcoin with it. That is not a publicity stunt. It is a structural shift in how miners with owned infrastructure allocate capital. The company also used Bitcoin proceeds to retire debt, reducing leverage before the next potential price downturn. For anyone earning through mining exposure, the lesson is simple: miners that control power generation and operate with low debt can survive conditions that break pure-play hash-rate operators. That durability is the new edge, not total hash rate. If you are evaluating mining contracts, hosted hardware, or equity in mining companies, ask whether the operator owns its power and whether it has the flexibility to monetize that asset when mining margins turn negative. The answer will determine whether your income persists through the next cycle or evaporates with the first sustained price decline.
## Frequently Asked Questions
### How does PowerCompute make money by selling power instead of mining Bitcoin?
PowerCompute owns its electricity generation infrastructure. When spot electricity prices rise above the net profit from mining Bitcoin, the company diverts power from mining operations and sells it to the grid instead. In Q3 2026, this generated $312,000 in energy sales. The decision is based on unit economics: if grid sales pay more than mining after operating costs, the rational choice is to sell power.
### Why would a Bitcoin mining company use BTC to pay down debt instead of holding it?
Debt service is a fixed obligation, while Bitcoin's price is volatile. By converting mined Bitcoin into debt repayment, PowerCompute reduces leverage and lowers the risk of distressed refinancing if prices fall. This improves balance-sheet durability and cash-flow coverage, allowing the company to survive longer periods of low Bitcoin prices. The trade-off is giving up potential upside if Bitcoin rallies, but that upside is speculative while debt payments are certain.
### Does this energy arbitrage strategy affect hash rate and network security?
Yes, indirectly. If miners increasingly divert power to grid sales when energy prices spike, hash rate becomes more elastic to electricity markets, not just Bitcoin price. This can cause temporary hash rate declines during high-demand energy periods. However, it also means miners with owned power infrastructure are less likely to shut down permanently during bear markets, which supports long-term network stability.
### What does this mean for cloud mining contracts and hosted mining services?
Cloud mining contracts depend on the underlying miner's ability to remain operational and profitable. Miners with owned power infrastructure and low debt, like PowerCompute, are better positioned to honor contract obligations during volatility. If you participate in cloud mining, the counterparty's ability to monetize power when mining margins compress directly affects whether your contract pays out or defaults. This is a new counterparty-risk variable to evaluate.
The Weekly Yield Report
You just saw one miner shift from hash rate to energy arbitrage as Q3 economics changed. Those margins will look different by year-end.
Every Thursday: where crypto yield actually is - stablecoins, liquid staking and DeFi lending, with the risk named next to the rate and what changed since last week.
[Get it free every Thursday](#/portal/signup)
Free. No trade calls, no allocations, no hype. Unsubscribe in one click.
### How MiCA Affects Your Yield Strategy If You're In Europe
URL: https://altcoininvestor.com/mica-yield-strategy-europe/
Last updated: 2026-10-08T02:06:07.000Z
## What MiCA Changes for EU Yield Strategies

The Markets in Crypto-Assets Regulation (MiCA) became EU law in phases between June 2024 and December 2024\. The transitional period expires July 1, 2026\. After that date, any entity providing crypto-asset services to EU clients without a MiCA license is in breach of EU law and must cease operations. For retail investors earning yield on digital assets in Europe, the question is not whether regulation exists, but which income strategies remain compliant under the framework now in force.
MiCA's impact on yield strategy splits into three distinct categories: Title III and IV provisions affecting stablecoins, Title V provisions affecting crypto-asset service providers (CASPs), and the unresolved scope question around decentralized finance protocols that claim to operate without intermediaries. The distinction matters because most retail yield strategies depend on at least one of three inputs: stablecoins as the principal asset, centralized platforms as the custody and execution layer, or decentralized protocols as the yield generation mechanism. MiCA regulates the first two directly. The third remains in a narrowing grey zone that the European Central Bank and national central banks are now pushing to close.
As of December 2025, the [European Securities and Markets Authority (ESMA) register](https://www.esma.europa.eu/esmas-activities/digital-finance-and-innovation/markets-crypto-assets-regulation-mica) shows just 102 CASPs have received full MiCA authorization. That represents an 80 to 90 percent contraction in the total number of individual operators allowed to legally serve EU consumers. Lightweight operations have been eliminated. Market share has concentrated into well-capitalized, highly compliant entities. The practical result for yield strategy is straightforward: if the platform you use is not on the ESMA register, it cannot legally onboard you after July 1, 2026, and must wind down your existing positions.
## Three Yield Categories Post-July 2026

Under MiCA, yield strategies available to EU retail users fall into three categories: compliant, grey-zone, and off-limits. The categories are defined by Title III and IV stablecoin provisions, Title V CASP licensing requirements, and the emerging enforcement posture from ESMA and national competent authorities.
### Compliant Yield Strategies
Compliant strategies involve custody of MiCA-authorized stablecoins on licensed platforms, lending via regulated CASPs, and no direct yield remuneration on stablecoins themselves. Circle's USDC and EUROC fully comply with MiCA regulations. Banking Circle has launched EURI, a euro-backed stablecoin designed to meet MiCA's stringent standards. These three tokens are the only major stablecoins authorized for retail use across the EU as of May 2026.
Lending via MiCA-licensed CASPs remains compliant if the lending activity is collateralized and the platform holds the appropriate authorization category. Capital minimums range from EUR 50,000 for advice firms to EUR 150,000 for trading platforms, with additional capital based on fixed overheads. Platforms meeting these thresholds and holding valid authorization can offer collateralized lending products to EU users.
The key restriction is MiCA Article 51, which prohibits direct yield remuneration on stablecoins offered by CASPs. The European Central Bank and national central banks issued a joint statement in September 2026 clarifying that yield-bearing stablecoins could blur the distinction between electronic money and bank deposits, circumvent existing restrictions, and distort competition. Electronic money is intended for payments, not savings. This prohibition does not prevent collateralized lending where the stablecoin serves as collateral, but it does prevent platforms from offering direct interest on stablecoin deposits.
### Grey-Zone Strategies
Grey-zone strategies include self-custody DeFi protocols that claim full decentralization but operate with de facto intermediaries, yield on unregistered electronic money tokens (EMTs), and cross-border service provision via non-licensed virtual asset service providers. The grey zone is narrowing rapidly.
Decentralized finance protocols are explicitly excluded from MiCA if they operate "fully decentralized," though the regulation provides no precise threshold for that label. The statutory concept is narrow: crypto-asset services provided in a fully decentralized manner without any intermediary fall outside the Regulation. In practice, interpretation is left to national competent authorities and to ESMA's forthcoming Level 2 and Level 3 guidance.
Self-custody [DeFi yield strategies](https://altcoininvestor.com/best-defi-protocols/) using Uniswap, Aave, or Curve remain outside the scope of MiCA if the user initiates all transactions without intermediary facilitation. Platforms that facilitate access, offer custodial interfaces, or provide execution layers may trigger CASP licensing requirements. The distinction is technical and fact-dependent. A user who self-custodies ETH, connects a wallet directly to Aave via a non-custodial interface, and deposits collateral to earn yield does not engage a CASP. A user who deposits ETH with a platform that then allocates that ETH to Aave on the user's behalf does engage a CASP, and that CASP must hold authorization.
Yield farming on non-compliant stablecoins creates a regulatory cliff for EU users on or after July 1, 2026\. USDT, DAI, USDe, FDUSD, PYUSD, and TUSD all lack MiCA authorization as of May 2026\. Tether has stated no intention to pursue MiCA authorization and was delisted by Binance, Coinbase, Kraken, and Crypto.com for EEA retail users during 2024 and 2025\. Users holding positions in these stablecoins on non-licensed platforms face forced migration or liquidation by the July 1, 2026 deadline.
### Off-Limits Strategies
Off-limits strategies include direct yield remuneration on stablecoins offered by CASPs, USDT or other non-authorized stablecoin yield on EU platforms post-July 2026, unregistered stablecoin issuance, and DeFi lending accessible only to unaccredited retail users without issuer authorization.
MiCA Article 51 explicitly prohibits CASPs from offering yield on stablecoins. The ECB and national central banks are pushing to extend this prohibition to indirect yield via lending, borrowing, staking, or other products that generate returns on stablecoins. The European Banking Authority has asked the EU to study MiCA rules for crypto lending and DeFi access as lending volumes grow and stablecoin yield risks emerge.
Non-EU currency stablecoins used as a widespread medium of exchange are restricted to a maximum threshold of 200 million Euros in daily payment transactions or 1 million daily transactions within the zone. This threshold affects USDT and other USD-denominated stablecoins that lack authorization. Even if a user self-custodies USDT and uses it on a non-intermediated DeFi protocol, the protocol's accessibility to EU users may be restricted if the stablecoin exceeds the transaction thresholds.
## Stablecoin Authorization and Reserve Requirements
MiCA Title III and IV provisions govern stablecoin issuance, reserve composition, and redemption rights. These provisions became applicable on June 30, 2024\. The practical effect for yield strategy is that only stablecoins meeting MiCA's reserve and authorization requirements can be offered to EU retail users via licensed platforms.
Reserves backing electronic money tokens and asset-referenced tokens must be held primarily in highly liquid financial instruments, with at least 30 percent of the reserve held as deposits at credit institutions for non-significant tokens and at least 60 percent for tokens classified as significant. Reserve composition rules create cost floors for issuers. USDC and EUROC comply with these requirements. USDT does not, and Tether has publicly stated it will not pursue compliance.
Licensing and compliance costs for crypto startups under MiCA have increased substantially, with estimates ranging from EUR 50,000 to EUR 100,000 depending on legal and operational complexity. Minimum capital requirements, annual audits, DORA cyber controls, and AML/CFT training all contribute to the cost base. The result is that only well-funded platforms with institutional backing are surviving the transition. For yield strategy, this means fewer platforms but higher baseline compliance standards.
The distinction between MiCA-authorized and non-authorized stablecoins determines which [stablecoin income strategies](https://altcoininvestor.com/how-to-make-money-with-stablecoins/) remain accessible. Yield aggregators that previously offered multi-stablecoin strategies must now limit EU users to USDC, EUROC, and EURI. Platforms offering USDT-based yield to EU users after July 1, 2026 are in breach of EU law.
## CASP Licensing and Transitional Wind-Down
Rules for crypto-asset service providers under Title V applied from December 30, 2024\. The MiCA transitional period expires across the EU on July 1, 2026\. Germany and Ireland closed their transitional regimes on December 31, 2025\. The Netherlands, Poland, Latvia, Hungary, and Slovenia chose six-month transitional periods. After July 1, 2026, there is no middle ground. Firms either hold authorization or do not operate in the EU.
ESMA issued statements on April 17 and June 23, 2026, explicitly barring unauthorized providers from onboarding new EU clients. Wind-down plans are mandatory by July 1, 2026\. No extensions are possible under the regulation itself. Unauthorized providers must stop onboarding new EU clients and limit activity to what is necessary for clients to sell or transfer their crypto-assets.
For yield strategy, this means that platforms not on the ESMA register cannot offer new positions to EU users. Existing positions must be migrated to authorized platforms or liquidated. The custody of migrated assets is unclear if the receiving platform is also unregistered. Institutional participation has increased 45 percent on MiCA-compliant platforms. Retail participation is largely unaffected if the platform holds authorization, but users on non-compliant platforms face forced exits.
National competent authorities are actively conducting spot checks. Fines of up to 12.5 percent of annual turnover, license revocations, personal liability for executives, and public disclosure of violations are all enforcement tools now in use. BaFin in Germany, the AMF in France, and the AFM in the Netherlands have each issued enforcement actions against non-compliant CASPs during the first quarter of 2026.
## DeFi Scope and the Narrowing Loophole
The statutory exemption for fully decentralized protocols remains undefined. ESMA Level 3 guidance, which would clarify the threshold for "fully decentralized," has been delayed. In the absence of formal guidance, national competent authorities are applying the exemption narrowly. The ECB and national central banks issued a joint statement in September 2026 pushing to ban indirect yield via lending, borrowing, staking, or other products that generate returns on stablecoins. The enforcement posture suggests that the exemption will apply only to protocols with no front-end interfaces, no custodial layers, and no facilitation of user access by third parties.
Decentralized finance platforms saw a 16 percent drop in usage in the EU during the second half of 2025\. The decline is attributed to regulatory uncertainty and to the migration of EU users to MiCA-compliant platforms. For [liquidity pool yield](https://altcoininvestor.com/liquidity-pools-crypto-yield-impermanent-loss/), the practical effect is that EU users must either self-custody and interact directly with protocols via non-custodial interfaces, or use platforms that hold CASP authorization and offer DeFi access as a regulated service.
The distinction between user-initiated DeFi interaction and platform-facilitated DeFi access is the line that determines whether MiCA applies. A user who connects a Ledger wallet to Uniswap via the official interface and provides liquidity does not engage a CASP. A user who deposits ETH with a platform that then provides liquidity on Uniswap on the user's behalf does engage a CASP. The second model requires authorization. The first does not, but it also lacks the regulatory protections and tax reporting infrastructure that MiCA-compliant platforms provide.
## Tax Treatment and Reporting Obligations
MiCA does not harmonize tax treatment across member states, but it does impose reporting obligations on CASPs that affect [yield tax reporting](https://altcoininvestor.com/defi-yield-tax-reporting/). Licensed platforms must provide transaction histories, cost basis calculations, and income reporting for users. The reporting standard is higher than pre-MiCA regimes. For users earning yield across multiple protocols, the burden of maintaining records shifts from the user to the platform when the platform is licensed.
Self-custody DeFi users remain responsible for their own tax reporting. National tax authorities in Germany, France, and the Netherlands have all issued guidance clarifying that DeFi yield is taxable as income in the year it is received. Cost basis tracking for rebasing tokens versus value-accruing tokens creates different tax obligations. Users deploying [yield-bearing stablecoins](https://altcoininvestor.com/earn-passive-income-yield-bearing-stablecoins/) on self-custody DeFi protocols must track accruals manually and report them accurately or face penalties.
## Enforcement Posture and Regulatory Precedent
The enforcement posture emerging from ESMA and national regulators is cautious, slow, and focused on consumer protection. The regulatory precedent set by MiCA's first two years of enforcement will shape which yield structures agencies consider compliant versus which they consider unregistered securities offerings.
The ECB's September 2026 statement clarifying that yield-bearing stablecoins blur the distinction between electronic money and bank deposits sets the precedent that stablecoin yield is disfavored. The European Banking Authority's request to study crypto lending and DeFi access suggests that lending products will face heightened scrutiny. National competent authorities are enforcing MiCA's capital and reserve requirements strictly. Platforms that advertised compliance but failed to meet reserve composition standards have faced license revocations and fines.
For yield strategy design, the enforcement posture signals that low-risk, low-return strategies on MiCA-compliant platforms are the safest path forward. High-yield strategies on non-compliant stablecoins or unlicensed platforms carry legal risk that increases sharply after July 1, 2026\. Self-custody DeFi strategies remain accessible but require technical competence, manual tax reporting, and acceptance of no regulatory recourse in the event of protocol failure or exploit.
## The Takeaway
After July 1, 2026, there is no middle ground for EU-based yield strategy. Platforms either hold MiCA authorization or they do not operate in the EU. Stablecoins either meet Title III and IV requirements or they cannot be offered to retail users via licensed platforms. DeFi protocols either operate in a fully decentralized manner without intermediaries or they trigger CASP licensing obligations. The grey zone that existed during the 2024 to 2026 transitional period is closing. The next phase of MiCA enforcement will determine whether the ECB's push to ban indirect yield on stablecoins succeeds, whether ESMA's Level 3 guidance narrows the DeFi exemption further, and whether national competent authorities enforce the regulation uniformly across member states. For now, the compliant path is clear: use MiCA-authorized stablecoins, custody on licensed platforms, and accept that the yield environment in Europe is lower, more regulated, and more concentrated than it was two years ago.
## Frequently Asked Questions
### Which stablecoins are MiCA-compliant for EU yield strategies?
As of May 2026, only three major stablecoins are MiCA-authorized for retail use in the EU: Circle's USDC and EUROC, and Banking Circle's EURI. USDT, DAI, USDe, FDUSD, PYUSD, and TUSD all lack authorization. Tether has stated no intention to pursue MiCA compliance and was delisted by Binance, Coinbase, Kraken, and Crypto.com for EEA retail users. Any yield strategy using non-authorized stablecoins on EU platforms after July 1, 2026 is non-compliant.
### Can EU users still earn yield on DeFi protocols under MiCA?
Yes, if the protocol operates in a fully decentralized manner without intermediaries. Self-custody users who connect wallets directly to protocols like Uniswap, Aave, or Curve via non-custodial interfaces do not engage a CASP and remain outside MiCA's scope. However, platforms that facilitate DeFi access by holding custody or executing transactions on behalf of users must hold CASP authorization. The distinction is technical and fact-dependent, and ESMA Level 3 guidance on the decentralization threshold has been delayed.
### What happens to my yield positions if my platform is not MiCA-licensed by July 1, 2026?
Unauthorized platforms must stop onboarding new EU clients and limit activity to what is necessary for you to sell or transfer your crypto-assets. ESMA statements issued April 17 and June 23, 2026 require wind-down plans by July 1, 2026\. You will need to migrate positions to a MiCA-licensed platform or liquidate them. The custody of migrated assets is unclear if the receiving platform is also unregistered. Check the ESMA register to verify your platform's authorization status before the deadline.
### Does MiCA allow centralized platforms to offer yield on stablecoins?
No. MiCA Article 51 prohibits crypto-asset service providers from offering direct yield remuneration on stablecoins. The European Central Bank and national central banks clarified in September 2026 that yield-bearing stablecoins blur the distinction between electronic money and bank deposits. Collateralized lending where stablecoins serve as collateral remains compliant if the platform holds appropriate authorization, but direct interest on stablecoin deposits is prohibited.
### What are the reserve requirements for MiCA-compliant stablecoins?
MiCA Title III and IV require reserves backing electronic money tokens and asset-referenced tokens to be held primarily in highly liquid financial instruments. At least 30 percent of the reserve must be held as deposits at credit institutions for non-significant tokens, and at least 60 percent for significant tokens. These requirements create cost floors for issuers. USDC and EUROC comply. USDT does not, and Tether has stated it will not pursue compliance.
The Weekly Yield Report
You have just read which yield strategies remain compliant under MiCA Title III, IV, and V, and which platforms hold authorization as of May 2026\. The ESMA register will change weekly through July, and enforcement posture will shift as the ECB's yield ban proposal moves forward.
Every Thursday: where crypto yield actually is - stablecoins, liquid staking and DeFi lending, with the risk named next to the rate and what changed since last week.
[Get it free every Thursday](#/portal/signup)
Free. No trade calls, no allocations, no hype. Unsubscribe in one click.
### The Difference Between Structural And Cyclical Yield
URL: https://altcoininvestor.com/structural-vs-cyclical-yield-crypto/
Last updated: 2026-10-08T00:06:42.000Z
## The Question That Separates Yield Strategies That Survive From Those That Don't

The question is simple enough that most readers skip past it without pausing: where does the yield come from? Not the token name, not the APY number, but the actual economic mechanism generating the return. That mechanism determines whether the yield persists when market conditions turn or vanishes the moment you need it most.
I have watched three cycles now where readers deployed capital into high-APY strategies during bull markets, then watched those same strategies return zero during the following bear. The pattern repeats. The wrappers change. The lesson doesn't.
Structural yield persists across bull and bear markets because it comes from real economic activity: protocol fees, trading spreads, borrowing demand, or MEV capture. Cyclical yield appears during one phase of the market and disappears during another because it comes from token emissions, protocol subsidies, or leverage structures that only function when market conditions support them.
The difference matters because most readers allocate capital based on the APY number without asking which category they're entering. That confusion commits capital at exactly the wrong time, then holds it through the phase turn when the yield source dries up.
## Structural Yield: What Persists When Market Conditions Turn

Structural yield comes from mechanisms that generate revenue regardless of whether the broader market is rising or falling. These strategies pay returns from actual protocol activity, user fees, or arbitrage opportunities that exist independent of token price.
### Protocol Fees And Real Revenue
DEXs earn revenue by charging fees on trades, approximately 0.01% to 0.3% per swap. Aave charges a spread on the difference between borrowing and lending rates, plus a 0.09% fee on flash loans. During the TerraUSD collapse in May 2022, Curve made $7.5 million in revenue from transaction fees and swap fees in one week while the broader market was capitulating.
That week is the test.
When markets are falling and most yield strategies are going to zero, protocol fee structures keep paying because users keep trading, borrowing, and moving capital. The volume may decline, but the mechanism persists. [The best DeFi protocols](https://altcoininvestor.com/best-defi-protocols/) survived 2022 by generating revenue from real activity rather than subsidizing yield through emissions.
Real yield is return paid from actual protocol revenue rather than newly minted tokens. Current structural yields run lower than cyclical yields by design. Aave's largest USDT pool yields 1.84%, while several other pools sit below 2%. Those numbers look unimpressive compared to 2021 farm APYs, but they represent sustainable income that kept paying through the 2022 bear market while emission-based farms went to zero.
### Staking And MEV Capture
Ethereum staking currently returns 2.8% to 4% APY against issuance of roughly 1%, putting real yield near 2% to 3%. Lido takes a 10% fee on rewards that trims a 3% gross return to roughly 2.4% net. Jito is the largest Solana LST at roughly $2.4 billion in JitoSOL TVL, charging a 4% protocol fee, and producing a blended 7.5% to 8.5% APY because MEV tips lift returns 50 to 150 basis points above plain SOL staking.
These yields come from validator economics and MEV extraction, both of which persist across cycles. When Ethereum price dropped 77% from November 2021 to June 2022, staking rewards kept accruing. The dollar value of those rewards fell with ETH price, but the percentage yield remained structurally intact because it comes from protocol issuance and transaction ordering, not from subsidies or leverage.
### Funding Rate Carry In Derivatives
Perpetual futures account for over 90% of derivatives volume on most exchanges. The funding rate is the cash exchanged between long and short counterparties, typically paid every 8 hours. Over the past six years, the funding rate on Binance has averaged about 14% per annum against a U.S. T-bill rate that averaged around 3%, a gap of 11%.
Crypto carry persists at times exceeding 40% per annum and averages around 7-8% per year, offering an 8% return per year that carries no price risk as futures and spot prices converge at maturity. This yield comes from structural imbalance in derivatives markets where long positions persistently outnumber shorts, creating a premium that market-neutral traders capture through basis strategies.
During extreme market conditions, funding rates can spike to 0.1%+ per period with annualized funding costs exceeding 100% in volatile periods. The yield is structural because the imbalance persists, but the magnitude is cyclical. Patient allocators accumulate positions when funding is compressed and rotate when it spikes.
## Cyclical Yield: What Disappears When The Phase Turns
Cyclical yield comes from mechanisms that only function during specific market phases. These strategies pay high returns during bull markets and go to zero during bear markets because the yield source depends on market conditions that do not persist.
### Token Emissions And Protocol Subsidies
The term "real yield" was popularized in late 2022 after the collapse of several "DeFi 2.0" tokens whose 1000%+ APRs were entirely funded by emissions. As token price fell, the dollar value of yield collapsed with it. Early adopters sometimes saw triple-digit APYs in yield farming, but those returns proved unsustainable.
The 2021 emission farms are the clearest case study. COMPOUND (COMPUSDT) topped in May 2021, dropped until June 2022, then formed a technical double-bottom around June 2023\. A neutral sideways period between June 2022 and June 2023 marked a lost year where farms that had advertised 80% to 300% APY returned zero in dollar terms because the token used to pay yield lost 90% of its value.
Extra rewards that once boosted returns have largely disappeared, leaving only organic yield driven by borrowing demand. That demand is not strong enough to push yields higher without subsidy. Aave frames current yield weakness as cyclical rather than structural, pointing to depressed crypto sentiment as a key driver of reduced borrowing demand, noting that "stablecoin rates on Aave have largely tracked leverage demand" and "We do not see them as structurally lower going forward."
This is the exact confusion your allocation framework should demolish.
Borrowing demand is cyclical. Protocol fees are structural. A protocol that generates yield only when borrowing demand is high will stop paying when the cycle turns. A protocol that generates yield from transaction fees will keep paying at a lower rate, but it will keep paying.
### Leverage Stack And Recursive Lending Risk
Recursive lending amplifies yield when the return on collateral exceeds borrowing cost, repeating deposit, borrow, and redeposit cycles until reaching a stable equilibrium. With wstETH collateral, the collateral accrues yield while debt does not. Each wstETH token represents slightly more ETH over time due to staking rewards, so effective supply APY exceeds borrow APR.
The strategy works during calm markets when collateral value is stable and borrowing rates remain below staking returns. It stops working when volatility spikes, collateral value drops, and liquidation thresholds compress. The June 2022 collapse liquidated billions in leveraged positions within 72 hours because collateral lost value faster than positions could be unwound.
[Liquidity pool strategies](https://altcoininvestor.com/liquidity-pools-crypto-yield-impermanent-loss/) that stack leverage on top of LP positions fail the same way. The yield looks high during low-volatility bull markets. It goes negative during volatility events when impermanent loss combines with liquidation cascades.
### Market-Dependent Subsidy Programs
Protocols launch incentive programs during bull markets to attract TVL. Those programs advertise 20% to 60% APY through a combination of protocol fees and token emissions. The headline number attracts capital. The footnote explains that 80% of the yield comes from emissions that vest over 12 months and decline on a schedule.
By the time the emissions vest, the token price has dropped 60% and the program has ended. The gross APY was real. The net return was zero or negative after accounting for token depreciation and opportunity cost.
Sustainable yield comes from real economic activity. Trading fees, lending demand, arbitrage opportunities, and derivatives activity generate revenue tied directly to actual protocol usage. Those revenues tend to remain more durable because they are supported by ongoing market demand rather than inflationary rewards.
## When The Distinction Costs You: The 2021-2023 Case Study
The 2021-2022 bear market lasted roughly 18 months before recovery began. BTC dropped from $69,000 to $16,000 (-77%), accompanied by LUNA collapse, 3AC bankruptcy, FTX implosion, and Celsius freeze. Every cyclical yield strategy deployed in 2021 went to zero by 2023\. Every structural yield strategy kept paying.
Readers who entered emission-based farms in Q2 2021 at advertised APYs of 80% to 300% saw those yields compress to zero by Q4 2022\. The protocols did not lie. The farms paid exactly what they advertised in token terms. The tokens lost 85% to 95% of their value, turning a 150% APY into a -60% realized return.
Readers who entered protocol fee strategies in Q2 2021 at advertised APYs of 3% to 8% saw those yields compress to 1.5% to 4% by Q4 2022\. The decline was real, but the mechanism kept working. A 4% yield on a token that dropped 70% is still a -66% realized return, but the yield kept accruing and the protocol kept functioning. When the market recovered in 2023, those positions participated in the recovery with yield still intact.
The split between what LPs keep and what the treasury takes determines whether the protocol can fund development, reward token holders, and survive a bear market without inflating its token. Sustainable protocols tie fees to real usage rather than emissions that dilute holders.
### Risk-Adjusted Yield Framework
Sophisticated investors rarely use APY as sole metric. One volatile 20% yield fluctuating with token incentives versus another consistent 8-10% yield from stable revenue sources may appear superior by raw numbers, yet volatility, drawdowns, and complexity reduce long-term performance. Many investors prefer stable returns because consistency enables stronger compounding.
[The opportunity cost of a 1% rate difference](https://altcoininvestor.com/defi-yield-opportunity-cost-rate-difference/) is quantifiable and linear. The opportunity cost of deploying capital into a cyclical yield strategy at the wrong phase of the cycle is total.
During late 2021, the choice between a 5% structural yield and a 150% cyclical yield looked obvious. By late 2022, the 5% structural yield had returned +5% (minus token depreciation). The 150% cyclical yield had returned -85% after accounting for token collapse and program termination.
## How To Identify Structural vs Cyclical Yield Before You Deploy Capital
The distinction is visible before you commit capital if you ask the right questions. Where does the yield come from? What happens to that yield source if market conditions reverse? Has this yield source persisted through prior bear markets?
### Revenue Source Audit
Open the protocol documentation and locate the fee structure. [DeFi yield aggregators](https://defillama.com/protocols/yield) publish APY breakdowns that separate protocol fees from token emissions. If 80% of the advertised yield comes from emissions, the yield is cyclical. If 80% comes from protocol fees or staking rewards, the yield is structural.
Aave, Curve, and Uniswap publish transparent fee dashboards showing revenue from real activity. Protocols that do not publish revenue breakdowns or that obscure the emission percentage are signaling that the yield is cyclical.
### Historical Stress Test
Check the protocol yield during the 2022 bear market. If the protocol existed in 2021 and the yield went to zero by 2022, the yield is cyclical. If the yield compressed but remained positive, the yield is structural.
Ethereum staking launched in December 2020 and has paid continuously through two bear markets. The yield compressed from 6% to 3%, but it never stopped. Solana staking has paid continuously since 2020 with similar compression patterns. Those are structural yields.
Dozens of yield farms launched in 2021 with 200%+ APYs and terminated programs by 2022\. Those were cyclical yields.
### Mechanism Durability
Ask what market condition would cause the yield to stop. For protocol fee yields, the answer is "zero trading volume." For staking yields, the answer is "network shutdown." For emission yields, the answer is "end of incentive program" or "token price collapse."
The durability threshold tells you the category. Structural yields require catastrophic protocol failure to stop paying. Cyclical yields require only a phase change.
## Cycle-Appropriate Allocation Strategy
The appropriate allocation depends on where you are in the cycle. During accumulation phases (2019, 2023), cyclical yields are compressed or absent. Structural yields persist at lower rates. This is when you accumulate quality assets for later deployment.
During markup phases (2020, 2024), cyclical yields begin appearing as protocols launch incentive programs. Structural yields expand modestly as activity increases. This is when you begin rotating a portion of capital into higher-yield strategies while maintaining structural yield positions.
During distribution phases (late 2021, potentially late 2025), cyclical yields reach maximum advertised APYs as protocols compete for TVL. Structural yields are healthy but lower than cyclical yields. This is when you rotate out of cyclical yields into structural yields or stablecoins, locking gains before the phase turns.
During capitulation phases (2022, potentially 2026), cyclical yields go to zero as programs terminate and tokens collapse. Structural yields compress but persist. This is when you hold structural positions and accumulate quality assets at depressed prices for the next cycle.
The readers who survived 2022 with capital intact were the ones who rotated out of cyclical yields in late 2021 and held structural yields or stablecoins through the downturn. The readers who deployed into 150% farms in Q2 2021 and held through 2022 lost most of their capital.
## What The Current Environment Signals
As of October 2026, sustainable returns from fees, borrowing demand, and structured products are taking over as speculative incentives fade. Yield levels in crypto range from 1% to 15% APY depending on risk taken. Methods offering over 10% APY (restaking, yield farming) systematically come with high risk: increased smart contract complexity, risk of impermanent loss, or exposure to newer, less battle-tested protocols.
This is the maturation signal.
When the market stops rewarding cyclical yield and starts rewarding structural yield, the cycle is either in late distribution or early capitulation. The high-APY opportunities that defined 2021 have compressed. The durable fee-based yields that survived 2022 are still paying.
[Staking returns across major chains](https://altcoininvestor.com/crypto-staking-returns-across-chains/) have compressed to 2.5% to 8.5% depending on network. Those yields are structural. [Stablecoin lending yields](https://altcoininvestor.com/how-to-make-money-with-stablecoins/) have compressed to 3.6% to 8.5% depending on platform and risk. Those yields are structural with cyclical variance in rate.
Emission-based farms that advertised 200% APY in 2021 are now advertising 15% to 40% APY in 2026, and most of that comes from token emissions on vesting schedules. Those yields are cyclical.
The allocation decision is visible. Structural yields are paying 2% to 8%. Cyclical yields are paying 15% to 40%. The spread between them is narrowing, which signals we are either in late markup or early distribution. When cyclical yields compress further or disappear, we will be in capitulation.
Readers who hold structural yields through the next phase turn will keep earning. Readers who chase the remaining cyclical yields will watch them go to zero when the turn happens.
## The Takeaway
Structural yield persists across cycles because it comes from protocol fees, staking rewards, or derivatives imbalance that exists independent of market sentiment. Cyclical yield appears during bull markets and disappears during bear markets because it comes from emissions, subsidies, or leverage structures that only function when conditions support them. The readers who confuse the two commit capital at the wrong time and hold through the phase turn when the yield goes to zero. The readers who separate them accumulate structural positions during accumulation, rotate into cyclical positions during markup, rotate back into structural positions during distribution, and hold structural positions through capitulation. That rhythm has worked through three cycles. It will work through the next one.
## Frequently Asked Questions
### What is structural yield in crypto?
Structural yield comes from protocol fees, staking rewards, or derivatives imbalance that persists regardless of market conditions. Aave earns yield from the spread between lending and borrowing rates. Curve earns yield from swap fees. Ethereum staking earns yield from validator rewards. These mechanisms keep paying during bull and bear markets because they derive from actual protocol activity rather than token emissions or subsidies. The rate may compress during bear markets, but the mechanism continues functioning.
### What is cyclical yield in crypto?
Cyclical yield comes from token emissions, protocol subsidies, or leverage structures that only function during specific market phases. Yield farms that advertised 150% to 300% APY in 2021 paid those returns through token emissions. When token price collapsed in 2022, the dollar value of yield went to zero even though the percentage remained nominally high. Cyclical yields appear during bull markets when protocols compete for TVL and disappear during bear markets when programs terminate or tokens lose value.
### How do I identify structural vs cyclical yield before deploying capital?
Open the protocol documentation and locate the fee structure. DeFi aggregators publish APY breakdowns separating protocol fees from token emissions. If 80% of advertised yield comes from emissions, the yield is cyclical. If 80% comes from protocol fees or staking, the yield is structural. Check protocol yield during the 2022 bear market. If it went to zero, it was cyclical. If it compressed but remained positive, it is structural. Ask what market condition would stop the yield. Structural yields require catastrophic failure. Cyclical yields stop when the phase turns.
### Why did 2021 yield farms go to zero by 2023?
Most 2021 yield farms paid returns through token emissions rather than protocol fees. When market conditions turned in 2022, token prices collapsed 85% to 95% and incentive programs terminated. A farm advertising 150% APY paid that rate in token terms, but if the token lost 90% of its value the realized dollar return was negative. COMPOUND topped in May 2021, dropped until June 2022, and formed a double-bottom by June 2023\. Farms that depended on COMP emissions returned zero in dollar terms over that period despite nominally high APYs.
### What yield strategies survive bear markets?
Protocol fee yields, staking rewards, and funding rate carry survive bear markets because they derive from structural activity. Ethereum staking has paid continuously since December 2020 through two bear markets, compressing from 6% to 3% but never stopping. Aave, Curve, and Uniswap kept generating fee revenue through 2022 even as volumes declined. Funding rates on perpetual futures compressed but remained positive because long-short imbalance persists across cycles. These yields compress during bears but continue paying, allowing holders to accumulate and participate in the next recovery.
The Weekly Yield Report
You just reviewed the yield category framework that separates strategies that survive cycles from strategies that go to zero when the phase turns. Those thresholds will compress and expand with the next cycle.
Every Thursday: where crypto yield actually is - stablecoins, liquid staking and DeFi lending, with the risk named next to the rate and what changed since last week.
[Get it free every Thursday](#/portal/signup)
Free. No trade calls, no allocations, no hype. Unsubscribe in one click.
### Best Places To Stake Crypto (With Real Yields)
URL: https://altcoininvestor.com/best-places-stake-crypto-real-yields/
Last updated: 2026-10-07T21:03:49.000Z
## What This List Covers

Coinbase takes 35% of your staking rewards. Kraken takes 26-30%. Lido takes 10%. Solo staking takes zero but costs you capital, hardware, and operational attention. The platform you choose determines what you keep, not just what the headline APY promises.
This is a comparative review of staking venues sorted by risk profile, fee structure, and net yield after all commissions. You will see custodial exchange staking, liquid staking protocols, and native validator staking evaluated on actual returns, slashing history, unstaking timelines, and platform-specific failure modes.
The criteria: real yields net of fees, unstaking delay, platform reliability, and the specific risk you accept. If you care about what lands in your wallet instead of what gets advertised, these numbers matter.
## Custodial Exchange Staking
Exchanges handle validators for you. You deposit your tokens, they run infrastructure, you collect reduced rewards. This is the highest-friction, lowest-yield path, but also the simplest for anyone who already holds assets on a centralized platform.
### Coinbase
Coinbase charges 35% commission on staking rewards. If Ethereum's gross staking yield is around 3%, you net roughly 1.16% after the platform takes its cut. Supported assets include ETH, SOL, ADA, ATOM, DOT, and XTZ.
The advantage: instant unstaking available with a 1% fee. If you need liquidity fast, you pay for it. Otherwise, you wait for network-defined unbonding periods.
Coinbase is the only publicly traded, US-regulated staking platform in this comparison. Its CryptoSlate security score is 8.7 out of 10 as of May 2026\. The regulatory oversight provides some assurance, but centralization risk remains. If Coinbase faces regulatory action or infrastructure failure, your funds become temporarily inaccessible.
Who it's for: users who already custody assets on Coinbase and prioritize ease over yield. Not for anyone optimizing net return.
### Kraken
Kraken offers two staking models. Flexible staking charges 30% commission. Bonded staking uses tiered commission rates between 10% and 26%, depending on the asset and your balance.
Ethereum staking on Kraken typically yields 2.4-4% gross. After 26% commission on bonded ETH, you net around 1.74%. Kraken supports 23 stakeable assets. For higher-yield chains like Polkadot, bonded DOT staking yields 10-14% with a 28-day unbonding period.
Kraken's security score is 9.2 out of 10, the highest among major exchanges in this comparison. It holds ISO/IEC 27001:2022 certification and publishes monthly Merkle-verifiable reserve reports. You can verify that customer deposits match reported liabilities.
No fees to begin or end staking. Kraken takes its percentage from rewards, not from entry or exit.
Who it's for: users who value transparency and slightly better economics than Coinbase, especially on non-Ethereum assets with higher baseline yields.
### Binance
Binance supports over 100 stakeable assets with commission ranging from 9.95% to 39.95%, depending on the token. Ethereum APY sits between 2.5% and 4%, with both flexible and locked options (30, 60, 90, or 120 days).
Binance often offers the highest advertised APYs among major exchanges, sometimes 10-20%+ for certain tokens. The headline numbers look attractive. The commission variance makes net yield unpredictable without checking each asset individually.
The platform operates its own validators, creating the same centralization and regulatory exposure as Coinbase. Binance has faced regulatory scrutiny in multiple jurisdictions, adding jurisdictional risk to the usual platform risk.
Who it's for: traders who prioritize asset selection and are comfortable with variable fee structures. Not for users seeking consistent, transparent fee models.
Exchange staking nets you the least but costs you the least effort. If you are staking small amounts and already hold assets on one of these platforms, the convenience may justify the fee drag. If you are staking meaningful capital, [other platforms deliver better risk-adjusted returns](https://altcoininvestor.com/best-crypto-staking-platform/).
## Liquid Staking Protocols

Liquid staking gives you a receipt token representing your staked position. You earn staking yield and retain liquidity. The token can be sold, used as collateral, or deployed into other DeFi strategies. The trade-off: smart contract risk, governance risk, and sometimes worse yield than native staking.
### Lido (stETH / wstETH)
Lido holds $18.7 billion in total value locked as of May 2026, making it the single largest provider of liquid staked ETH. It controls roughly 23% of all staked ETH, down from a 32% peak in 2023\. That concentration has drawn criticism from decentralization advocates, but it also signals deep liquidity and battle-tested infrastructure.
Current APR for stETH is 2.4%. Lido charges a 10% fee, split between node operators and the DAO. You net around 2.16% after fees. That is better than any custodial exchange in this comparison.
Lido launched a Community Staking Module in early 2026, expanding the validator set to over 400 operators with a minimum bond of 1.4 ETH. This reduces centralization compared to the original curated operator set of around 30 professional validators.
Lido has operated without major smart contract exploits since launch. In October 2026, MetaMask exited Ethereum validators running through Lido after a security incident involving validator reward diversion. No slashing occurred, and no user funds were lost. The incident highlighted infrastructure risk, not protocol risk.
Liquidity for stETH is the deepest in DeFi. You can exit your position through secondary markets without waiting for Ethereum's native unbonding period, which can exceed 45 days depending on the validator exit queue.
Who it's for: users who want better yield than exchanges, need liquidity, and are comfortable with smart contract and governance risk. Lido is the default choice for liquid staking unless decentralization is your primary concern.
### Rocket Pool (rETH)
Rocket Pool holds $922.87 million in TVL, representing roughly 438,324 staked ETH. That is about 5% of Lido's size. TVL declined 22.75% over the 30 days ending May 2026, reflecting either market conditions or competitive pressure.
Current APR for rETH is 2.00%. The protocol charges a 14% commission paid to node operators, who must post RPL collateral to participate. You net slightly less than Lido in most conditions.
Rocket Pool is fully permissionless. It runs approximately 3,900 independent node operators, compared to Lido's curated set. If you prioritize decentralization, Rocket Pool delivers the most credible version of it within liquid staking.
Smart contract risk is comparable to Lido. Rocket Pool has operated without major exploits. Liquidity for rETH is thinner than stETH, so larger positions may experience worse slippage on exit.
Who it's for: users who value decentralization and are willing to accept slightly lower yield and liquidity in exchange. If Lido's market share concentration bothers you, this is the alternative.
### Coinbase Wrapped Staked ETH (cbETH)
Coinbase offers cbETH, a liquid staking token tied to ETH staked through Coinbase validators. It combines the custodial model of exchange staking with the liquidity of a DeFi-compatible token.
The yield on cbETH reflects Coinbase's 35% commission structure, so you are netting around 1.16% after fees. That is worse than Lido or Rocket Pool but better than holding non-liquid staked ETH on Coinbase if you need DeFi composability.
cbETH often trades at a slight discount to spot ETH due to lower liquidity compared to stETH. If you sell cbETH in secondary markets, you may take an additional haircut beyond the fee structure.
Who it's for: Coinbase users who want staking yield and DeFi access but are not willing to move assets off the platform. Not competitive on yield.
Liquid staking protocols offer a middle ground between exchange convenience and solo staking autonomy. You keep more of your yield than on exchanges, you retain liquidity, and you accept smart contract and governance risk. For most allocators staking ETH, Lido or Rocket Pool are the correct choices unless you have strong operational preferences.
## Solo / Native Validator Staking
Solo staking means you run your own validator. You keep 100% of the yield. You also accept 100% of the operational, technical, and capital risk. This is not a beginner path, but it is the only one that eliminates platform and protocol intermediaries.
### Capital and Hardware Requirements
Ethereum requires 32 ETH minimum to activate a validator. After the Pectra hard fork in May 2025, the max effective balance increased to 2,048 ETH per validator, allowing larger operators to consolidate without running hundreds of individual instances.
Hardware requirements: 8-12 core CPU, 64GB RAM, 4TB enterprise NVMe SSD with at least 3 DWPD (drive writes per day), and 100 Mbps symmetric bandwidth. Recommended setup costs roughly 300-600 EUR per month if you rent dedicated hardware. If you run it at home, your upfront cost is higher but recurring cost drops to electricity and internet.
For detailed guidance on setting up a validator, [Ethereum.org provides comprehensive documentation](https://ethereum.org/staking/solo/) on hardware, client software, and security best practices.
### Yield
Base consensus yield for Ethereum is approximately 2.7%. MEV (maximal extractable value) and priority fees lift all-in returns to 3.1-3.3%. You keep all of it. No commission, no protocol fee, no intermediary.
If you are staking through an exchange at 35% commission, solo staking nets you roughly triple the effective yield after accounting for all costs.
### Slashing and Penalty Risk
Slashing occurs only for provable misbehavior: double-signing or surround-voting. These require validator key compromise or serious misconfiguration. The initial slash is 1 ETH (1/32 of the minimum stake). If many validators slash simultaneously, a correlation penalty applies.
Slashing is extremely rare for honest validators. The real operational risk is downtime. Offline validators incur inactivity penalties proportional to how many other validators are also offline at the same time. If you go offline during a period of network stability, the penalty is negligible. If you go offline during a mass outage, the leak is larger.
Downtime does not result in slashing. It results in missed rewards and minor penalties. Uptime above 95% is sufficient to remain net profitable.
### Unstaking and Exit Queue
Ethereum validator exits face a queue that can exceed 45 days during periods of high exit demand. Once you initiate an exit, you stop earning rewards but continue to face inactivity penalties if you go offline before the exit completes.
Re-staking after exit also requires joining the entry queue, which can be several weeks long. This creates opportunity cost if you are moving capital between strategies.
### Who It's For
Solo staking is for allocators with at least 32 ETH, technical competence to manage Linux servers and client software, and willingness to monitor uptime. If you meet those conditions, it is the highest-yield, lowest-trust path available.
If you lack the technical background, hiring a non-custodial staking-as-a-service provider is an option. You retain custody of your validator keys, they manage infrastructure. Fees are typically 5-10%, far better than exchange commissions.
Solo staking eliminates platform, protocol, and governance risk. It replaces those risks with operational responsibility. If you are capable and capitalized, it is the correct choice.
## Comparative Yields and Fee Structures
Here is what you actually keep after all commissions:
- Coinbase ETH: 1.79% gross, 35% commission, approximately 1.16% net
- Kraken ETH (bonded): 2.35% gross, 26% commission, approximately 1.74% net
- Binance.US ETH: 2.60% gross, 9.95-39.95% commission, approximately 1.56-2.34% net
- Lido stETH: 2.4% base, 10% fee, approximately 2.16% net
- Rocket Pool rETH: 2.39% APR, approximately 2.00% net (0.6 percentage points lower than Lido)
- Solo ETH staking: 2.7% base plus MEV, 0% commission, approximately 3.1-3.3% net
The spread between Coinbase and solo staking is roughly 200 basis points. Over a year on 100 ETH, that is the difference between 1.16 ETH and 3.2 ETH in yield. Compounded over multiple years, the gap becomes significant.
Exchanges justify their fees with convenience and regulatory assurance. Liquid staking protocols justify theirs with liquidity and infrastructure management. Solo staking offers neither convenience nor liquidity, but it offers the highest return for those capable of managing it.
## Unstaking Timelines and Liquidity
Exit timelines vary by platform and chain:
- Coinbase: instant unstake available for 1% fee
- Kraken, Binance: depends on asset; flexible staking is instant, bonded staking follows network unbonding periods
- Ethereum native: up to 45 days depending on exit queue
- Polkadot (DOT): 28-day unbonding
- Cosmos (ATOM): 21-day unbonding
- Solana (SOL): 2-4 day unstaking delay
- Lido, Rocket Pool: instant liquidity via secondary market, though you may sell at a discount
Liquidity matters if you need to react to market conditions or reallocate capital. If you are staking for yield and not trading around positions, unbonding periods are less relevant. If you are using staked assets as collateral or farming additional yield in DeFi, liquid staking tokens provide flexibility that locked positions do not.
The cost of that flexibility is the protocol fee and the smart contract risk. Choose based on how often you expect to reallocate and how much yield you are willing to sacrifice for optionality.
## Security, Slashing, and Platform Risk
Platform risk varies by venue type:
Custodial exchanges expose you to regulatory action, platform insolvency, and operational failure. Kraken's ISO certification and reserve attestations reduce but do not eliminate that risk. Coinbase's public company status provides transparency but does not prevent regulatory enforcement. Binance has faced the most regulatory scrutiny of the three.
Liquid staking protocols expose you to smart contract exploits and governance risk. Lido's $18.7 billion TVL makes it a high-value target. Its smart contracts have been audited repeatedly and have operated without major loss since launch. Rocket Pool has a similar track record. The October 2026 MetaMask incident at Lido resulted in no user losses and no slashing, demonstrating that infrastructure issues do not always cascade into protocol failures.
Solo staking exposes you to operational risk. If you misconfigure your validator and double-sign, you will be slashed. If your hardware fails and you stay offline for weeks, you will leak rewards. If you lose your validator keys, your stake becomes unrecoverable. These are risks you manage, not risks imposed by a third party.
Slashing history across Ethereum is negligible. Honest validators running standard client software do not get slashed. The risk is real for misconfigured setups or compromised keys, but it is not a common failure mode.
## Who Each Path Is For
Custodial exchange staking is for users with small positions, limited technical knowledge, and an existing relationship with a regulated platform. You sacrifice yield for simplicity. If you are staking less than 5 ETH and do not intend to move assets off the exchange, the convenience may justify the cost.
Liquid staking protocols are for users who want better yield than exchanges, need liquidity, and are comfortable with smart contract risk. Lido is the default. Rocket Pool is the decentralization-focused alternative. If you are staking 5-30 ETH and want DeFi composability, this is the correct tier.
Solo staking is for users with 32+ ETH, technical ability to run infrastructure, and willingness to monitor uptime. You keep the most yield. You accept operational responsibility. If you meet the capital and skill threshold, this is the highest-return path.
## The Takeaway
The platform you choose determines what percentage of staking yield you keep. Coinbase takes 35%. Lido takes 10%. Solo staking takes zero but requires capital and competence. If you are staking meaningful amounts and cannot run your own validator, [liquid staking protocols offer the best balance of yield and liquidity](https://altcoininvestor.com/best-staking-opportunities-real-return-risk/). If you can run a validator, do it. The yield spread between custodial and solo staking compounds over time into real money.
## Frequently Asked Questions
### What is the actual yield I keep after staking fees?
Net yield depends on the platform commission. Coinbase takes 35%, leaving you around 1.16% on ETH. Kraken takes 26-30%, netting you roughly 1.74%. Lido charges 10%, netting around 2.16%. Solo staking keeps 100% of the 3.1-3.3% all-in yield. The spread between custodial and solo staking is roughly 200 basis points annually.
### How long does it take to unstake and withdraw my crypto?
Unstaking timelines vary by platform and blockchain. Coinbase offers instant unstaking for a 1% fee. Ethereum native staking can take up to 45 days depending on the exit queue. Solana requires 2-4 days. Polkadot takes 28 days. Cosmos takes 21 days. Liquid staking tokens like stETH or rETH provide instant liquidity through secondary markets, though you may sell at a slight discount.
### What happens if my validator gets slashed?
Slashing only occurs for provable misbehavior like double-signing or surround-voting, not for downtime. The initial penalty is 1 ETH (1/32 of minimum stake). If many validators slash simultaneously, correlation penalties apply. Slashing is extremely rare for honest validators running standard client software. Downtime results in missed rewards and minor inactivity penalties, not slashing.
### Is liquid staking safer than running my own validator?
Liquid staking eliminates operational risk but introduces smart contract and governance risk. Lido and Rocket Pool have operated without major exploits, but smart contract vulnerabilities remain possible. Solo staking eliminates third-party risk but requires you to manage uptime, hardware, and key security. Neither is universally safer. The correct choice depends on whether you can competently manage infrastructure.
### Why does Lido have lower fees than Coinbase?
Lido charges 10% because it is a decentralized protocol with lower overhead than a regulated, publicly traded company. Coinbase charges 35% to cover compliance costs, insurance, customer support, and profit margins required by shareholders. Custodial platforms charge more because they provide regulatory assurance and customer service. Liquid staking protocols charge less because they operate as smart contracts with minimal human intervention.
The Weekly Yield Report
You just compared six staking venues with net yields between 1.16% and 3.3%. Those spreads will widen or narrow as fee structures and network conditions shift.
Every Thursday: where crypto yield actually is - stablecoins, liquid staking and DeFi lending, with the risk named next to the rate and what changed since last week.
[Get it free every Thursday](#/portal/signup)
Free. No trade calls, no allocations, no hype. Unsubscribe in one click.
### Institutional Yield Vehicles: ETFs Now Giving Retail Access
URL: https://altcoininvestor.com/crypto-etf-yield-retail-access/
Last updated: 2026-10-07T19:03:58.000Z
## What Regulated Yield Vehicles Retail Investors Can Now Access

Since March 2026, retail investors in the United States can earn staking yield on Ethereum through standard brokerage accounts. BlackRock's iShares Staked Ethereum Trust (ETHB) launched as the first U.S. ETF to hold ETH, stake between 70% and 95% of its holdings, and distribute staking rewards directly to shareholders. Grayscale distributed $9.4 million in Ethereum staking rewards to ETHE investors on January 6, 2026, marking the first time a U.S.-listed crypto exchange-traded product passed on-chain staking income through to shareholders. The regulatory breakthrough came from Revenue Procedure 2025-31, which provided safe harbor rules explicitly allowing ETFs to stake proof-of-stake assets and distribute rewards to investors.
The practical consequence is that regulated income vehicles now exist for retail participants who prefer brokerage-account custody over direct on-chain staking. This article examines what spot ETH staking ETFs deliver in net yield after fees, why spot Bitcoin ETFs do not deliver income at all, and what the specific trade-offs are between holding directly versus holding through an ETF wrapper. It also addresses what the next tranche of applications for Solana, XRP, and other layer-1 protocols will likely change for retail participation in staking income strategies.
## Spot ETH Staking ETFs: Yield Pass-Through Mechanics and Fee Structures
ETHB stakes between 70% and 95% of its ETH via Coinbase Prime and distributes staking rewards monthly. The fund charges a 0.25% sponsor fee, temporarily reduced to 0.12% on the first $2.5 billion in assets. After validator operations, custody, and the sponsor fee, investors receive approximately 2.0% to 2.6% net annually. The fee structure passes 82% of gross staking rewards to investors; the remaining 18% covers validator operations, custody, and BlackRock's margin. At a 3.2% gross yield, that translates to roughly 2.6% gross to investors before the fund's expense ratio is applied.
Grayscale's Ethereum Staking ETF (ETHE) held approximately $3.5 billion in managed tokens as of April 2026 and charges a 2.5% annual fee. Grayscale's Ethereum Staking Mini ETF (ticker: ETH) offers staking exposure at a 0.15% fee with over $1.2 billion in managed tokens. CoinShares Physical Staked Ethereum charges 0% in management fees and passes through 100% of staking rewards. VanEck's staked ETH product targets yields of up to 5% by including maximal extractable value (MEV) rewards alongside base staking income. Morgan Stanley filed an amended S-1 for a spot Ethereum ETF that includes built-in staking, a 0.14% management fee, and a structure that passes 95% of yield to shareholders.
The yield compression is structural. Gross staking APR on Ethereum sits between 3.1% and 3.3% as of 2026, with MEV rewards adding 0.5% to 1.0% for validators using certain software. Most managers only stake 60% to 85% of ETH, keeping a cash buffer so shares remain redeemable at any time. The trade-off is that ETF yields are slightly lower than [direct exchange staking](https://altcoininvestor.com/best-crypto-staking-platform/), where an investor can deploy 100% of their ETH into validators and capture the full network rate. The regulatory reason for the buffer is straightforward: ETH staking inherently involves locking ETH for a period, with total unstaking time in the range of days or weeks. An ETF that stakes 100% of its holdings cannot satisfy daily redemptions without introducing settlement delays or secondary-market discounts. The buffer ensures liquidity.
Management fees range from 0.50% to 0.95% annually for staking-capable ETFs in 2026, reflecting the need for technical monitoring, slashing insurance, and validator management. The composite effect is that a direct staker earning 3.2% gross will net roughly 3.0% after gas and exchange fees, while an ETHB investor will net 2.0% to 2.6% after all deductions. The difference compounds over a decade into a 10% to 20% total return shortfall versus direct staking, assuming the same ETH price path. The trade-off is custody risk, slashing risk on the validator side, and the tax complexity of receiving rewards in kind. Those investors who value brokerage-account custody and simplified tax reporting above maximized yield will find the ETF structure appropriate. Those who can manage private keys and are comfortable with validator selection should stake directly.
## Spot Bitcoin ETFs: Structure, Fees, and Why They Do Not Yield
U.S. spot Bitcoin ETFs have accumulated over $123 billion in assets since launching in January 2024\. The iShares Bitcoin Trust (IBIT) currently ranks as the largest spot Bitcoin ETF by AUM with $70.6 billion and charges a 0.25% expense ratio. Morgan Stanley Bitcoin Trust (MSBT) is the lowest-fee Bitcoin ETF at 0.14%, one basis point below Grayscale Bitcoin Mini Trust (BTC) at 0.15%. GBTC charges a 1.5% expense ratio and remains sizable with $14.9 billion in AUM. Canadian Bitcoin ETFs generally carry higher expense ratios, typically 0.40% to 1.00%, compared to 0.20% to 0.25% in the United States.
A spot Bitcoin ETF holds BTC passively in custody and does not generate income. Bitcoin operates on a proof-of-work consensus mechanism, which does not allow token holders to earn staking rewards. The ETF wrapper introduces an ongoing expense ratio without delivering any offsetting income. If an investor holds $50,000 in a Bitcoin ETF at 0.25% for ten years, they pay approximately $1,400 in cumulative fees. If the same investor holds $50,000 in Bitcoin directly, their ongoing cost is effectively zero beyond the initial trading fee, which typically ranges from 0.10% to 0.50% depending on exchange tier and volume.
Over a 5-year holding period, a $50,000 position in a 0.25% ETF pays roughly $625 in cumulative expense ratio fees. The same amount purchased on an advanced exchange tier at 0.20% costs $100 once, with $0 in ongoing fees. The breakeven point where ETF costs exceed exchange fees typically falls within the first year. The primary justification for holding Bitcoin through an ETF rather than directly is access to traditional retirement accounts such as IRAs or 401(k)s, which allow investments to grow either tax-deferred or tax-free. The second justification is elimination of custody risk, which is material for investors who are uncomfortable managing private keys or do not trust their ability to secure seed phrases over decades.
The comparison between spot BTC ETFs and spot ETH staking ETFs is instructive. A spot Bitcoin ETF imposes a fee drag with no offsetting income. A spot Ethereum staking ETF imposes a fee drag but delivers 2.0% to 2.6% net income annually. The annual drag on the Bitcoin ETF is roughly the full expense ratio. The annual drag on the Ethereum staking ETF is the expense ratio minus the net yield passed through. If ETH goes nowhere in price, the direct staker ends with roughly 6% to 10% more ether than they started with over a 5-year period. The ETHB holder ends with a slightly smaller dollar balance because of fees, but still receives positive net income. The IBIT holder ends with a smaller dollar balance because of fees, with no offsetting income. Over a decade, the difference compounds to a 30% to 65% total return shortfall versus direct ETH staking, depending on the specific fee structure and staking rate. The choice is not between ETF and direct staking; the choice is between accepting the fee compression in exchange for brokerage-account custody or managing the technical complexity and custody risk yourself.
### Tax Treatment and Custody Implications
The IRS wash sale rule applies to Bitcoin ETFs because they are securities. Direct cryptocurrency holdings are still in a gray area regarding wash sales, though proposed legislation may extend the rule to crypto. Staking rewards are taxable income in most jurisdictions. ETF investors receive 1099 forms reflecting distributed yields, adding tax complexity that passive Bitcoin ETF holders avoid. The practical consequence is that staking ETF investors pay ordinary income tax rates on distributions, which range from 10% to 37% depending on bracket, while direct holders who reinvest their staking rewards pay ordinary income tax on the fair market value at the time of receipt. Both structures are taxed identically at the federal level for staking income, but the ETF structure simplifies reporting by issuing a consolidated 1099 rather than requiring the investor to track each staking reward event individually.
Custody risk is the primary reason institutional allocators and risk-averse retail investors prefer ETF structures. Fidelity Digital Assets handles custody for FBTC, not Coinbase, which is structurally unique among major spot ETFs and eliminates dependency on Coinbase infrastructure. Investors who can hold ether directly capture the yield ETFs forfeit. The trade-off is custody risk, slashing risk on the validator side, and the tax complexity of receiving rewards in kind. For investors with IRAs, 401(k)s, or other tax-advantaged accounts, the ability to hold crypto exposure inside those wrappers is worth the fee compression. For taxable accounts, the calculation depends on whether the investor values custody simplicity above yield maximization.
## Comparing ETF to Direct Holdings: Fees, Taxes, and Custody Trade-Offs
The fee comparison is straightforward. A $50,000 position in ETHB at 0.25% pays $125 annually. The same amount staked directly on Coinbase at 3.0% APY earns $1,500 in gross rewards, minus approximately $100 in annual gas fees for claiming and restaking, netting $1,400\. After the ETHB fee and yield pass-through, the ETF investor receives approximately $1,000 to $1,300 in net distributions. The difference is $100 to $400 per year, which compounds over five years to $500 to $2,200 in foregone income. The trade-off is that the direct staker must manage private keys, select validators, monitor for slashing events, and track every staking reward event for tax reporting. The ETF investor receives a 1099 and holds the position in the same brokerage account where they hold equities and bonds.
The custody trade-off is material. Direct holders control their private keys and eliminate counterparty risk, but assume the risk of key loss, phishing, and validator slashing. ETF holders delegate custody to regulated entities such as Coinbase Prime or Fidelity Digital Assets, which introduces counterparty risk but eliminates the technical complexity of self-custody. The regulatory structure provides some protection: ETF custodians are subject to SEC oversight, and the ETF structure segregates investor assets from the sponsor's balance sheet. That segregation did not exist for exchange-held assets prior to the ETF launches, which is why the [Bitcoin ETF](https://altcoininvestor.com/what-are-bitcoin-etfs-how-investors-can-make-money/) approval in January 2024 was treated as a significant de-risking event for institutional allocators.
The liquidity constraint is specific to staking. ETH staking requires locking ETH for a period, with unstaking delays of several days to weeks depending on the queue. ETF managers keep 15% to 40% of holdings unstaked to satisfy daily redemptions. The direct staker who needs liquidity must either unstake and wait or sell the staked position on a secondary market, which may trade at a discount. The ETF investor can sell shares on the secondary market at any time during market hours, with settlement in T+1\. The trade-off is yield compression in exchange for immediate liquidity.
### When Direct Holding Makes Sense, When ETF Structure Makes Sense
Direct holding makes sense for investors who can manage private keys, are comfortable with validator selection, prioritize yield maximization over custody simplicity, and operate in taxable accounts where the additional reporting complexity is manageable. ETF structure makes sense for investors who value brokerage-account custody, need to hold crypto exposure inside IRAs or 401(k)s, prefer simplified tax reporting, or do not want to manage the technical complexity of validator selection and slashing monitoring. The regulatory reason the ETF structure exists is that a significant class of investors is prohibited from holding crypto directly either by custodial constraints or by fiduciary rules. The ETF wrapper solves that problem at the cost of 60 to 100 basis points in annual yield compression.
## Next Tranche: Solana, XRP, and Other Layer-1 Applications
As of April 2026, 92 crypto exchange-traded funds are awaiting SEC review. Solana leads with eight pending applications, followed by XRP with seven. Experts assign 95% odds to approval for Solana, XRP, and Litecoin ETFs within 2026\. Amended Solana filings from VanEck, Bitwise, and 21Shares added staking and in-kind redemption language; final comment windows opened in October 2025\. The template created by ETHB now applies to Solana, Cardano, Polkadot, and every other proof-of-stake chain. The regulatory breakthrough that enabled staking ETFs came from Revenue Procedure 2025-31, which provided safe harbor rules explicitly allowing ETFs to stake proof-of-stake assets and distribute rewards to investors.
The practical consequence is that retail investors will soon have brokerage-account access to staking yield on every major layer-1 protocol. Solana's staking yield currently runs between 6.0% and 7.5% gross, which after the same 18% to 30% fee compression that applies to ETHB would net investors 4.2% to 6.0% annually. XRP does not use a staking mechanism, so XRP ETFs will resemble Bitcoin ETFs: fee drag with no offsetting income. The distinction between proof-of-stake and non-staking protocols becomes a first-order variable in ETF selection for income-focused investors.
The trade-off remains yield compression. Direct stakers earn the full network rate. ETF investors receive rewards minus management fees, validator fees, and operational costs. Grayscale's first distribution suggests investors might capture 60% to 70% of raw staking yields after all frictions. For Solana at 7.0% gross, that translates to 4.2% to 4.9% net. For Cardano at 4.5% gross, that translates to 2.7% to 3.2% net. The fee compression is smaller in absolute terms on higher-yielding chains, which is why Solana ETF applications will likely attract more income-focused allocators than lower-yielding Ethereum ETFs.
The institutional adoption question is whether traditional allocators will treat staking ETFs as fixed-income substitutes. A 4.5% to 5.0% net yield on a Solana ETF competes directly with short-duration Treasury yields, which sat between 4.0% and 5.0% in early 2026\. The difference is that Treasury yields are denominated in dollars, while staking ETF yields are denominated in the underlying token. An investor who receives 5.0% net yield in SOL but experiences a 20% decline in SOL price has a negative total return. That volatility disqualifies staking ETFs from the fixed-income allocation for most institutional mandates, but it does not disqualify them from the alternatives allocation, where 5.0% yield plus exposure to layer-1 protocol growth is an appropriate risk-return profile.
### What Changes for Retail Participation
The most significant change is access. Prior to staking ETF approval, retail investors who wanted staking yield had three options: hold on an exchange that offers staking services, run a validator themselves, or delegate to a liquid staking protocol. The first option introduces counterparty risk, as demonstrated by the FTX collapse. The second option requires technical expertise that most retail investors do not possess. The third option requires interacting with smart contracts, managing gas fees, and tracking tax events for every reward distribution. The ETF wrapper eliminates all three friction points at the cost of 60 to 100 basis points in annual yield compression.
The second change is tax simplification. Direct staking generates taxable income at the fair market value of each reward distribution. An investor who receives staking rewards daily must track 365 separate income events per year. An ETF investor receives a single 1099 at year-end. The administrative burden reduction is material for investors who are not already tracking DeFi positions. The third change is regulatory clarity. Staking services offered by exchanges exist in a gray area; the [SEC's enforcement action against Kraken](https://altcoininvestor.com/how-does-binance-earn-work-cex-yield/) in February 2023 alleged that staking-as-a-service constitutes an unregistered securities offering. The ETF structure is explicitly registered under the Investment Company Act of 1940, which removes the regulatory ambiguity that has prevented institutional allocators from using exchange-based staking services.
## The Takeaway
Spot ETH staking ETFs deliver 2.0% to 2.6% net annual yield to retail investors who hold through brokerage accounts, after fees and validator costs. Spot Bitcoin ETFs deliver zero income and impose a 0.14% to 0.25% annual fee drag. The choice between ETF structure and direct holding depends on whether the investor values brokerage-account custody and simplified tax reporting above yield maximization. For income-focused investors, the next tranche of staking ETFs for Solana, Cardano, and other layer-1 protocols will likely deliver 4.0% to 6.0% net yields, which compete with short-duration fixed-income instruments on a nominal basis but carry token-price volatility that disqualifies them from traditional fixed-income allocations. The regulatory precedent set by ETHB in March 2026 now applies to every proof-of-stake protocol. The template is established. The question for retail investors is whether the custody simplification and tax reporting convenience justify the 60 to 100 basis points in annual yield compression that the ETF structure imposes. For investors who can manage private keys and track staking rewards for tax purposes, direct staking remains the higher-yield option. For investors who cannot or do not want to manage that complexity, the ETF wrapper provides compliant access to institutional-grade staking yield through regulated channels.
## Frequently Asked Questions
### What net yield do spot Ethereum staking ETFs deliver to retail investors?
Spot Ethereum staking ETFs deliver approximately 2.0% to 2.6% net annual yield after all fees, validator costs, and the sponsor's expense ratio. BlackRock's ETHB passes 82% of gross staking rewards to investors, retaining 18% for validator operations, custody, and margin. At a 3.2% gross staking yield, investors receive roughly 2.6% before the fund's 0.25% expense ratio. The yield compression reflects the cost of brokerage-account custody, liquidity buffers for redemptions, and simplified tax reporting compared to direct staking.
### Why do spot Bitcoin ETFs not generate any income for investors?
Spot Bitcoin ETFs hold BTC passively in custody and do not generate income because Bitcoin operates on a proof-of-work consensus mechanism, which does not allow token holders to earn staking rewards. The ETF wrapper introduces an ongoing expense ratio ranging from 0.14% to 1.5% annually without delivering any offsetting income. Direct Bitcoin holders pay a one-time exchange fee but incur zero ongoing costs, making the ETF structure a net drag on returns unless the investor values brokerage-account access or needs exposure inside tax-advantaged retirement accounts.
### What is the fee difference between holding a staking ETF versus staking directly?
A $50,000 position in a 0.25% staking ETF pays $125 annually in management fees and receives approximately $1,000 to $1,300 in net staking distributions. The same amount staked directly at 3.0% APY earns $1,500 in gross rewards, minus approximately $100 in annual gas fees, netting $1,400\. The ETF investor foregoes $100 to $400 per year in income, which compounds to $500 to $2,200 over five years. The trade-off is that the ETF investor avoids custody risk, validator selection complexity, and individual tax event tracking.
### How does the tax treatment differ between staking ETFs and direct staking?
Both staking ETFs and direct staking generate ordinary income taxed at rates from 10% to 37% depending on bracket. The ETF structure simplifies reporting by issuing a single 1099 form at year-end, while direct stakers must track each staking reward event individually, which can be 365 separate income events per year. The IRS treats staking rewards as taxable income at the fair market value when received, regardless of whether they are earned directly or passed through an ETF wrapper. The ETF structure does not change the tax liability; it only consolidates the reporting.
### What will Solana and XRP ETFs deliver in net yield if approved?
Solana staking ETFs will likely deliver 4.2% to 6.0% net annual yield to investors, assuming the same 18% to 30% fee compression that applies to Ethereum staking ETFs. Solana's current gross staking yield runs between 6.0% and 7.5%. XRP does not use a staking mechanism, so XRP ETFs will resemble Bitcoin ETFs and deliver zero income while imposing an annual expense ratio of 0.15% to 0.50%. The distinction between proof-of-stake protocols and non-staking protocols becomes a first-order variable in ETF selection for income-focused investors.
The Weekly Yield Report
You have just compared three regulated yield structures delivering 0.0% to 6.0% net income through brokerage accounts. Those yields will shift next month as Solana and Cardano ETFs launch.
Every Thursday: where crypto yield actually is - stablecoins, liquid staking and DeFi lending, with the risk named next to the rate and what changed since last week.
[Get it free every Thursday](#/portal/signup)
Free. No trade calls, no allocations, no hype. Unsubscribe in one click.
### What Is Staking? A Complete Beginner's Guide With Real Numbers
URL: https://altcoininvestor.com/what-is-crypto-staking-beginners-guide/
Last updated: 2026-10-07T15:06:02.000Z
## What Staking Actually Means

Staking is how proof-of-stake blockchains pay you to help secure the network. You lock cryptocurrency in a wallet that runs validator software. That software proposes new blocks and verifies transactions. In exchange, the network pays you a percentage of your stake annually, usually between 3% and 7%.
The rewards come from two sources: new tokens minted by the network (inflation rewards) and fees paid by users who submit transactions. Ethereum validators earn roughly 3-4% APY. Solana validators earn 6-7%. Cardano pays 3-4% with no lockup period required.
This is different from mining. Mining uses computing power to solve puzzles and secure proof-of-work blockchains like Bitcoin. Staking replaces that energy-intensive process with financial commitment. You prove your stake in the network by locking tokens, not by running expensive hardware.
Here is the key point beginners miss: staking rewards are yield, not appreciation. If you stake $1,000 of ETH at 4% APY, you earn $40 in new ETH over one year. But if ETH's price drops 20% during that year, your $1,000 becomes $800, and your $40 in rewards doesn't offset the $200 loss. Yield and price move independently.
## How Staking Rewards Are Generated
Validators earn rewards every time they propose a new block or attest to someone else's block. The network distributes these rewards automatically, usually within minutes or days depending on the blockchain.
On Ethereum, validators are randomly selected to propose blocks. When your validator is chosen, it bundles pending transactions into a block, proposes it to the network, and collects the transaction fees users paid plus a small amount of newly minted ETH. Other validators then attest that your block is valid. Both proposing and attesting earn rewards.
The reward rate depends on how much of the network's total supply is staked. When fewer people stake, rewards go up to attract more validators. When more people stake, rewards go down because the network doesn't need additional security. Ethereum's APY has fallen from 5% in 2022 to roughly 3% in 2026 because 32% of all ETH is now staked.
Solana works similarly but distributes rewards every epoch, roughly every two days. Cardano pays rewards every five days. The rhythm varies, but the mechanism is the same: validators do work, the network pays them, and if you delegate your tokens to a validator, you receive a share of those rewards minus the validator's commission.
### Real Yield vs Nominal Yield
Most staking APY numbers you see are nominal. They don't account for token inflation.
Ethereum issues new ETH to pay stakers, but it also burns a portion of every transaction fee through EIP-1559\. During high network activity, more ETH gets burned than issued, making ETH deflationary. During low activity, issuance exceeds burn, and supply grows slightly. Over the long run, ETH inflation averages 0.5-1% annually. That means a 3.5% staking APY delivers roughly 2.5-3% real yield after inflation.
Solana pays 6-7% nominal APY but has programmed inflation that started at 8% annually and declines roughly 15% per year toward a 1.5% floor. In 2026, Solana's inflation sits around 5-6%. That means a 7% staking APY delivers roughly 1-2% real yield after inflation.
Cardano's inflation is around 4% annually. A 4% staking APY delivers close to 0% real yield after inflation.
Real yield matters because it tells you whether you are getting ahead or just keeping pace with token dilution. Ethereum's low nominal APY often delivers better real returns than networks with higher headline rates.
## What Can Go Wrong: Slashing, Lockups, and Price Risk
Three major risks affect staking positions: slashing, liquidity lockup, and price volatility. Each one matters differently depending on which network you stake on and how you stake.
### Slashing Risk
Slashing is a penalty for validator misbehavior. If a validator double-signs a block, proposes conflicting blocks, or goes offline for an extended period, the network confiscates a portion of its staked tokens. On Ethereum, slashing penalties start at roughly 1 ETH and can escalate if many validators are slashed at the same time.
Here is what triggers slashing on Ethereum: proposing two different blocks for the same slot, attesting to two conflicting blocks, or surrounding a previous attestation with a new one. These are protocol violations that require either malicious intent or catastrophic software failure. Routine downtime does not trigger slashing. If your validator goes offline for a few hours, you miss rewards and pay small inactivity penalties, but you don't lose principal.
If you delegate to a validator run by someone else, slashing risk transfers to the operator. Your tokens can still be slashed if the operator makes a mistake, but reputable validators have strong uptime records and rarely get slashed. Coinbase, Kraken, Lido, and Rocket Pool have multi-year track records with no major slashing incidents.
Cardano has no slashing. Delegators never lose principal, even if the pool operator shuts down. Solana has slashing rules in theory, but in practice slashing events are extremely rare and almost never affect delegators.
### Lockup and Liquidity Risk
Many staking protocols require you to lock tokens for a fixed period before you can withdraw. Ethereum staking used to require indefinite lockup. Now withdrawals are enabled, but you join an exit queue when you unstake. The queue can take anywhere from 9 to 50 days depending on how many other validators are exiting at the same time. ETF demand in 2026 has pushed Ethereum's validator queue to multi-year highs, which extends withdrawal times.
Solana requires a 2-3 day unbonding period. When you unstake, your tokens remain locked for roughly two epochs before they become liquid again. During that time, you can't sell or transfer them.
Cardano has no lockup. You can unstake anytime, and your ADA remains liquid throughout the staking period. This makes Cardano the most beginner-friendly option for anyone worried about getting locked in.
Lockup risk matters most during market downturns. If the price drops 30% while your tokens are locked, you can't exit to stop the loss. You ride the volatility whether you want to or not.
### Price Volatility
Price risk is the biggest risk in staking. Your APY means nothing if the token's price falls faster than you earn rewards.
Here is a worked example. You stake $10,000 of ETH at 4% APY. After one year, you earn $400 in rewards. If ETH's price stays flat, you end with $10,400, a 4% gain. If ETH appreciates 20% during the year, your $10,000 becomes $12,000, plus $400 in rewards, for a total of $12,400 and a 24% gain. If ETH drops 20%, your $10,000 becomes $8,000, plus $400 in rewards, for $8,400 total and a 16% loss.
The 4% yield does not protect you from the 20% price drop. Staking earns income, but it doesn't hedge volatility.
This is why many beginners prefer [liquid staking tokens](https://altcoininvestor.com/liquid-staking-tokens-beginner-guide/) like stETH or rETH. These tokens represent your staked position but remain tradeable. If the market crashes and you need to exit, you can sell your stETH on a DEX without waiting for the unbonding period. The price risk is the same, but the liquidity risk is lower.
## Your First Staking Position Under $1,000
If you have under $1,000 to stake, I recommend Cardano (ADA) as your first position. Here is why.
Cardano has no minimum stake, no lockup period, and no slashing risk. You delegate ADA to a stake pool through your wallet. Your tokens never leave your custody. The pool operator does the validator work, takes a small commission (usually 2-3%), and distributes rewards to delegators every five days. If the pool shuts down or underperforms, you can redelegate to a different pool anytime with no penalty.
At current rates, Cardano pays roughly 3-4% APY. On $1,000, that's $30-$40 per year. Not life-changing, but enough to learn how staking works without risking lockup or slashing.
Here is how to do it. Buy ADA on Coinbase, Kraken, or Binance. Transfer it to a self-custody wallet like Yoroi or Daedalus. Open the staking tab in your wallet, browse the list of stake pools, pick one with consistent uptime and reasonable fees, and delegate. The first reward arrives in 15-20 days. After that, rewards compound every epoch.
Total cost: zero beyond the ADA purchase. Cardano's transaction fees are a fraction of a cent.
### Ethereum Staking for Beginners
If you prefer Ethereum, [liquid staking services](https://altcoininvestor.com/best-crypto-staking-platform/) like Lido, Rocket Pool, or Coinbase accept any amount. You don't need the 32 ETH required for solo staking. You deposit ETH, receive a liquid staking token (stETH, rETH, or cbETH), and start earning rewards immediately.
On $1,000 of ETH at 3.5% APY, you earn $35 per year. The advantage over Cardano is Ethereum's better risk-adjusted return. ETH has lower inflation, stronger network effects, and a deflationary mechanism that can turn positive real yield during high activity periods. The disadvantage is the unbonding queue, which can take weeks if you decide to exit.
For a detailed walkthrough of exchange staking, validator selection, and fee structures, read [How To Start Staking Crypto: A Beginner's Complete Guide](https://altcoininvestor.com/how-to-start-staking-crypto-beginner/).
### Solana for Higher Nominal Yield
Solana offers 6-7% APY with a 2-3 day unbonding period. On $1,000, that's $60-$70 per year. The higher nominal yield is attractive, but remember that Solana's inflation is around 5-6% in 2026, so your real yield after dilution is only 1-2%.
Solana staking works through delegation, similar to Cardano. You choose a validator, delegate your SOL, and start earning rewards within one epoch (roughly two days). Transaction fees on Solana are a fraction of a cent, so the entry cost is negligible.
The trade-off is Solana's higher price volatility. SOL swings more than ETH or ADA. If you're risk-averse, the extra 3% nominal yield doesn't compensate for the wider price bands.
## Exchange Staking vs Self-Custody
You can stake directly on exchanges like Coinbase, Kraken, Binance, or Gemini without moving tokens to a self-custody wallet. The advantage is simplicity. You click "stake," confirm, and start earning. The disadvantage is the exchange takes a cut, usually 25-40% of your rewards.
Coinbase charges roughly 25% commission on ETH staking rewards. If the network pays 4% APY, you receive 3%. Kraken's fee structure is similar. Binance's fees vary by token but average 15-25% commission.
Self-custody staking through wallets like Yoroi (Cardano), Phantom (Solana), or Lido (Ethereum) lets you keep 100% of network rewards minus only the validator's commission, which is typically 2-5%. On a $1,000 position, the difference between 25% exchange commission and 3% validator commission is roughly $8-$10 per year. Not huge, but it compounds over time.
The operational risk is higher with self-custody. You manage your own seed phrase, approve transactions yourself, and choose validators without exchange vetting. If you lose your seed phrase or pick a bad validator, the exchange won't help you. For beginners, I recommend starting on an exchange for your first $500-$1,000, then moving to self-custody once you understand the workflow. To compare fee structures and break-even points, see [Exchange Staking vs Self-Custody Staking: Real Yield and Risk](https://altcoininvestor.com/staking-on-exchange-vs-own-wallet/).
## When Staking Makes Sense and When It Doesn't
Staking makes sense when you plan to hold a token for at least six months and want to earn yield on an otherwise idle position. If you believe ETH, ADA, or SOL will appreciate or hold value over the medium term, staking turns a static holding into an income-generating asset.
Staking does not make sense if you are trading actively, if you need liquidity on short notice, or if the token's price volatility exceeds your risk tolerance. A 4% APY on a token that drops 30% is a bad trade.
Staking also does not make sense as a way to "try out" a token you don't already want to hold. The yield is too low to justify speculative positions. If you wouldn't buy and hold ADA for six months without staking, you shouldn't stake it either.
Here is the decision tree I use. If I'm holding ETH long-term anyway, I stake it and capture the 3-4% yield. If I'm holding a smaller alt for speculation, I don't stake it because I want liquidity when the price moves. If I'm unsure whether I want exposure to a token, I don't stake it until I've decided on the hold period.
For more on when staking fits into a broader yield strategy, see [A Beginner's Guide to Staking and Yield Farming in Cryptocurrency](https://altcoininvestor.com/guide-to-staking-and-yield-farming-in-crypto/).
## Common Mistakes Beginners Make
The first mistake is chasing the highest APY without checking unbonding periods or inflation rates. A 15% APY on a token with 12% inflation is worse than 4% APY on a token with 0.5% inflation. Always subtract inflation to calculate real yield.
The second mistake is staking more than you can afford to lock up. If you stake $5,000 of ETH and the market crashes two weeks later, you can't unstake and exit quickly. The unbonding queue takes days or weeks. Only stake capital you won't need for at least three months.
The third mistake is ignoring validator commission. Some validators charge 10-15% commission, others charge 2-3%. On a $1,000 position earning 5% gross APY, the difference between 3% and 10% commission is $35 vs $45 net annual return. Check the fee before you delegate.
The fourth mistake is assuming staking is risk-free because it's not trading. Staking carries price risk, liquidity risk, and slashing risk. It's safer than leverage or DeFi farming, but it's not a savings account.
The fifth mistake is staking on an exchange without understanding how withdrawals work. Some exchanges batch unstaking requests and process them weekly. Others have minimum withdrawal amounts or charge withdrawal fees. Read the fine print before you stake.
For a deeper post-mortem on the mistakes that cost real money, see [The 5 Beginner Crypto Mistakes That Cost You Real Money](https://altcoininvestor.com/common-crypto-mistakes-beginners/).
## Tax Treatment of Staking Rewards
The IRS treats staking rewards as ordinary income at the fair market value on the day you receive them. If you earn 10 ADA in rewards and ADA is worth $0.50 when the reward arrives, you owe income tax on $5\. When you later sell those 10 ADA, you owe capital gains or losses on the difference between $5 and the sale price.
This is the same tax treatment as interest income or freelance income. Staking rewards are not capital gains. They are ordinary income.
Most validators and exchanges don't issue 1099 forms for staking rewards under certain thresholds, but you are still required to report the income. You track the date, amount, and fair market value of each reward yourself. If you stake through an exchange, the platform may provide a CSV export with this data. If you stake via self-custody, you use a block explorer or third-party tax software to reconstruct your reward history.
For the full IRS position and what "dominion and control" means for staking, see [Crypto Staking Tax Treatment: What The IRS Actually Says](https://altcoininvestor.com/crypto-staking-tax-treatment-irs/).
## The Takeaway
Staking lets you earn 3-7% APY on proof-of-stake tokens by helping secure the network. Ethereum pays 3-4%, Solana pays 6-7%, and Cardano pays 3-4% with no lockup. Real yield is lower once you subtract token inflation. Price volatility is the biggest risk, followed by liquidity lockup and slashing.
Your first staking position should be under $1,000\. Cardano is the safest starting point because it has no lockup, no slashing, and no minimum. Delegate through Yoroi or Daedalus, pick a pool with good uptime, and expect your first reward in 15-20 days. That $30-$40 annual yield teaches you the workflow without exposing you to the risks of higher-yield networks.
Once you understand how delegation works, how rewards arrive, and how to redelegate if needed, you can move to Ethereum or Solana for better risk-adjusted returns or higher nominal yield. Until then, keep the position small and treat it as tuition.
## Frequently Asked Questions
### How much can I realistically earn from staking $1,000?
On $1,000 staked, you'll earn $30-$40 per year with Ethereum or Cardano at 3-4% APY, or $60-$70 per year with Solana at 6-7% APY. These are gross rewards before validator commission and inflation. Real yield after accounting for token dilution is typically 1-3% annually. Price changes matter more than yield. If your token drops 20% while you earn 4% APY, you still lose 16% overall.
### Can I lose money staking crypto?
Yes, in three ways. First, price volatility. If the token drops 30% while staked, your 4% yield doesn't offset the loss. Second, slashing. Validators can lose a portion of staked tokens for misbehavior, though this rarely affects delegators on reputable platforms. Third, lockup risk. If you need liquidity during a market crash but your tokens are locked in unbonding, you can't exit quickly. Cardano has no lockup or slashing, making it the safest option for beginners.
### What is the difference between staking on an exchange and self-custody staking?
Exchange staking is simpler but costs more. Coinbase and Kraken take 25-40% of your rewards as commission. Self-custody staking through wallets like Yoroi or Phantom lets you keep 97-98% of rewards, paying only the validator's 2-3% commission. The trade-off is operational risk. You manage your own seed phrase, choose validators, and approve transactions yourself. Start on an exchange for your first $500, then move to self-custody once you understand the workflow.
### Is staking safe for beginners?
Staking is safer than leverage trading or high-risk DeFi farming, but it's not risk-free. You face price volatility, liquidity lockup, and small slashing risk. Cardano is the safest beginner option because it has no lockup period and no slashing. Your ADA stays liquid, and you can unstake anytime. Ethereum and Solana have unbonding periods of 9-50 days and 2-3 days respectively. Start with under $1,000 on Cardano to learn the mechanics before staking larger amounts.
### How is staking taxed in the United States?
The IRS treats staking rewards as ordinary income at fair market value on the day you receive them. If you earn 10 ADA worth $5 total, you owe income tax on $5\. When you later sell those 10 ADA, you owe capital gains or losses on the difference between $5 and the sale price. This applies whether you stake on an exchange or through self-custody. Most platforms don't issue 1099 forms for staking, so you track dates, amounts, and values yourself using block explorers or tax software.
The Weekly Yield Report
You now have APY ranges for Ethereum, Solana, and Cardano, plus the lockup and slashing risks that matter in 2026\. Those rates and queue times change every quarter.
Every Thursday: where crypto yield actually is - stablecoins, liquid staking and DeFi lending, with the risk named next to the rate and what changed since last week.
[Get it free every Thursday](#/portal/signup)
Free. No trade calls, no allocations, no hype. Unsubscribe in one click.
### Robinhood Adds Bitcoin to Treasury, Signals Shift in Regulated Income Access
URL: https://altcoininvestor.com/robinhood-bitcoin-treasury-income-implications/
Last updated: 2026-10-10T18:00:06.000Z
## Robinhood Discloses First Corporate Bitcoin Holding

Robinhood added $25 million worth of Bitcoin, approximately 294 BTC, to its corporate balance sheet, marking the first proprietary BTC holding by the platform. Johann Kerbrat, Senior Vice President and General Manager of Crypto and International, disclosed the purchase on October 7, 2026, framing it as a signal of the company's commitment to the crypto sector. The acquisition places Robinhood alongside Tesla, Block, MARA Holdings, CleanSpark, and Riot Platforms, a cohort of public companies now holding BTC as a treasury asset. Together, these entities account for well over 1.2 million BTC in corporate reserves.
For income-focused readers, the significance is not the dollar amount. Robinhood's market capitalization sits around $100 billion. The $25 million represents a 0.025% allocation, a rounding error in treasury terms. The signal matters because Robinhood operates under SEC registration as a broker-dealer and FINRA oversight as a securities intermediary. The decision to hold Bitcoin on the corporate balance sheet reflects a view, vetted by legal and compliance functions within a regulated entity, that BTC is an acceptable corporate treasury asset under current regulatory guidance. That view has downstream implications for the income products Robinhood may offer and the precedent it sets for other regulated intermediaries evaluating BTC-adjacent yield strategies.
## What the Purchase Says About Regulatory Comfort with BTC as a Corporate Asset
Robinhood's status as a [publicly-traded, SEC-registered broker-dealer](https://altcoininvestor.com/bitcoin/) operating under FINRA oversight means the decision to hold Bitcoin as a corporate asset was not made lightly. The company's legal, compliance, and treasury functions would have reviewed the accounting treatment under ASC 350-30, which currently requires companies to classify cryptocurrency holdings as indefinite-lived intangible assets, recognizing impairment losses but not subsequent recoveries in value until sale. This accounting regime is unfavorable compared to the mark-to-market treatment available for many other financial assets, yet public companies continue to adopt BTC as a reserve asset despite the reporting disadvantage.
The regulatory posture toward corporate BTC holdings has evolved since the SEC's 2017-2021 enforcement wave. The agency has not challenged corporate treasury allocations to Bitcoin in the same manner it has pursued unregistered securities offerings or unlicensed staking programs. The distinction is material: holding Bitcoin as a treasury asset does not trigger the same statutory questions under Section 5 of the Securities Act or Section 15 of the Exchange Act that arise when a company offers yield-bearing products to retail customers. Robinhood's decision suggests internal counsel views BTC as sufficiently distinct from securities to warrant balance sheet allocation by a registered broker-dealer.
For readers evaluating income strategies, the precedent is relevant in two ways. First, it reinforces the regulatory distinction between holding Bitcoin and offering Bitcoin-based income products. The former is increasingly acceptable for regulated entities; the latter remains contested, particularly when yield is generated through staking, lending, or other mechanisms the SEC has argued may constitute securities transactions. Second, it suggests that regulated platforms with significant retail reach are becoming more comfortable with BTC exposure, which may precede the launch of compliant income products that incorporate Bitcoin as a component.
## Robinhood's Broader Crypto Push and Income Product Implications
The Bitcoin treasury purchase coincides with [Robinhood's expansion into perpetual futures trading and plans for its own blockchain](https://www.theblock.co/news/business/2026-10-07-robinhood-adds-25-million-bitcoin-balance-sheet-417890), both of which carry direct implications for income product availability. Perpetual futures on crypto assets typically generate funding rate payments, a form of income paid between long and short traders to maintain price alignment with the underlying spot market. If Robinhood launches regulated perpetual futures products for its 28 million funded accounts, 27 million of which are U.S.-based, those products would operate under CFTC jurisdiction rather than SEC oversight, a critical distinction for yield generation.
The CFTC has been more accommodating than the SEC regarding crypto derivative products, having approved Bitcoin futures on CME as far back as 2017 and granting designated contract market (DCM) status to several digital asset platforms. Funding rate income from perpetual futures, if offered through a CFTC-registered platform, would carry a different regulatory and tax profile than yield generated through staking or lending programs that the SEC has targeted. The funding rate payments are classified as ordinary income rather than capital gains, but they do not trigger the same unregistered securities concerns that have led to enforcement actions against staking-as-a-service providers like Kraken and Coinbase.
Robinhood's international footprint, with 1 million funded accounts outside the U.S. and wallet services available in over 120 countries, also matters for income strategy design. MiCA, the EU's Markets in Crypto-Assets regulation, took full effect in December 2024 and established a framework for crypto-asset service providers (CASPs) to offer staking and other yield services under regulatory authorization. If Robinhood pursues CASP licensing in EU jurisdictions, it could offer staking income products to European users under a compliance regime that is more permissive than the current U.S. framework. The regulatory divergence between jurisdictions creates an arbitrage opportunity for platforms with global reach, allowing them to offer income products in markets where the legal pathway is clearer while remaining cautious in the U.S.
## The Precedent of Corporate BTC Holdings for Institutional Yield Vehicles
The cohort of public companies now holding Bitcoin as a treasury asset has grown to include not only crypto-native firms like MARA and CleanSpark but also diversified technology companies like Tesla and Block. The aggregate BTC held by these entities, over 1.2 million BTC, represents a disclosed institutional allocation that has been vetted by public company boards, audit committees, and external auditors operating under Sarbanes-Oxley compliance requirements. This is institutional adoption in its most conservative form, limited to corporate treasury allocation rather than customer-facing yield products, but it establishes a baseline of regulatory comfort that may support the next phase of product development.
Institutional yield vehicles for Bitcoin, such as staking ETFs for proof-of-stake assets or covered call strategies for BTC, require a foundation of regulatory acceptance for the underlying asset. The SEC's approval of spot Bitcoin ETFs in January 2024 was a milestone in that direction, but the agency has not yet approved a Bitcoin staking ETF or a yield-generating Bitcoin product for retail investors. Corporate treasury adoption by regulated entities like Robinhood does not directly enable those products, but it reinforces the precedent that [Bitcoin is a legitimate corporate asset](https://altcoininvestor.com/strategy-buys-1-25b-btc/) rather than a speculative instrument outside the bounds of prudent financial management.
For income-focused readers, the question is when corporate treasury adoption translates into regulated yield products. The pathway is clearer for derivative-based income strategies, such as covered call or cash-secured put programs on Bitcoin, which can be structured under existing options market rules without triggering unregistered securities concerns. Staking income for proof-of-stake assets remains contested in the U.S., with the SEC's enforcement actions against Kraken and Coinbase signaling that the agency views many staking-as-a-service offerings as securities transactions. Until that question is resolved through rulemaking or judicial precedent, institutional yield products for staking will likely remain limited to non-U.S. jurisdictions or to accredited investor channels that operate under exemptions from registration.
## What Robinhood's Move Does Not Address
Robinhood's Bitcoin treasury purchase does not resolve the central regulatory question for income-focused readers: what yield strategies on Bitcoin and other digital assets are legally available to U.S. retail investors through regulated platforms? The company's decision to hold BTC on its balance sheet is a corporate treasury allocation, not a retail product offering. It signals institutional comfort with Bitcoin as an asset class, but it does not create a legal pathway for Robinhood to offer staking income, lending yield, or liquidity provision returns to its customer base under current SEC guidance.
The SEC's enforcement posture toward yield-generating crypto products has been aggressive and consistent. The agency's cease-and-desist order against Kraken in February 2023, which resulted in a $30 million settlement and the termination of Kraken's U.S. staking program, established that the SEC views many staking arrangements as unregistered securities offerings under the Howey test. The subsequent Wells notice to Coinbase in March 2023, citing similar concerns about staking services, reinforced that posture. Neither of those enforcement actions has been reversed or narrowed by subsequent rulemaking, and the legal precedent they establish remains binding on platforms evaluating whether to offer staking income to U.S. retail customers.
Robinhood's disclosure does not indicate whether the company plans to offer Bitcoin-based income products, and if so, through what legal structure. The platform has historically been cautious about regulatory risk, having paid a $65 million SEC settlement in 2020 related to best execution disclosures and a $70 million FINRA fine in 2021 for systems outages and misleading communications. That track record suggests Robinhood is unlikely to launch a staking or lending product for Bitcoin without either explicit regulatory approval or a significant shift in the SEC's enforcement posture. Readers evaluating income opportunities through Robinhood should not interpret the treasury purchase as a signal that BTC yield products are imminent on the platform.
## The Takeaway
Robinhood's $25 million Bitcoin treasury allocation is a signal of institutional legitimacy, not a product launch. The decision by a regulated broker-dealer with 28 million funded accounts to hold BTC as a corporate asset reinforces the precedent that Bitcoin is an acceptable reserve for entities operating under SEC and FINRA oversight. That precedent supports the longer-term trajectory toward regulated Bitcoin yield products, particularly derivative-based income strategies that generate returns through options premiums or funding rates rather than staking or lending arrangements the SEC has challenged. For income-focused readers, the relevant follow-on signal is whether Robinhood or similarly positioned platforms begin offering those products to retail customers under a compliant legal structure. Corporate treasury adoption is a necessary precursor, but it is not sufficient. The regulatory pathway for retail BTC income products in the U.S. remains contested, and the precedents that will resolve it are being set in enforcement actions and court filings, not in corporate disclosures.
## Frequently Asked Questions
### Does Robinhood's Bitcoin purchase mean they will offer BTC yield products?
No. Robinhood's $25 million Bitcoin treasury allocation is a corporate asset holding, not a customer-facing product. The company has not announced plans to offer Bitcoin staking, lending, or other yield products. Corporate treasury adoption by a regulated broker-dealer signals institutional legitimacy for BTC, but it does not create a legal pathway for retail yield products under current SEC enforcement posture. Readers should not interpret the treasury purchase as indicating imminent BTC income offerings on the platform.
### What is the regulatory difference between holding Bitcoin and offering Bitcoin yield?
Holding Bitcoin as a corporate treasury asset does not trigger SEC registration requirements under Section 5 of the Securities Act. Offering Bitcoin-based yield products, particularly through staking or lending, may constitute unregistered securities offerings under the Howey test, as indicated by the SEC's enforcement actions against Kraken and Coinbase. The distinction is material: regulated entities like Robinhood can hold BTC on their balance sheet while remaining cautious about offering yield products that might be deemed securities transactions requiring registration.
### How does Robinhood's regulated status affect its Bitcoin strategy?
Robinhood operates as an SEC-registered broker-dealer under FINRA oversight, meaning its Bitcoin treasury purchase was vetted by legal, compliance, and treasury functions aware of regulatory constraints. The company's history includes significant SEC and FINRA settlements, suggesting institutional caution about regulatory risk. This regulated status means any future Bitcoin yield products would need to comply with securities laws, CFTC derivative rules, or operate under MiCA in international markets where the regulatory pathway is clearer than in the U.S.
### What income products could Robinhood offer on Bitcoin under current regulation?
Derivative-based income strategies, such as covered call or cash-secured put programs on Bitcoin, could be offered under existing options market rules without triggering unregistered securities concerns. If Robinhood launches CFTC-regulated perpetual futures, funding rate income from those products would be legally distinct from staking yield. Staking income for proof-of-stake assets remains contested in the U.S. due to SEC enforcement actions. Compliant Bitcoin income products are more likely to emerge through derivative strategies than through staking or lending arrangements.
### How does corporate Bitcoin adoption affect institutional yield vehicle availability?
Corporate treasury adoption by regulated entities like Robinhood, Tesla, and Block reinforces Bitcoin's legitimacy as a corporate asset, which supports the foundation for institutional yield vehicles. The SEC approved spot Bitcoin ETFs in January 2024, but has not yet approved Bitcoin staking ETFs or yield-generating products for retail investors. Corporate adoption does not directly enable those products, but it establishes precedent that BTC is a legitimate asset class, which may precede regulatory approval for compliant institutional yield structures.
The Weekly Yield Report
You have just reviewed how Robinhood's $25 million Bitcoin treasury purchase signals institutional legitimacy without enabling retail yield products yet. That regulatory landscape will shift as enforcement actions and rulemakings resolve what income strategies are compliant.
Every Thursday: where crypto yield actually is - stablecoins, liquid staking and DeFi lending, with the risk named next to the rate and what changed since last week.
[Get it free every Thursday](#/portal/signup)
Free. No trade calls, no allocations, no hype. Unsubscribe in one click.
### Crypto Staking Tax Treatment: What The IRS Actually Says
URL: https://altcoininvestor.com/crypto-staking-tax-treatment-irs/
Last updated: 2026-10-07T00:03:41.000Z
## What The IRS Says About Staking Rewards

The IRS issued Revenue Ruling 2023-14 on July 31, 2023\. That document establishes the agency's formal position: you must include the fair market value of staking rewards in gross income in the year you gain dominion and control over them. This applies to every form of staking, whether you operate a solo validator, delegate through a liquid staking protocol, or stake via a centralized exchange.
The ruling does not say "when the reward is earned." It does not say "when the reward is credited to your validator balance." It says when you acquire dominion and control, which the IRS defines as the ability to sell, transfer, or otherwise dispose of the asset. For most stakers using exchange staking or direct delegation protocols, dominion and control arises immediately when the reward is credited to your account. For validators with withdrawal credentials, dominion arises when the reward becomes theoretically withdrawable, even if you do not actually withdraw it.
This is ordinary income, not capital gains. The character matters because ordinary income rates reach 37% at the federal level, while long-term capital gains top out at 20%. If you are [earning staking rewards through a validator or platform](https://altcoininvestor.com/best-crypto-staking-platform/), you report that income on the day you gain control, at the fair market value on that date, and you pay ordinary income tax on that value.
## The Dominion And Control Test
Dominion and control is a tax concept borrowed from case law on when taxpayers constructively receive income. The test asks whether you have unfettered access to the asset. Can you sell it? Can you transfer it? Can you spend it? If the answer is yes, you have dominion and control, and the income is taxable.
For exchange staking, the test is simple. When Coinbase or Kraken credits your account with staking rewards, you can immediately trade, withdraw, or transfer those tokens. You have dominion and control. The reward is taxable on the date it appears in your account.
For validators running Ethereum nodes, the analysis is slightly more complex. Consensus-layer rewards accrue to your validator balance but may not be withdrawable immediately depending on your withdrawal credentials and whether your validator is in the exit queue. The IRS has not issued explicit guidance on whether income recognition is deferred until the validator can actually withdraw. The safer position, and the one most tax professionals recommend, is to recognize income when the reward is credited to your validator and becomes theoretically withdrawable, not when you actually execute the withdrawal.
For locked staking, the question is genuinely unsettled. If a protocol locks your rewards for a fixed period and you cannot sell, transfer, or otherwise access them, there is a plausible argument that dominion and control does not arise until the unlock. The IRS has never ruled on this edge case. The conservative position is to report at the time of crediting. The aggressive position is to defer until unlock. If you take the aggressive position, document your reasoning and understand that the IRS could challenge it on audit.
If a platform freezes customer accounts after you have already received and controlled rewards, the freeze does not retroactively eliminate your dominion and control. If you earned 0.5 ETH in staking rewards on Celsius in May 2022 and Celsius froze withdrawals in June 2022, you still owe tax on the 0.5 ETH you controlled in May, even though you can no longer access it. The IRS does not care whether the asset is later lost, stolen, or inaccessible. Income recognition is based on the moment of control, not on whether you successfully convert the asset to fiat.
## How Fair Market Value Is Determined

Rev. Rul. 2023-14 specifies that the amount of includible income equals the fair market value of the reward on the date you gain dominion and control. The ruling does not prescribe a specific valuation method. That means taxpayers have discretion, within reason, to choose a pricing source and aggregation method.
For a single large reward, the fair market value is straightforward: use the spot price on the exchange where you would sell the asset, at the exact timestamp the reward was credited. CoinGecko, CoinMarketCap, and exchange APIs all provide historical price data. Most tax software pulls from one or more of these sources automatically.
For high-frequency rewards, valuation becomes tedious. Solana stakers earn rewards roughly every two to three days, which amounts to more than 150 discrete income events per year. Ethereum validators on some setups earn rewards after every finalized epoch. Tracking the exact fair market value at the timestamp of every reward crediting is technically correct but operationally burdensome.
The IRS has not formally endorsed aggregation methods, but tax professionals widely accept reasonable approximations as long as the result is roughly accurate. Common methods include:
- Month-end aggregation: sum all rewards credited during the month, value them at the spot price on the last day of the month
- Weighted average: calculate the average price over the period during which rewards were credited, apply that average to the total amount received
- Snapshot at receipt: use the exact price at the moment each reward is received (most accurate, most burdensome)
If you use aggregation, document your methodology. If the IRS challenges your valuation on audit, you need to demonstrate that your method is reasonable and consistently applied. Switching methods year to year to minimize reportable income is a red flag.
One additional complexity: cryptocurrency prices are volatile. If SOL trades at $150 when you receive a reward and you report $150 of ordinary income, then SOL drops to $80 before you sell, you still owe tax on the $150\. This is phantom income. The IRS does not allow you to retroactively adjust your income based on subsequent price changes. Your only remedy is a capital loss when you eventually sell, which offsets other gains but does not reduce your ordinary income tax.
## Validator Operators vs. Delegators: The Self-Employment Tax Question
Rev. Rul. 2023-14 does not address whether staking rewards are subject to self-employment tax. Self-employment tax is an additional 15.3% federal tax on net earnings from a trade or business. If your staking activity constitutes a trade or business under the test articulated in Commissioner v. Groetzinger, you owe self-employment tax on top of ordinary income tax. If your staking activity is passive investment, you do not.
The line between trade-or-business and passive investment is fact-intensive. Courts consider factors such as:
- Regularity and continuity of the activity
- Profit motive
- Time and effort invested
- Whether the activity is the taxpayer's primary source of income
- Whether the taxpayer holds themselves out as being in the business
For solo validators running multiple nodes with specialized hardware, continuous monitoring, and active participation in consensus, the trade-or-business characterization is stronger. If you operate 50 Ethereum validators, purchase dedicated servers, monitor uptime daily, and treat validation as a primary income source, the IRS could argue you are engaged in a trade or business and assess self-employment tax.
For passive delegators who stake through a liquid staking protocol or exchange, the passive investment characterization is stronger. If you deposit ETH into Lido through a web interface, check your balance occasionally, and do not actively participate in validation, you are likely not engaged in a trade or business. Self-employment tax does not apply.
The IRS has not provided a safe harbor. Until it does, validators should consult a tax professional and document the facts supporting their characterization. If you treat your activity as a trade or business, you can deduct business expenses such as hardware, electricity, cloud hosting, and internet costs. If you treat it as passive investment, you cannot deduct those costs, but you also avoid the 15.3% self-employment tax.
## Liquid Staking Tokens: The Unsettled Gray Area
When you swap ETH for stETH or SOL for mSOL, have you disposed of your original asset and triggered a taxable event? The IRS has never answered this question. Rev. Rul. 2023-14 is silent on liquid staking tokens.
The conservative position treats the swap as a taxable crypto-to-crypto trade. Under Notice 2014-21, exchanging one cryptocurrency for another is a disposition that triggers capital gains or losses. If you acquired 1 ETH for $1,500 and later swap it for 1 stETH when ETH trades at $2,000, you have a $500 capital gain. When you later redeem stETH for ETH, that is another taxable event.
The aggressive position treats liquid staking tokens as ownership receipts that represent beneficial ownership of the underlying asset. Under this theory, minting stETH is analogous to receiving a coat-check ticket or an American Depositary Receipt. You retain beneficial ownership of the ETH. No taxable event occurs at minting or redemption. You only recognize a taxable event when you sell the LST for a different asset or when the LST accrues value through rebasing or reward distribution.
Some tax professionals compare LSTs to like-kind exchanges, which were tax-deferred under IRC Section 1031 until the Tax Cuts and Jobs Act limited 1031 treatment to real property in 2018\. That theory no longer works. Cryptocurrency does not qualify for like-kind treatment.
Notice 2024-57, issued by the IRS in December 2024, temporarily exempted wrapping and unwrapping transactions from broker reporting requirements pending further study. That tells you the government itself has not decided how to characterize these transactions for tax purposes. The exemption applies only to broker reporting, not to substantive tax treatment, but it is a signal that the IRS recognizes the ambiguity.
If you use [liquid staking protocols to earn yield](https://altcoininvestor.com/crypto-staking-returns-across-chains/), you should assume the conservative position unless and until the IRS provides explicit guidance. Treat the swap as a taxable event, report the gain or loss, and track your cost basis in the LST separately. If the IRS later clarifies that LSTs are non-taxable ownership receipts, you can amend your return. If you take the aggressive position and the IRS later rules against you, you will owe back taxes, penalties, and interest.
## The Two-Layer Tax Hit
Staking rewards trigger tax twice. The first tax event occurs when you receive the reward. You report ordinary income equal to the fair market value at receipt. That value becomes your cost basis in the reward tokens.
The second tax event occurs when you sell, spend, or swap the reward. If the price has increased since you received the reward, you have a capital gain. If the price has decreased, you have a capital loss. The character of the gain or loss depends on your holding period. If you hold the reward for more than one year before disposing of it, the gain is long-term and taxed at preferential rates. If you dispose within one year, the gain is short-term and taxed at ordinary income rates.
Here is a worked example. You stake 10 ETH through Lido. On March 15, 2024, you receive 0.1 ETH in staking rewards. ETH trades at $3,500 on that date. You report $350 of ordinary income. Your cost basis in the 0.1 ETH is $350.
On October 1, 2024, you sell the 0.1 ETH for $4,000\. You have a short-term capital gain of $50 ($400 sale price minus $350 cost basis). You pay ordinary income tax on that $50 gain, in addition to the $350 of ordinary income you already reported in March.
If you hold the 0.1 ETH until March 16, 2025, and then sell for $4,000, the $50 gain is long-term and taxed at lower capital gains rates.
The two-layer structure means high-frequency stakers face significant record-keeping burdens. Every reward establishes a new tax lot with its own cost basis and holding period. If you earn rewards daily, you could have hundreds of distinct tax lots by year-end. [Crypto tax software](https://altcoininvestor.com/best-crypto-tax-software/) handles this automatically by importing transaction histories from exchanges and wallets, matching cost basis using FIFO, LIFO, or specific identification, and generating the capital gains schedules required for IRS Form 8949.
## What Rev. Rul. 2023-14 Does Not Address
The ruling answers one question clearly: staking rewards are ordinary income when you gain dominion and control. It does not answer several other questions that matter to stakers:
- When does dominion and control arise for validators with locked or restricted withdrawal credentials?
- How does the ruling apply to accrual-method taxpayers? The ruling explicitly addresses only cash-method taxpayers.
- Are liquid staking token minting and redemption taxable events?
- Are staking rewards subject to self-employment tax?
- How are MEV rewards and execution-layer rewards on Ethereum treated? The ruling mentions only consensus-layer rewards.
- What aggregation or valuation methods are acceptable for high-frequency reward crediting?
The IRS typically fills gaps like these through additional guidance, private letter rulings, or enforcement actions. Until it does, taxpayers must make judgment calls. Conservative taxpayers should assume the IRS will take the position that maximizes tax revenue. Aggressive taxpayers should document their reasoning and understand the audit risk.
## Documentation Requirements
If you stake cryptocurrency, you need to track the following for every reward:
- Date and time of receipt (exact timestamp if possible)
- Amount received (quantity of tokens)
- Fair market value at the moment of dominion and control
- Cost basis for later capital gains calculation
- Source of the reward (validator address, exchange account, delegation protocol)
For validators, you should also track:
- Business expenses if you are treating validation as a trade or business (hardware, electricity, hosting, internet)
- Uptime and performance metrics if you are subject to slashing risk
- Separate income streams (consensus rewards vs. execution rewards vs. MEV)
For exchange stakers, most platforms provide CSV exports of reward history. Import those files into [crypto tax software that supports staking income](https://altcoininvestor.com/best-crypto-tax-software-defi-yield-staking/). The software will calculate fair market value at receipt and generate the IRS forms you need.
For on-chain stakers using protocols like Lido, Rocket Pool, or Marinade, you need to pull transaction data from the blockchain. Most tax software integrates with Ethereum and Solana RPCs to import staking reward transactions automatically. If your protocol is not supported, you may need to export data manually using a block explorer and upload it to your tax software.
The IRS now requires brokers and exchanges to report gross proceeds from digital asset sales on Form 1099-DA starting in 2025\. That form will include staking rewards received through the exchange. If your exchange reports $1,000 of staking income to the IRS and you fail to report it on your return, the IRS will send you a notice. Match your records to the 1099-DA and report accurately.
## The Jarrett Case And The Property-Creation Argument
In Jarrett v. United States, taxpayers Joshua and Jessica Jarrett argued that staking rewards should not be taxed until disposition because the rewards were newly created property, analogous to a farmer growing crops or a manufacturer producing inventory. The IRS refunded their taxes and moved to dismiss the case as moot before the court reached the merits. The district court granted the motion. The underlying property-creation argument was never adjudicated.
Rev. Rul. 2023-14 does not adopt the Jarrett theory. The ruling treats staking rewards as compensation for validation services, not as newly created property. The IRS has signaled clearly that it will not accept the property-creation argument. If you rely on that theory to defer income recognition, you are taking an unsupported position that the IRS will likely challenge.
## The Takeaway
Rev. Rul. 2023-14 establishes that staking rewards are ordinary income when you gain dominion and control. For most stakers, that means income recognition at the moment the reward is credited and available for sale, transfer, or withdrawal. The ruling does not address liquid staking token swaps, self-employment tax, or the precise timing of dominion and control for validators with restricted withdrawal credentials. Those questions remain open, and taxpayers must make judgment calls in the absence of explicit guidance. The safe approach is to report conservatively, track every reward with timestamp and fair market value, and use [tax software that handles staking income correctly](https://altcoininvestor.com/is-koinly-free/). The two-layer tax structure means staking rewards are taxed once as ordinary income when received and again as capital gains or losses when disposed. That is the regulatory reality, regardless of what token prices do afterward.
## Frequently Asked Questions
### Are crypto staking rewards taxable as ordinary income or capital gains?
Staking rewards are taxable as ordinary income at fair market value when you gain dominion and control over them, according to IRS Rev. Rul. 2023-14\. This is not capital gains treatment. When you later sell or dispose of the rewards, the difference between your sale price and the value you reported as income triggers a second tax event, which is characterized as capital gain or loss depending on your holding period.
### When do I owe tax on staking rewards if they are locked or restricted?
The IRS has not issued explicit guidance on locked staking rewards. The conservative position is to report income when the reward is credited to your account, even if you cannot immediately withdraw it. The aggressive position is to defer income recognition until the unlock date when you actually gain dominion and control. Most tax professionals recommend the conservative approach to avoid audit risk.
### Is swapping ETH for stETH a taxable event?
The IRS has not ruled on whether minting or redeeming liquid staking tokens is taxable. The conservative position treats the swap as a taxable crypto-to-crypto exchange under Notice 2014-21, triggering capital gains or losses. The aggressive position treats LSTs as ownership receipts that do not create a taxable event. Notice 2024-57 exempted these transactions from broker reporting pending further study, signaling the IRS has not resolved the question.
### Do I owe self-employment tax on staking rewards?
Rev. Rul. 2023-14 does not address self-employment tax. Whether you owe it depends on whether your staking activity constitutes a trade or business under the Groetzinger test. Solo validators running multiple nodes with specialized hardware likely face self-employment tax. Passive delegators staking through exchanges or liquid staking protocols likely do not. The determination is fact-intensive and the IRS has provided no safe harbor.
### How do I determine fair market value for high-frequency staking rewards?
The IRS requires you to use the fair market value on the date you gain dominion and control but does not prescribe a specific method. For high-frequency rewards, taxpayers commonly aggregate rewards monthly or use a weighted average price over the crediting period. The IRS has not formally endorsed aggregation methods, but tax professionals accept reasonable approximations as long as the methodology is documented and consistently applied.
Tool mentioned above
Koinly
Koinly imports from 800+ exchanges and wallets and handles the DeFi cases most tools get wrong - rebasing tokens, LP positions, staking rewards.
[Try Koinly](https://koinly.io/?via=F6E2E35A&utm%5Fsource=affiliate)
We may earn a commission if you sign up through this link, at no cost to you. It does not change what gets recommended.
The Weekly Yield Report
You just reviewed the IRS position on staking rewards, MEV, liquid staking ambiguity, and self-employment tax. That position will evolve as the agency fills the gaps Rev. Rul. 2023-14 left open.
Every Thursday: where crypto yield actually is - stablecoins, liquid staking and DeFi lending, with the risk named next to the rate and what changed since last week.
[Get it free every Thursday](#/portal/signup)
Free. No trade calls, no allocations, no hype. Unsubscribe in one click.
### When To Accumulate Ethereum For Staking: Cycle Framework
URL: https://altcoininvestor.com/when-to-buy-ethereum-for-staking/
Last updated: 2026-10-06T23:03:24.000Z
## The Question: When Should You Accumulate Ethereum for Staking?

The question appears straightforward: when is the right time to buy Ethereum if you plan to stake it? Most people answer with a price target. That approach misses the point. The right time to accumulate ETH for staking is not defined by a price level. It is defined by cycle phase. The pattern has repeated three times now, and each time the accumulation window opened long before anyone felt comfortable buying.
If you are building a position in Ethereum with the intention of running a validator or holding staked ETH across multiple years, your entry timing determines your cost basis, and your cost basis determines the real yield you earn from staking. A validator earning 4% APY on ETH bought at $1,200 earns very different real returns than the same validator earning 4% APY on ETH bought at $4,000\. The accumulation phase is where those differences are locked in.
This is not a price prediction. This is a framework for recognizing when the cycle has entered the phase where patient capital accumulates quality assets for long-term income deployment. You apply it yourself. The pattern does not repeat with precision, but it rhymes with enough consistency that recognition is possible.
## What Accumulation Phase Behavior Looks Like

Accumulation is a specific market structure, not a price range. It appears after capitulation has exhausted selling pressure and before markup begins. The behavior is recognizable because it has repeated in every Ethereum cycle since 2016\. In 2018-2019, Ethereum fell from $1,400 to $83 in the capitulation phase, then spent 18 months building a consolidation range between $100 and $360 before the 2020-2021 markup began. In 2022-2023, Ethereum fell from $4,867 to $881, then spent 15 months consolidating between $880 and $2,100 before the next cycle leg.
The [crypto market cycle](https://altcoininvestor.com/crypto-market-cycles-altcoin-timing/) follows a rhythm: capitulation, accumulation, markup, distribution. Each phase has characteristic price behavior, volume patterns, and on-chain signals. Accumulation is the phase where price stops making lower lows, begins defending a range, and shows repeated tests of support that hold. It is not exciting. It feels late when you are in it because the worst of the prior collapse is over. It feels early in hindsight because the next markup has not yet begun.
In both 2018-2019 and 2022-2023, accumulation phase behavior included the following: multiple successful defenses of a key support level, declining volatility as the range tightened, and rising staking participation as long-term holders committed capital. The staking signal is particularly relevant. When validators are willing to lock 32 ETH for an indefinite period, they are signaling cycle-scale conviction. That conviction builds during accumulation, not during euphoria.
Currently, Ethereum sits in late markdown transitioning into early accumulation. Price reclaimed its realized price in August 2026 following an 18% rally, a historically bullish signal. ETH trades roughly 53% below its August 2025 all-time high of $4,946, a drawdown consistent with prior accumulation-phase entries. Staking participation crossed 30% of total supply in February 2026 and continues rising, with over 36 million ETH staked. That is not distribution behavior. That is accumulation behavior.
## How to Distinguish Accumulation from Distribution

The two phases look similar on a price chart. Both can involve range-bound trading. Both can show periods of low volatility. The difference is in what happens at the range boundaries. In accumulation, the lows hold and build higher-low structure over time. In distribution, the highs fail and build lower-high structure. The market absorbs supply in accumulation. The market absorbs demand in distribution.
Price proximity to realized price is one of the most reliable markers. Realized price represents the average cost basis of all coins based on when they last moved on-chain. When market price sits below realized price for an extended period, the average holder is underwater. When price reclaims realized price and holds it, the average holder has returned to breakeven and the market has absorbed prior selling pressure. Ethereum spent months below realized price in mid-2026, then reclaimed it in August. That transition marks the shift from capitulation to accumulation.
On-chain staking momentum provides another distinguishing signal. Staking participation grew from 29.3% at the end of 2025 to over 30% within six weeks in early 2026\. That acceleration indicates conviction. Validators do not commit 32 ETH into a staking contract during distribution. They commit during accumulation, when they expect the next cycle leg to justify locking capital for years. The withdrawal data supports this: since the Shanghai upgrade enabled withdrawals in April 2023, only 1.98 million ETH has been withdrawn, roughly 3% of staked supply. The rest remains locked, earning yield and signaling long-term accumulation.
Support level defense matters. Ethereum has defended $2,000 support multiple times across the current cycle. That level represents a higher low relative to the prior capitulation low near $880\. Each successful defense builds confidence that accumulation is in progress. Each failed defense raises the question of whether the cycle has stalled. So far, the defenses have held. That pattern is consistent with accumulation, not distribution.
## The Staking Mechanism and Why Entry Timing Matters
To run an Ethereum validator, you need exactly 32 ETH. That ETH is locked into the staking contract, where it secures the network and earns rewards. Current staking yields range from 3.5% to 5.5% for solo validators, depending on performance and MEV-boost participation. Liquid staking through platforms like Lido delivers slightly lower yields after fees, typically 3% to 5%, but provides a tradeable stETH token in return. Exchange staking offers the lowest yields, generally 2.5% to 4.5%, but removes operational complexity.
The yield is paid in ETH. If you accumulate 32 ETH at $1,200 and stake it for five years earning 4% annually, you will have accumulated approximately 6.4 additional ETH in rewards. If you accumulate 32 ETH at $4,000 and stake it under identical conditions, you still accumulate 6.4 ETH in rewards, but your dollar-cost entry is more than three times higher. The staking yield does not change. Your cost basis does. That is why accumulation phase timing matters for staking positions.
The [Ethereum staking](https://ethereum.org/staking/) mechanism has evolved since the Merge in September 2022\. Withdrawals became possible with the Shanghai upgrade in April 2023\. The Pectra upgrade in 2025 introduced auto-compounding for rewards above 32 ETH and raised the maximum effective balance to 2,048 ETH for institutional operators. These changes improved the staking experience, but they did not change the fundamental income mechanism: you lock ETH, secure the network, and earn ETH rewards. The earlier in the cycle you accumulate that ETH, the better your real returns.
Running a solo validator requires technical infrastructure: a machine with 8 to 12 cores, 64 GB RAM, a 4 TB enterprise NVMe drive, and 100 Mbps bandwidth. You run both an execution client and a consensus client. If the validator goes offline, you miss rewards. If the validator misbehaves, you face slashing penalties where part of your stake is destroyed. These risks are real, but they are operational, not cycle-based. Accumulating during the right cycle phase reduces your cost basis regardless of whether you solo stake or use a liquid staking protocol.
## Cycle Patterns: What Happened in 2018-2019 and 2022-2023
Ethereum has completed three full cycles, and the accumulation phase appeared in the same position each time. The 2016-2018 cycle peaked near $1,400 in January 2018, capitulated to $83 in December 2018, and spent 2019 consolidating between $100 and $360\. Staking did not exist yet, so accumulation behavior showed in on-chain holder age and exchange outflows. ETH moved off exchanges and into cold storage. Long-term holders accumulated. The markup began in early 2020, and by November 2021 ETH had reached $4,867.
The 2020-2021 cycle peaked in November 2021, capitulated through 2022 as the Merge transitioned Ethereum to proof-of-stake, and bottomed near $881 in June 2022\. The accumulation phase ran from mid-2022 through late 2023, with ETH consolidating between $880 and $2,100\. Staking went live with the Merge, and participation climbed steadily. The validators who committed 32 ETH at $1,000 during that accumulation phase locked in cost basis that justified staking yields across the next several years. The validators who waited until $3,500 in early 2024 locked in cost basis that made the same staking yield far less attractive on a real-return basis.
The current cycle peaked near $4,946 in August 2025, entered markdown through late 2025 and mid-2026, and now shows early accumulation signals. Price reclaimed realized price. Staking participation continues rising. Support near $2,000 has held multiple tests. If the pattern repeats, this is the phase where patient capital accumulates ETH for staking positions that will earn yield across the next three to five years. The pattern does not guarantee the outcome, but it does provide the framework for recognizing the opportunity when it appears.
One consistent marker across all three cycles: the accumulation phase feels uncertain while you are in it. The prior collapse is fresh. The next rally has not yet begun. Conviction is difficult. That difficulty is the signal. By the time accumulation feels comfortable, the markup has already started and the cost basis advantage is gone.
## When Accumulation Timing Matters and When It Does Not
If you are building a position to stake for multiple years, accumulation phase timing is one of the highest-leverage decisions you will make. The difference between accumulating at $1,200 and accumulating at $4,000 is the difference between earning real yield and earning nominal yield that barely compensates for inflation and opportunity cost. The [staking platform](https://altcoininvestor.com/best-crypto-staking-platform/) you choose matters. The validator uptime you maintain matters. But the cost basis you lock in by accumulating during the right cycle phase matters more than either of those.
If you are trading ETH with a six-month time horizon, cycle-phase accumulation timing matters far less. Traders respond to momentum, volatility, and range breakouts. Those signals appear across all cycle phases. But this framework is not for traders. It is for the validator who will lock 32 ETH for three years, the liquid staking participant who will hold stETH across the next two cycles, and the income allocator building a position that earns structural yield regardless of where price goes in the next markup.
The framework also matters less if you are dollar-cost averaging into ETH over multiple years without regard to cycle position. DCA smooths entry volatility and removes timing risk, but it also removes the opportunity to concentrate accumulation during the phase where cost basis advantages are highest. A hybrid approach works: DCA consistently, but increase accumulation rate during confirmed accumulation phases. That captures some timing advantage without requiring perfect cycle recognition.
What this framework does not do: it does not tell you the exact price bottom. It does not guarantee that ETH will not fall further after you begin accumulating. It does not eliminate risk. What it does do: it gives you a repeatable structure for recognizing when the market has entered the phase where long-term holders historically accumulate quality assets for income positions that span cycles. You still choose your own risk tolerance, position size, and staking method. The framework simply helps you recognize when the conditions align.
## What the Current Cycle Position Suggests
As of October 2026, Ethereum shows multiple accumulation-phase markers. Price reclaimed realized price after spending months underwater. Staking participation crossed 30% and continues rising, with over 36 million ETH locked. Support near $2,000 has held repeated tests, forming higher lows relative to the mid-2022 capitulation low. Withdrawal data shows minimal unstaking despite withdrawals being enabled for over three years. These are not distribution signals. These are accumulation signals.
The current cycle has followed the three-year-four-month rhythm visible in prior Bitcoin and Ethereum cycles. The 2022 bottom appeared in June. Adding 40 months suggests the next markup phase could begin in late 2025 or early 2026, which aligns with current accumulation-phase behavior. The pattern is not a clock. It is a rhythm. Sometimes the rhythm runs fast, sometimes slow, but the sequence remains consistent: capitulation, accumulation, markup, distribution.
If you are accumulating ETH to stake, the current phase offers the conditions that historically precede multi-year markup legs. You are not buying at the exact bottom. You are buying in the range where long-term holders accumulate and where cost basis advantages compound over the life of a staking position. The [cycle bottom](https://altcoininvestor.com/how-to-recognize-crypto-cycle-bottom/) may already be behind us. It may still be ahead. What matters is that the phase has shifted from capitulation to accumulation, and accumulation is where patient capital builds positions for the next cycle leg.
The staking yield itself provides durability. Validators earning 4% to 5% annually in ETH rewards earn that yield regardless of price. The yield is structural, not cyclical. It comes from protocol-level rewards for securing the network, not from temporary incentive programs that disappear when the bull market ends. That structural yield justifies holding staked ETH across the full cycle, but the real return depends entirely on the cost basis locked in during accumulation.
## The Takeaway
You accumulate Ethereum for staking during the accumulation phase, not during the markup phase. The accumulation phase is identifiable by price reclaiming realized price, staking participation rising, support levels holding, and long-term holder conviction building. It has appeared in the same cycle position three times in a row. It is appearing again now. The pattern does not repeat with precision, but it rhymes with enough consistency that recognition is possible. If you wait until the markup begins, you will still be able to stake ETH and earn yield. You will simply earn that yield on a cost basis that is two to four times higher than the cost basis available during accumulation. The choice is yours. The cycle will continue regardless.
## Frequently Asked Questions
### What is the best time to buy Ethereum for staking?
The best time to accumulate Ethereum for staking is during the accumulation phase of the market cycle, not based on a specific price. This phase appears after capitulation when price reclaims realized price, staking participation rises, and support levels hold. Historically, this has occurred 12 to 18 months after major cycle bottoms in 2018-2019 and 2022-2023\. Accumulating during this phase locks in a lower cost basis, which improves real staking returns across multiple years.
### How much Ethereum do I need to start staking?
To run a solo Ethereum validator, you need exactly 32 ETH. This amount is locked into the staking contract where it secures the network and earns rewards of approximately 3.5% to 5.5% annually. If you have less than 32 ETH, you can participate through liquid staking protocols like Lido (no minimum) or pooled staking services. Liquid staking typically yields 3% to 5% after fees and provides a tradeable token representing your staked position.
### What are the current Ethereum staking rewards in 2026?
As of October 2026, Ethereum staking rewards range from 3.5% to 5.5% APY for solo validators, 3% to 5% for liquid staking through platforms like Lido, and 2.5% to 4.5% for exchange staking. Solo validators who run MEV-boost can earn toward the higher end of this range. The base protocol yield is approximately 2.5% to 3%, with additional rewards coming from transaction fees and MEV. Approximately 30% of total ETH supply is currently staked.
### Can I unstake my Ethereum at any time?
Yes, Ethereum withdrawals have been enabled since the Shanghai upgrade in April 2023\. When you request to exit as a validator, you enter an exit queue that processes approximately 1,800 validators per day. The withdrawal period depends on queue length. Once processed, your ETH returns to your wallet. For liquid staking tokens like stETH, you can trade them on secondary markets immediately, though you may face a small liquidity discount depending on market conditions.
### How do I recognize the accumulation phase for Ethereum?
The accumulation phase shows specific market structure: price stops making lower lows and begins defending a range, realized price is reclaimed after a period underwater, staking participation rises steadily, and support levels hold on repeated tests. In 2018-2019 and 2022-2023, accumulation lasted 15 to 18 months and appeared after capitulation bottoms. Currently, Ethereum shows these signals with price above realized price, 30%+ staking participation, and defended support near two thousand dollars.
The Weekly Yield Report
You just learned the cycle framework that identified accumulation windows in 2019 and 2023\. The next one will look different but rhyme the same way.
Every Thursday: where crypto yield actually is - stablecoins, liquid staking and DeFi lending, with the risk named next to the rate and what changed since last week.
[Get it free every Thursday](#/portal/signup)
Free. No trade calls, no allocations, no hype. Unsubscribe in one click.
### How To Read Seed And Private Round Vesting Schedules
URL: https://altcoininvestor.com/how-to-read-token-vesting-schedule/
Last updated: 2026-10-06T17:06:25.000Z
## What You Will Accomplish

At the end of this article, you will know how to read a token allocation table from a project whitepaper or documentation site, identify when large tranches of tokens will hit circulation, and calculate whether your lending or liquidity provision position can absorb the resulting sell pressure. You will understand the difference between a cliff unlock and a linear vest, how to estimate cost basis for seed and private round investors, and which allocation categories create the most predictable downward price movement. This is not about price speculation. It is about yield risk.
The prerequisite is basic familiarity with [reading a crypto whitepaper](https://altcoininvestor.com/how-to-read-crypto-whitepaper/) and understanding what circulating supply means. If you do not know what a tokenomics section looks like, start there.
## Why Vesting Schedules Matter for Income Positions
Token vesting schedules control when insiders, team members, advisors, and early investors can sell their allocations. When a 12-month cliff expires and 15% of total supply becomes transferable in a single day, the effect on liquidity depth is not theoretical. A Keyrock study of 16,000 unlock events found that approximately 90% resulted in short-term price declines. Large unlocks exceeding 5% of circulating supply correlate with median price drops of 8-15% in the surrounding 30-day window.
If you are earning 18% APY lending that token on Aave, or providing liquidity to a DEX pair that pays 40% in rewards, the unlock event is not background noise. It is the structural event that determines whether you can exit your position at the yield you modeled or whether you will spend three months waiting for liquidity to return while your capital sits idle. The European sovereign debt crisis taught this lesson clearly: the advertised yield on Greek bonds in 2010 looked attractive until the redemption mechanism broke. The yield stopped being a yield. It became a loss that had been accruing all along, disclosed at last.
Vesting schedules are readable. They are published. They tell you exactly when the sell pressure will arrive. Your task is to interpret the terms, calculate the volume, and compare that volume to the token's actual liquidity. This is how you time exits from income positions before unlock-driven liquidity crunches make exiting expensive.
## Step 1: Locate the Allocation Table and Vesting Terms

Begin with the project's whitepaper, documentation site, or official blog. Look for a section titled Tokenomics, Token Distribution, or Allocation Schedule. What you need is a table showing how the total token supply is divided among recipient categories. The standard categories are Team, Advisors, Seed Investors, Private Round Investors, Public Sale, Ecosystem Fund, Treasury, and Community Rewards.
Each row in the table will list a percentage of total supply, a vesting period, and often a cliff. For example, Team: 20% of total supply, 12-month cliff, 36-month linear vest. That sentence contains all the information you need to calculate when 20% of the token supply can begin selling.
If the documentation does not include vesting terms, check the project's official Medium, governance forum, or ask in the official Discord or Telegram. Projects that refuse to publish vesting schedules are signaling something worth noticing. In 2021 and 2022, multiple DeFi protocols that collapsed had unlisted or undisclosed team allocations. Transparency about vesting is not a nicety. It is a minimum standard.
Once you have the table, verify the total adds to 100%. If it does not, ask where the missing percentage went. If the project minted more tokens than documented, your entire basis for calculating dilution is wrong.
## Step 2: Understand Cliff vs. Linear Vesting
Vesting schedules use two mechanisms to control when tokens become transferable: cliffs and linear unlocks. A cliff is a waiting period during which zero tokens vest. At the end of the cliff, a percentage of the allocation unlocks at once. A linear vest spreads the remaining allocation across equal installments over time, typically monthly.
The standard for team and founder allocations is a 12-month cliff. Cliff periods for investors range from 6 months for private rounds to 12-24 months for team members. The one-year cliff remains the industry standard, used by 85% of projects with team vesting schedules. After the cliff, most projects adopt a 4-year vesting schedule, meaning 25% of tokens unlock after the first year, followed by monthly or quarterly vesting of the remaining 75%.
Cliffs concentrate sell pressure into a single known date. If a project allocated 20% of total supply to the team with a 12-month cliff and a 48-month total vest, then on day 366 after the token generation event (TGE), 25% of that 20% becomes transferable. That is 5% of total supply hitting circulation in one day. This is the unlock event traders circle on calendars.
Linear vesting spreads the same total allocation across many smaller releases. Instead of unlocking 10 million tokens on one day, the contract might release roughly 27,000 tokens per day over a year. This dilutes sell pressure across time, making each individual release negligible relative to daily trading volume. The mechanism does not eliminate dilution. It distributes it, which makes it harder to observe but no less real.
When you read a vesting schedule, note which allocations have cliffs and which are linear from TGE. Public sale allocations often unlock immediately or on a short linear schedule (3-6 months). Ecosystem and community rewards may unlock over 24-48 months with no cliff. Team and private investor allocations almost always include a cliff. The logic is alignment: the cliff forces insiders to remain economically exposed for a minimum period. The reality is that the day after the cliff expires, the alignment ends.
## Step 3: Calculate Unlock Volume as a Percentage of Circulating Supply
The unlock schedule shows when tokens become transferable. What it does not show on its own is whether that supply can reach the market, who controls it, or how much real liquidity can absorb it. To assess the risk to your income position, you need to calculate the unlock volume as a percentage of circulating supply at the time of the unlock, not total supply.
Circulating supply and total supply provide two different denominators. An unlock that appears small against total supply may be material against the tokens already available to trade. For example, if a project has a total supply of 1 billion tokens but only 100 million are circulating at TGE, and the team's cliff releases 50 million tokens in month 12, that is 5% of total supply but 50% of circulating supply. The second figure is the one that matters for price impact.
Most token tracking sites report circulating supply. Cross-check it against the project's official documentation, because some projects define circulating supply generously, including tokens that are technically unlocked but held in wallets controlled by insiders. Tokenomist provides source-verified token unlock data with precision labeling. Track cliff and linear vesting, upcoming releases, and circulating supply impact across 500+ tokens. When the definitions diverge, use the narrower one.
The formula to calculate the percentage impact of a specific unlock is straightforward. Take the number of tokens unlocking, divide by circulating supply at the time of unlock, then multiply by 100\. If the result exceeds 5%, historical data suggests a high probability of measurable sell pressure within 30 days. A single unlock releasing 5% or more of circulating supply often creates 5-15% sell pressure within 48 hours.
## Step 4: Estimate Recipient Cost Basis
Not all unlocks create equal sell pressure. The incentive to sell depends on the recipient's cost basis. A team member who received tokens at zero cost, or a seed investor who paid $0.005 per token when the token now trades at $0.50, faces a 100x gain on unlock. The economic incentive to liquidate is overwhelming, regardless of the project's long-term vision or the recipient's public statements about holding.
Seed and private round investors typically buy at rock-bottom prices, often between $0.001 and $0.01 per token. Public sale participants pay higher prices, closer to the initial listing price. If the token appreciated between private rounds and public sale, the cost basis gap widens. When the private round unlocks, those investors are sitting on returns that public buyers cannot match. The rational action is to take profits.
Compare the typical private sale price, if disclosed, to the current trading price. If the token trades at 50x the private round price, assume maximum selling incentive on unlock. If the token trades near or below the private sale price, selling pressure may be lower, because recipients may hold for recovery. This is not sentiment analysis. It is basic economics. People sell when they have gains to realize.
Cost basis also explains why [IDOs and private rounds](https://altcoininvestor.com/token-launch-methods-compared/) create different risk profiles. IDO participants pay near-market prices and often face minimal or zero vesting. Private round investors pay discounts of 70-90% and accept longer vesting in exchange. When their cliff expires, the discount becomes realized profit, and the vesting period ends. The result is predictable.
## Step 5: Compare Unlock Volume to Trading Volume and Liquidity Depth
The monthly unlock rate, meaning total tokens unlocking per month, is the operational metric that matters for assessing sell pressure. Compare this figure to the average daily trading volume (ADV) of the token. If the monthly unlock is equivalent to 30 days of ADV, sellers have a natural window to liquidate without catastrophic slippage. If the monthly unlock is equivalent to 120 days of ADV, the market cannot absorb it without a price correction.
You can find 30-day average trading volume on CoinGecko, CoinMarketCap, or directly on the DEX or CEX where the token trades. Check volume in dollar terms, not token terms, because dollar volume measures actual liquidity. A token with $50,000 in daily volume cannot absorb a $6 million unlock in 30 days without significant price impact.
Liquidity depth is the second variable. Open the order book on the primary exchange where the token trades. Look at the bid side. Sum the total dollar value of buy orders within 10% of the current price. If that total is smaller than the dollar value of the unlock, the unlock will move price. This is not speculation. It is arithmetic.
A 20% team allocation with a 12-month cliff and 36-month linear vest is institutional standard. Pair it with an initial liquidity pool of 2% of circulating supply and no market maker, and the team's first unlock event in month 13 occurs against a liquidity pool that cannot absorb the sell pressure. The allocation was fine. The liquidity was not. The distribution model failed. If you are [deploying yield capital into low cap tokens](https://altcoininvestor.com/how-to-check-liquidity-low-cap-crypto/), this is the failure mode that matters.
## Step 6: Identify High-Risk Allocation Categories
Not all allocation categories create the same sell pressure. Team, advisor, and early investor allocations are high-risk categories because recipients have low or zero cost basis and limited ongoing economic alignment after the cliff expires. Ecosystem and treasury allocations are lower risk if they are controlled by a DAO or multisig with transparent governance, because selling those tokens requires a public vote. Community reward allocations depend on distribution mechanics. If rewards are emitted gradually to stakers or liquidity providers, sell pressure is distributed. If rewards unlock in large batches to airdrop recipients, sell pressure concentrates.
Founder and team allocations typically carry the longest vesting schedules, often 3-4 years, with a 12-month cliff. Early seed investors often take higher risks and may negotiate shorter vesting periods, such as 1-2 years, compared to the 3-4 years for teams. Private and public investor allocations vest faster or unlock immediately. The logic is that public investors paid market prices and should not be locked. The result is that the highest-cost-basis holders (public buyers) can sell immediately, while the lowest-cost-basis holders (team and seed investors) must wait. When their wait ends, the incentive structure reverses.
Check the documentation for accelerated vesting triggers. Some projects include clauses that unlock tokens early if the project hits certain milestones (total value locked targets, user growth, token price levels). These triggers are rarely disclosed in the summary table. They appear in the legal documents or governance proposals. If a project can unlock 30% of team tokens early by hitting a TVL milestone that was reached three months after launch, the vesting schedule you read is not the vesting schedule that will execute.
## Step 7: Use Unlock Tracking Tools
Manual calculation is useful for understanding the mechanics. For ongoing monitoring, use dedicated unlock tracking tools. TokenUnlocks.app tracks upcoming unlocks with calendar views and provides notifications for tokens you follow. CryptoRank provides historical unlock data and their measured market impact, which allows you to compare past events for similar projects. Tokenomist labels unlocks by category (team, investor, ecosystem) and calculates the percentage of circulating supply each unlock represents.
Set alerts for tokens where you hold income positions. If you are lending a token on Aave or Compound, or providing liquidity on Uniswap or Curve, you need to know when the next major unlock is scheduled. Experienced traders begin positioning 30 or more days before major unlock dates, front-running anticipated sell pressure. If you wait until the unlock day to react, you are exiting into a market that already repriced the risk.
Cross-reference the unlock data on tracking tools with the project's official documentation. Tracking sites sometimes mislabel allocation categories or use outdated vesting schedules if the project amended terms via governance vote. The authoritative source is the project's published documentation or on-chain vesting contracts. If the two sources conflict, assume the on-chain contract is correct.
## Common Failure Modes
The first failure mode is assuming that a published vesting schedule is immutable. Projects can and do amend vesting terms via governance proposals, especially if the token price collapsed and the team argues they need liquidity to continue development. If you are not monitoring governance proposals for the tokens you hold, you will miss these changes until the unlock happens.
The second failure mode is confusing unlock with sell pressure. A token unlock does not automatically trigger a price drop. Price impact depends on token utility, market sentiment, liquidity conditions, on-chain allocation behavior, and broader BTC and ETH trends. Unlock volume alone does not determine price movement. Token usage and investor behavior matter more. If recipients choose to stake unlocked tokens or hold for long-term appreciation, sell pressure may not materialize. But planning your exit on the assumption that insiders will act against their financial interest is not risk management. It is hope.
The third failure mode is ignoring the difference between vesting schedules for different investor cohorts. A project may advertise a 48-month team vest and neglect to mention that seed investors have an 18-month total vest with a 6-month cliff. The seed round often represents 10-15% of total supply and was sold at the lowest price. When that cohort unlocks in month 7, the impact is larger than the team unlock in month 13, even though the team allocation is bigger, because the seed investors have the highest cost basis multiplier and the earliest exit window.
The fourth failure mode is treating unlock schedules in isolation from liquidity depth. Projects launching with low float (5-15% of total supply circulating at TGE) and long vesting schedules create the appearance of scarcity. The token can appreciate rapidly in the first 6-12 months because circulating supply is constrained. Then the first major unlock hits, and circulating supply doubles in a month. The price corrects not because the project failed but because the supply-demand balance shifted. If you are holding a yield position through that correction, your notional APY is irrelevant. Your actual return depends on the exit price.
## What to Do Next
Pull up the tokenomics documentation for the three highest-yielding positions you currently hold. Find the allocation table. Identify the vesting schedule for team, advisors, and early investors. Calculate when the next major cliff expires and what percentage of circulating supply will unlock. Compare that unlock volume to 30-day average trading volume. If the unlock exceeds 10% of circulating supply or represents more than 60 days of average volume, set a calendar reminder for 30 days before the unlock date.
Review your position size in that token. If you are providing liquidity, calculate your impermanent loss exposure if the token declines 10-15% in a two-week window. If you are lending, check the utilization rate and your ability to withdraw on short notice. The question you are answering is whether you can exit the position before the unlock or whether you are structurally locked in. If you cannot exit, the yield you are earning is compensating you for a dilution event you have already committed to absorbing.
For future positions, make reading the vesting schedule part of your initial due diligence. A token offering 60% APY on stablecoin pairs with a 12-month team cliff expiring in 45 days is not offering 60% APY. It is offering whatever yield you can realize in 45 days, minus the expected price impact of the unlock, minus your exit slippage. That is the actual return. The advertised APY is the return you would earn if supply never increased and liquidity never contracted. Those conditions do not hold.
## The Takeaway
Token vesting schedules are published because they are contractually binding. They tell you exactly when large allocations of low-cost-basis tokens will become transferable, who holds them, and what percentage of circulating supply they represent. Reading a vesting schedule is not about predicting price. It is about predicting liquidity depth and sell pressure at known future dates. When you are earning yield by lending or providing liquidity, those dates determine whether you can exit your position at the modeled return or whether you will spend weeks waiting for liquidity to recover while the opportunity cost accrues.
The eurozone sovereign debt crisis demonstrated what happens when investors ignore the difference between advertised yield and sustainable yield. Greek bonds paid high coupons until the redemption mechanism broke. The yield was not compensation for risk. It was the market pricing in the probability of default. Crypto unlock events are not defaults, but they are predictable supply shocks, and the market prices them in advance if participants are paying attention. Your task is to be the participant who reads the schedule, calculates the volume, and exits before the liquidity crunch begins.
A 12-month cliff is not a mystery. It is a countdown. Treat it as one.
## Frequently Asked Questions
### What is the difference between a cliff and linear vesting?
A cliff is a waiting period during which zero tokens vest. At the end of the cliff, a percentage unlocks at once. Linear vesting spreads the remaining allocation across equal installments over time, typically monthly. The standard is a 12-month cliff followed by 36 months of linear vesting. Cliffs concentrate sell pressure into a single date. Linear vesting distributes it, making each release smaller but the total dilution identical.
### How do I calculate unlock volume as a percentage of circulating supply?
Take the number of tokens unlocking, divide by circulating supply at the time of unlock, then multiply by 100\. Use circulating supply, not total supply. For example, if 50 million tokens unlock and circulating supply is 100 million, the unlock represents 50% of circulating supply. Historical data shows unlocks exceeding 5% of circulating supply often create 5-15% sell pressure within 48 hours.
### Which allocation categories create the most sell pressure?
Team, advisor, and early seed investor allocations create the most sell pressure because recipients have the lowest cost basis, often $0.001 to $0.01 per token, and limited ongoing economic alignment after the cliff expires. Seed investors who bought at 100x below current price face maximum incentive to liquidate on unlock. Public sale and community reward allocations carry higher cost basis and distribute more gradually, reducing concentrated sell pressure.
### Where can I find upcoming token unlock dates?
TokenUnlocks.app tracks upcoming unlocks with calendar views. CryptoRank provides historical unlock data and measured market impact. Tokenomist offers source-verified unlock schedules with precision labeling for 500+ tokens. Always cross-reference tracking sites with the project's official documentation or on-chain vesting contracts, because projects sometimes amend vesting terms via governance votes that tracking sites do not immediately reflect.
### Do all token unlocks cause price drops?
No. Approximately 90% of large unlock events result in short-term price declines, according to a Keyrock study of 16,000 events. Price impact depends on unlock size relative to circulating supply, trading volume, liquidity depth, recipient cost basis, and broader market conditions. If recipients stake unlocked tokens or if the unlock is small relative to daily volume, sell pressure may not materialize. However, planning exits on the assumption insiders will not sell is hope, not risk management.
The Weekly Yield Report
You now know how to calculate unlock volume against circulating supply and compare it to trading liquidity. Those unlock dates and liquidity ratios will change every week.
Every Thursday: where crypto yield actually is - stablecoins, liquid staking and DeFi lending, with the risk named next to the rate and what changed since last week.
[Get it free every Thursday](#/portal/signup)
Free. No trade calls, no allocations, no hype. Unsubscribe in one click.
### Stablecoin Yield In High-Inflation Countries: User Corridors
URL: https://altcoininvestor.com/stablecoin-yield-emerging-markets/
Last updated: 2026-10-06T16:03:43.000Z
## The Question: Why Stablecoin Yield In Emerging Markets
Stablecoin yield in Argentina, Turkey, and Nigeria is not a financial product. It is survival infrastructure.
More than 85% of peso-denominated exchange purchases in Argentina are stablecoins. USDT accounts for over half of all Bitcoin trades on Turkey's largest exchange. Nigeria handled approximately $22 billion in stablecoin transfers in a single year. These are not hobby numbers. They reflect corridors where currency depreciation makes holding local cash a losing position.
The question users ask is not "should I diversify into crypto?" It is "which platform will convert my naira to USDT without getting blocked, and what yield can I capture once I'm out of local currency?"
This is the on-ground view. Peso-USDC flows. Lira-USDT routing. Naira-stablecoin corridors. The platforms users actually use, the yields they capture, and the corridor economics that persist through regulatory pressure.
## How Stablecoin Yield Works In High-Inflation Corridors
The income mechanism has two components. First, purchasing power preservation. Second, yield return in a stable denomination.
Argentina's peso lost approximately 95% of its value against the dollar since 2018\. Turkey's lira shed more than 450% of its purchasing power between 2020 and 2024\. Nigeria's naira lost roughly 70% of its value between June 2023 and early 2025\. A user holding local currency through that period captured the full loss.
A user who converted to USDC or USDT avoided that loss. That is step one.
Step two is yield. A Turkish saver holding lira deposits earned 35-44% nominal interest between 2021 and 2026\. That looks high. Measured against dollar terms, the same saver lost more than 80% of their capital because the lira collapsed faster than the interest accumulated. The yield was real in local terms, but the denominator moved.
Stablecoin yield inverts that structure. A Nigerian user converting naira to USDT on [Busha and earning 7.5% APY on USDC](https://altcoininvestor.com/how-to-earn-passive-income-stablecoins-2026/) captures dollar-denominated return. If the naira depreciates another 15% that year, the user's local purchasing power increases by the sum of yield and depreciation.
That is the corridor trade. Exit local currency, preserve value in dollars, capture yield, re-enter local currency only when needed for expenses. The yield itself ranges from 3.5% to 10% depending on platform and lockup terms. Measured against Argentina's -12 point real return on peso deposits, Nigeria's -7 points, or Turkey's near-zero after inflation, the stablecoin position consistently outperforms.
### Real Yields Captured In August 2026
As of August 2026, OKX Money offers up to 10% annual yield on eligible USDG balances with no staking or lockup required. Busha pays up to 7.5% APY on USDC holdings through its Earn product. Lemon Cash in Argentina offers USDT savings products denominated in dollars.
Traditional remittance services charge an average fee of about 8.45% as of Q3 2024\. Stablecoin transfers settle in minutes and cost under $1\. The 50-70% cost savings over SWIFT on emerging market corridors compounds with yield, creating a structure where the user keeps more capital in the first place and earns more on what remains.
One thing worth noting: these yields are not DeFi yields. They are centralized platform products. The highest adoption in Argentina, Turkey, and Nigeria happens on centralized exchanges and licensed fiat on-ramps, not Western DeFi protocols. The user flow is peso to USDC on a local CEX, then into a savings product on the same platform. The friction is low. The regulatory surface is smaller than cross-border DeFi routing.
## Argentina Peso-USDC Flow: Platforms And Real User Corridors

Stablecoin purchases represent over 50% of exchange activity for the Argentine peso, and Argentina's stablecoin transaction share is 61.8%. Argentine stablecoin holdings grew 220% during 2025, even after capital controls were lifted. That growth signals that stablecoins moved from crisis tool to maintenance infrastructure.
The premium for a digital dollar over the official exchange rate narrowed to approximately 4% as of late August 2026\. That spread was wider during capital control periods. As the gap closed, the trade became less about arbitrage and more about yield and preservation.
Coinbase stopped peso-based USDC buying, selling, and bank withdrawals in Argentina starting January 31, 2026\. That decision forced users toward P2P platforms and local exchanges. The two most common routes are Lemon Cash and peer-to-peer marketplaces. Lemon Cash offers USDT savings products with returns denominated in dollars. Users deposit pesos, convert to USDT, and hold in a savings account that pays yield.
USDC payments to Argentine contractors spiked at 289% year-over-year growth in April 2024\. By July 2026, that growth had shrunk to roughly one-fifth of peak level. The slowdown reflects normalization, not abandonment. Contractors who adopted stablecoins during the crisis continue to use them. The explosive growth phase ended because most addressable users already converted.
The Argentine corridor persists because peso deposits still deliver negative real returns. In August 2026, a typical savings rate of 21% on plazo fijo deposits, measured against 33.5% inflation, yields approximately -12 percentage points real return. A user holding USDT and earning 7% captures a 19-point advantage over local deposits.
## Turkey Lira-USDT Flow: Volume Concentration And Platform Workarounds
USDT now accounts for over half of all Bitcoin trades on Turkey's largest exchange. The USDT/TRY pair topped Binance's volume charts in 2024 with $22 billion in transactions. Turkey's stablecoin purchases reached 4.3% of GDP in 2024\. These numbers reflect a market where stablecoins are not a speculative position but the default savings vehicle.
Turkey climbed from seventh to fifth in global crypto adoption as retail trading volume rose 7% year-over-year to roughly $40 billion in early 2026\. The primary driver was not Bitcoin speculation. It was lira depreciation and the search for yield in a currency that holds value.
The Central Bank's 2021 rule bars payment and e-money institutions from intermediating payments to and from crypto platforms. That prohibition forces users to buy on domestic centralized exchanges, then route to DeFi or hold on-platform for yield. The workaround is functional but introduces friction. Users cannot fund crypto purchases via Turkish debit cards or bank transfers intermediated by payment processors. They must use direct bank deposits to licensed exchanges.
Paribu is one of the largest centralized exchanges in Turkey with around 7 million users. It offers close to 200 tradeable cryptocurrencies and trading pairs with Turkish lira and USDT. Users deposit lira, convert to USDT, and either hold for yield or move to external wallets. The platform acts as the on-ramp.
Ripple's RLUSD is now live on Turkish platforms BiLira, Bitlo, and Bitexen. That distribution represents competition among stablecoin corridors. RLUSD is the dollar rail competing with USDT and USDC in a high-velocity, lira-pressured market. The user does not care which stablecoin they hold as long as it maintains dollar parity and offers yield.
A September 2024 survey found that in Turkey, the top non-trading use case for stablecoins is earning yield. That finding distinguishes Turkey from Nigeria, where the top use case is saving in dollars, and from Argentina, where the focus is avoiding peso depreciation. Turkish users want both preservation and return. The lira's 80% collapse over five years means that local deposits, even at 35-44% nominal rates, failed to preserve wealth in global terms. Stablecoin yield offers a way to capture return without denomination risk.
## Nigeria Naira Routing: Licensed Platforms And Speed Of Settlement
Nigeria received roughly $59 billion in crypto inflows in a single 12-month period. More than 65% of that volume was stablecoin-denominated. By 2024, stablecoins accounted for 43% of all crypto transaction volume in sub-Saharan Africa. Nigeria alone recorded nearly $22 billion in stablecoin transactions in a single year.
USDT accounts for approximately 88.5% of stablecoin activity in Nigeria. 95% of Nigerians surveyed said they prefer receiving payments in stablecoins over naira. Roughly 33% of Nigerian adults reported using stablecoins for payments or savings in 2024\. These percentages place Nigeria at the center of the global stablecoin corridor network.
The platforms users actually use are licensed local exchanges and international platforms with naira on-ramps. Bybit, Luno, and Quidax offer direct naira deposits for stablecoin purchases. CoinStick supports major stablecoins including USDT, USDC, and DAI, and converts them to naira in a linked bank account in under 9 seconds. That settlement speed is critical. A user receiving a USDT payment from abroad can convert to naira and withdraw to a local bank account in the time it takes to complete a phone call.
Busha offers named accounts for instant local funding. Sale proceeds are credited to a linked Nigerian bank account. The platform advertises more than 70 digital assets, including cNGN, the SEC-regulated naira stablecoin. The cNGN product offers an on-chain representation of the naira, allowing users to move between local currency and dollar stablecoins without leaving the crypto rails.
The Nigerian corridor is distinguished by speed and platform fragmentation. There is no single dominant exchange. Users distribute volume across Bybit, Luno, Quidax, Busha, and peer-to-peer networks depending on fees, settlement time, and liquidity. The competition keeps spreads tight and settlement fast.
In August 2026, Nigeria's typical savings rate was 8% with inflation at 15.4%. That yields approximately -7 percentage points real return. A user holding USDT and earning 5-7% APY on a platform like Busha captures a 12 to 14-point advantage over naira deposits, plus avoids the 15.4% depreciation. The compounding effect over 12 months is the difference between losing purchasing power and gaining it.
### Why These Corridors Persist Through Regulatory Pressure
Regulatory pressure has not collapsed these corridors. It has reshaped them.
Coinbase exited Argentina. Users moved to Lemon Cash and P2P. Turkey's Central Bank prohibited payment intermediaries. Users moved to direct bank deposits on licensed exchanges. Nigeria's government has oscillated between encouraging blockchain development and restricting access to foreign exchange. Users routed through licensed platforms and peer-to-peer networks.
The corridor persists because the underlying economic pressure persists. A government can restrict on-ramps. It cannot make holding local currency a profitable decision when that currency is losing 15-30% of its value per year. The user will find a route.
Stablecoin settlement delivers 50-70% cost savings over SWIFT on emerging market corridors. The highest-impact corridors, measured by volume and cost reduction, are India, Nigeria, Brazil, Argentina, Philippines, Turkey, and Pakistan. These are not marginal routes. They are the largest remittance and capital flow corridors in the developing world. The infrastructure that supports them is not going to disappear because one regulator or one platform exits.
## When Stablecoin Yield In Emerging Markets Matters
This strategy matters when your income or savings are denominated in a currency losing value faster than local interest rates can offset.
It matters when you receive payments in dollars or other hard currencies and want to preserve that value between conversion events.
It matters when you need to move capital across borders at a cost below 8.45% and a speed faster than three to five business days.
It does not matter if you live in a country with stable currency and access to dollar-denominated savings accounts or money market funds. A U.S. resident earning 4.5% in a money market fund does not need to route through USDT to capture dollar yield. The infrastructure already exists.
It does not matter if your local currency is pegged to the dollar or part of a currency union with low inflation. The corridor trade depends on depreciation. Without depreciation, the only advantage is yield, and centralized stablecoin yields are not consistently higher than traditional savings products in stable economies.
It matters most in Argentina, Turkey, Nigeria, Venezuela, Lebanon, Zimbabwe, and other markets where currency controls, inflation, or banking restrictions make holding local cash a structural loss. These are the corridors where stablecoin yield is not a product. It is the default.
## What To Watch
Watch the premium between official exchange rates and stablecoin market rates. When that premium widens above 5%, it signals capital control pressure or liquidity stress. When it narrows below 3%, it signals either policy normalization or reduced demand for dollar exposure.
Watch platform exits. When a major international exchange like Coinbase pulls out of a market, it signals regulatory risk, but it does not signal the end of the corridor. It signals a shift toward local platforms and P2P. The volume does not disappear. It redistributes.
Watch the ratio of stablecoin volume to total crypto volume. In Argentina, stablecoins represent 61.8% of activity. In Nigeria, they represent 43% of sub-Saharan African volume. When that ratio climbs, it means users are prioritizing preservation over speculation. When it falls, it means either local currency stability improved or risk appetite increased.
Watch inflation differentials. The spread between local inflation and stablecoin yield is the real return. If Turkish inflation falls to 20% and stablecoin yields remain at 7%, the corridor is still profitable but less compelling than when inflation was 31.75%. The trade depends on the gap.
Watch regulatory clarity. Turkey introduced new crypto legislation. Argentina lifted capital controls. Nigeria's SEC approved cNGN. Regulatory clarity does not kill the corridor. It formalizes it. Platforms that operate within the new rules capture the volume that used to move through gray channels. The corridor adapts, it does not collapse.
The [Bank for International Settlements published empirical research](https://www.bis.org/publ/work1265.pdf) on cross-border stablecoin flows. The data shows that high inflation combined with awareness drives adoption. The awareness variable is critical. The corridors that matter are not the ones with the highest inflation. They are the ones with high inflation and existing digital payment infrastructure. Nigeria, Turkey, and Argentina meet both conditions.
## The Takeaway
Stablecoin yield in Argentina, Turkey, and Nigeria is not a speculative bet. It is the income mechanism that emerges when local currency savings deliver negative real returns and dollar exposure plus yield delivers positive returns. The platforms are centralized, the corridors are high-volume, and the economics persist through regulatory pressure because the underlying currency depreciation persists. Users in these markets earn by preserving purchasing power in dollars and capturing 3.5-10% annual yield on top of that preservation. The combined return consistently outperforms local deposits. That is why the corridors exist, and that is why they will continue to exist until local currency stability changes the equation.
## Frequently Asked Questions
### What is the real yield advantage of stablecoins in high-inflation countries?
In August 2026, Argentine peso deposits yielded approximately -12 percentage points real return (21% nominal vs 33.5% inflation). Nigerian naira deposits yielded -7 points (8% vs 15.4% inflation). Stablecoin positions earning 5-10% APY in dollars capture that yield plus avoid the depreciation loss, creating a combined 15-20 point advantage over local currency savings in these corridors.
### Which platforms do users actually use in Argentina, Turkey, and Nigeria?
Argentina: Lemon Cash for USDT savings products and P2P networks after Coinbase exited. Turkey: Paribu (7 million users), BiLira, Bitlo, and Bitexen for USDT and RLUSD. Nigeria: Bybit, Luno, Quidax, Busha, and CoinStick for naira-to-USDT routing. These are centralized platforms with local currency on-ramps, not Western DeFi protocols. Settlement speed and low fees drive adoption.
### How do stablecoin corridors persist through regulatory pressure?
Regulatory restrictions reshape corridors but do not collapse them. When Coinbase exited Argentina, users moved to local platforms and P2P. When Turkey's Central Bank blocked payment intermediaries, users switched to direct bank deposits on licensed exchanges. The corridor persists because the economic pressure (15-30% annual currency depreciation) persists. Users will find a route as long as holding local cash remains a structural loss.
### What yields are available on stablecoins in these markets as of August 2026?
OKX Money offers up to 10% APY on USDG with no lockup. Busha pays up to 7.5% APY on USDC. Lemon Cash offers USDT savings products denominated in dollars. These are centralized platform yields, not DeFi yields. Rates vary by platform, lockup terms, and eligibility. The key advantage is dollar denomination, which preserves purchasing power while local currencies depreciate 15-30% annually.
### When does stablecoin yield in emerging markets not matter?
This strategy does not matter if you live in a stable-currency country with access to dollar-denominated savings accounts or money market funds. A U.S. resident earning 4.5% in a money market fund does not need stablecoins. It also does not matter if your local currency is pegged to the dollar or part of a low-inflation currency union. The corridor trade depends on currency depreciation creating a loss that stablecoin exposure avoids.
The Weekly Yield Report
You have just reviewed three corridors where stablecoin yield outperforms local deposits by 12 to 20 percentage points. Those spreads will shift as inflation and regulation change.
Every Thursday: where crypto yield actually is - stablecoins, liquid staking and DeFi lending, with the risk named next to the rate and what changed since last week.
[Get it free every Thursday](#/portal/signup)
Free. No trade calls, no allocations, no hype. Unsubscribe in one click.
### Launchpad Allocation Odds: How Staking, Lottery, and Oversubscription Work
URL: https://altcoininvestor.com/how-do-crypto-launchpad-allocations-work/
Last updated: 2026-10-06T15:05:19.000Z
## How Launchpad Allocations Are Determined
Launchpads like DAO Maker, Polkastarter, and TrustPad advertise early access to token sales before public listing. The question worth answering is not whether you can participate, but whether the probability of receiving an allocation justifies the capital you must lock to become eligible.
Allocation mechanisms vary by platform, but most follow a tiered staking model. You purchase and stake the platform's native token to unlock a membership tier. Higher tiers require more capital and offer better odds or guaranteed allocations. Lower tiers enter a lottery. The majority of participants stake the minimum, enter the lottery pool, and lose.
This is not a guaranteed return mechanism. It is a probability game where your expected value depends on allocation odds, staking cost, opportunity cost of locked capital, and the gap between your entry price and the token's post-launch performance. Most users in lower tiers lose money when accounting for the full cost of access.
## Staking Tiers: Minimum Capital and Access Rights

Each launchpad operates a tiered system where staking more platform tokens improves your allocation status. The structure determines whether you enter a lottery, receive a guaranteed allocation, or gain proportional access scaled to your stake size.
DAO Maker requires a minimum of 2,000 DAO tokens to participate in Strong Holder Offerings (SHO). At current pricing, that represents approximately $7,000 in locked capital. Around 75% of IDO allocations are reserved for staked participants, but within that pool, allocation odds scale sharply with tier. A user staking 500 DAO faces roughly 3% odds of winning an allocation. At 2,000 DAO, odds rise to 14%. At 10,000 DAO (approximately $35,000), odds reach 28%.
The tier system creates a non-linear return on staking capital. Doubling your stake from 2,000 to 4,000 DAO improves your odds from 14% to 22%, an 8-percentage-point gain for an additional $7,000 locked. Doubling again to 8,000 DAO delivers diminishing marginal probability increases. The first $7,000 buys 14% odds. The next $28,000 buys an additional 14% in probability. This is worth noticing.
Polkastarter requires at least 1,000 POLS Power to become eligible for IDO participation. Recent average allowlist probabilities across launches sit at 14.88%, meaning roughly 85% of staked users received no allocation. Higher tiers improve odds, but the baseline access tier still operates as a lottery where the majority lose. Users must also complete KYC, register within narrow time windows, and monitor announcements. Missing a registration deadline nullifies staking eligibility for that launch.
TrustPad uses a similar tiered structure with $TPAD token staking. Lower tiers offer lottery-based allocation, while higher tiers receive guaranteed access with predefined allocation limits. The platform introduced a 48-hour refund window for investors, which reduces the risk of immediate post-launch losses but does not change the underlying probability of receiving an allocation in the first place.
The pattern is consistent across platforms. Guaranteed allocations require $5,000 to $15,000 or more in staking capital. Lower tiers, accessible with $500 to $2,000, operate as lotteries where 70-90% of participants receive nothing. The capital required to access better odds often exceeds the allocation size you would receive even if you win.
## Lottery Versus Guaranteed Allocation Models
Launchpads use three primary allocation models: lottery, guaranteed, and proportional. Understanding which model applies to your tier determines whether staking represents a calculated risk or an expensive ticket to a lottery you will probably lose.
In a **lottery model**, all eligible participants in a tier are entered into a draw. Winners receive allocations; losers receive nothing. The probability of winning equals the number of winning tickets divided by total tickets issued. If 1,000 users enter a lottery and 150 allocations are available, each participant faces 15% odds. DAO Maker's lower tiers operate this way. Polkastarter's baseline POLS Power tier is also lottery-based, with recent average success rates of 14.88%.
The lottery formula is straightforward: your allocation equals your subscribed amount divided by total subscribed amount, multiplied by total allocation available. If you commit $500, total commitments are $100,000, and the allocation pool is $10,000, your share is 5% of $10,000, or $500\. But if the launch is oversubscribed 15x, your $500 commitment competes with $1.5 million in total demand. You receive a pro-rata allocation of $33 and a refund of $467\. The allocation you actually receive is often too small to justify the staking cost required to access it.
**Guaranteed allocation tiers** reserve a fixed or proportional token amount for higher-tier stakers. If you meet the staking threshold, you receive an allocation regardless of demand. DAO Maker's Tier 5+ stakers, who lock 100,000+ DAO tokens, fall into this category. The guarantee eliminates lottery risk but requires capital commitments in the $35,000 to $100,000+ range. For most users, this is not a viable access route.
**Proportional models** distribute allocations based on the size of your stake relative to all other participants in your tier. The more you stake, the larger your allocation. This mechanism favors whales and disadvantages smaller participants, who receive allocations too small to move the needle on portfolio returns. Proportional distribution creates the appearance of fairness while concentrating meaningful allocations in the hands of users who stake multiples of the minimum.
Each model creates a different risk profile. Lotteries offer binary outcomes with low win rates. Guaranteed tiers require prohibitive capital locks. Proportional models allocate dust to small stakers. The common thread is that lower tiers face poor odds, and the capital cost of improving those odds often exceeds the expected value of winning.
For context, [crypto staking mechanisms](https://altcoininvestor.com/crypto-staking-how-does-it-work/) in proof-of-stake networks deliver predictable, compounding returns because every staker earns yield. Launchpad staking delivers returns only to lottery winners, and the majority of stakers subsidize the allocations of those who win.
## Oversubscription: What Happens When Demand Exceeds Supply
Oversubscription occurs when total participant commitments exceed the token allocation available for a launch. This is the norm, not the exception. Oversubscription ratios of 10x to 50x are typical. Some high-profile launches exceed 100x. Beta Finance recorded 1,061x oversubscription with 158,944 participants, meaning 99.9%+ of users received allocations far smaller than they expected or nothing at all.
When a launch is oversubscribed, the platform calculates each participant's allocation on a pro-rata basis and refunds the remainder. If you committed $1,000 and the launch is oversubscribed 20x, you receive approximately $50 in tokens and a refund of $950\. The allocation you receive may be too small to cover transaction fees, staking opportunity cost, or the time spent monitoring the launch.
SPACEX Phase 1 reached 15.5x oversubscription. The token appreciated 27% post-launch. A user who committed $1,000 expecting a full allocation received approximately $64.50 in tokens. If the token rose 27%, that allocation appreciated to $82\. The gross gain was $17.50 before fees and before accounting for staking cost or idle capital lockup. If that user staked $7,000 in DAO tokens for three months to access the lottery, the opportunity cost of that capital at 5% annualized was approximately $87.50\. The allocation gain did not cover the staking cost.
Oversubscription ratios are not disclosed before a launch closes. You commit capital without knowing whether you will receive 100% of your allocation, 10%, or 1%. This opacity is structural. Launchpads benefit from high commitment volumes because they signal demand to projects and create urgency among participants. Transparency about expected oversubscription would reduce commitments and harm the platform's negotiating position with projects.
The refund mechanism ensures you do not lose committed capital directly, but it does not protect you from the opportunity cost of staking, the time cost of participation, or the risk that your small allocation will be immediately diluted by post-launch sell pressure. Oversubscription transforms what appears to be early access into a fractional allocation that often delivers less value than buying on the secondary market once liquidity stabilizes.
## Staking Cost Versus Expected Allocation Value
The critical calculation most participants skip is the comparison between staking cost and expected allocation value. Staking platform tokens to access launchpad tiers locks capital that could be deployed elsewhere. That capital has an opportunity cost, and the staking yield offered by the platform rarely compensates for it when you account for allocation probability.
DAO Maker offers up to 7.65% APY on staked DAO tokens. A user staking 2,000 DAO ($7,000) earns approximately $535 per year in staking rewards. But that user faces 14% allocation odds in most launches. Over ten launches, the user would statistically win 1.4 allocations. If each winning allocation delivers $500 in tokens post-oversubscription, the expected value across ten launches is $700\. Add staking yield of $535 over 12 months, and total expected return is $1,235 on $7,000 locked capital, or approximately 17.6% annually.
This calculation assumes the DAO token price remains stable. If DAO declines 20% during your staking period, your $7,000 stake is now worth $5,600\. You have lost $1,400 in principal. Staking yield of $535 and allocation gains of $700 total $1,235, which does not cover your principal loss. You are underwater. Token price risk is not hypothetical. Platform tokens are volatile, thinly traded, and subject to sell pressure when participants exit after a disappointing launch or during broader market downturns.
Lower-tier participants face worse odds. A user staking 500 DAO ($1,750) at 3% allocation odds would win 0.3 allocations across ten launches. Expected allocation value is $150\. Staking yield on $1,750 at 7.65% is $134 annually. Total expected return is $284 on $1,750, or 16.2%. But this user also faces 97% probability of losing every single launch. The psychological and time cost of repeated losses is not quantified in the expected value calculation, but it is real.
The break-even threshold depends on token performance post-launch. If allocations routinely deliver 2-3x returns within days, staking cost is justified. If allocations deliver 1.2x returns or less, staking cost exceeds gains. Historical data from 2021-2023 shows that the majority of IDO tokens underperformed or traded below allocation price within 30 days of launch. Vesting schedules, which lock allocations for weeks or months, delay your ability to exit and expose you to post-launch dilution from team, investor, and early backer unlocks.
For more on how [staking rewards are calculated](https://altcoininvestor.com/staking-rewards-explained-calculation-reductions/) and what reduces your actual returns, the same opportunity cost logic applies. Every dollar locked in launchpad staking is a dollar not earning yield in a DeFi protocol, not staked in a proof-of-stake network, and not available to buy tokens on the secondary market when prices drop.
## Hidden Costs: Vesting, Gas Fees, and Lockup Risk
Allocation odds and staking cost are the visible expenses. Several hidden costs further erode returns, and most participants do not account for them until they experience a loss.
**Vesting schedules** lock your allocation for days, weeks, or months after the IDO. A common structure is a 10-20% unlock at launch, followed by linear vesting over 3-12 months. If you receive a $500 allocation with 10% immediate unlock and 90% vested over six months, you can access $50 immediately and $75 per month thereafter. During that six-month period, the token may decline 50% or more. Your vested allocation loses value while you wait for it to unlock. You cannot exit, you cannot hedge, and you cannot reallocate that capital to better opportunities.
Some platforms penalize early unstaking. DAO Maker requires stakers to pay 50% of earned rewards if they cancel their stake before the defined staking period ends. If you staked for 12 months, earned $535 in rewards, and exit after six months, you forfeit $267.50\. This penalty locks you into the platform even if better yield opportunities emerge elsewhere or if you need liquidity for personal reasons.
**Gas fees** on Ethereum-based launchpads can consume 5-10% of a small allocation. If you receive a $100 allocation and pay $10 in gas to claim it, your net allocation is $90\. If the token declines 20% before you can sell, your $90 is now worth $72\. You are down 28% before considering staking cost or opportunity cost. Layer-2 and alternative chain launchpads reduce gas costs but introduce smart contract risk, bridge risk, and lower liquidity on secondary markets.
**Platform security risk** is not theoretical. DAO Maker experienced a $7 million user-fund hack in August 2021\. Reimbursement disputes persisted for years. Users who staked on the platform not only faced allocation lottery odds but also risked total loss of staking capital to a security breach. This is not unique to DAO Maker. Launchpads are high-value targets for exploits, and most platforms lack the insurance or balance sheet reserves to make users whole after a hack.
Locking capital in platform tokens during weak markets amplifies losses. If you stake $7,000 in DAO tokens in November, and the market declines 30% by March, your stake is worth $4,900\. Even if you win allocations and earn staking yield, you must generate $2,100 in gains to break even. Most allocations do not deliver that level of return, and staking yield of 7.65% over four months adds only $178\. You are $1,922 short of break-even.
## When Launchpad Access Makes Sense
Launchpad participation is not always a losing proposition, but it makes economic sense only under specific conditions that most users do not meet.
You should consider launchpad staking if you meet all of the following criteria:
- You have sufficient capital to access guaranteed allocation tiers ($10,000 to $50,000+), eliminating lottery risk.
- You are confident the platform token will remain stable or appreciate during your staking period, offsetting opportunity cost.
- You have access to proprietary research or insider information about upcoming launches, allowing you to selectively participate in high-probability winners.
- You can absorb the total loss of staking capital in a platform hack or token collapse without impairing your financial position.
- You have the time and discipline to monitor registration windows, complete KYC, and manage vesting schedules across multiple launches.
If you do not meet these conditions, your expected return from launchpad participation is likely negative after accounting for staking cost, opportunity cost, allocation probability, and token price risk. Buying tokens on the secondary market after launch, once price discovery has occurred and liquidity has stabilized, often delivers better risk-adjusted returns than entering through a launchpad lottery.
For users interested in improving their IDO allocation outcomes, [strategies to maximize allocation in oversubscribed token sales](https://altcoininvestor.com/how-to-get-more-allocation-in-ido/) include tier upgrades, multi-platform diversification, and secondary market timing. But the underlying math remains the same: lower tiers lose money on average, and higher tiers require capital commitments that most retail participants cannot justify.
## Comparative Context: CoinList and KYC-Only Models
Not all launchpads operate on a token-staking model. CoinList, one of the most established platforms, requires no platform token purchase for priority access. Participation is based on account registration, KYC completion, and geographic eligibility. This eliminates staking cost and token price risk.
However, CoinList demand routinely exceeds supply by orders of magnitude. Registration does not guarantee allocation. Oversubscription ratios of 20-50x are common, and most registered users receive fractional allocations or nothing at all. The platform selects winners through a combination of lottery and compliance scoring. Early account registration, previous participation history, and verified identity status improve odds, but the majority of users still face low allocation probability.
The CoinList model demonstrates that even "fairer" allocation mechanisms without token staking do not solve the fundamental problem: demand exceeds supply, and most participants will not receive meaningful allocations. The absence of staking cost improves expected value for users, but it does not change the fact that early access to high-demand token launches is structurally scarce and subject to lottery mechanics regardless of platform design.
For users comparing yield opportunities across platforms, [centralized exchange earn programs](https://altcoininvestor.com/how-does-binance-earn-work-cex-yield-2/) deliver predictable returns without lottery risk. The trade-off is lower upside and custodial risk, but the expected value is positive for every participant, not just lottery winners.
## The Takeaway
Launchpad allocations are probability games, not guaranteed income mechanisms. Lower tiers operate as lotteries where 70-90% of participants receive nothing. Staking costs, opportunity costs, and token price risk often exceed the expected value of winning allocations. Oversubscription ratios of 10-50x reduce allocations to fractions of committed capital, and vesting schedules lock that capital during periods of maximum post-launch volatility. The users who profit consistently from launchpads are those with sufficient capital to access guaranteed allocation tiers or those with access to proprietary information that allows selective participation in high-conviction launches. For the majority of retail participants, buying on the secondary market after price discovery delivers better risk-adjusted returns than locking capital in platform tokens and hoping to win a lottery. The math does not favor lower-tier participants, and the marketing does not disclose the full cost of access.
## Frequently Asked Questions
### What are the minimum staking requirements for launchpad participation?
Minimum staking requirements vary by platform. DAO Maker requires 2,000 DAO tokens (approximately $7,000) for baseline access to Strong Holder Offerings. Polkastarter requires at least 1,000 POLS Power for eligibility. TrustPad requires $TPAD staking with amounts varying by tier. Lower tiers typically require $500 to $2,000 in platform tokens but offer only lottery-based allocation with 3-15% win rates. Guaranteed allocation tiers require $10,000 to $50,000+ in staked capital.
### How are lottery allocations calculated on crypto launchpads?
Lottery allocations are calculated on a pro-rata basis. Your allocation equals your committed amount divided by total committed amount, multiplied by total tokens available. If you commit $1,000, total commitments are $100,000, and the allocation pool is $10,000, you receive $100 in tokens. If the launch is oversubscribed 20x, you receive $50 in tokens and a $950 refund. Lottery winners are selected randomly, with odds determined by the ratio of winning slots to total participants in your tier.
### What is oversubscription and how does it affect my allocation?
Oversubscription occurs when total participant commitments exceed available token supply. Ratios of 10-50x are common, with some launches exceeding 100x. When oversubscribed, platforms calculate allocations pro-rata and refund uncommitted capital. If you commit $1,000 to a 20x oversubscribed launch, you receive approximately $50 in tokens and a $950 refund. High oversubscription reduces allocations to fractions of expected amounts, often too small to justify staking costs or transaction fees required to participate.
### Do launchpad staking rewards cover the opportunity cost of locked capital?
Rarely. DAO Maker offers up to 7.65% APY on staked tokens, which yields approximately $535 annually on a $7,000 stake. However, a 14% allocation probability across multiple launches delivers expected allocation value of approximately $700 over 12 months. If the platform token declines 20% during staking, you lose $1,400 in principal, which exceeds combined staking yield and allocation gains. Opportunity cost calculations must include token price risk, allocation probability, and alternative yield opportunities in DeFi or proof-of-stake networks.
### When does launchpad participation make economic sense?
Launchpad participation makes sense when you can access guaranteed allocation tiers ($10,000 to $50,000+ staking), have confidence in platform token price stability, possess proprietary research on upcoming launches, and can absorb total loss of staking capital without financial harm. For users in lower lottery-based tiers, expected returns are negative after accounting for staking cost, opportunity cost, allocation probability, and token price risk. Buying on secondary markets after launch often delivers better risk-adjusted returns than entering through launchpad lotteries.
The Weekly Yield Report
You have just examined allocation odds ranging from 3% to 28%, staking costs between $1,750 and $35,000, and oversubscription ratios that reduce most allocations to fractions. Those probabilities shift with every launch, and the capital cost of access changes with platform token prices.
Every Thursday: where crypto yield actually is - stablecoins, liquid staking and DeFi lending, with the risk named next to the rate and what changed since last week.
[Get it free every Thursday](#/portal/signup)
Free. No trade calls, no allocations, no hype. Unsubscribe in one click.
### D'CENT Wallet Hack: $20M Stolen Across Five Blockchains
URL: https://altcoininvestor.com/dcent-wallet-cross-chain-hack-analysis/
Last updated: 2026-10-09T18:00:06.000Z
## What Happened On-Chain
More than 12.4 million XRP disappeared from over 7,000 D'CENT wallets between late September and early October 2026\. The total loss exceeds $20 million at current prices. What started as a drain on XRP Ledger addresses spread to Bitcoin, Ethereum, Tron, and Stellar within hours. Attackers emptied wallets across five entirely different blockchains using a single compromised credential set.
This is the second-largest XRP theft of 2026\. Only the Bitget exchange hack, which lost 102.9 million XRP in March, was larger. D'CENT is urging every affected user to generate a new recovery phrase and migrate all assets immediately. The company has not disclosed the exact vulnerability mechanism, but the cross-chain pattern tells a clear story.
The affected wallets share a common trait: they used the same seed phrase or private key derivation across multiple chains. When attackers obtained access to one credential, they gained access to all of them. The blockchain shows what happened. Outbound transactions from affected addresses occurred within tight time windows, often within minutes across different networks. That coordination suggests automated sweeping, not manual wallet-by-wallet theft.
## The Cross-Chain Credential Reuse Flaw
Most multi-chain wallets derive addresses for Bitcoin, Ethereum, XRP, and other networks from a single master seed. This is convenient. It is also a systemic risk. If an attacker compromises the seed, they compromise every blockchain the wallet supports. D'CENT wallets followed this pattern. Users who stored XRP, BTC, ETH, TRX, and XLM in the same wallet lost assets on all five chains simultaneously.
The vulnerability appears to have been exploited through credential theft rather than a protocol-level flaw. The exact vector has not been confirmed, but the on-chain activity suggests attackers had direct access to seed phrases or private keys. There is no evidence of a smart contract exploit or bridge vulnerability. The transactions look like legitimate user-initiated transfers, signed with valid private keys.
This is a key distinction. If the exploit had been a bug in D'CENT's software, the company could patch it. If the exploit was credential theft through phishing, malware, or a compromised supply chain, the fix is not software. It is user behavior. The company's response, urging immediate seed phrase replacement, suggests the latter. When a wallet provider tells users to generate new seeds, it means the old ones are assumed compromised.
For anyone using a [hardware wallet](https://altcoininvestor.com/best-crypto-hardware-wallets/), this is a reminder that the device is only as secure as the seed phrase backup. If that backup is stored digitally, transmitted over the internet, or entered into a phishing site, the hardware wallet provides no protection.
## What the On-Chain Activity Reveals
The outbound transactions from affected wallets show a consistent pattern. Assets moved to fresh addresses with no prior transaction history. Those addresses, in turn, began distributing funds to additional addresses within hours. This is standard procedure for laundering stolen crypto. The initial sweep consolidates assets. The subsequent distribution fragments them across many wallets to obscure the trail.
On the XRP Ledger, the 12.4 million XRP drained from 7,000 wallets represents an average loss of roughly 1,770 XRP per wallet, or about $2,850 at current prices. That average masks significant variation. Some wallets held far more. The largest individual losses have not been disclosed, but wallet-level analysis shows several addresses lost over 100,000 XRP each.
The cross-chain coordination is the most striking feature. Bitcoin transactions require different signing algorithms than Ethereum transactions. XRP uses a distinct address format. Tron and Stellar each have their own transaction structures. For an attacker to sweep all five simultaneously, they needed access to the underlying seed phrase, not just individual private keys. This confirms the breach was at the seed level, not at the chain-specific key level.
There is no public evidence yet linking the stolen funds to known exchange deposit addresses or mixing services. The trail is still fresh. Blockchain analytics firms like Chainalysis, Arkham, and Nansen are likely tracking the addresses. Law enforcement may be involved. The XRP Ledger's transparency makes large movements difficult to hide indefinitely. Bitcoin is harder to trace if the attacker uses CoinJoin or mixing services. Ethereum and Tron funds may eventually move through privacy protocols like Tornado Cash or Railgun.
## What This Means for Wallet Security Design
The D'CENT hack exposes a structural problem in multi-chain wallet architecture. Most wallets prioritize convenience over compartmentalization. A single seed phrase unlocks everything. This is a feature when you are trying to simplify user experience. It is a catastrophic liability when that seed is compromised.
A more secure design would isolate credentials by blockchain. Bitcoin keys should derive from a separate seed than Ethereum keys. XRP credentials should be independent of Tron credentials. This approach sacrifices convenience. Users would need to manage multiple seed phrases. But it limits the blast radius of a single compromise. If an attacker steals your Ethereum seed, they get your ETH. They do not get your Bitcoin.
Few wallets implement this model. MetaMask handles EVM chains only, which provides some isolation by default. Ledger and Trezor both derive multi-chain keys from a single seed, the same vulnerability D'CENT exhibits. Trust Wallet and Exodus follow the same pattern. The industry standard is systemic fragility in exchange for user-friendliness.
The fix is not a software patch. It is a design philosophy shift. Wallets need to offer users the option of isolated seeds per blockchain, even if it complicates the interface. Power users who understand the trade-off would choose isolation. Casual users who prioritize convenience could stick with the unified seed model. Right now, most wallets do not offer the choice at all.
## Income Implications: Why Wallet Security Determines Yield Security
If you are earning yield in crypto, your wallet is your vault. Staking rewards, liquidity pool fees, lending interest, and airdrop eligibility all depend on assets remaining in your control. A compromised wallet does not just lose your principal. It loses all future income those assets would have generated.
Consider a user who lost 100,000 XRP in the D'CENT hack. At current staking yields of roughly 2-3% APY on XRP through validators, that represents a loss of 2,000-3,000 XRP per year, or $3,200-$4,800 annually. Over five years, the lost yield alone exceeds $16,000\. The principal loss was $160,000 at current prices. The total economic damage is closer to $180,000 when you account for opportunity cost.
The same logic applies to Ethereum. If you lost 50 ETH in the hack, you lost not just the $125,000 in principal at current prices, but also the roughly 3.5 ETH per year in staking rewards, worth $8,750 annually. Over five years, that is another $43,750 in lost income. The longer your investment horizon, the more the income loss compounds.
Wallet security is not separate from income strategy. It is the foundation. Every DeFi protocol, every staking service, every yield opportunity assumes you control the wallet receiving the rewards. If you lose that control, every income stream connected to it stops immediately. There is no insurance. There is no rollback. The blockchain does not care that you were phished or hacked. It only cares who holds the private key.
## What to Watch On-Chain Next
The stolen XRP is the easiest to track. The XRP Ledger is fully transparent. Watch for large transfers from the initial recipient addresses to known exchange deposit addresses. Bitfinex, Kraken, Binance, and Coinbase all have compliance teams that monitor for flagged funds. If the attacker tries to cash out through a KYC exchange, the funds may be frozen.
On Ethereum, watch for movement through privacy protocols. Tornado Cash is sanctioned and high-risk, but still functional. Railgun is newer and less scrutinized. If the stolen ETH moves through either, the trail becomes harder to follow. On Bitcoin, watch for CoinJoin transactions or deposits to mixing services like Wasabi Wallet. Those are the standard laundering techniques for BTC.
Tron and Stellar are less liquid than the other three chains. Large TRX or XLM dumps would move the market. If the attacker holds those assets rather than immediately selling, it suggests they are waiting for attention to fade before attempting to cash out. Watch on-chain activity on those networks over the next 30-60 days.
D'CENT has not disclosed whether they are working with blockchain analytics firms or law enforcement. If they are, expect tagged addresses and public warnings within the next two weeks. Exchange compliance teams will receive alerts. The attacker's ability to move funds will narrow. If no such coordination occurs, the stolen assets are likely gone for good.
## The Takeaway
A single compromised seed phrase emptied 7,000 wallets across five blockchains. The vulnerability was not in the blockchain protocols. It was in the wallet design philosophy that prioritizes convenience over compartmentalization. If you store assets on multiple chains, assume that a compromise of one chain means a compromise of all chains using the same seed. If you are generating income from those assets, a wallet breach does not just cost you principal. It costs you every future reward those assets would have earned. The D'CENT hack is the second-largest XRP theft of 2026\. It will not be the last cross-chain wallet compromise. Watch how the stolen funds move over the next 30 days. The laundering patterns will tell you whether the attacker is sophisticated enough to evade tracing, or sloppy enough to get caught.
## Frequently Asked Questions
### How did attackers steal from five different blockchains using D'CENT wallets?
D'CENT wallets derive private keys for Bitcoin, Ethereum, XRP, Tron, and Stellar from a single master seed phrase. When attackers compromised that seed through credential theft, they gained access to all five blockchains simultaneously. The on-chain transactions show coordinated sweeping across networks within minutes, confirming automated access rather than chain-by-chain manual theft.
### What should D'CENT wallet users do immediately after this hack?
Generate a new recovery seed phrase immediately and migrate all assets to wallets derived from that new seed. Do not reuse the old seed phrase for any blockchain. Assume any wallet previously accessed with the compromised seed is now permanently insecure. Check on-chain transaction history for all addresses to confirm no unauthorized outbound transfers have occurred yet.
### Can multi-chain wallets be designed to prevent this type of cross-chain theft?
Yes, by using isolated seed phrases for each blockchain instead of deriving all keys from a single master seed. This sacrifices convenience but limits the damage from a single credential compromise. If your Ethereum seed is stolen, the attacker only gets your ETH, not your Bitcoin or XRP. Few wallets currently offer this option.
### How does a wallet hack affect my crypto income and yield?
A compromised wallet loses not just principal but all future income those assets would generate. If you lost 100,000 XRP earning 3% staking yield, you lose $160,000 in principal plus roughly $4,000 per year in staking rewards. Over five years, the total loss exceeds $180,000\. Wallet security directly determines whether your yield strategies can function at all.
### Is there any way to recover funds stolen in the D'CENT wallet hack?
No guaranteed recovery method exists. The stolen XRP, Bitcoin, Ethereum, Tron, and Stellar moved to attacker-controlled addresses using valid private keys. Blockchain transactions are irreversible. Recovery depends on whether the attacker uses KYC exchanges where funds can be frozen, or whether law enforcement can trace and seize assets. Most hacked crypto is never recovered.
Tool mentioned above
Ledger
Ledger devices display the full transaction on their own screen before you approve it, which is what stops an approval exploit at the point it matters.
[See Ledger devices](https://shop.ledger.com/?r=90612ff43561)
We may earn a commission if you sign up through this link, at no cost to you. It does not change what gets recommended.
The Weekly Yield Report
You just traced $20 million stolen across five blockchains from a single credential compromise. The next cross-chain wallet breach is already in progress somewhere.
Every Thursday: where crypto yield actually is - stablecoins, liquid staking and DeFi lending, with the risk named next to the rate and what changed since last week.
[Get it free every Thursday](#/portal/signup)
Free. No trade calls, no allocations, no hype. Unsubscribe in one click.
### Crypto Mining Machines: Payback Period Ranked by ASICs vs GPUs
URL: https://altcoininvestor.com/crypto-mining-machine-payback-period/
Last updated: 2026-10-06T02:06:00.000Z
## The Capital Allocation Decision
You have $5,000 to deploy. You can buy Bitcoin directly at current price, or you can buy an Antminer S19 and wait for it to mine that amount back. At $0.10 per kilowatt-hour electricity and October 2026 difficulty of 132.7 trillion, the miner costs you $7.79 per day in power. It generates roughly $3 to $5 per day in Bitcoin at current hashprice. You are bleeding capital from day one.
This is not a corner case. This is the default outcome for residential mining in 2026.
Mining hardware represents a capital deployment competing with staking, lending, or direct asset purchase. The decision is not whether mining is profitable in absolute terms. The decision is whether mining delivers better risk-adjusted returns than the alternatives. At current network difficulty and residential power rates, it does not. This article ranks the hardware by real payback period and identifies the narrow edge cases where mining still makes economic sense.
## ASIC Miners: Bitcoin SHA-256 Hardware

The Antminer S19 remains the most widely discussed ASIC in 2026, though it is no longer flagship. Hashrate is 95 terahashes per second. Power draw is 3,250 watts. Efficiency is 34.2 joules per terahash. At Canadian average residential rate of $0.10 per kilowatt-hour, electricity costs are $7.79 per day, which compounds to $2,843 per year.
The S19 is available on the secondary market at a fraction of new-generation pricing. You can find units for $1,500 to $2,500\. But discounted hardware does not fix the underlying math. At current Bitcoin difficulty near 133 trillion and hashprice around $24 per petahash per day, the S19 generates approximately $2.28 per day in gross revenue. Subtract $7.79 in power. You lose $5.51 per day, every day, until difficulty drops or Bitcoin price rises enough to flip the equation.
The Antminer S19 XP improves the numbers but does not save the model. Hashrate climbs to 140 terahashes per second. Power draw falls slightly to 3,010 watts. Efficiency improves to 21.5 joules per terahash. Monthly power cost at $0.10 per kilowatt-hour is $217\. Gross revenue at current difficulty and hashprice is roughly $3.36 per day. Net loss is still $3.88 per day.
The Whatsminer M50 delivers 114 terahashes per second at 3,306 watts and 29 joules per terahash. At $0.10 per kilowatt-hour, it generates a daily loss of $7.93\. At $0.07 per kilowatt-hour, the loss compresses to $0.79 per day, which is $289 per year. Still negative.
If you lower electricity cost to $0.05 per kilowatt-hour, the game changes. Top-tier ASIC miners like the Antminer S21 XP can break even within 18 to 27 months at rates below $0.05 per kilowatt-hour. But $0.05 per kilowatt-hour is not a residential rate. It is an industrial rate, or it is stranded hydro, or it is curtailed wind in West Texas. If you are reading this article to decide whether to plug an ASIC into your home circuit, you do not have $0.05 per kilowatt-hour access.
A roughly $4,800 Antminer S21 XP running at $0.08 per kilowatt-hour all-in power rate might produce on the order of $100 per month in estimated net profit. Payback period is five to six years. In equities, a six-year breakeven on hardware that becomes obsolete in three years would not pass initial due diligence.
## GPU Mining: Kaspa, Ergo, and the ASIC Problem

GPU mining profitability collapsed in 2026\. Estimated payback periods now stretch to 1,500 days or more for most configurations. The best-case scenario involves mining Kaspa with a high-end GPU at electricity rates below $0.07 per kilowatt-hour. Even that scenario delivers marginal returns.
An RTX 4090 achieves roughly 0.9 to 1 gigahash per second on kHeavyHash, the algorithm Kaspa uses. The Antminer KS5 Pro delivers 21,500 gigahashes per second. The ASIC outperforms the GPU by 21,500 times in raw hashrate. Power consumption per hash is not 21,500 times higher. The ASIC wins on every dimension.
At $0.10 per kilowatt-hour, the RTX 4090 generates approximately $0.80 to $1.20 per day in profit mining Kaspa. The card costs $1,600 or more. Payback period stretches to four to five years, assuming difficulty and coin price remain static. They will not remain static. Difficulty has been climbing steadily as more KAS-dedicated ASICs come online. Your payback period extends every time another miner joins the network.
Ergo mining with an RTX 3070 produces similar results. The card delivers 160 megahashes per second at 125 watts. Used price is roughly $280\. Current profitability sits around $0.80 to $2.00 per day after electricity costs. At the high end of that range, payback is 140 days. At the low end, payback is 350 days. But those numbers assume you can sell Ergo immediately at current market price with no slippage, no volatility, and no difficulty adjustment. In practice, small-cap altcoin mining introduces liquidity risk that Bitcoin mining does not.
If you own a GPU already and your electricity is included in rent or otherwise unmetered, running the card to mine Kaspa or Ergo can make sense as marginal income. If you are buying hardware specifically to mine, the ROI does not justify the capital outlay. You would generate better returns buying the underlying asset directly and staking it where applicable.
For a deeper explanation of how mining rewards, fees, and difficulty adjustments interact to determine real profitability, see [What Crypto Mining Produces: Rewards, Costs, And ROI At Current Difficulty](https://altcoininvestor.com/what-is-crypto-mining/).
## Electricity Cost as the Dominant Variable
Electricity cost is the single most important variable in crypto mining profitability, outweighing even hardware efficiency in determining break-even timelines. This is not a talking point. This is the result of running the numbers across every major ASIC and GPU configuration at every residential and industrial power rate.
At $0.10 per kilowatt-hour, most hardware operates at a loss. At $0.07 per kilowatt-hour, operations struggle to justify continued mining at current Bitcoin prices. At $0.05 per kilowatt-hour or below, mining becomes viable if you have access to efficient hardware at 12 joules per terahash or better.
The threshold is sharp. Moving from $0.08 to $0.06 per kilowatt-hour can compress payback period by 40 percent or more. The difference between $0.10 and $0.05 per kilowatt-hour is the difference between hemorrhaging capital and slow, steady accumulation.
If you have access to sub-$0.05 power, mining competes with other yield strategies. Compare it directly to staking returns. Ethereum staking pays roughly 4 percent annual percentage yield with 0.5 percent inflation. Cosmos pays 18.5 percent with 12 percent inflation. If your mining setup delivers net annualized return below 4 percent after accounting for hardware depreciation, electricity, and difficulty increases, you are better off staking ETH. For a full breakdown of staking yields across chains, see [Crypto Staking Returns: Where Yield Comes From And What It Costs](https://altcoininvestor.com/crypto-staking-returns-across-chains/).
Most residential miners do not have sub-$0.05 power. Most do not have $0.07 power. The national average in the United States is roughly $0.14 per kilowatt-hour. Canada averages closer to $0.10\. Europe is higher. If you are paying residential rates, you are not competing with industrial farms. You are subsidizing them by driving difficulty higher while losing money per unit of hashrate.
## Edge Cases Where Mining Economics Work
There are four scenarios where mining hardware delivers competitive risk-adjusted returns compared to direct asset purchase. All four require conditions that most retail participants cannot access.
First: sub-$0.05 per kilowatt-hour industrial power. This requires either a commercial contract with a utility, access to stranded energy from hydro or wind, or participation in curtailment programs where miners absorb excess grid capacity during low-demand periods. Cryptocurrency mining functions as a flexible economic battery in these arrangements, storing energy as digital asset with global value. Solar project payback periods can drop from 8.1 years to 3.5 years when mining is coupled with renewable resources. Mining profitability increases by over 20 percent through participation in ancillary service markets.
Second: heat reuse in cold climates. The Antminer S19 produces 3,250 watts of heat, which converts to roughly 11,089 BTU per hour. If you would otherwise run a space heater in winter, the ASIC replaces that heater and mines Bitcoin as a byproduct. The electricity cost is sunk either way. This does not eliminate the cost, but it does change the opportunity cost calculus. You are paying for heat, not for mining. The mining revenue becomes a rebate on your heating bill.
Third: hardware depreciation tax treatment for institutional buyers. Bitcoin mining hardware qualifies for 100 percent bonus depreciation under current U.S. tax code. If you operate a mining business and have sufficient taxable income to shield, the depreciation benefit can compress effective payback period by 20 to 30 percent depending on your marginal rate. This edge is unavailable to individual retail miners unless they structure as a business and have other income to offset.
Fourth: access to zero-marginal-cost power through direct ownership of generation assets. If you own solar panels, wind turbines, or micro-hydro and produce more power than you consume, mining converts surplus power into an exportable asset. Grid buyback rates for excess solar in most jurisdictions are lower than retail rates. Mining captures more value per kilowatt-hour than selling back to the grid.
These are the edge cases. They are real. But they are edges, not defaults. If you are evaluating mining hardware as a passive income strategy without access to one of these four conditions, the ROI does not work.
## Direct Asset Purchase vs. Mining Hardware: The Apples-to-Apples Comparison
Here is the test. You have $5,000\. You can buy Bitcoin today at current market price, or you can buy an Antminer S19 XP on the secondary market for roughly $3,000, pay $2,000 for electrical setup and cooling, and begin mining.
If you buy Bitcoin directly, you own $5,000 of Bitcoin on day one. Your exposure is immediate. Your downside is Bitcoin price risk. Your upside is Bitcoin price appreciation. No ongoing costs.
If you buy the miner, you own zero Bitcoin on day one. You have $5,000 of sunk cost in hardware and infrastructure. You pay $7.20 per day in electricity at $0.10 per kilowatt-hour. You mine approximately $3.50 per day in Bitcoin at current difficulty and hashprice. Net loss is $3.70 per day, which is $1,350 per year. Your breakeven requires either Bitcoin price to rise significantly or difficulty to drop. Neither is under your control.
The scenarios where mining wins are scenarios where Bitcoin price rises sharply after you buy the hardware. But in those scenarios, buying Bitcoin directly would have delivered the same or better returns with less operational complexity, no ongoing electricity cost, and no hardware obsolescence risk.
The only scenario where mining outperforms direct purchase is the scenario where you have access to one of the four edge cases described above. If your electricity cost is $0.04 per kilowatt-hour, the math flips. If you are replacing a space heater, the math flips. If you have depreciation to capture, the math improves. Absent those conditions, direct purchase wins.
For investors seeking yield on crypto holdings, staking and lending strategies typically deliver better risk-adjusted returns than mining. Mining introduces operational risk, obsolescence risk, and ongoing costs that staking does not. If you are deploying capital for passive income, compare mining returns against staking returns after accounting for all costs. Most of the time, staking wins.
## Payback Period Summary: The Realistic Numbers
Antminer S19 at $0.10/kWh: Never. Negative daily cash flow.
Antminer S19 at $0.07/kWh: Marginal. Payback exceeds five years if difficulty remains flat, which it will not.
Antminer S19 XP at $0.10/kWh: Never. Negative daily cash flow.
Antminer S19 XP at $0.05/kWh: 18 to 27 months, assuming stable difficulty and Bitcoin price.
Whatsminer M50 at $0.10/kWh: Never. Loss of $7.93 per day.
RTX 4090 mining Kaspa at $0.10/kWh: Four to five years, assuming no difficulty increase and stable coin price. Both assumptions are false.
RTX 3070 mining Ergo at $0.10/kWh: Five months to one year, depending on Ergo price and liquidity. Liquidity risk is high.
These are the real numbers at current network difficulty, current coin prices, and current hashrate. If Bitcoin price doubles, all payback periods compress proportionally. If difficulty doubles, all payback periods extend or turn negative. You are betting on the ratio of price to difficulty. That ratio has been compressing for most of 2026 as institutional hashrate has come online and Bitcoin price has remained range-bound.
If you are considering mining as a capital allocation decision, model your breakeven under three scenarios: base case (current price and difficulty), bear case (20 percent price drop and 15 percent difficulty increase), and bull case (50 percent price increase and 10 percent difficulty increase). If your payback period exceeds three years in the base case, the investment does not compete with alternatives.
For tools to model your own scenarios and track mining profitability in real time, see [What is Cloud Mining?](https://altcoininvestor.com/cloud-mining/) for an alternative model that removes hardware risk but introduces counterparty risk.
## Tax and Reporting Implications
Mining income is taxable as ordinary income at the fair market value of the coin on the day you receive it. If you mine 0.01 Bitcoin on a day when Bitcoin trades at $60,000, you have $600 of taxable income. When you later sell that Bitcoin, you recognize capital gain or loss based on the difference between your $600 cost basis and the sale price.
This creates a reporting burden. Every block reward is a taxable event. Every payout from a mining pool is a taxable event. If you mine daily for a year, you have 365 taxable events to track. Most tax software handles this, but you need to feed it accurate data. If you use a mining pool, download your payout history. If you mine solo, track your block rewards manually.
Hardware depreciation is deductible if you operate as a business. If you file Schedule C as a sole proprietor or operate through an LLC, you can depreciate mining hardware over five years using MACRS, or you can take 100 percent bonus depreciation in year one under current rules. This benefit is large. A $5,000 ASIC that you depreciate fully in year one reduces your taxable income by $5,000, which saves you $1,850 in tax if your marginal rate is 37 percent.
Electricity is deductible as an operating expense if you operate as a business. If you pay $2,800 per year in electricity to run a mining operation, that $2,800 reduces your taxable income. Combined with depreciation, the tax benefit can turn a marginal mining operation into a positive after-tax return, even if pre-tax cash flow is negative.
None of this applies if you mine as a hobby. If you do not operate as a business, you cannot deduct expenses under current U.S. tax law. You still owe tax on the income. You just lose the deductions. This is why most serious miners structure as businesses.
For a full breakdown of crypto tax reporting at different transaction volumes and how to track mining income efficiently, see [What Crypto Tax Software Really Costs At Your Transaction Volume](https://altcoininvestor.com/koinly-pricing/).
## The Takeaway
Mining hardware is a leveraged bet on the ratio of coin price to network difficulty, paid for with daily electricity cost. At $0.10 per kilowatt-hour, that bet loses money on every major ASIC and GPU in 2026\. The breakeven threshold is $0.05 per kilowatt-hour or lower, which eliminates most residential participants. If you cannot access industrial power rates, or reuse the heat, or depreciate the hardware against business income, buying the asset directly delivers better risk-adjusted returns than mining it. The edge cases are real, but they are not the default. Model your payback under realistic assumptions before you deploy capital into hardware that might never return it.
## Frequently Asked Questions
### What is the realistic payback period for an Antminer S19 at home electricity rates?
At $0.10 per kilowatt-hour, the Antminer S19 operates at a net loss of $5.51 per day. It never reaches payback. Power costs $7.79 daily while mining revenue is roughly $2.28 per day at October 2026 difficulty of 132.7 trillion. Even at $0.07 per kilowatt-hour, payback exceeds five years, assuming difficulty and Bitcoin price remain constant, which they will not.
### Is GPU mining still profitable in 2026?
GPU mining profitability collapsed in 2026, with payback periods exceeding 1,500 days for most configurations. An RTX 4090 mining Kaspa at $0.10 per kilowatt-hour generates $0.80 to $1.20 daily profit. With a $1,600 purchase price, payback stretches to four to five years. Dedicated Kaspa ASICs outperform GPUs by 21,500 times in hashrate, eliminating any GPU efficiency advantage.
### At what electricity cost does Bitcoin ASIC mining become profitable?
Top-tier ASIC miners break even within 18 to 27 months at electricity rates below $0.05 per kilowatt-hour. At $0.07 per kilowatt-hour, operations struggle to stay profitable at current Bitcoin prices. At $0.10 per kilowatt-hour, even efficient hardware operates at a loss. Industrial power contracts, stranded renewable energy, or curtailment programs are required to access sub-$0.05 rates.
### When does mining hardware deliver better returns than buying Bitcoin directly?
Mining outperforms direct purchase only when you have sub-$0.05 per kilowatt-hour power, heat reuse value in cold climates, 100 percent bonus depreciation from business tax treatment, or zero-marginal-cost power from owned generation assets. Without one of these four edge cases, buying Bitcoin directly delivers better risk-adjusted returns with no operational costs, hardware obsolescence, or ongoing electricity expense.
### Can I deduct mining electricity and hardware costs on my taxes?
You can deduct electricity as an operating expense and depreciate hardware if you operate mining as a business filing Schedule C or through an LLC. Bitcoin mining hardware qualifies for 100 percent bonus depreciation under current U.S. tax code. If you mine as a hobby, you owe tax on income but cannot deduct expenses. Most serious miners structure as businesses to capture depreciation and expense deductions that can turn marginal operations into positive after-tax returns.
The Weekly Yield Report
You just compared five mining machines and saw why most never reach payback at $0.10 per kilowatt-hour. Next month difficulty will be higher and the threshold steeper.
Every Thursday: where crypto yield actually is - stablecoins, liquid staking and DeFi lending, with the risk named next to the rate and what changed since last week.
[Get it free every Thursday](#/portal/signup)
Free. No trade calls, no allocations, no hype. Unsubscribe in one click.
### What Crypto Mining Produces: Rewards, Costs, And ROI At Current Difficulty
URL: https://altcoininvestor.com/what-is-crypto-mining/
Last updated: 2026-10-06T00:05:31.000Z
## What Mining Actually Does

Crypto mining is proof-of-work computation that secures blockchain transactions. Miners compete to solve cryptographic puzzles. The first to solve the current block collects the block reward plus transaction fees. That's the income. The cost is electricity, hardware depreciation, and time.
Bitcoin pays 3.125 BTC per block as of 2026, set by the April 2024 halving. At Bitcoin's current price, that's roughly $195,000 per block before fees. Transaction fees add another layer that varies with network congestion. During high-traffic periods, fees can contribute 15% to 30% of total miner revenue. During low-traffic periods, fees may represent less than 5%.
The question is whether you can capture enough of that revenue to cover your costs and compete with simply buying the asset directly. For most retail miners, the answer is no.
## How Mining Revenue Is Structured
Mining income has two components: the block subsidy and transaction fees. The block subsidy is fixed per block and declines over time through halving events. Bitcoin's subsidy will drop to 1.5625 BTC in 2028\. Kaspa pays approximately 55 KAS per block, with blocks arriving once per second following the May 2025 Crescendo upgrade.
Transaction fees are the wildcard. They fluctuate based on block space demand. Bitcoin's fee market can swing from 0.1 BTC per block to over 2 BTC during high-traffic periods. Kaspa's high block rate distributes fee revenue more frequently but in smaller increments per block. Miners cannot control fee levels, only choose which transactions to include.
Most mining revenue models ignore fee volatility. That's a mistake. Difficulty-only models miss half the picture. If you're modeling a mining investment, you need to account for fee variance or assume zero fees as a floor case. Optimistic fee assumptions have bankrupted more miners than optimistic difficulty assumptions.
### MEV As Emerging Revenue
Maximal Extractable Value refers to profit from reordering, including, or excluding transactions within a block. In Ethereum's proof-of-stake environment, validators extract MEV by auctioning block space to sophisticated traders. In Bitcoin, MEV extraction is less developed but theoretically viable.
The question Bitcoin faces post-subsidy is whether transaction fees alone will sustain miner incentives. If fees prove insufficient, MEV could serve as an additional revenue stream. For now, MEV on Bitcoin is marginal. It's not a reliable income component for 2026 mining calculations. [MEV mechanisms](https://a16zcrypto.com/posts/article/mev-explained/) remain more relevant to proof-of-stake chains where block proposers have greater control over transaction ordering.
Treat MEV as theoretical upside, not current revenue. Any ROI calculation that includes Bitcoin MEV is speculative fiction.
## Difficulty, Hashrate, And Network Competition
Mining difficulty adjusts to keep block times stable. When more hashrate joins the network, difficulty rises. When hashrate leaves, difficulty falls. Bitcoin recalibrates every 2,016 blocks, roughly every two weeks. Kaspa's difficulty adjusts more frequently due to its higher block rate.
Bitcoin's network difficulty currently sits at 52.39 trillion. That number has been volatile in 2026\. In June, difficulty dropped 10.09%, the second-largest decline of the year. In July, it fell another 5% to 127.17 trillion before rebounding. These swings reflect miner capitulation during periods of low profitability.
For you as a potential miner, this means two things. First, your revenue per terahash declines as difficulty rises, even if Bitcoin's price holds steady. Second, difficulty lags hashrate changes by one to two weeks, meaning you can lose money during adjustment periods even if long-term equilibrium is profitable.
### Kaspa's ASIC Transition
Kaspa transitioned from GPU-mineable to ASIC-dominated in 2025\. Dedicated kHeavyHash ASICs like the IceRiver KS series and Bitmain Antminer KS series now deliver hashrates of 15 to 21 TH/s. A high-end GPU like the RTX 4090 produces around 2.2 GH/s, roughly 10,000 times less efficient.
If you mine Kaspa with a GPU against the current ASIC fleet, your daily reward will be negligible. GPU mining only makes sense if you already own the hardware and electricity is under $0.05 per kWh. Even then, you're better off selling the GPU and buying KAS directly.
This is the pattern for all proof-of-work chains that reach sufficient market cap. ASICs eventually dominate. Ethereum avoided this by moving to proof-of-stake. [Solo mining](https://altcoininvestor.com/solo-mining-vs-pool-mining/) with consumer hardware became obsolete the moment the first ASIC batch shipped.
## The Real Cost Structure
Electricity represents 60% to 80% of total mining operating cost. A few cents per kilowatt-hour decides whether a rig generates profit or bleeds capital. The average U.S. residential rate runs between $0.12 and $0.16 per kWh. In some markets, rates climb to $0.20 per kWh.
Bitcoin mining is profitable in 2026 for operators running sub-15 J/TH ASICs at power costs under $0.08 per kWh. If you're paying residential rates above $0.12 per kWh, you are losing money on every block. Industrial miners negotiate rates between $0.03 and $0.06 per kWh through long-term power purchase agreements. You cannot compete with that from your garage.
The Antminer S21, a 2025-generation unit, operates at roughly 17.5 J/TH. At $0.06 per kWh, the machine generates positive cash flow. At $0.12 per kWh, it doesn't. The difference is six cents. That six cents is the gap between a profitable operation and a space heater.
### Hardware Costs And Depreciation
Modern ASICs cost between $2,000 and $15,000 depending on efficiency and generation. A current-generation Bitcoin ASIC runs around $3,500 to $6,000\. Kaspa ASICs range from $4,000 to $10,000\. These units depreciate rapidly. New models arrive every six to twelve months, rendering older hardware uncompetitive.
Assume your ASIC loses 40% to 60% of its value over two years. If you paid $5,000, expect to recover $2,000 to $3,000 at resale. That's a $2,000 to $3,000 capital loss that most ROI calculators ignore. Add $200 to $2,000 for electrical panel upgrades if your home lacks 240V circuits.
Pool fees run 1% to 3% of gross revenue. Hosting fees, if you choose hosted mining, add another $0.06 to $0.10 per kWh to your effective power cost. Cooling, internet stability, and downtime further erode margins. A realistic all-in cost model includes all of these.
### Tax Treatment
Most jurisdictions tax mined coins as ordinary income at fair market value on receipt. If you mine 0.1 BTC when Bitcoin trades at $62,000, you owe tax on $6,200 of ordinary income. When you later sell that Bitcoin, you pay capital gains tax on the difference between your sale price and the $62,000 basis.
This creates a double-tax scenario. If Bitcoin drops to $50,000 before you sell, you owe tax on $6,200 of income and realize a $1,200 capital loss. [Most tax software](https://altcoininvestor.com/best-crypto-tax-software-3/) handles this correctly, but many miners discover the liability only at filing time.
## Mining Versus Direct Purchase
If you have very cheap power, mining can yield more crypto than buying it directly. If power is expensive, direct purchase delivers better returns with zero operational risk. The breakeven threshold sits around $0.07 per kWh for Bitcoin and $0.05 per kWh for Kaspa, assuming current-generation hardware and 95% uptime.
At $0.12 per kWh residential rates, you're better off buying Bitcoin directly than running a miner at home. A $5,000 hardware investment returns less Bitcoin over 24 months than a $5,000 spot purchase, and the spot purchase has no downtime, no noise, no heat, and no depreciation.
The math is simple. A $5,000 ASIC running at $0.12 per kWh will mine approximately 0.06 BTC over 18 months before difficulty adjustments and hardware degradation make it unprofitable. A $5,000 Bitcoin purchase at $62,000 gives you 0.081 BTC immediately. The miner loses on both quantity and liquidity.
### Breakeven Windows
Hosted mining at favorable rates extends breakeven to 20 to 28 months. A breakeven under 12 months is considered a good mining investment. Most retail setups hit breakeven between 18 and 36 months, if at all. Difficulty increases and hardware obsolescence compress these windows.
If Bitcoin's price rises faster than difficulty, mining can outperform direct purchase. If difficulty rises faster than price, mining underperforms. Historical data since 2020 shows difficulty tracking price with a two-to-four-month lag. During that lag, mining profitability spikes. Outside that window, profitability compresses.
The rational miner would time entry to post-capitulation periods when difficulty has fallen and price is stable or rising. That timing is difficult to execute. Most retail miners enter during hype cycles when hardware is overpriced and difficulty is rising.
## Home Mining Versus Hosted Mining
Hosted mining places your ASIC in a data center with industrial power rates. You pay a hosting fee, typically $0.06 to $0.10 per kWh above the facility's base rate. The facility handles cooling, uptime, and maintenance. You retain ownership of the hardware and receive mined coins directly.
Home mining gives you full control but exposes you to residential electricity rates and noise. An ASIC produces 70 to 90 decibels, roughly equivalent to a lawnmower running continuously. It generates 1,200 to 1,500 watts of heat. You need dedicated ventilation and a tolerance for constant noise.
Hosted economics beat home economics for most investors. The electricity savings alone often clear the hosting spread. A $0.06 per kWh hosted rate versus a $0.14 per kWh residential rate saves $0.08 per kWh. On a 1,500-watt ASIC running 24/7, that's $86 per month in savings. Hosting fees typically run $40 to $60 per month, leaving $26 to $46 in net savings.
The risk in hosted mining is counterparty risk. Some facilities go offline during low-margin periods. Others impose opaque fee structures or cap payouts during high-revenue periods. [Cloud mining](https://altcoininvestor.com/cloud-mining/) contracts, which sell hashrate without transferring hardware ownership, have an even worse track record. Many are outright scams.
## When Mining Makes Sense
Mining makes economic sense under three conditions. First, you have access to electricity below $0.07 per kWh, either through industrial agreements or geographic advantage. Second, you can source current-generation hardware at or below market wholesale prices. Third, you have a two-to-three-year time horizon and can tolerate illiquid capital.
If all three conditions hold, mining can deliver returns competitive with [staking](https://altcoininvestor.com/staking-rewards-explained-calculation-reductions/) or direct asset purchase. If any one condition fails, mining underperforms. Most retail participants fail on all three.
The alternative income strategies are [staking](https://altcoininvestor.com/crypto-staking-returns-across-chains/), [centralized exchange yield](https://altcoininvestor.com/how-does-binance-earn-work-cex-yield/), or simply holding the asset. Ethereum staking pays 4% annually with minimal infrastructure cost. Bitcoin cannot be staked, but lending yields range from 2% to 6% depending on counterparty risk. Both options require less capital, less expertise, and less operational overhead than mining.
### What To Watch
If you're evaluating mining, track three metrics weekly. First, network difficulty and hashrate. Rising difficulty compresses margins. Falling difficulty signals capitulation and potential entry. Second, the ratio of transaction fees to block subsidy. Higher fee ratios extend profitability into low-price environments. Third, your all-in cost per coin mined versus spot price. When that gap narrows below 10%, shut down and reallocate capital.
Bitcoin's next halving occurs in 2028\. The block subsidy will drop to 1.5625 BTC. Transaction fees will need to double to maintain current miner revenue levels. If fees don't rise, marginal miners will capitulate, difficulty will fall, and equilibrium will reset at a higher cost per coin. Plan your exit before that reset.
## The Takeaway
Mining is a capital-intensive, low-margin business that only works at scale or with structural cost advantages. Residential electricity rates eliminate profitability for nearly all home miners. The six-cent difference between industrial and retail power is the difference between profit and loss. If you cannot secure sub-$0.08 per kWh electricity and current-generation hardware at wholesale prices, direct asset purchase delivers better risk-adjusted returns. Mining competes with [staking and yield strategies](https://altcoininvestor.com/calculate-real-defi-returns/) as one income option among many. It rarely wins that comparison for retail allocators in 2026.
## Frequently Asked Questions
### What is crypto mining and how does it generate income?
Crypto mining is proof-of-work computation that secures blockchain transactions. Miners compete to solve cryptographic puzzles for each block. The winner receives a fixed block reward plus transaction fees. Bitcoin currently pays 3.125 BTC per block plus fees. Income depends on successfully mining blocks, which requires competitive hashrate, low electricity costs, and efficient hardware. Most retail miners join pools to receive steady proportional payouts rather than competing solo.
### Is crypto mining still profitable in 2026?
Bitcoin mining remains profitable for operators with sub-15 J/TH ASICs and electricity costs below $0.08 per kWh. At residential rates of $0.12 to $0.16 per kWh, home mining loses money. Industrial miners with $0.03 to $0.06 per kWh power rates maintain profitability. Kaspa requires even cheaper power due to lower coin value. Profitability depends on the six-cent gap between industrial and retail electricity costs, hardware efficiency, and network difficulty adjustments.
### Should I mine crypto or just buy it directly?
Direct purchase beats mining for most retail investors. At residential electricity rates, a $5,000 ASIC mines approximately 0.06 BTC over 18 months. The same $5,000 buys 0.081 BTC immediately at $62,000 per coin. Mining only outperforms if you secure industrial electricity rates below $0.07 per kWh and current-generation hardware at wholesale prices. Mining also requires managing hardware depreciation, noise, heat, and downtime that direct purchase avoids entirely.
### What is mining difficulty and why does it matter?
Mining difficulty adjusts to keep block times stable as network hashrate changes. When more miners join, difficulty rises, reducing revenue per terahash. When miners leave, difficulty falls. Bitcoin recalibrates every 2,016 blocks, roughly every two weeks. Rising difficulty compresses profit margins even if coin prices stay flat. Bitcoin's difficulty dropped 10.09% in June 2026 and 5% in July, reflecting miner capitulation. Your revenue per unit of hashrate declines as difficulty increases.
### What are the real costs of crypto mining beyond electricity?
Hardware costs $2,000 to $15,000 and depreciates 40% to 60% over two years. Electrical panel upgrades for 240V circuits add $200 to $2,000\. Pool fees take 1% to 3% of revenue. Hosted mining adds $0.06 to $0.10 per kWh in fees. Tax liability hits twice: ordinary income on coins received at market value, then capital gains on sale. Cooling, internet stability, and downtime further erode margins. All-in costs exceed simple electricity-times-hashrate models by 30% to 50%.
The Weekly Yield Report
You just reviewed breakeven thresholds at $0.06, $0.08, and $0.12 per kWh. Those rates and difficulty numbers will be different in two weeks.
Every Thursday: where crypto yield actually is - stablecoins, liquid staking and DeFi lending, with the risk named next to the rate and what changed since last week.
[Get it free every Thursday](#/portal/signup)
Free. No trade calls, no allocations, no hype. Unsubscribe in one click.
### How To Measure Exit Liquidity In Low Cap Tokens Before You Deploy Yield Capital
URL: https://altcoininvestor.com/how-to-check-liquidity-low-cap-crypto/
Last updated: 2026-10-05T23:04:29.000Z
## What You're Measuring and Why It Matters

A 45% APY on a low cap token is irrelevant if the first $5,000 sell order crashes the price by 18%. Exit liquidity determines whether the yield you see on a dashboard is yield you can actually extract. Most yield farmers check APY and TVL. The ones who keep their gains check whether the order book can absorb an exit without catastrophic slippage.
This guide walks through five quantitative liquidity metrics you can check in under ten minutes. Each has a hard threshold. Below that threshold, the token is a trap regardless of the headline yield. You'll learn how to read depth charts, estimate slippage before you trade, calculate position size limits based on pool depth, and recognize the early warning signs that liquidity is about to evaporate.
If you can't measure exit liquidity, you're not yield farming. You're just providing exit liquidity to someone else.
## Step One: Check 24-Hour Volume Against Your Intended Position Size
Start with the simplest filter. Pull up the token on CoinGecko or CoinMarketCap and find the 24-hour trading volume. If daily volume sits below $1 million, you're in high-risk territory. Below $300,000, you're in the danger zone. Below $100,000, don't deploy unless your position size is under $2,000 and you plan to exit in pieces over multiple days.
The rule of thumb: your position should represent no more than 10% of daily volume if you want a same-day exit without major slippage. A $10,000 position on a token doing $150,000 daily volume means you're 6.7% of the book. That's manageable on a centralized exchange order book with reasonable depth. On a thin DEX pool, it's a 12-15% slippage event.
Volume alone doesn't tell you everything. Wash trading inflates numbers. Self-trading and circular transactions create the illusion of activity without real token distribution. But volume below threshold is an automatic disqualifier. If the token can't clear $300,000 in real daily trades, the liquidity isn't there no matter what else looks good.
Cross-reference volume against market cap. A healthy token shows a volume-to-market-cap ratio between 2% and 10%. Below 1%, the price is hollow. Nobody's trading it. Above 50%, you're looking at a momentum play or a pump. Either scenario makes exit timing critical, and neither suggests the liquidity will be there when you need it three months from now.
## Step Two: Measure Bid-Ask Spread to Identify Cost of Entry and Exit
The spread is the gap between the highest buy order and the lowest sell order. On Bitcoin or Ethereum, you'll see spreads below 0.10%. On liquid altcoins, 0.15% to 0.30% is normal. Once spreads exceed 0.50%, you're paying a meaningful premium to both enter and exit. Above 2%, you've already lost 4% round-trip before the first minute of yield accrues.
Check the spread on the venue where you plan to trade. If the token lists on multiple exchanges, the spread will vary. A token might show 0.20% on a mid-tier centralized exchange and 1.80% on a small DEX pool. Always measure where you'll actually execute, not where the marketing materials show the tightest number.
Spreads widen during volatility and narrow during calm markets. If you check at 3 AM UTC when volume is low, you'll see the worst-case number. That's useful. It tells you what happens if you need to exit during off-peak hours or during a broader market selloff when liquidity providers pull back. The spread during peak hours is what you'll pay most of the time. The spread at 3 AM is what you'll pay when you need liquidity most.
For [screening low cap tokens](https://altcoininvestor.com/how-to-screen-low-cap-token/), treat any spread above 1% as a warning flag. It doesn't mean you skip the token. It means you reduce position size and build in a wider stop-loss to account for the round-trip cost.
## Step Three: Read the Depth Chart to Stress-Test Your Exit Size
A depth chart shows cumulative bid and ask orders at each price level. The y-axis is price; the x-axis is cumulative quantity. The steeper the walls on both sides, the more liquidity available near the current price. Shallow slopes mean thin books.
Here's how to use it. Decide your position size. Let's say $8,000\. Find the current mid-price on the chart. Walk down the bid side (the green or buy-side wall) and find where $8,000 worth of cumulative orders sit. Measure the percentage distance from the mid-price to that level. That's your expected slippage if you market-sell the full position in one order.
For a healthy mid-cap altcoin, you should see at least $100,000 of cumulative depth per side within 2% of mid-price. For blue-chips like Bitcoin or Ethereum, millions per side. For micro-caps under $10 million market cap, anything above $20,000 per side within 2% is passable. Below $20,000, you're in major danger territory.
DEX pools show depth differently than centralized limit order books. On Uniswap or PancakeSwap, the liquidity curve is determined by the automated market maker formula. You won't see discrete limit orders. Instead, check the total liquidity in the pool. If the pool holds $150,000 total and you're planning a $10,000 trade, you're trading 6.7% of the pool. On a constant product AMM, that translates to roughly 13-15% slippage because slippage scales non-linearly. A trade representing 1% of pool size causes about 2% slippage. At 10%, you're looking at 25% or more due to the x times y equals k curve.
This is the failure mode most yield farmers miss. They see $150,000 TVL in a pool and assume their $10,000 position is safe. They don't do the math. If you tried to run a $10,000 market order against a $150,000 equity position on a traditional trading desk, you'd be laughed out of the room. The same logic applies here.
## Step Four: Estimate Slippage Before You Trade
Slippage is the difference between the price you expect and the price you actually get. On major pairs with under $50,000 order size, expect slippage below 0.05%. On smaller altcoins, 0.5% to 2% is common. On micro-caps and meme coins, slippage routinely hits 3% to 5% or higher, especially during volatility.
You can estimate slippage manually using the depth chart method described above, or you can use a DEX aggregator's slippage preview tool. Matcha, 1inch, and Paraswap all show estimated slippage before you confirm a swap. If the tool shows slippage above 2% on a $5,000 trade, that's your signal to reduce size or wait for better liquidity.
Set your slippage tolerance accordingly. For stablecoin-to-stablecoin swaps, 0.1% is reasonable. For liquid majors like ETH or BTC against USDC, use 0.5%. For most altcoins, 1% to 2%. For low cap tokens on thin DEX pools, you may need to set tolerance at 5% or even 10% just to get the trade through. Understand what you're accepting. A 10% slippage tolerance on a $10,000 trade means you're willing to lose $1,000 to execution cost alone.
Compare your actual slippage to the estimate after the trade settles. If realized slippage consistently exceeds the preview by more than 50 basis points, you're trading during high volatility or the pool is experiencing front-running by MEV bots. Either way, that's a structural cost you need to factor into your yield calculations. An 8% APY that costs 2% per entry and 2% per exit becomes 4% net if you rebalance quarterly.
When evaluating [liquidity pool yield](https://altcoininvestor.com/liquidity-pools-crypto-yield-impermanent-loss/), always net out realistic slippage costs for the full round trip.
## Step Five: Analyze Holder Concentration and Liquidity Provider Count
A token can show decent volume and reasonable spreads but still collapse the moment one or two large holders decide to exit. Check holder distribution on Etherscan, BscScan, or the relevant block explorer. Look at the top 10 holders. If they control more than 50% of circulating supply, the token is a concentration risk. Between 30% and 50%, caution. Under 30%, you're in safer territory.
Exclude known addresses like the project treasury, burn addresses, and locked liquidity contracts from your count. Those tokens aren't liquid. What matters is how much tradeable supply sits in hands that could dump tomorrow.
For DEX pools, check how many liquidity providers are active. On major tokens like Ethereum or Solana, you'll see more than 20 effective providers contributing meaningful size. On smaller tokens, the count often drops to three to seven. A pool with three providers is vulnerable. If one pulls their liquidity, depth collapses by a third instantly. Your exit just got 30% more expensive.
Some tools give you an effective provider count weighted by contribution size. A pool might have 40 LPs but show an effective count of 4.2 because most of the liquidity comes from four wallets. That's a red flag. Research from late 2024 shows that micro-cap tokens under $5 million market cap average just 3.2 effective providers with an 89% concentration haircut. Small-cap tokens between $5 million and $50 million average 6.8 providers with a 47% haircut. The math is simple: fewer providers means higher fragility.
Verify whether liquidity is locked. On DEX pools, teams sometimes lock LP tokens in a time-lock contract to signal commitment. Check Dextools for a "Liquidity Locked" badge or examine the LP token holders on the block explorer. If the LP tokens sit in a standard wallet rather than a lock contract or burn address, the team can pull liquidity at any time. That's a soft rug waiting to happen.
## Step Six: Account for Market Fragmentation Across Venues
If a token trades on five small exchanges and two minor DEX pools with no dominant venue, liquidity is fragmented. Buy-side demand spreads too thin. You might see $600,000 daily volume in aggregate but only $80,000 on the venue where you hold your position. When you go to exit, your effective liquidity is $80,000, not $600,000.
Identify the primary trading venue before you deploy. Check where 60% or more of volume concentrates. That's where liquidity will be most reliable. If no single venue accounts for more than 30% of volume, fragmentation is a structural problem. The token might have total volume above your threshold, but no single exit path can absorb your size without slippage.
Centralized exchanges and decentralized pools behave differently under stress. A CEX order book can refill quickly if market makers are active. A DEX pool only refills when LPs add more capital, which often doesn't happen during a selloff. If your exit plan relies on a DEX pool, understand that the liquidity you see today may not be there tomorrow. [Evaluating altcoins](https://altcoininvestor.com/how-to-evaluate-altcoin-investment/) means planning for the liquidity environment that exists during drawdowns, not during the accumulation phase when everything looks fine.
## Step Seven: Check Token Unlock Schedules and Emission Rates
A token with $2 million market cap and strong current liquidity can turn into a trap overnight if a vesting event unlocks 10% of total supply. If 10 million tokens unlock and daily volume is only 500,000 tokens, the sell pressure will overwhelm available bids. Price gaps down, liquidity evaporates, and you're stuck.
Check the project's tokenomics documentation or use a tool like Token Unlocks to see the vesting schedule. Look for large cliff unlocks to team, advisors, or early investors. Monthly emissions are manageable if they're predictable and priced in. A 20% unlock hitting in two weeks is not.
Emissions also matter for liquidity mining programs. If the pool you're farming pays rewards in the native token, those rewards add to circulating supply every block. High emission rates create sustained sell pressure as farmers claim and dump rewards. If the pool is paying 60% APY in native tokens and daily volume is thin, every claimer is competing for the same shallow bid-side liquidity. You're farming a token that's being diluted faster than the yield compensates.
For a deeper explanation of unlock risk, see [how to evaluate ICO and IDO structures](https://altcoininvestor.com/how-to-evaluate-ico-ido/) before committing capital.
## Step Eight: Set Position Size Limits Based on Measured Liquidity
After running the checks above, you have five numbers: daily volume, bid-ask spread, depth within 2%, estimated slippage, and holder concentration. Use them to set a maximum position size.
If daily volume is $500,000, your position should not exceed $50,000 if you want a clean same-day exit. Realistically, keep it under $25,000\. If depth within 2% is only $40,000 per side, your position should not exceed $8,000 unless you're willing to accept 4-6% slippage. If estimated slippage on a $10,000 trade is already 3%, cut your size in half.
For low cap tokens, a working rule is to limit any single position to 5% of daily volume or 10% of visible depth within 2%, whichever is smaller. On a token doing $300,000 daily with $50,000 depth per side, your max position is $5,000\. Deploy $10,000 and you're taking on execution risk that turns an 8% monthly yield into a 2% net return after exit slippage.
If you're running multiple positions across several low cap pools, aggregate your liquidity exposure. Three $5,000 positions in tokens each doing $300,000 volume is safer than one $15,000 position in a single $300,000 volume token. Concentration amplifies execution risk. Diversification across multiple liquid venues reduces it, assuming each position individually meets minimum thresholds.
Always keep a margin buffer. If your risk model allows 1% loss on a trade and slippage could run 0.5%, your effective risk is 1.5%. Adjust stop widths accordingly. A 1% risk trade becomes a 1.5% real risk after accounting for round-trip costs on thin books.
## Step Nine: Monitor Liquidity Conditions During Your Hold Period
Liquidity is not static. A pool that showed $200,000 depth last week might show $60,000 today because two LPs withdrew. Volume that averaged $800,000 daily last month might have dropped to $200,000 this month because a liquidity mining incentive ended.
Set a weekly check. Pull up the same metrics you used before deployment. Compare current depth and volume to your entry baseline. If depth has dropped by more than 30%, consider reducing position size even if the yield is still attractive. If volume has fallen below your threshold, plan your exit. The yield you're accruing today is imaginary if you can't extract it tomorrow.
Watch for large single-day volume spikes. A token that averages $400,000 daily suddenly does $3 million. That's often a sign of a large holder exiting or a coordinated dump. Check the order book the next day. If depth collapsed after the spike, remaining liquidity may not support your exit. Spikes up can be just as dangerous as spikes down if they're followed by LP withdrawals.
For strategies involving [writing exit conditions before you buy](https://altcoininvestor.com/when-to-sell-low-cap-crypto/), build liquidity thresholds into your rules. If depth drops below $X or volume falls below $Y for three consecutive days, you exit regardless of P&L. That's risk management.
## Common Failure Modes and How to Spot Them Early
The single biggest mistake is confusing TVL with liquidity. A pool can have $5 million in TVL and still have terrible exit liquidity if most of that value is locked in long-tail pairs or illiquid tokens. TVL measures assets under management. It does not measure how much capital is available at the current price to absorb your sell order. If you tried to liquidate a $5 million private equity stake in an illiquid fund, you'd expect a discount. Same principle here.
Another failure mode is trusting aggregated volume without checking where it concentrates. A token might report $2 million daily across 10 venues, but if $1.6 million of that is on a single unregulated offshore exchange known for wash trading, your real liquidity is $400,000 or less. Always verify the venue mix. If more than 50% of volume comes from a single suspicious exchange, treat the number as inflated.
Third failure mode: ignoring latency and order book staleness. The depth chart you see on your screen is not real-time. It's delayed by milliseconds to seconds depending on the exchange API. In fast markets, displayed liquidity can disappear before your order reaches the matching engine. High-frequency traders and arbitrage bots pull orders when they sense momentum. The depth you saw five seconds ago is not the depth you'll trade into now. For small-cap tokens, add a 10-20% buffer to your slippage estimate to account for latency and order cancellations.
Fourth failure mode: entering a position during a liquidity mining incentive program without checking the program end date. The pool shows great depth today because the protocol is paying 40% APY in incentives. In six weeks the program expires, half the LPs exit, depth collapses, and you're holding a position you can't exit cleanly. Always check incentive schedules. Know when they end. Plan your exit before the deadline.
For additional context on evaluating liquidity-dependent strategies, see [minimum liquidity depth for low cap positions](https://altcoininvestor.com/minimum-liquidity-depth-low-cap-positions/).
## What to Do If You're Already Holding a Low-Liquidity Position
If you deployed before checking liquidity and you're now stuck in a thin pool, you have three options. First, exit in pieces over multiple days. Break your $10,000 position into five $2,000 sells spaced over a week. Monitor the order book after each trade. If depth refills, continue. If it doesn't, pause.
Second, wait for a volume spike. Set an alert for 2x average daily volume. When it triggers, check the order book. If depth temporarily improves, exit as much as you can into the spike. You won't get the best price, but you'll get out.
Third, provide liquidity yourself. If you're holding a token in a farming position and the pool depth is collapsing, consider converting half your position into a liquidity provision. You'll collect swap fees and you'll be on the other side of the trade when liquidity is needed. This only works if you believe the pool will continue generating fee volume and if you're comfortable with impermanent loss risk. It's not a solution if the token is in structural decline.
For more on managing impermanent loss in thin pools, reference [how liquidity pools generate yield and what IL costs you](https://altcoininvestor.com/liquidity-pools-crypto-yield-impermanent-loss/).
## The Takeaway
Exit liquidity is not a feeling. It's a number. Measure depth within 2%, check volume against your position size, calculate slippage before you trade, verify holder concentration, and set hard thresholds. If a token fails two or more of those checks, reduce size by half or skip it entirely. The 60% APY you see on a dashboard becomes a 15% realized return after slippage if you can't exit cleanly. The best yield strategy is the one you can actually close when it stops working.
## Frequently Asked Questions
### What is the minimum daily trading volume needed to safely deploy a $10,000 position in a low cap token?
Your position should represent no more than 10% of daily volume for a clean same-day exit. For a $10,000 position, look for minimum daily volume of $100,000, though $200,000 or higher significantly reduces slippage risk. Tokens doing under $300,000 daily are high-risk; under $100,000 is danger territory. Always cross-reference volume with order book depth within 2% of mid-price to confirm the liquidity is real and not inflated by wash trading.
### How do I calculate expected slippage before executing a trade on a DEX pool?
For constant product AMMs like Uniswap, slippage scales non-linearly with trade size as a percentage of total pool liquidity. A trade representing 1% of pool size causes roughly 2% slippage; 10% of pool size can cause 25% or more. Divide your intended trade size by total pool liquidity (TVL) to get the percentage, then multiply by approximately 2 for small trades or use a DEX aggregator's slippage preview tool for precise estimates. Always add a 10-20% buffer for latency and front-running.
### What bid-ask spread indicates a low cap token has dangerous liquidity?
Spreads above 0.50% signal increased cost and risk; above 1% is a warning flag requiring reduced position size; above 2% means you're losing 4% round-trip before any yield accrues. Healthy altcoins show spreads between 0.15% and 0.30%. For reference, Bitcoin and Ethereum typically maintain spreads below 0.10%. Check spreads during off-peak hours (3 AM UTC) to see worst-case conditions, which reveal what happens when you need emergency exit liquidity during market stress.
### How much order book depth should I see within 2% of the mid-price for a safe low cap position?
For mid-cap altcoins, look for at least $100,000 cumulative per side within 2% of mid-price. For micro-caps under $10 million market cap, minimum acceptable depth is $20,000 per side; below that is major danger. Blue-chip tokens like Bitcoin and Ethereum show millions per side. Your position size should not exceed 10% of visible depth if you want to exit without triggering 4-6% slippage. Always verify depth on the specific venue where you plan to trade, not aggregated across all exchanges.
### What holder concentration percentage indicates a low cap token is too risky to deploy yield capital?
If the top 10 holders control more than 50% of circulating supply, the token is a high concentration risk and one large exit can collapse liquidity. Between 30% and 50% requires caution and reduced position size; under 30% is safer territory. Exclude project treasury, burn addresses, and verified locked liquidity contracts from your count since those tokens are not liquid. Check holder distribution on block explorers like Etherscan or BscScan, and verify that liquidity provider tokens are locked in time-lock contracts rather than standard wallets.
The Weekly Yield Report
You have just learned how to measure depth, slippage, and concentration thresholds for low cap exit liquidity. Those numbers change daily and the pools you checked last week may not support your exit this week.
Every Thursday: where crypto yield actually is - stablecoins, liquid staking and DeFi lending, with the risk named next to the rate and what changed since last week.
[Get it free every Thursday](#/portal/signup)
Free. No trade calls, no allocations, no hype. Unsubscribe in one click.
### Best Crypto ETFs Compared: Fees, Holdings, Direct Staking
URL: https://altcoininvestor.com/best-crypto-etf/
Last updated: 2026-10-05T22:06:04.000Z
## The Decision You Are Actually Making
The question of which crypto ETF to buy is the wrong question for most holders. The question that matters is whether you should use an ETF wrapper at all, or whether direct ownership plus self-custody plus staking earns you more after fees. The answer depends on three numbers: the expense ratio you pay annually, the yield you forfeit by holding an ETF instead of the underlying asset, and the tax wrapper you are using. For holders with more than six months of experience, direct ownership wins in almost every scenario outside of a tax-advantaged retirement account.
If you must use an ETF, the product landscape has clarified significantly since the spot Bitcoin ETFs launched in January 2024\. Morgan Stanley Bitcoin Trust (MSBT) charges 0.14% annually, one basis point below Grayscale Bitcoin Mini Trust (BTC) at 0.15%. iShares Bitcoin Trust (IBIT) charges 0.25% but has superior tracking accuracy, meaning the all-in cost may be lower. Grayscale Bitcoin ETF (GBTC), the converted trust, still charges 1.50%. On the Ethereum side, Bitwise Ethereum ETF (ETHW) charges 0.20%, while Grayscale Ethereum Staking ETF (ETHE) charges 2.91% all-in when you include the sponsor fee and staking commission.
Those numbers matter because fees compound. The expense ratio is not a one-time cost. It is a permanent drag on your returns, accruing every year you hold the position, and it determines whether the convenience of an ETF wrapper justifies the loss of yield and control.
## Expense Ratios and Tracking Error

MSBT at 0.14% is the lowest-fee Bitcoin ETF in the U.S. market. For a $100,000 position, that costs $140 in the first year, compounding to approximately $1,400 over ten years assuming flat Bitcoin prices. IBIT at 0.25% costs $250 in year one, approximately $2,528 over ten years. GBTC at 1.50% costs $1,500 in year one, approximately $14,017 over ten years.
The difference between IBIT and GBTC over a decade is $11,489 for identical Bitcoin exposure. That spread exists because GBTC converted from a closed-end trust with embedded illiquidity premium and has not reduced its fee to competitive levels. If you hold GBTC in a taxable account, you are paying $11,489 more than necessary over ten years for the same Bitcoin exposure.
Tracking error adds a second layer of cost that expense ratios alone do not capture. Across the 11 U.S. spot Bitcoin ETFs, tracking error ranges from 0.03% to 0.42% annualized. When tracking error is included, IBIT at 0.25% may have the lowest total cost of ownership because BlackRock's execution and custody mechanics produce less drift between the ETF's net asset value and Bitcoin's spot price. That means the listed expense ratio understates the true cost for high-tracking-error products and overstates it for funds with tight execution.
On the Ethereum side, ETHW at 0.20% is the lowest-cost wrapper. ETHA charges 0.25%. ETHE charges 2.50% sponsor fee plus 0.41% staking fee, for a total annual drag of 2.91%. The fee difference between ETHW and ETHE is 2.71% per year. Over ten years, that is $27,100 in foregone returns on a $100,000 position, assuming flat Ethereum prices.
## The Yield You Forfeit By Holding an ETF

Ethereum staking yield in 2026 sits at approximately 2.78% base APR. Validators running MEV-Boost capture an additional 0.5-1% from maximal extractable value, meaning realistic all-in yield for a well-operated node is 3.3-3.8%. Solo stakers with 32 ETH capture the full base APR plus MEV. Liquid staking providers like Lido and Rocket Pool take a commission, typically 10%, so a holder using those services receives approximately 90% of gross yield, or 3.0-3.4% net.
Exchange staking is worse. Coinbase takes a 25-35% commission on [staking rewards](https://altcoininvestor.com/crypto-staking-returns-across-chains/), meaning if the base Ethereum rate is 3.5%, you receive approximately 2.5% after Coinbase's cut. Binance is more competitive at 10-20%, but availability varies by region.
If you hold ETHW at 0.20%, you receive zero staking yield. The ETF holds raw Ethereum, and U.S. regulations as of early 2026 still prevented most Ethereum ETFs from staking the underlying collateral. BlackRock's ETHB product is an exception, distributing approximately 82% of staking rewards to investors as monthly cash payments, producing a net yield of approximately 3.1% before the 0.25% expense ratio.
ETHE charges 2.91% all-in and distributes staking yield, but the net return to holders after fees is approximately 0.4-0.9% lower than what a self-custodied holder running a solo validator would capture. That gap widens when you compare it to liquid staking at 10% commission, which delivers 3.0-3.4% net. Over ten years, the yield difference between ETHE and direct staking is $4,000 to $9,000 on a $100,000 position, assuming flat Ethereum prices and stable staking yields.
Bitcoin does not support native proof-of-stake, so there is no staking yield to forfeit. However, direct Bitcoin holders can lend their BTC on platforms that pay interest, typically 2-5% depending on the platform, duration, and counterparty risk. ETF holders cannot lend the shares because the Bitcoin is held in custody by the fund. That means the opportunity cost of holding a Bitcoin ETF instead of direct BTC is whatever yield you could earn by lending or using the asset in a productive way. For holders who never lend and never use their Bitcoin, the cost is zero. For holders who do, the cost is 2-5% annually.
## The Tax Argument For ETFs Falls Apart In Most Cases
The usual argument for ETFs is tax simplicity. Brokers handle cost basis reporting automatically. Starting with the 2026 tax year, the IRS 1099-DA regime requires custodial brokers to report both gross proceeds and cost basis, so Bitcoin held through an ETF or on a U.S. exchange is fully legible to the tax authority by design. That makes ETF reporting slightly easier than self-custody reporting, but the gap is smaller than it was in 2023.
The tax argument weakens further when you consider that most [tax professionals](https://altcoininvestor.com/cryptocurrency-taxes/) treat spot Bitcoin ETF shares as securities subject to wash sale rules, while direct BTC, classified as property under IRS Notice 2014-21, is currently exempt. That means direct holders can sell at a loss and immediately repurchase to harvest tax losses, while ETF holders must wait 30 days. For active tax-loss harvesters, the wash sale exemption on direct crypto is worth more than the reporting convenience of an ETF.
If you hold crypto in an IRA or 401(k), the tax argument reverses. In those accounts, you cannot hold direct crypto unless your custodian supports it, which most do not. [Fidelity and a handful of others](https://www.fidelity.com/etfs/crypto-funds) allow direct crypto in IRAs, but the majority of retirement accounts only allow ETFs or other securities. In that narrow case, the ETF is the only way to gain Bitcoin or Ethereum exposure inside the tax wrapper, and the expense ratio is the price you pay for access.
### Estate Planning and Operational Risk
If you die holding an ETF, your heirs receive the shares through your brokerage account with standard estate procedures. If you die holding direct crypto, your heirs need the private keys, the hardware wallet PIN, and the knowledge to access the funds. If you did not document that information, the crypto is unrecoverable.
That operational risk is real. It is also solvable. Multisignature wallets, key-splitting protocols, and estate planning services designed for crypto holders now exist. The cost of implementing those systems is approximately $500 to $2,000 upfront, depending on the service. For holders with more than $50,000 in crypto, that one-time cost is less than the expense ratio you pay in year two of holding an ETF.
## The Futures ETF Trap
ProShares Bitcoin Strategy ETF (BITO) charges approximately 0.95% annually and holds Bitcoin futures contracts rolled monthly. When futures trade in contango, which is typical for Bitcoin, rolling costs bleed 6-8% per year of return. That cost does not appear in the expense ratio. It appears as tracking error between the ETF's returns and Bitcoin's spot price.
Buying a futures Bitcoin ETF when a spot equivalent exists is, in almost every retail scenario, paying a hidden 6-8% per year for no benefit. The only use case for a futures-based crypto ETF is if you need 60/40 tax treatment under Section 1256, which benefits active traders. Long-term holders should never hold a futures ETF when a spot ETF is available.
## Custody Concentration and Regulatory Risk
Coinbase Custody holds Bitcoin for 9 of the 13 U.S. spot Bitcoin ETFs. Gemini serves as custodian for VanEck's Bitcoin ETF. That means if Coinbase experiences a custody failure, operational issue, or regulatory action, the majority of U.S. Bitcoin ETF holders are exposed to the same risk simultaneously. Self-custody eliminates that concentration risk entirely.
ETF holders also face regulatory risk that direct holders do not. If the SEC reverses its approval of spot ETFs or imposes new restrictions, ETF holders are locked into whatever the fund's board decides to do. Direct holders can move their Bitcoin across borders, across wallets, or into cold storage without asking permission.
## Breakeven Holding Periods
For Bitcoin, the breakeven calculation is straightforward. A hardware wallet costs $79 to $219 one-time. IBIT charges 0.25% annually. On a $100,000 position, IBIT costs $250 in year one. After one year, the hardware wallet has already paid for itself. By year ten, the hardware wallet holder has saved $2,378 relative to IBIT, and $13,867 relative to GBTC.
For Ethereum, the math includes staking yield. If you can earn 3.3-3.8% all-in via solo staking or 3.0-3.4% via liquid staking at 10% commission, and you hold ETHW at 0.20% with zero staking yield, you forfeit 3.0-3.8% annually. On a $100,000 position, that is $3,000 to $3,800 per year. Over ten years, that is $30,000 to $38,000 in foregone yield.
If you hold ETHE at 2.91% all-in with staking yield distributed, the comparison is closer. ETHE delivers approximately 0.4-0.9% less than solo staking, which costs $400 to $900 per year on a $100,000 position, or $4,000 to $9,000 over ten years. A hardware wallet plus the operational cost of running a validator node costs approximately $150 one-time for the wallet plus $100-$200 per year in electricity and maintenance. That means the breakeven period for direct staking versus ETHE is approximately six months to one year, depending on yield assumptions.
## Who Each Option Is Right For
ETFs make sense for:
- Holders using an IRA or 401(k) where direct crypto custody is unavailable
- Holders with less than $5,000 invested, where hardware wallet overhead is disproportionate
- Holders who cannot manage private keys, PIN codes, and seed phrase backups
- Holders who need exposure for less than six months and do not want to set up custody infrastructure
Direct ownership makes sense for:
- Holders with more than $5,000 invested
- Holders with a time horizon longer than 12 months
- Ethereum holders who want to capture staking yield
- Holders who value tax-loss harvesting without wash sale restrictions
- Holders who want to eliminate custodial concentration risk
- Holders who want the ability to lend, use, or move assets without fund board approval
## The Recommendation
If you are using a tax-advantaged retirement account and your custodian does not support direct crypto, use MSBT at 0.14% for Bitcoin exposure and ETHW at 0.20% for Ethereum exposure. Those are the lowest-cost wrappers available.
If you are holding in a taxable account with more than $5,000 and a time horizon longer than 12 months, buy direct. Use a hardware wallet. Set up a validator or use a liquid staking provider at 10% commission. The yield you capture and the fees you avoid will exceed $10,000 over ten years on a $100,000 position. That is the real cost of convenience.
If you are holding Ethereum and you want staking yield inside an ETF wrapper, ETHB at 0.25% distributes approximately 3.1% net. That is competitive with exchange staking at 25-35% commission, but it is still 0.2-0.7% lower than liquid staking at 10% commission. The gap is small enough that the convenience of the ETF may be worth it if you are holding in an IRA, but not if you are holding in a taxable account where you could stake directly.
## The Takeaway
Expense ratios are permanent drags. GBTC at 1.50% costs $14,017 over ten years on a $100,000 position. IBIT at 0.25% costs $2,528\. Direct ownership costs $150 one-time for a hardware wallet. On Ethereum, the yield gap between direct staking and ETHW is $30,000 to $38,000 over ten years. ETFs solve a custody problem for retirement accounts and short-term holders. For everyone else, they are expensive wrappers around assets you could hold more efficiently yourself. The convenience is real. The cost is higher than most holders realize. The breakeven period is shorter than one year.
## Frequently Asked Questions
### What is the lowest-fee Bitcoin ETF available in 2026?
Morgan Stanley Bitcoin Trust (MSBT) charges 0.14% annually, one basis point below Grayscale Bitcoin Mini Trust at 0.15%. iShares Bitcoin Trust (IBIT) charges 0.25% but may have lower total cost of ownership when tracking error is included, because BlackRock's execution produces less drift between the ETF's net asset value and Bitcoin's spot price. Avoid Grayscale Bitcoin ETF (GBTC) at 1.50%, which costs $11,489 more than IBIT over ten years on a $100,000 position.
### Do Ethereum ETFs allow me to earn staking rewards?
Most U.S. Ethereum ETFs hold raw Ethereum and distribute zero staking yield. Bitwise Ethereum ETF (ETHW) at 0.20% and iShares Ethereum Trust (ETHA) at 0.25% do not stake. BlackRock's ETHB distributes approximately 82% of staking rewards as monthly cash payments, producing net yield of approximately 3.1% before the 0.25% expense ratio. Grayscale Ethereum Staking ETF (ETHE) charges 2.91% all-in and distributes staking yield, but delivers 0.4-0.9% less than solo staking after fees.
### When does direct crypto ownership beat holding an ETF?
Direct ownership beats ETF wrappers for holders with more than $5,000 invested, a time horizon longer than 12 months, and basic custody competence. A hardware wallet costs $79-$219 one-time. IBIT at 0.25% costs $2,528 over ten years on a $100,000 position. For Ethereum, the yield gap between direct staking at 3.3-3.8% and ETHW at 0% is $30,000-$38,000 over ten years. The breakeven period is less than one year unless you are holding in an IRA where direct custody is unavailable.
### Are futures-based Bitcoin ETFs a good option?
No. ProShares Bitcoin Strategy ETF (BITO) charges 0.95% and holds Bitcoin futures rolled monthly. When futures trade in contango, rolling costs bleed 6-8% per year in hidden tracking error. That cost does not appear in the expense ratio but shows up as underperformance versus Bitcoin's spot price. Buying a futures ETF when spot ETFs exist is paying 6-8% annually for no benefit. The only use case is if you need Section 1256 tax treatment, which benefits active traders, not long-term holders.
### What is the main risk of holding crypto through an ETF?
Custodial concentration risk and regulatory exposure. Coinbase Custody holds Bitcoin for 9 of 13 U.S. spot Bitcoin ETFs. If Coinbase experiences a custody failure or regulatory action, the majority of ETF holders are exposed simultaneously. ETF holders also cannot move assets during off-market hours, cannot lend or stake their holdings unless the fund permits it, and are locked into whatever the fund's board decides if SEC rules change. Self-custody eliminates those risks entirely.
The Weekly Yield Report
You have just compared 12 ETF wrappers charging between 0.14% and 2.91% annually. Those expense ratios change, tracking error drifts, and staking yields move with network participation.
Every Thursday: where crypto yield actually is - stablecoins, liquid staking and DeFi lending, with the risk named next to the rate and what changed since last week.
[Get it free every Thursday](#/portal/signup)
Free. No trade calls, no allocations, no hype. Unsubscribe in one click.
### How To Read Token Vesting Schedules And Predict Unlock Selling Pressure
URL: https://altcoininvestor.com/token-vesting-schedule-analysis/
Last updated: 2026-10-05T21:06:18.000Z
## The Question That Separates Prepared Investors From Surprised Ones
A protocol advertises 40% APY on staking. You allocate capital. Three months later, the token has declined 35%, erasing any yield you earned and then some. What you missed was the vesting schedule. A cliff unlock released 15% of total supply to early investors on a single day, and most of them sold within 48 hours.
The question worth answering is this: how do you read a token vesting schedule to predict when large supplies will hit the market, and how do you verify those schedules on-chain when project documentation is incomplete or misleading?
Token vesting schedules control when locked tokens become tradable. Teams, investors, and advisors typically receive allocations subject to multi-year vesting periods with cliff dates and linear release mechanisms. When those locks expire, new supply enters circulation. If the release is large relative to existing circulating supply, sell pressure follows. If you are staking or providing liquidity in that token, the yield you earn can be erased by price declines tied to predictable unlock events you could have anticipated.
## The European Precedent: Why This Matters Beyond Token Mechanics

The dynamic at work here is not new. It is a supply shock, and monetary history has seen versions of this pattern for centuries. When the Banque de France suspended gold convertibility in 1936, the immediate effect was not inflation but the anticipation of inflation. Traders positioned ahead of the policy change, and by the time the suspension was official, the franc had already declined. The event itself mattered less than the foreknowledge that it was coming.
Token unlocks function the same way. The unlock date is public information, encoded in smart contracts or disclosed in documentation. The sell pressure begins before the unlock itself, as traders anticipate the new supply and position accordingly. By the time the tokens actually unlock, the price has often already adjusted downward.
The 2011-2012 eurozone sovereign debt crisis offers another parallel. Greek bond yields spiked not when Greece defaulted but when it became clear that a default was probable. The market priced in the future event long before it occurred. Vesting schedules give you the same kind of forward visibility. If you know a 10% supply increase is scheduled in six weeks, and you know who is receiving those tokens, you can estimate the likely sell pressure and adjust your position before the market reprices the asset.
## How Vesting Schedules Are Structured
The most common vesting structure for team and early investor tokens follows a pattern that has become industry standard: a cliff period during which zero tokens are tradable, followed by a linear or monthly release over a multi-year period.
Team and founder allocations typically have 0% unlocked at token generation event (TGE), a 12-month cliff, and then a 36-month linear vesting period. Total duration: four years. During the first 12 months, none of those tokens can be sold. After the cliff, tokens unlock gradually, either monthly or continuously, until the full allocation is tradable.
Seed investors usually receive 5-10% of their allocation at TGE, face a 6-month cliff, and then vest over 18-24 months. Private sale participants get 10-15% at TGE, a 3-month cliff, and vest over 12-18 months. Public sale buyers receive 20-50% at TGE, no cliff, and vest over 6-12 months.
The structure reflects risk and lockup duration. The earlier the capital, the longer the vesting period and the stricter the cliff. Public buyers get immediate liquidity because they paid closer to market price and took execution risk.
What matters for sell pressure prediction is not the total vesting period but the size and timing of individual unlock events relative to circulating supply. A 5% unlock when 80% of tokens are already circulating has minimal impact. A 10% unlock when only 20% is circulating can move the market 15-30% in the week surrounding the event.
### Cliff vs. Linear Release Patterns
There are two primary unlock mechanisms: cliff unlocks and linear vesting.
A cliff unlock releases a large block of tokens on a single date. If a project allocated 10 million tokens to seed investors with a 12-month cliff, all 10 million become tradable on the same day. That creates a predictable, concentrated sell pressure event. Even if not all recipients sell immediately, the market anticipates that some will, and prices adjust downward ahead of the unlock.
Linear vesting distributes the same 10 million tokens gradually. Instead of unlocking all at once, the contract might release approximately 27,000 tokens per day over the year following the cliff. Each daily release is negligible relative to trading volume, so sell pressure is diluted across time. The total supply increase is identical, but the market impact is far smaller.
Projects with smooth unlock curves, where no single month adds more than 2-3% to circulating supply, show better price stability than projects with large monthly cliff events. Historical data from [DefiLlama's unlock tracker](https://defillama.com/unlocks) shows that tokens with lumpy unlock schedules experience 15-40% price declines in the 30 days surrounding major unlock events, while tokens with linear vesting schedules show no consistent correlation between unlock dates and price movement.
## How to Verify Vesting Schedules On-Chain
Project websites and whitepapers are weak evidence. Teams can publish outdated schedules, omit details about admin controls, or describe vesting mechanisms that do not match what the smart contract actually enforces. The only reliable source is the blockchain itself.
On Ethereum and EVM-compatible chains, vesting is typically enforced by a separate smart contract that holds the locked tokens and releases them according to predefined rules. You can verify these contracts directly using [Etherscan or equivalent block explorers](https://ethereum.org/developers/docs/standards/tokens/).
### Step-by-Step On-Chain Verification
First, locate the token contract address. This is public information, listed on CoinGecko, the project website, or the token's official documentation. Open the contract in Etherscan.
Second, check the contract's transaction history and holder distribution. If large amounts of tokens are held by a small number of addresses, those are likely vesting contracts, team wallets, or exchange reserves. Identify the largest holders.
Third, examine each large holder address. If it is a contract, open it and read the verified source code. Look for functions named \`release\`, \`withdraw\`, or \`claim\`, and check the logic that controls when those functions can be executed. The contract will specify a start date, a cliff duration, and a vesting duration. These parameters are the ground truth.
Fourth, verify whether the vesting contract has admin controls. Some contracts include functions like \`setVestingSchedule\` or \`accelerateVesting\` that allow the contract owner to modify terms after deployment. If those functions exist, the vesting schedule is not truly immutable, and the project could bypass locks.
Fifth, check for upgrade mechanisms. If the contract uses a proxy pattern (common with OpenZeppelin's upgradeable contracts), the underlying logic can be changed by the contract admin. That means the vesting schedule you read today could be altered tomorrow without any on-chain evidence until after the change is made.
### Red Flags That Indicate Fake or Bypassable Vesting
A vesting chart on a project website is only credible if the token contract lacks mint controls, hidden admin permissions, transfer restrictions, blacklist functions, or upgrade paths that can bypass the locks. If any of those exist, the vesting schedule is unenforceable.
Fake vesting is common. A project publishes a four-year vesting chart for the team allocation but retains a \`mint\` function that can create new tokens and send them to any address. The vesting schedule is real for the tokens currently locked, but meaningless if the team can mint additional tokens outside the vesting contract.
Another pattern: the vesting contract enforces a schedule, but the token contract includes a \`pause\` function that prevents all transfers except those initiated by the contract owner. The team's tokens are technically locked, but they control who can trade and when. That is not vesting; it is administrative discretion dressed up as a schedule.
If you cannot verify the vesting schedule on-chain, or if the contract includes admin overrides, treat the published schedule as aspirational rather than binding.
## How to Estimate Sell Pressure From Unlock Events
Not all unlocks create equal sell pressure. The impact depends on three factors: the size of the unlock relative to circulating supply, the identity of the recipients, and the token's existing liquidity.
### Size Relative to Circulating Supply
A single unlock releasing 5% or more of circulating supply typically creates 5-15% sell pressure within 48 hours. That is the historical median from high-liquidity tokens tracked by Token Unlocks and DefiLlama. For lower-liquidity tokens, the impact can be larger.
The calculation is straightforward. If circulating supply is 100 million tokens and an unlock releases 10 million tokens to early investors, that is a 10% supply increase. If those investors sell even 30% of their allocation within the first week, that is 3 million tokens hitting the market. Compare that to the token's average daily trading volume. If daily volume is 2 million tokens, a 3 million token sell-off over a few days will overwhelm bid liquidity and push the price down.
### Identity of the Recipients
Team and investor unlocks create more sell pressure than community or ecosystem unlocks. Early investors are profit-takers. They bought at a fraction of the current price, and many will liquidate at least a portion of their allocation to realize gains. Community airdrops and ecosystem grants are often distributed to users who are already engaged with the protocol, and their selling behavior is less predictable and more gradual.
Before acting on unlock data, verify who is receiving the unlocked tokens. If the unlock goes to a foundation wallet or an ecosystem fund, it may not hit the market immediately. If it goes to a known venture capital address or an early investor multisig, anticipate sell pressure.
### Liquidity Depth
The same unlock event has different impacts depending on the token's existing liquidity. A 5% supply increase in a token with deep order books and $50 million daily volume is absorbed easily. The same 5% increase in a token with $2 million daily volume can cause a 20% price drop.
Check the token's liquidity on major decentralized exchanges and centralized order books. If the majority of liquidity is concentrated in one or two pools, and the unlock is large relative to that liquidity, expect volatility.
## Combining Vesting Data With Emission Schedules
Vesting unlocks are only one source of new supply. Many tokens also have programmatic emissions, issuing new tokens as staking rewards, liquidity mining incentives, or validator payouts. To predict total sell pressure, you need to layer vesting unlocks on top of emission schedules.
If a token emits 2% of supply per month as staking rewards, and a vesting unlock adds another 5% in a single month, the combined supply increase is 7%. That is the total new supply hitting the market. If the token is not deflationary (burning tokens or removing them from circulation), that 7% will dilute existing holders unless demand increases proportionally.
Tools like Token Terminal and DefiLlama provide emission data alongside unlock schedules, allowing you to build a complete supply pressure timeline. For [staking positions](https://altcoininvestor.com/staking-rewards-explained-calculation-reductions/), this is critical. A 30% APY staking yield is not attractive if the token inflates 40% per year through combined emissions and unlocks. Your nominal yield is positive, but your real return is negative.
## When Vesting Schedules Matter Most for Yield Positions
If you are providing liquidity or staking in a token with upcoming unlocks, the vesting schedule determines whether your yield position is sustainable.
Large unlocks depress token prices, which reduces the dollar value of your staking rewards even if the APY percentage remains unchanged. If you stake 10,000 tokens earning 40% APY, you will receive 4,000 tokens over the year. If the token price declines 30% due to unlock-related sell pressure, your 4,000 tokens are worth 30% less in dollar terms. Your effective yield is closer to 8%, not 40%.
The same applies to [liquidity provision](https://altcoininvestor.com/liquidity-pools-crypto-yield-impermanent-loss/). If you are providing liquidity in a token pair and one side of the pair experiences a large unlock, the price imbalance creates impermanent loss. The fees you earn from swaps may not compensate for the loss from price divergence.
The optimal strategy is to avoid entering yield positions immediately before large unlocks and to consider exiting or reducing exposure in the weeks leading up to a major cliff event. The yield you earn in the interim is unlikely to offset the price impact.
## How to Access and Interpret Unlock Data
Several free tools aggregate vesting and unlock data. DefiLlama's unlock tracker monitors over 500 protocols, showing upcoming unlock dates, amounts, and historical price impact. Token Unlocks and Tokenomist provide similar data with calendar views and impact estimates.
When using these tools, verify the data against on-chain sources. Aggregators rely on project-submitted information, which can be outdated or incomplete. Cross-reference the unlock schedule with the vesting contract itself.
Check whether unlocked tokens go to a wallet or directly to an exchange. Tokens transferred to known exchange deposit addresses indicate intent to sell. Tokens sent to a multi-signature wallet or a governance contract may remain off-market for months.
Monitor the historical behavior of previous unlocks for the same project. If past unlocks consistently triggered sell-offs, expect similar behavior from future events. If previous unlocks had no measurable price impact, the market may already be pricing in the dilution, or recipients may be long-term holders.
## The Takeaway
Token vesting schedules are not background information. They are forward-looking supply shock indicators. A cliff unlock releasing 10% of supply to early investors will create sell pressure, and that pressure is predictable weeks in advance if you read the contract and verify the schedule on-chain. Most projects publish vesting charts, but the only reliable source is the smart contract itself. Check for admin overrides, mint functions, and upgrade paths. If the contract can be modified, the schedule is not enforceable. If you are staking or providing liquidity, vesting unlocks determine whether your yield will be erased by price declines tied to predictable supply increases you could have anticipated. The projects that survive have smooth, linear unlock schedules that prevent large single-day supply shocks. The projects that do not typically have lumpy vesting structures that concentrate sell pressure into a few high-impact events. That difference is visible on-chain months before it shows up in the price.
## Frequently Asked Questions
### What is a token vesting cliff and how does it affect sell pressure?
A cliff is a period during which zero tokens from an allocation are tradable. After the cliff date, tokens unlock either all at once or begin a linear vesting schedule. A 12-month cliff with a single-day unlock creates concentrated sell pressure because the entire allocation becomes liquid simultaneously. Linear vesting after a cliff distributes sell pressure over time, releasing small amounts daily or monthly, which has minimal market impact compared to lump-sum unlocks.
### How can I verify a token vesting schedule on-chain instead of trusting project documentation?
Locate the token contract address on Etherscan or an equivalent block explorer. Identify large holder addresses, which are often vesting contracts. Open those contracts and read the verified source code, looking for functions like release or withdraw that define unlock timing. Check for admin controls such as setVestingSchedule or upgrade mechanisms that allow the project to modify terms. If those exist, the published schedule is not binding. The contract code is the only reliable source.
### What percentage supply increase from a token unlock typically causes measurable price impact?
Unlocks releasing 5% or more of circulating supply typically create 5-15% sell pressure within 48 hours for liquid tokens. For lower-liquidity assets, the impact can reach 15-40% in the 30 days surrounding the unlock. The actual impact depends on who receives the tokens, whether they transfer to exchanges, and the token's existing trading volume. A 5% unlock absorbed by deep liquidity has minimal effect; the same increase in a low-volume token can trigger sharp declines.
### Why do team and investor unlocks create more sell pressure than community unlocks?
Team and early investors typically bought tokens at a fraction of market price and view unlocks as profit-taking opportunities. They are more likely to liquidate portions of their allocation immediately to realize gains. Community recipients and ecosystem grants often go to engaged users who hold longer or sell gradually. Historical data shows team and investor unlocks correlate with higher immediate sell pressure, especially when tokens transfer directly to exchange deposit addresses before the unlock date.
### How do I combine vesting unlocks with token emission schedules to predict total supply pressure?
Vesting unlocks and programmatic emissions both increase circulating supply. A token emitting 2% monthly as staking rewards plus a 5% vesting unlock in the same month creates 7% total new supply. If the token is not deflationary through burns or buybacks, that dilutes existing holders unless demand increases proportionally. Tools like DefiLlama and Token Terminal show both unlock schedules and emission rates, allowing you to build a complete supply timeline and calculate net inflation for any given period.
The Weekly Yield Report
You now have the on-chain verification methods to read vesting schedules before unlock events move the market. Those schedules change, and new projects launch weekly with structures you will need to evaluate.
Every Thursday: where crypto yield actually is - stablecoins, liquid staking and DeFi lending, with the risk named next to the rate and what changed since last week.
[Get it free every Thursday](#/portal/signup)
Free. No trade calls, no allocations, no hype. Unsubscribe in one click.
### Morpho Lending Reviews: Rate Improvement Over Aave, Vault Risk, And Optimizer Performance
URL: https://altcoininvestor.com/morpho-lending-reviews/
Last updated: 2026-10-05T19:05:10.000Z
## The Rate Improvement Question
Morpho typically pays 50 to 200 basis points more than Aave on USDC. That spread is not promotional. It is structural.
Morpho vaults currently offer 4-8.5% on USDC supply while Aave V3 pays 3.8-6.2% on the same asset. In April 2026, conservative Morpho vaults yielded 4-5% while aggressive curator strategies reached 6-8%. The premium exists because less of the borrow spread is lost to idle pool capital. Aave pools often run at 40-60% utilization, which means a meaningful share of supplied capital sits idle and dilutes lender returns. Morpho's vault architecture keeps capital closer to matched, so more of the borrower's rate reaches the supplier.
But the advantage compresses sharply when borrow demand thins. When utilization drops across DeFi, the Morpho premium falls to roughly 50 basis points. At that point, gas costs, bridging friction, and curator fees can eliminate the net gain. The question worth asking is not whether Morpho pays more. It is when the premium is large enough to justify the additional operational and curator risk.
## How P2P Matching and Vault Curation Actually Work

Morpho originally launched as an optimizer layer on top of Aave and Compound. That version matched lenders and borrowers peer-to-peer to split the rate spread more efficiently. The optimizer is now in wind-down. Deposits in the optimizer should migrate to Morpho Blue or to a Morpho vault.
Morpho Blue replaces the matching mechanism with a clean primitive. The capital efficiency gain that the optimizer delivered now comes from market design rather than P2P matching. Each market on Morpho Blue is isolated. A curator selects the collateral type, the loan-to-value ratio, the oracle, and the interest rate model. Those parameters are immutable once the market is created.
The curator does not control your funds directly. You deposit into a MetaMorpho vault. The vault contract allocates your capital across the markets the curator has selected. The curator earns a performance fee on yield, typically 5-15%. Some vaults also charge a management fee up to 5% on total assets. The curator's job is to allocate vault capital to markets that maximize yield within the risk tolerance the vault advertises.
Morpho Blue's default interest rate model is the Adaptive Curve IRM. Aave V3 uses a piecewise-linear function with a hard kink at optimal utilization. Morpho's adaptive curve adjusts the entire curve over time based on observed utilization. This structural difference allows Morpho to keep rates responsive without the sharp discontinuities that can trigger sudden borrow repayments or supply withdrawals.
You can also deposit directly into a specific Morpho Blue market, bypassing the vault and the curator fee entirely. In April 2026, a conservative vault managed by Steakhouse Financial offered a 7-day average APY of 3.96%, while its higher-risk vault offered 5.09%. Directly depositing into a specific pool (USDC / PT-reUSD-10DEC2026) yielded approximately 7.7%. The direct-deposit rate is higher because you are not paying a curator fee and you are accepting the full risk of that single market.
## When Morpho Beats Aave and When It Does Not

The premium is structural when utilization is high and curator allocation is sound. In those conditions, Morpho consistently delivers 100-200 basis points over Aave on USDC.
The premium collapses when borrow demand evaporates. In low-utilization environments, Morpho's advantage compresses to roughly 50 basis points. At that level, the net gain is often zero after accounting for gas, bridging, and curator fees.
Cross-chain friction erases the advantage entirely. A user holding USDC on Polygon who wants to lend on Morpho Blue needs that USDC on Ethereum. The round-trip cost (bridge, slippage, gas) often eats the rate advantage. If Morpho is paying 5% and Aave is paying 4%, but it costs you 1.5% in total friction to move capital onto Ethereum and back, you are better off staying on Aave.
Morpho makes sense for ETH-native capital that is not planning to move across chains. It makes sense when the rate spread is large enough to justify the curator risk. It does not make sense when you are chasing 50 basis points and paying 100 basis points in execution costs to capture it.
## Vault-Specific Risks and Failure Modes
Curator selection risk is the primary risk you accept when you deposit into a Morpho vault. The curator decides which markets receive your capital. A curator that allocates conservatively to deep, stable-collateral markets shields you from tail risk. A curator that allocates to long-tail collateral for higher yield exposes you to it.
The risk is contained. When a curator misjudges and allocates to a market that goes bad, the loss is contained to depositors in that vault. Other vaults and other depositors are unaffected. In monolithic systems, a single bad listing can socialize losses across the protocol. Morpho's isolated market structure prevents that contagion.
Oracle misconfiguration is a known failure mode. In October 2024, a misconfiguration of the oracle led to a hacker stealing $230,000 from the PAXG/USDC market. The loss was limited to depositors in that market. The broader protocol was unaffected.
Bad debt socialization attacks are a more sophisticated risk. This attack allows an adversarial supplier to liquidate an under-water position, withdraw their assets, and avoid incurring the effects of bad debt socialization while profiting from the liquidation. The attacker essentially steals from their fellow suppliers. Morpho is aware of the attack vector. The likelihood is low due to the sophistication required, but the risk is not zero.
Front-end vulnerabilities are separate from protocol risk but matter in practice. In April 2025, Morpho faced a $2.6 million attempted exploit linked to a front-end vulnerability. The attack was halted in real time by the white-hat MEV operator c0ffeebabe.eth, who intercepted the malicious transaction before any funds were lost. This incident did not compromise the protocol itself, but it demonstrated that the interface layer introduces risk that the immutable core does not.
## Performance During Rate Volatility
Morpho's isolated market structure performed as designed during the October 10, 2025 flash crash. A custom agent built to monitor bad debt events helped Morpho observe how liquidity conditions differed across chains in real time. The isolated architecture contained risk rather than amplifying it.
In April 2026, the KelpDAO contagion event triggered $10 billion in Aave outflows. That liquidity shock affected Morpho utilization rates, but Morpho itself was not exploited. Vaults that accepted rsETH as collateral experienced elevated risk during the event. The risk was isolated to those vaults. Depositors in other vaults were unaffected.
The takeaway is that Morpho's market isolation prevents protocol-wide contagion. But it does not prevent losses in the specific market or vault where the risk materializes. If you are in a vault that allocates to a collateral type that depegs or becomes illiquid, you bear that loss. The structure protects the protocol. It does not protect you from the curator's allocation decisions.
## Custody, Timelocks, and Depositor Responsibility
Morpho Vaults are fully non-custodial. Users retain custody of funds. All risk-increasing actions taken by curators are announced onchain and governed by timelocks.
This architecture shifts responsibility toward users and curators. To remain in control, you must monitor pending changes, evaluate whether those actions align with your investment objectives, and withdraw if necessary before execution. This is not passive. If you deposit into a Morpho vault and stop monitoring it, you are accepting the curator's ongoing decisions without review.
## Curator Economics and Sustainability
Curator economics are tight. For curators earning 5-15% on vault performance, the math gets difficult quickly. Risk management requires sophisticated modeling infrastructure, continuous monitoring, and often dedicated teams of quantitative analysts.
If a curator manages a $100 million vault generating a 5% yield to depositors, and takes a 10% performance fee on that yield, the annual gross revenue is roughly $500,000\. That is before paying for infrastructure, staffing, compliance, and the opportunity cost of capital.
The implication for depositors is that curator quality varies. The best curators have the infrastructure and expertise to justify their fees. The weakest curators are operating on thin margins and may cut corners on risk management. You cannot evaluate curator quality by looking at historical APY alone. You need to evaluate the curator's risk controls, allocation methodology, and response to past stress events.
## Current Market Position and Protocol Revenue
Morpho Blue currently has $11.383 billion in total value locked. That figure places it as the #2 DeFi lending protocol with 20% market share across 45 chains. Aave V3 leads at roughly $14.6 billion in TVL across 15+ chains.
In terms of active loan utilization, Morpho is currently at 37% versus 38% for Aave. The utilization figures are nearly identical. The rate advantage Morpho delivers does not come from higher utilization. It comes from less drag on supplied capital when utilization is below 100%.
Morpho kept $0 of $19.51 million in fees over the 30 days to September 29, 2026\. Aave kept $5.07 million of $36.97 million in fees over the same period. Morpho does not take protocol fees on supply or borrow. The entire fee burden falls on the curator, who charges depositors. This structure aligns curator incentives with depositor returns, but it also means that curator quality is the primary determinant of net yield after fees.
MORPHO is currently trading at $2.71\. Its circulating market capitalization is $1.897 billion, ranking it #71\. The protocol generated $239.8 million in annual fees. That gives Morpho a market cap to fee ratio of roughly 7.9x, which is elevated compared to Aave but reflects the protocol's zero-fee model and growth trajectory.
## The Takeaway
The rate improvement Morpho delivers is real when utilization is high and curator allocation is sound. The 50-200 basis point premium over Aave is structural, not promotional. But the advantage compresses sharply in low-demand environments, and curator risk is higher than most depositors realize. If you are evaluating Morpho, the first question is not what the APY is today. It is who the curator is, how they allocate capital, and what their response has been during past stress events. The second question is whether the rate premium is large enough to justify the operational and risk trade-offs relative to [Aave's deeper liquidity and longer operational track record](https://altcoininvestor.com/best-defi-lending-platform/). For ETH-native capital not planning to move across chains, and for depositors who can monitor curator actions, [Morpho offers a clear rate advantage](https://altcoininvestor.com/morpho-lending/). For multi-chain users or passive depositors, the friction and risk often eliminate the net gain.
## Frequently Asked Questions
### How much better are Morpho rates compared to Aave?
Morpho vaults typically deliver 50 to 200 basis points more than Aave on USDC supply. In April 2026, Morpho paid 4-8.5% while Aave paid 3.8-6.2%. The premium is structural when borrow utilization is high but compresses to roughly 50 basis points when demand thins. Gas costs, bridging fees, and curator fees can eliminate the net advantage in low-demand environments or for multi-chain users.
### What is the main risk when depositing into a Morpho vault?
Curator selection risk is the primary risk. The curator decides which markets receive your capital. A curator that allocates to long-tail collateral or misconfigured oracles exposes you to loss. In October 2024, an oracle misconfiguration led to a $230,000 loss in the PAXG/USDC market. The loss was isolated to that market, but depositors in the affected vault bore the full impact. Evaluate curator track record and risk controls before depositing.
### Is Morpho safer than Aave?
Morpho Blue's 650-line immutable core has undergone 25+ audits and manages $10.7 billion. Protocol risk is mitigated. Curator risk is higher than Aave's monolithic pool risk. Morpho's isolated market structure prevents protocol-wide contagion but does not prevent losses in individual vaults. Aave socializes risk across a single pool. Morpho isolates it to specific markets and vaults. Which structure is safer depends on your allocation size and curator quality.
### How do Morpho curator fees work?
Curators typically charge 5-15% performance fees on earned yield. Some vaults also charge up to 5% management fees on total assets. Morpho takes zero protocol fees. If a vault yields 5% and the curator charges a 10% performance fee, you receive 4.5% net. You can bypass curator fees entirely by depositing directly into a specific Morpho Blue market, but you accept the full risk of that single market without diversification.
### Does Morpho work well for multi-chain capital?
No. Morpho Blue is deployed on Ethereum. If you hold USDC on Polygon or another chain, you must bridge to Ethereum to deposit. The round-trip cost (bridge, slippage, gas) often exceeds 1-1.5% and erases the rate advantage. Morpho makes sense for ETH-native capital that is not planning to move across chains. For multi-chain users, the friction typically eliminates the net gain unless the rate spread is exceptionally large.
The Weekly Yield Report
You have just compared Morpho's 4-8.5% USDC rate against Aave's 3.8-6.2%. Those spreads will compress next week when utilization shifts.
Every Thursday: where crypto yield actually is - stablecoins, liquid staking and DeFi lending, with the risk named next to the rate and what changed since last week.
[Get it free every Thursday](#/portal/signup)
Free. No trade calls, no allocations, no hype. Unsubscribe in one click.
### How To Make Money With Stablecoins: Lending, Liquidity, Yield
URL: https://altcoininvestor.com/how-to-make-money-with-stablecoins/
Last updated: 2026-10-05T17:06:56.000Z
## Prerequisites And Realistic Yield Expectations
In October 2026, you can earn 3.6% to 8.5% annual yield on dollar-stable assets through four primary mechanisms: DeFi lending protocols, yield aggregators, centralized exchange earn products, and yield-bearing stablecoins. Each mechanism carries a distinct risk profile, and each operates under a different revenue model.
Your target is sustained yield, not promotional rates that compress in two weeks. The sustainable range on reputable DeFi venues runs 3.5% to 6.5% for USDC and USDT, with higher rates available only through additional risk layers.
To use any of these mechanisms, you need three things. First, a self-custody wallet (MetaMask, Rabby, or Frame) funded with stablecoins and enough ETH for gas. Second, an understanding of what drives the yield you're chasing. Third, acceptance that you're taking counterparty risk or smart-contract risk in exchange for those basis points.
The thesis: stablecoin yield is compensation for lending to leveraged crypto traders (DeFi) or trusting a centralized entity with custody (CeFi). When borrowing demand falls, DeFi yields compress. When a CeFi platform goes bankrupt, your deposit disappears. That's the mechanic.
## DeFi Lending: How Utilization Drives Your Rate

Aave V3 holds $14.6 billion in total value locked as of May 2026, the largest stablecoin lending venue in DeFi. USDC supply APY on Ethereum mainnet ranges 3.8% to 5.2% over the trailing 30 days. USDT supply APY runs 4.0% to 5.4%.
That range exists because Aave uses a utilization-driven interest-rate curve. When 50% of deposited USDC is borrowed, you earn one rate. When utilization crosses 89%, as it did on August 28, 2026, the supply rate jumps to 3.26% and the borrow rate to 3.97%. The curve is kinked at 80% to 90% utilization, which means APY spikes non-linearly when demand surges.
Who borrows your stablecoins? Leveraged traders who deposit ETH, wBTC, or liquid staking tokens as collateral, then borrow USDC or USDT to open long positions elsewhere. When market sentiment cools and leverage demand falls, utilization drops and your yield compresses. In April 2026, Aave's USDC rate sat at approximately 2.61%, below conventional cash management accounts.
Morpho Blue holds $76.6 billion TVL and operates differently. Instead of pooled liquidity, Morpho routes deposits into curated MetaMorpho vaults, each with its own collateral and risk parameters. USDC supply APY via Morpho ranges 4.1% to 6.8%, with conservative curators at the low end and higher-risk collateral at the top.
Compound V3 holds $1.8 billion TVL and has been audited continuously since 2018\. Sky Lending (formerly MakerDAO) holds $5.6 billion TVL and pays the Sky Savings Rate, which is governance-set rather than utilization-driven. As of September 16, 2026, that rate was 3.60% APY.
The five largest DeFi lending protocols (Aave V3, Morpho Blue, SparkLend, JustLend, and Maple) together hold approximately $27.37 billion, or roughly 75% of all DeFi lending TVL. If you're deploying five-figure capital, stick to these five. Newer protocols carry higher smart-contract risk, and the incremental 0.5% to 1.0% yield premium rarely justifies the tail risk.
Gas costs matter. Depositing $5,000 into Aave on Ethereum mainnet costs $8 to $15 in gas during normal conditions. Withdrawing costs another $8 to $15\. If you're earning 4.5% on $5,000, that's $225 annually. Gas eats 10% to 13% of your first year's yield. For deposits below $10,000, consider Layer 2 deployments (Arbitrum, Optimism, Base) where Aave and Compound also operate and gas costs $0.50 to $2.00 per transaction.
## Yield Aggregators: When Automation Justifies The Fee
Yield aggregators deploy your stablecoins across multiple lending venues, liquidity pools, and incentive programs. The value proposition is simple: you get diversified exposure and automated rebalancing in exchange for a management or performance fee.
Yearn Finance launched yvUSD on January 19, 2026\. It's a V3 cross-chain, cross-asset stablecoin vault with zero management fees and zero performance fees. That fee structure is unusual. Most aggregators take 10% to 20% of returns.
For context, Yearn's legacy V2 vaults charged a 2% annual management fee on total assets plus a 20% performance fee on gains. At 5% gross yield, net return after fees becomes approximately 3.2%. V3 factory-deployed vaults reduced the performance fee to 10%, and single-asset vaults charge no management fee.
On September 17, 2026, Yearn V3 vaults on Ethereum delivered a median APY of 4.4%, with 87% of that coming from real yield rather than token incentives. The 6% to 8% sustainable baseline advertised by Yearn comes from combining multiple yield sources that individually would be accessible but tedious to manage.
Convex Finance operates differently. It doesn't charge deposit or withdrawal fees. Instead, it takes roughly 17% of CRV and FXS rewards earned through its boosted Curve positions. That cut is distributed across cvxCRV stakers, vlCVX holders, and the treasury. For [liquidity providers in Curve pools](https://altcoininvestor.com/liquidity-pools-crypto-yield-impermanent-loss/), the boosted voting power Convex provides often increases base yield enough to justify the 17% haircut.
The decision tree is straightforward. If you're managing less than $50,000 and don't want to monitor utilization rates across five protocols, a zero-fee aggregator like yvUSD makes sense. If you're running $200,000 or more, the fee drag on a 2/20 structure costs you $4,000 to $8,000 annually, and direct protocol deposits will net more even after accounting for your time.
## Centralized Exchange Earn Products: Higher Yield, Higher Risk
Ledn offers stablecoin Growth Accounts yielding 6.5% APY on USDC and USDT for balances up to $100,000, rising to 8.5% for larger balances. Nexo advertises up to 13% APY on USDC and 14% on USDT, though actual rates depend on a loyalty tier system tied to NEXO token holdings. Coinbase USDC rewards currently pay around 4.1% APY.
CeFi stablecoin yields consistently exceed DeFi rates. That premium is compensation for counterparty risk. When you deposit into a CeFi earn product, you're lending to the platform, not to an audited smart contract. The platform then lends your capital to institutional borrowers, market makers, or its own trading desk.
The history of the space matters here. Celsius, BlockFi, and Voyager all advertised double-digit yields on stablecoins. All three froze withdrawals in 2022\. All three filed for bankruptcy. Depositors in those earn products became unsecured creditors in bankruptcy proceedings, and most recovered 20% to 40% of their principal after years of legal process.
The 6.5% to 14% range you see on CeFi platforms in 2026 reflects that tail risk. If you trust the platform's solvency, custody controls, and loan book, the extra 2% to 4% over DeFi rates is meaningful on six-figure deposits. If you're wrong about solvency, you lose the principal.
One structural advantage: CeFi platforms don't charge gas. Deposits and withdrawals are internal database updates, so you can move $5,000 in and out without paying $15 each direction. For smaller allocations, that fee advantage often offsets the custody risk premium.
## Yield-Bearing Stablecoins: Wrapper Simplicity At Governance Risk
Yield-bearing stablecoins bundle the lending or real-world-asset yield into the token itself. You hold sUSDS, and the Sky Savings Rate accrues automatically. You hold USDY, and T-bill yield accrues. No manual deposits into lending protocols, no harvest transactions, no gas overhead.
Sky's sUSDS pays the Sky Savings Rate, currently around 6% to 7%. sDAI pays the legacy Dai Savings Rate. Ondo's USDY pays a T-bill yield around 5%. Each wrapper comes from a different yield source, and each carries a different risk stack.
sUSDS dropped from a peak of 12.5% in 2024 to approximately 1.6% to 4.5% by March 2026\. That compression happened because Sky's governance votes to adjust the rate based on protocol revenue and competitive positioning. If you're holding sUSDS, your yield can be cut by governance decision, and you have no recourse beyond selling the wrapper.
USDY yield comes from short-term U.S. Treasury bills. That's more stable than crypto borrowing demand, but it's still subject to interest-rate policy and Ondo's fee structure. If the Federal Reserve cuts rates, USDY yield falls in lockstep.
The UX advantage is real. If you're holding $50,000 in stablecoins and want exposure to lending yield without monitoring utilization curves, a yield-bearing stablecoin eliminates the operational overhead. The governance and policy risk is the price you pay for that simplicity.
Gas costs still apply. Minting sUSDS from USDS costs one transaction. Redeeming sUSDS back to USDS costs another. On Ethereum mainnet, that's $15 to $25 round-trip during normal congestion. For [yield-bearing stablecoin strategies](https://altcoininvestor.com/earn-passive-income-yield-bearing-stablecoins/) on smaller capital, Layer 2 deployments again make more sense.
## Rate Volatility And Utilization Spikes
DeFi lending yields are not stable. In May 2024, Morpho-adjacent protocols saw utilization-driven rate spikes of over 20% within 48 hours before compressing back to 2%. That volatility exists because borrowing demand is cyclical and tied to crypto market sentiment.
When Bitcoin rallies 15% in a week, leveraged traders borrow USDC to open long positions. Utilization spikes, rates jump, and depositors earn 8% to 12% APY for three to seven days. Then the rally stalls, traders close positions, utilization falls, and rates compress back to 3.5% to 4.5%.
If you're chasing those 12% spikes, understand that they don't last. The time-weighted average yield over 90 days will be much closer to the baseline 4% to 5% range. The marketing material that shows 9% APY is often pulling from a seven-day snapshot during a utilization spike.
Governance-set yields (Sky, Spark) are more stable but can be adjusted at any time. CeFi yields are the most stable in the short term but carry the highest tail risk. Choose your volatility profile based on how often you're willing to reallocate capital.
## Risk Incidents And Cascade Effects
During Q2 2026, nearly 70 protocols suffered exploits and roughly $746 million was lost. Although most incidents remained smaller than past mega-hacks, their frequency reinforced concerns around security. Smart-contract risk is the primary failure mode for DeFi lending.
Aave and Compound have long audit histories and have survived multiple market cycles without loss of depositor funds. Morpho launched more recently but has been audited by Trail of Bits, Spearbit, and Cantina. Sky (formerly MakerDAO) has operated since 2017\. These are the venues where smart-contract risk is lowest.
Collateral tail risk is harder to price. The collateral side of DeFi lending is split between ETH (39%), liquid staking tokens (28%), BTC wrappers (14%), and the remainder in major altcoins and stablecoin LP tokens. A depeg or exploit in any of these cascades into withdrawals.
In April 2026, the rsETH exploit triggered $5.5 billion in stablecoin withdrawals from Aave in two weeks. If you had USDC deposited, you didn't lose principal, but you couldn't withdraw for 48 to 72 hours during peak congestion because utilization hit 95% and the protocol throttled withdrawals. Cascade liquidations from one collateral type can lock borrowers out across multiple protocols.
CeFi custody risk is binary. Either the platform remains solvent and you get your principal plus yield, or it doesn't and you become an unsecured creditor. There's no gradual loss scenario. Diversifying across multiple CeFi platforms reduces single-point-of-failure risk but adds operational overhead.
## Fee Impact On Net Returns
Every yield product charges fees, and those fees determine whether the advertised APY is worth your time. Traditional Yearn V2 vaults cost 2% management plus 20% performance. At 5% gross yield, net becomes approximately 3.2% after fees. That's a 36% haircut.
Yearn V3 yvUSD charges 0% fees, which is why it's worth considering despite the aggregator complexity. Convex charges roughly 17% of CRV rewards, but the boosted voting power it provides often increases your base yield by 25% to 40%, so the net effect is still positive.
Gas is a hidden fee. If you're depositing $10,000 into Aave on Ethereum mainnet, round-trip gas costs $20 to $30\. On a 4.5% yield, that's $450 annually, so gas eats 4% to 7% of your first year's return. On a $50,000 deposit, gas is 0.8% to 1.2% of first-year yield. On a $200,000 deposit, gas is 0.2% to 0.3%. Scale matters.
CeFi platforms don't charge gas, but they often have withdrawal minimums, lock-up periods, or tier requirements that reduce your effective yield. Nexo's 13% APY requires holding 10% of your portfolio in NEXO tokens, which introduces price risk. Ledn's 8.5% rate applies only to balances above $100,000.
The net yield you actually capture after fees, gas, and tier requirements is the only number that matters. A 5% APY on [DeFi protocols tracked by DefiLlama](https://defillama.com) with zero lock-up and $15 gas often beats a 7% APY on a CeFi platform with 30-day lock-up and token tier requirements.
## Common Failure Modes
The most common mistake is chasing headline yields without understanding where they come from. A 15% APY on a new protocol is not free money. It's either a short-term liquidity mining incentive (paid in the protocol's governance token, which will dump), or it's compensation for taking collateral risk that more sophisticated allocators have already priced as unacceptable.
Second mistake: depositing into a lending protocol without checking utilization. If Aave USDC is at 92% utilization, you can't withdraw without waiting for borrowers to repay. That's not a bug. That's how utilization-driven lending works. Check utilization before you deposit, and set alerts if it crosses 85%.
Third mistake: ignoring gas costs on small deposits. If you're depositing $2,000 into Aave on Ethereum mainnet, you're paying 1.5% to 2.0% of your capital in round-trip gas. That wipes out three to four months of yield. Use Layer 2, or use a CeFi platform, or wait until you have $10,000 to deploy.
Fourth mistake: treating CeFi yields as equivalent to DeFi yields. They're not. CeFi yields are unsecured loans to a centralized entity. DeFi yields are secured by audited smart contracts and on-chain collateral. The risk profiles are completely different, and the yield premium on CeFi is compensation for that difference.
## What To Do Next
If you're deploying less than $10,000, start with a CeFi earn product (Coinbase, Ledn) or a Layer 2 DeFi protocol (Aave on Arbitrum, Compound on Base). The gas cost on Ethereum mainnet is too high relative to your yield.
If you're deploying $10,000 to $50,000, use Ethereum mainnet DeFi lending. Deposit into Aave V3 or Morpho Blue, set utilization alerts at 85%, and monitor rates monthly. Don't chase aggregator yields unless the aggregator charges zero fees.
If you're deploying more than $50,000, split between DeFi and CeFi. Put 60% to 70% into Aave or Morpho for security and liquidity. Put 30% to 40% into one or two CeFi platforms with long track records and audited reserves. Rebalance quarterly based on rate changes.
Track your net yield after fees and gas. The gross APY is marketing. The net yield after all costs is the only number that goes into your tax return and your actual return calculation. Use [a yield calculator](https://altcoininvestor.com/crypto-yield-calculator/) to model different scenarios before you deploy.
Set calendar reminders to review rates every 30 days. DeFi lending yields compress and expand with market cycles. The 5.2% you're earning today might be 3.8% next month, and a different protocol might be paying 5.8%. Stickiness costs you 50 to 100 basis points annually.
## The Takeaway
The 3.6% to 8.5% range you can earn on stablecoins in October 2026 reflects three risk layers: smart-contract risk, collateral risk, and custody risk. DeFi protocols charge you the first two. CeFi platforms charge you the third. Yield-bearing stablecoins bundle the risk into a wrapper and add governance risk on top.
The sustainable yield on audited DeFi venues is 3.8% to 5.5% for USDC and USDT. Anything above that requires taking additional risk, whether that's newer protocols, exotic collateral, or centralized custody. The basis-point premium you're chasing needs to justify the tail risk you're accepting.
Gas costs, management fees, and utilization volatility determine whether a yield product is worth your capital. A 5% APY with zero fees and instant liquidity beats a 7% APY with a 2/20 fee structure and 30-day lock-up. Run the net-yield math before you deposit.
## Frequently Asked Questions
### What is a realistic sustained yield on stablecoins in 2026?
Realistic sustained yields on audited DeFi lending protocols (Aave V3, Morpho Blue, Compound V3) range from 3.8% to 5.5% APY for USDC and USDT as of October 2026\. Rates above 6% typically require taking additional risk through newer protocols, exotic collateral, or centralized custody. CeFi platforms offer 6.5% to 8.5%, but that premium compensates for counterparty and custody risk. Advertised rates above 10% are usually short-term liquidity mining incentives paid in governance tokens.
### How do DeFi lending yields change with utilization?
DeFi protocols like Aave and Compound use kinked interest-rate curves. When 50% of deposited stablecoins are borrowed, you earn one rate. When utilization crosses 80% to 90%, the curve steepens and APY spikes non-linearly. Aave V3 Ethereum USDC hit 89% utilization on August 28, 2026, generating a 3.26% supply rate. When market sentiment cools and leverage demand falls, utilization drops and yields compress back to baseline, sometimes falling below 3% within weeks.
### What fees reduce my net stablecoin yield?
Three fee layers matter. Gas costs $15 to $30 round-trip on Ethereum mainnet, eating 1.5% to 2% of deposits below $10,000\. Yield aggregators charge 10% to 20% performance fees, though Yearn V3 yvUSD charges zero. CeFi platforms often require token holdings (Nexo) or minimum balances (Ledn above $100,000) to access top-tier rates. On a $10,000 deposit earning 4.5%, gas consumes $30 and a 20% performance fee takes $90, leaving you with roughly 3.3% net yield after first-year costs.
### Is centralized exchange stablecoin yield riskier than DeFi lending?
Yes. CeFi yields are unsecured loans to a centralized platform. When Celsius, BlockFi, and Voyager froze withdrawals in 2022, depositors became unsecured creditors and recovered 20% to 40% of principal after years of bankruptcy proceedings. DeFi yields come from audited smart contracts with on-chain collateral. You face smart-contract risk and collateral tail risk, but not custody risk. The 2% to 4% yield premium CeFi platforms pay over DeFi is compensation for the possibility of total loss if the platform goes bankrupt.
### When should I use a yield aggregator instead of direct protocol deposits?
Use a zero-fee aggregator like Yearn V3 yvUSD if you're managing less than $50,000 and don't want to monitor utilization rates across five protocols. For deposits above $50,000, direct protocol deposits net more even after accounting for your time, because traditional aggregator fees (2% management, 20% performance) cost $2,000 to $4,000 annually on $100,000\. Gas costs favor aggregators only if you're rebalancing weekly, which most allocators don't need to do for stablecoin lending positions.
The Weekly Yield Report
You just compared DeFi lending at 3.8-5.5%, CeFi earn products at 6.5-8.5%, and yield aggregators at 4.4%. Those rates will change within thirty days.
Every Thursday: where crypto yield actually is - stablecoins, liquid staking and DeFi lending, with the risk named next to the rate and what changed since last week.
[Get it free every Thursday](#/portal/signup)
Free. No trade calls, no allocations, no hype. Unsubscribe in one click.
### Best Crypto Loans Without Collateral: Why The Search Results Are Wrong
URL: https://altcoininvestor.com/best-crypto-loans-without-collateral/
Last updated: 2026-10-05T16:05:30.000Z
## The Search Results Claim These Loans Exist

Search "best crypto loans without collateral" and you'll find a dozen platforms claiming to offer exactly that. Nexo advertises rates starting at 0.9% with "no credit checks." Ledn promises "automatic approval" on Bitcoin-backed loans. Flash loan protocols claim genuinely uncollateralized borrowing.
The data tells a different story.
As of May 2026, every platform marketing uncollateralized crypto loans either requires substantial crypto deposits, mandatory KYC verification, loyalty tier token locks, or advanced smart contract coding skills. The only genuinely uncollateralized option is flash loans, which must be borrowed and repaid within a single blockchain transaction, typically seconds, making them unsuitable for accessing cash or stablecoins for living expenses.
Here's what you actually get when you apply.
## What Nexo Actually Requires
Nexo's credit lines range from 0.9% per year (US, Platinum tier, below 20% LTV) to 15.9% (US) or 17.9% (rest of world) depending on loyalty tier and loan-to-value ratio. The marketing emphasizes low rates. The fine print reveals three hidden barriers.
First: mandatory KYC verification for all users. Every account must complete identity verification before accessing credit lines. No exceptions.
Second: crypto collateral requirement. Nexo's "credit line" is a collateralized loan. You deposit Bitcoin, Ethereum, or other supported assets, and Nexo lends you a percentage of that value in stablecoins or fiat. The loan-to-value ceiling sits around 90%, meaning a $10,000 crypto deposit nets a maximum $9,000 loan.
Third: soft collateral lock for best rates.
Nexo's Platinum tier requires 10% of your portfolio locked in NEXO tokens. A $100,000 portfolio needs $10,000 in NEXO to access the advertised 1.9% to 2.9% rates. This isn't optional collateral. It's a forced portfolio allocation that functions as indirect collateral to access competitive pricing.
If your collateral's loan-to-value ratio exceeds approximately 83%, Nexo triggers partial liquidation. Your Bitcoin or Ethereum gets sold automatically to bring the LTV back below threshold. That's the same liquidation mechanism as any [overcollateralized DeFi lending protocol](https://altcoininvestor.com/best-defi-protocols/), but dressed up as a "credit line."
The annual interest cost on EUR 2,000 at Platinum tier rates is approximately EUR 38\. That's competitive. But it's not uncollateralized.
## What Ledn Actually Requires

Ledn advertises automatic approval and no credit checks. Both statements are accurate. Neither means the loan is uncollateralized.
Ledn's rates range from 9.25% to 11.49% APR as of May 2026\. The minimum collateral requirement is $1,000 USD equivalent in Bitcoin. Ledn discontinued Ethereum support on July 1, 2025, focusing exclusively on BTC-backed lending.
Full KYC is mandatory.
A 2% origination fee applies to all loans, though US and Canadian borrowers receive a waiver. For a $10,000 loan outside those jurisdictions, you pay $200 upfront before receiving funds.
The liquidation threshold sits at 80% LTV. When Bitcoin's price falls far enough that your outstanding loan reaches 80% of your collateral's current value, Ledn sells your Bitcoin automatically. The platform applies a 0.50% trade spread, deducts the outstanding balance, and returns any remainder. The process is automatic and irreversible.
If Bitcoin falls far enough, your collateral can be sold without warning. This is not a risk-free way to hold BTC while accessing liquidity.
Collateral may also be sold at maturity to settle unpaid accrued interest and fees. Renewal requires LTV below 65%, creating a mandatory deleveraging cycle if you've borrowed aggressively.
Ledn's structure is transparent. It's also fully collateralized.
## Flash Loans: The Only True Uncollateralized Option
Flash loans are genuinely uncollateralized. No credit check. No KYC. No upfront deposit. You borrow millions in a single transaction, use the funds for arbitrage or liquidation execution, and repay the principal plus a small fee before the transaction finalizes.
The constraint: everything must happen within a single blockchain transaction block.
On Ethereum, that's roughly 12 seconds. On faster chains like Solana or Binance Smart Chain, it's shorter. If the borrowed funds aren't repaid before the block closes, the entire transaction reverts. No loan. No fee. No execution.
This makes flash loans suitable for three use cases: arbitrage between decentralized exchanges, collateral swaps on DeFi protocols, and liquidation execution on lending platforms. All three require custom smart contract code written in Solidity or a similar language.
Executing unsecured flash loans directly requires writing custom smart contracts, and funds must be borrowed, routed, and repaid within a single atomic transaction. Standard user interfaces on lending apps like Aave, dYdX, or Uniswap V3 do not support them for casual retail users.
You need coding skills, gas cost accounting, and MEV-resistant transaction routing. The barrier to entry is technical expertise, not collateral.
Borrowers typically pay a fee to the lending platform, often 0.05% to 0.09% of the borrowed amount. On a $1 million flash loan, that's $500 to $900\. The fee eats into arbitrage profits, meaning the opportunity must be large enough to cover gas costs, protocol fees, and slippage.
Flash loans are uncollateralized. They're also unsuitable for accessing liquidity to pay rent, buy a car, or fund a business. They exist for high-frequency traders and DeFi arbitrageurs, not retail borrowers seeking cash.
## Undercollateralized DeFi: The Credit Check Returns
Protocols like Goldfinch, TrueFi, and Maple Finance attempt to offer undercollateralized loans by replacing crypto deposits with on-chain credit scoring. Borrowers provide real-world identity verification, submit to DAO-endorsed credit evaluations, or stake reputation tokens.
According to CoinGecko research, [undercollateralized DeFi lending](https://www.coingecko.com/research/publications/undercollateralized-loans-the-future-of-defi-lending) uses factors like wallet history, governance participation, and off-chain financial data to assess borrower risk. The credit approval process varies by platform, but all require navigation of some verification workflow.
The trade: no upfront crypto collateral, but a return to credit checks and identity verification. You've swapped one barrier for another.
Most undercollateralized DeFi platforms serve institutional borrowers or crypto-native businesses. Retail access is limited. Default risk is higher. And liquidity is a fraction of what Nexo or Ledn provide.
As of May 2026, total value locked across undercollateralized lending protocols sits below $500 million, compared to over $8 billion in traditional overcollateralized DeFi lending. The market has spoken: lenders demand collateral or credit evaluation. Preferably both.
## CeFi vs. DeFi: What You Trade For Convenience
CeFi platforms like Nexo and Ledn operate like traditional lenders. You deposit collateral with the company, complete KYC verification, and receive a loan in fiat or stablecoins. The company holds your funds. The company decides liquidation timing. The company complies with AML and CFT regulations under the Bank Secrecy Act.
DeFi platforms use lending protocols governed by smart contracts. There is no KYC. No application process. No single entity holding your funds. You deposit collateral into a smart contract, and the contract issues a loan based on preset LTV ratios.
The tradeoff is smart contract risk.
Bugs, oracle failures, and governance attacks can result in loss of funds. The May 2022 Terra Luna collapse wiped out $40 billion. The November 2022 FTX failure erased $8 billion in customer deposits. DeFi protocols like Cream Finance and Rari Capital suffered exploits totaling over $200 million combined.
Neither Nexo nor Ledn requires a credit check in the traditional sense. Both use your digital assets as collateral to approve and secure borrowing. DeFi protocols automate the same process, removing the intermediary but adding code execution risk.
If you're choosing between CeFi and DeFi, the decision hinges on custody preference and regulatory comfort. CeFi gives you customer support and regulatory compliance. DeFi gives you self-custody and censorship resistance. Both require collateral unless you're executing flash loans.
## The Edge Case: No-KYC Platforms
CoinRabbit offers instant crypto loans without identity verification. Users deposit funds and receive stablecoins almost instantly. The platform markets itself as a privacy-focused alternative to Nexo and Ledn.
The catch: it's still fully collateralized.
CoinRabbit requires crypto deposits at conservative LTV ratios, typically 50% to 70%. You send Bitcoin, they send back stablecoins worth half to two-thirds of your deposit value. No KYC. No credit check. But also no uncollateralized borrowing.
This is an exception, not a rule. Most major platforms require KYC for compliance with US and EU anti-money laundering regulations. In the US, crypto assets fall under the Bank Secrecy Act. All cryptocurrency exchanges and lending platforms must register with FinCEN and require users to verify their identities to comply with AML and combating the financing of terrorism regulations.
Platforms that skip KYC operate in regulatory gray zones or target non-US users exclusively. Liquidity is lower. Rates are often higher. And regulatory enforcement risk looms over every transaction.
## Who Each Option Is Right For
Use Nexo if you want low rates, hold substantial crypto assets, and don't mind locking 10% in NEXO tokens. The platform suits users with $50,000+ portfolios who plan to maintain low LTV ratios and can stomach mandatory KYC.
Use Ledn if you hold Bitcoin exclusively, want automatic approval, and prefer a Bitcoin-only custody model. Ledn's 9.25% to 11.49% rates are higher than Nexo's best tier, but the platform's focus on BTC appeals to maximalists uncomfortable with multi-asset platforms.
Use flash loans if you're a developer or DeFi trader executing arbitrage, liquidations, or collateral swaps. This requires Solidity coding skills, gas cost modeling, and MEV awareness. Retail borrowers looking for cash should skip this entirely.
Use undercollateralized DeFi like Goldfinch or TrueFi if you're an institutional borrower with verifiable credit history or a crypto-native business willing to navigate DAO approval processes. Retail access remains limited as of May 2026.
Avoid platforms claiming "no collateral, no KYC, instant approval" unless you're comfortable with regulatory risk, low liquidity, or outright scams. If it sounds too good to be true, check [wallet security](https://altcoininvestor.com/best-crypto-wallet/) and transaction history carefully before depositing funds.
## The Recommendation: There Is No Free Lunch
If you want an uncollateralized crypto loan in the traditional sense, it doesn't exist for retail users as of May 2026.
Flash loans are uncollateralized but require repayment within seconds and technical expertise. Nexo and Ledn are collateralized but marketed as credit lines. Undercollateralized DeFi reintroduces credit checks and limits access to institutional players. No-KYC platforms still demand crypto deposits.
The best option depends on what you're optimizing for.
If you want the lowest rate and hold a diversified crypto portfolio, Nexo's 1.9% to 2.9% Platinum tier rates win, provided you're willing to lock 10% in NEXO tokens and complete KYC. If you're a Bitcoin maximalist comfortable with 9% to 11% rates, Ledn offers automatic approval and BTC-only custody.
If you're a developer looking to exploit arbitrage opportunities or execute liquidations, flash loans from Aave, dYdX, or Uniswap V3 provide genuinely uncollateralized capital, but only within single-transaction constraints.
For everyone else, accept that crypto lending requires collateral. The platforms that claim otherwise are either hiding verification requirements, limiting access to institutions, or operating outside regulatory frameworks that protect retail users.
The math is straightforward. Lenders assume risk. Risk demands either collateral or credit verification. Sometimes both. The search results promising free, uncollateralized, instant loans are wrong. The platforms you'll actually use require deposits, identity checks, or technical skills that exclude 99% of retail borrowers.
## The Takeaway
If you're searching for uncollateralized crypto loans, adjust your expectations before applying. Nexo requires KYC, crypto collateral, and 10% portfolio lock in NEXO tokens for best rates. Ledn requires KYC, Bitcoin collateral, and automatic liquidation at 80% LTV. Flash loans require Solidity coding and same-transaction repayment. Undercollateralized DeFi requires credit evaluation and targets institutions. The only way to borrow crypto without depositing assets upfront is to build a smart contract, execute an arbitrage trade, and repay within 12 seconds. For accessing liquidity to fund expenses, every platform demands collateral, verification, or both. Choose based on rate, custody preference, and regulatory comfort, not the marketing claim of "no collateral required."
## Frequently Asked Questions
### Can you get a crypto loan without putting up collateral?
No, not for retail users as of May 2026\. Flash loans are the only genuinely uncollateralized option, but they require repayment within a single blockchain transaction (typically seconds) and demand smart contract coding skills. Platforms like Nexo and Ledn market themselves as uncollateralized but require substantial crypto deposits. Undercollateralized DeFi protocols like Goldfinch and TrueFi replace crypto collateral with credit checks and primarily serve institutional borrowers.
### What does Nexo actually require to get their advertised low rates?
Nexo requires three things for rates as low as 1.9% APR: mandatory KYC verification for all users, crypto collateral deposited upfront (up to 90% LTV), and 10% of your portfolio locked in NEXO tokens to qualify for Platinum tier pricing. A $100,000 portfolio needs $10,000 in NEXO tokens. If your loan-to-value ratio exceeds approximately 83%, Nexo triggers automatic partial liquidation of your collateral.
### How do flash loans work and who can use them?
Flash loans let you borrow millions in crypto without collateral, but you must repay the full amount plus a fee within a single blockchain transaction, typically 12 seconds on Ethereum. This requires writing custom smart contracts in Solidity and is only practical for arbitrage traders, liquidation executors, or DeFi developers. Retail borrowers cannot use flash loans to access cash or stablecoins for living expenses. Major providers include Aave, dYdX, and Uniswap V3.
### What happens if Bitcoin's price drops after I take a Ledn loan?
If Bitcoin falls far enough that your loan reaches 80% of your collateral's current value, Ledn automatically sells your Bitcoin to cover the outstanding balance. The platform applies a 0.50% trade spread, deducts what you owe, and returns any remainder. The liquidation is automatic and irreversible. Ledn also may sell collateral at loan maturity to settle unpaid interest and fees, and renewal requires LTV below 65%.
### Are there any crypto lending platforms that don't require KYC?
CoinRabbit offers crypto loans without identity verification, but still requires full crypto collateral at conservative LTV ratios (typically 50% to 70%). Most major platforms require KYC for compliance with anti-money laundering regulations. In the US, crypto lending platforms must register with FinCEN and verify user identities under the Bank Secrecy Act. Platforms that skip KYC operate in regulatory gray zones, offer lower liquidity, and carry enforcement risk.
The Weekly Yield Report
You just examined three platform types claiming uncollateralized lending, all requiring hidden deposits or verification. Those requirements shift with regulation and competition.
Every Thursday: where crypto yield actually is - stablecoins, liquid staking and DeFi lending, with the risk named next to the rate and what changed since last week.
[Get it free every Thursday](#/portal/signup)
Free. No trade calls, no allocations, no hype. Unsubscribe in one click.
### Cardano Surges 12.1% in 24 Hours on RealFi Launch and Technical Momentum
URL: https://altcoininvestor.com/cardano-surge-12-percent-realfi-launch-golden-cross/
Last updated: 2026-10-05T14:02:41.000Z
Cardano rallied 12.1% in the last 24 hours to $0.274363 as of October 5, 2026, according to CoinGecko. The move lifted the asset to a three-month high and extended the token's 7-day gain to 10.6% and its 30-day advance to 27.4%. At a market capitalization of $10.29 billion, Cardano holds rank 15 among all crypto assets, though it remains 91.1% below its all-time high of $3.09 set on September 1, 2021.
Cardano was the strongest performer among major cryptocurrencies on October 5, 2026, climbing 11% in 24 hours to trade at $0.2722 at press time after moving between a low of $0.2442 and a high of $0.2749 during the session, per CryptoTimes. ADA also gained 10.1% against Bitcoin over the same period, a sign that the token outperformed the wider market rather than simply following it, per the same outlet.
## Multiple Small Catalysts, Not a Single Event

Cardano soared 10.9% from $0.239 to $0.271 between Sunday, October 4, and Monday, October 5, with the latest upsurge appearing to have been driven by an accumulation of smaller bullish factors rather than a single catalyst, per Finbold on October 5\. The rally followed several ecosystem announcements spread across the preceding two weeks, none of which arrived in the 24 hours before the move began.
On October 1, 2026, Cardano's RealFi product launched, offering up to about 9% annual yields by routing stablecoins into institutional credit and emerging market loans via USDrf and sUSDrf tokens on Cardano, according to CoinMarketCap on October 4\. Between September 21 and press time on October 5, Cardano became part of Coinbase's x402 payments standard, announced a multi-year partnership with the Venture Accelerator at UCLA Anderson School of Management, helped deliver two fuel-related blockchain applications with Petrobras, and saw the launch of the RealFi product, per Finbold.
The Cardano Foundation became a member of Mastercard's Crypto Partner Program on September 15, 2026, RealFi launched on mainnet on October 1, 2026, and the Foundation announced two research applications with Petrobras and PUC-Rio on October 2, 2026, per CoinMarketCap on October 3\. A golden cross formed when ADA's 50-day simple moving average crossed above its 200-day average on the daily chart around October 3, based on TradingView chart data, per CryptoTimes on October 5.
The RealFi launch was the most recent development before the rally. It followed the catalyst by several days, making it unlikely to be the sole driver. The partnership announcements all predate the move by more than a week. No exchange listing, regulatory decision, or institutional purchase was announced in the 24 to 48 hours preceding the surge.
## On-Chain Activity Fell While Price Rose

DefiLlama data shows Cardano DEX volume fell from $11.74 million on October 1 to $5.72 million on October 3, a divergence that calls the rally's underlying support into question, per CryptoNews on October 5\. ADA climbed 11% to $0.272, but Cardano DEX volume fell to $5.72 million on October 3, leaving the rally's on-chain support unproven, per the same outlet. Decentralized exchange volume measures swaps taking place specifically on Cardano-based protocols, providing one gauge of network usage that is independent of centralized exchange speculation.
The price increase is mainly driven by centralized exchange activity rather than on-chain usage, and key factors like the x402 payment integration and SundaeSwap V4 upgrade are weeks old and unlikely to explain the sudden price jump, according to Pluang on October 4\. CoinGlass data shows ADA open interest rose 15% over the last 24 hours, reaching $614.98 million on October 5, indicating a higher notional value of active perpetual contracts, per FXStreet. Higher open interest without corresponding on-chain volume growth points to a rally sustained by derivatives positioning rather than organic demand for network services.
### What the RealFi Launch Means for Yield Holders
RealFi is designed to route stablecoins minted on Cardano into institutional credit markets, offering holders exposure to off-chain yield opportunities. The product targets annual returns up to 9%, denominated in USDrf and sUSDrf tokens. For those holding ADA primarily for staking or yield generation, RealFi adds a second income layer to the ecosystem. It does not alter the core staking mechanism or change the amount of ADA required to delegate or run a stake pool.
The platform launched in production on October 1, 2026, after a testnet phase. Its success depends on attracting real-world borrowers and lenders to the platform, not on the price of ADA. A holder interested in Cardano yield now has two paths: native staking through the proof-of-stake protocol, or routing stablecoins through RealFi for institutional credit exposure. The first remains unchanged by this rally. The second is newly available but unrelated to ADA price action in the short term.
## Leverage Risk After a Fast Climb

The 12.1% move in 24 hours brings the sort of crowded positioning that can reverse as quickly as it built. Open interest rose 15% over the last 24 hours, reaching $614.98 million, per CoinGlass data cited by FXStreet on October 5\. That increase reflects speculative demand in ADA futures rising on the prospect of further upside, but it also means that a significant portion of the rally was funded by leverage.
For the move to hold, on-chain activity would need to recover from the October 3 low and match or exceed the October 1 peak. More useful confirmation would come from price strength paired with a recovery in Cardano DEX volume from the $5.72 million reading on October 3, and if ADA holds firm while native turnover remains well below the October 1 high, the divergence remains unresolved, per CryptoNews on October 5\. The absence of such confirmation leaves the rally vulnerable to a position flush if derivatives traders who entered on momentum decide to exit.
A reversal trigger could be anything that shifts sentiment or creates an excuse to reduce exposure: a missed upgrade deadline, a governance dispute, an unrelated selloff in Bitcoin or Ethereum that prompts margin calls, or simply a lack of new buyers willing to pay a higher price. None of those outcomes is predictable, but the risk is now higher than it was 48 hours ago because more capital is deployed at higher prices with less margin for error.
## What This Does Not Mean
A large single-day gain usually implies urgency. It does not. The move came several days after the RealFi launch and more than two weeks after the Mastercard and x402 announcements. It was not a response to breaking news, and it does not signal that new information became available on October 5\. The rally reflects a repricing of assets already in the market, not the discovery of something previously unknown.
For someone holding ADA for staking yield, the price increase does not change the reward rate, the delegation process, or the mechanics of earning from the network. For someone evaluating Cardano as a platform for building or deploying capital, the October 5 surge does not indicate that network usage has increased, that transaction volume has grown, or that the ecosystem has added functionality beyond what was already announced weeks ago.
The move also does not imply that Cardano is undervalued at the new price, or that it was undervalued at the old one. It means that, over a 24-hour window, buyers were willing to pay more and sellers demanded more. That condition can reverse in the next 24 hours with no additional catalyst required. The specific catalyst driving the move could not be independently verified at publication time, per Finwire on October 5.
Most critically, this rally does not carry predictive information about the next week or the next month. Large percentage moves in short windows are a feature of altcoin markets, particularly for assets ranked outside the top ten by market capitalization. They happen often. They reverse often. They say more about market structure and liquidity depth than about fundamental value or future direction.
## The Staking and Yield Angle
Cardano's staking mechanism allows holders to delegate ADA to a stake pool and earn rewards denominated in ADA. Those rewards are a function of network parameters, not of the token's dollar price. A 12.1% rally does not increase the number of ADA earned per epoch. It increases the dollar value of those rewards temporarily, which can reverse if the price falls back.
RealFi, by contrast, offers yield in stablecoins backed by institutional credit. That yield is independent of ADA price action. A holder interested in Cardano for income now has two mechanisms: native protocol rewards tied to network security and participation, or stablecoin yield tied to off-chain credit risk. The October 5 rally affects the former only in nominal dollar terms. It does not affect the latter at all.
For someone deciding whether to hold ADA, the question is whether the ecosystem additions between September 15 and October 1 have made the network more likely to attract sustained usage, higher transaction volume, or new classes of capital. The Mastercard partnership, the x402 integration, the Petrobras research pilots, and the RealFi launch all point in that direction, but none of them has yet produced measurable on-chain growth. DEX volume fell from $11.74 million on October 1 to $5.72 million on October 3, per DefiLlama data cited by CryptoNews. Until that metric reverses, the rally is a price event, not a usage event.
If usage follows, the move may consolidate and provide a foundation for further gains. If usage does not follow, the rally is more likely to be retraced as leveraged positions are unwound and speculative capital rotates elsewhere. Neither outcome is certain, and the difference between them will be decided by data that has not yet been published.
The Weekly Yield Report
You have just seen how four catalysts spread across two weeks drove a 12.1% move in 24 hours while on-chain volume fell by half. Those conditions will be different next week.
Every Thursday: where crypto yield actually is - stablecoins, liquid staking and DeFi lending, with the risk named next to the rate and what changed since last week.
[Get it free every Thursday](#/portal/signup)
Free. No trade calls, no allocations, no hype. Unsubscribe in one click.
### OKX and NYSE Parent Launch Tokenized Stock Trading
URL: https://altcoininvestor.com/okx-nyse-ice-tokenized-stock-trading/
Last updated: 2026-10-08T18:00:06.000Z
OKX and Intercontinental Exchange (ICE), the parent company of the New York Stock Exchange, announced a joint venture on October 5, 2026, to launch a tokenized US stock trading venue. The partnership represents institutional infrastructure expansion for onchain equities trading and follows the SEC's September 17 Innovation Exemption for tokenized securities venues. This is not a pilot program or a proof-of-concept. This is exchange infrastructure operators building for tokenized asset markets.
## What the Joint Venture Means for Onchain Equity Access

The joint venture between ICE and OKX targets tokenized versions of US National Market System stocks. The move follows the SEC's conditional relief issued September 17, which created a regulatory pathway for tokenized securities venues. That relief ended months of uncertainty about whether onchain stock trading could exist within US regulatory frameworks. Now it can, and two operators with existing infrastructure are moving first.
ICE brings exchange operator experience. OKX brings crypto-native infrastructure and custody capabilities. The partnership combines traditional finance compliance frameworks with onchain asset handling. This is not a crypto company trying to become an exchange operator. This is an exchange operator integrating crypto infrastructure for a new asset class.
The income angle for readers: tokenized stock trading opens paths to equities exposure in jurisdictions where direct access to US stock exchanges is restricted. In Turkey, Argentina, Nigeria, and other markets where capital controls or currency restrictions limit traditional brokerage access, tokenized stocks routed through crypto-native venues offer an alternative. That access comes with its own compliance questions, but the infrastructure is being built.
## Why This Matters Outside the United States

In Argentina, capital controls introduced after the 2019 currency crisis limited monthly dollar purchases for equity investment. In Turkey, the lira crisis of 2021 drove retail investors toward dollar-denominated assets, but local brokerage access to US equities remained capped. In Nigeria, foreign exchange restrictions constrain traditional brokerage fund transfers. Tokenized equities do not erase these barriers, but they route around some of them.
The product that ICE and OKX are building is designed for institutional infrastructure first. Retail access will follow. But the existence of a regulated tokenized securities venue changes the calculation for emerging market users seeking dollar-denominated equity exposure. If a user in Buenos Aires or Lagos can hold USDT and access tokenized US stocks through a [compliant crypto exchange](https://altcoininvestor.com/best-crypto-exchanges/), that user bypasses local brokerage infrastructure entirely.
This is not income in the sense of yield or staking returns. This is income access in the sense of capital appreciation potential for users who currently face barriers to US equity markets. For readers in high-inflation economies, the income opportunity is the ability to hold dollar-denominated growth assets rather than local-currency cash that loses purchasing power monthly.
## The Regulatory Context That Enabled This
The SEC's September 17 Innovation Exemption created conditional relief for tokenized securities venues. That relief allows tokenized versions of National Market System stocks to trade on platforms that meet specific custody, settlement, and transparency requirements. The exemption does not apply to all securities. It does not apply to most altcoins. It applies narrowly to tokenized versions of stocks that already trade on registered US exchanges.
This is regulatory clarity built on existing frameworks, not a new asset class definition. The tokenized stock is not a different legal entity from the underlying equity. It is a digital representation with onchain custody and settlement. That distinction matters for compliance but also for access. A tokenized Apple share is still an Apple share. The difference is the rail it trades on.
For emerging market users, the compliance path runs through the crypto exchange, not through a local brokerage. That creates a different onboarding process. KYC and AML requirements still apply. But the bottleneck shifts from foreign exchange approvals to crypto exchange account access. In markets where the latter is easier than the former, this is a meaningful change.
## What ICE and OKX Bring to the Partnership
ICE operates the New York Stock Exchange, the world's largest equities market by market capitalization. It has regulatory relationships, clearing infrastructure, and decades of experience operating within US securities law. OKX is one of the largest crypto exchanges by volume, with infrastructure for custody, onchain settlement, and crypto-native asset handling. The joint venture combines regulatory standing with technical capability.
The partnership also signals institutional confidence in tokenized asset market structure. ICE is not experimenting here. It is building a venue. OKX is not diversifying into a side project. It is integrating equities into its platform. That commitment suggests both companies expect sustained demand for onchain equity access, and [as reported by The Block](https://www.theblock.co/), the venue is expected to launch within months, not years.
For readers thinking about where income infrastructure is being built, this is a data point. Tokenized equities are not a replacement for stablecoin yield or remittance corridors. But they are another mechanism for dollar-denominated asset exposure in markets where that exposure is otherwise restricted.
## The Income Opportunity for Emerging Market Users
The income opportunity here is not passive. Tokenized equities do not generate yield unless the underlying stock pays dividends. The opportunity is access to capital appreciation in US equity markets for users who face barriers to traditional brokerage accounts. In Argentina, Turkey, Nigeria, and other markets where currency devaluation outpaces local equity returns, access to dollar-denominated growth assets is itself an income strategy.
Tokenized equities also integrate with existing crypto infrastructure. A user in Lagos holding USDT can convert to tokenized Apple or Microsoft shares without routing through a local bank or foreign exchange approval process. That same user can sell tokenized shares back to USDT and use that stablecoin for remittances, savings, or local payments. The integration matters because it keeps the entire transaction within crypto rails.
The risks are not eliminated. Tokenized securities venues are new. Regulatory frameworks are conditional. Access may change if compliance requirements shift. But for users in markets where traditional equity access is already restricted, the risk calculation is different. The alternative is not unrestricted brokerage access. The alternative is no access at all.
## The Takeaway
The ICE and OKX joint venture is institutional infrastructure for tokenized US stock trading. It follows regulatory clarity from the SEC and represents a partnership between traditional exchange operators and crypto-native platforms. For emerging market users, the income angle is access to dollar-denominated equity exposure in markets where capital controls and currency restrictions limit traditional brokerage access. This is not yield. This is infrastructure for capital appreciation opportunities that were previously unavailable. The venue is being built now. Retail access will follow institutional infrastructure. For readers in high-inflation economies seeking dollar-denominated growth assets, this is a path that did not exist six months ago.
## Frequently Asked Questions
### What is tokenized stock trading?
Tokenized stock trading involves digital representations of traditional equities that trade on blockchain infrastructure rather than conventional exchanges. Each tokenized share corresponds to an underlying stock trading on a registered exchange. The difference is custody and settlement, which happen onchain. The legal status of the equity remains the same, but the trading rail changes from traditional brokerage infrastructure to crypto-native platforms.
### Why does the ICE and OKX partnership matter for emerging markets?
The partnership creates infrastructure for dollar-denominated equity access in markets where capital controls or currency restrictions limit traditional brokerage access. Users in Argentina, Turkey, Nigeria, and similar markets can hold stablecoins and access tokenized US stocks through crypto exchanges, bypassing local brokerage infrastructure. This provides an alternative route to US equity exposure for users facing foreign exchange barriers or monthly investment caps.
### What regulatory framework allows tokenized stock trading in the US?
The SEC's September 17, 2026 Innovation Exemption provides conditional relief for tokenized securities venues. The exemption applies to tokenized versions of National Market System stocks that meet specific custody, settlement, and transparency requirements. It does not create a new asset class. Tokenized stocks remain legally equivalent to underlying equities but trade on blockchain infrastructure under SEC oversight and compliance standards.
### Is tokenized stock trading an income strategy?
Tokenized equities generate income through capital appreciation and dividends, not passive yield like staking. For emerging market users in high-inflation economies, the income opportunity is access to dollar-denominated growth assets rather than local currency holdings that lose purchasing power. Users bypass traditional brokerage barriers and gain equity exposure through crypto infrastructure. The income comes from equity performance, not from the tokenization mechanism itself.
### What risks exist with tokenized securities venues?
Tokenized securities venues are new infrastructure with conditional regulatory approval. Compliance requirements may change, affecting access. Custody and settlement happen onchain, which introduces different technical risks than traditional brokerages. Liquidity may be lower than conventional exchanges during early stages. Users in restricted markets face additional risks if local regulations prohibit crypto exchange access or tokenized asset holdings. These risks differ from traditional brokerage risks but do not eliminate them.
The Weekly Yield Report
You now understand how ICE and OKX are building tokenized stock infrastructure following September's SEC exemption. That regulatory environment and those partnerships will evolve quickly.
Every Thursday: where crypto yield actually is - stablecoins, liquid staking and DeFi lending, with the risk named next to the rate and what changed since last week.
[Get it free every Thursday](#/portal/signup)
Free. No trade calls, no allocations, no hype. Unsubscribe in one click.
### iTrustCapital Staking: Which Assets, Yields, And IRA Costs
URL: https://altcoininvestor.com/itrustcapital-staking/
Last updated: 2026-10-05T02:08:20.000Z
## Which Assets iTrustCapital Supports for Staking and What the Current Yields Are

iTrustCapital currently supports staking for two proof-of-stake assets inside its Crypto IRA and Premium Custody Accounts: Ethereum (ETH) and Solana (SOL). Cardano (ADA) staking is listed as coming soon but remains unavailable as of early 2026\. The platform also credits rewards on supported stablecoins, including USDC and RLUSD, though those arrangements differ from native proof-of-stake staking and are not the subject of this analysis.
The yields iTrustCapital delivers are net of a 22% service fee the platform retains from your staking rewards. That means you keep 78% of the gross network yield. [Ethereum staking yields](https://altcoininvestor.com/crypto-staking-returns-across-chains/) currently sit between 2.8% and 4.0% APY at the network level, compressed from the 5.2% headline yields available in 2023 as the validator set expanded and issuance per validator fell. Solana native yields range from 5% to 8% APY depending on validator performance and network participation, though Solana's inflation schedule is gradually declining from 8% toward a long-term 1.5% target, which will compress nominal yields further over the next several years.
After iTrustCapital's 22% fee, the effective yields you receive are approximately 2.2% to 3.1% APY for Ethereum and 3.9% to 6.2% APY for Solana. Those are the numbers you should compare against self-custody staking alternatives and taxable staking on centralized exchanges when deciding whether the IRA wrapper is worth the cost.
Rewards accrue immediately after you stake your assets and are paid out in the same token, but they are not automatically restaked. iTrustCapital pays rewards only when you unstake your assets, which means there is no automatic compounding. If you want to compound your staking returns inside the IRA, you must manually unstake, collect the rewards, and then restake the combined amount. That manual step matters for anyone comparing iTrustCapital to [liquid staking protocols](https://altcoininvestor.com/best-liquid-staking-token/) like Lido or Rocket Pool, where compounding happens passively without user intervention.
## How iTrustCapital's Fee Structure Compares to Self-Custody and Exchange Staking

The 22% fee iTrustCapital retains from your staking rewards is higher than most self-custody staking arrangements but lower than many centralized exchange commissions once you account for the tax treatment. To understand whether that fee is justified, you need to compare the net yield you receive inside the IRA against what you would keep after taxes in a taxable account.
Self-custody staking through a solo validator incurs no commission, but it requires technical expertise, hardware, and uptime management. Delegated staking through validators or liquid staking protocols typically charges 5% to 10% in validator commissions, yielding effective net returns of around 3.2% to 3.5% for Ethereum. Centralized exchanges like Kraken, Coinbase, and Binance charge staking commissions between 15% and 35%, which leaves you with net yields of approximately 2.3% to 2.6% for Ethereum after fees.
The critical difference is tax treatment. In a standard taxable account, staking rewards are treated as ordinary income by the IRS and taxed at your marginal rate in the year they are received. If your marginal tax rate is 24%, for example, a 3.5% gross yield from self-custody staking nets you about 2.7% after taxes. A 3.1% net yield from iTrustCapital inside a Traditional IRA defers that tax until withdrawal in retirement, when your marginal rate may be lower. A Roth IRA eliminates the tax entirely if you hold until age 59½ and meet the five-year rule.
The trade-off becomes clear when you calculate the breakeven. If your marginal tax rate exceeds 22%, the tax deferral inside iTrustCapital's IRA structure can offset the platform's fee retention, particularly over multi-decade horizons where compounding magnifies the benefit of avoiding annual tax drag. If your marginal rate is below 22%, or if you plan to withdraw within a few years, the fee retention costs more than the tax benefit you gain.
iTrustCapital charges a 1% transaction fee on buys and sells, which applies when you initially purchase ETH or SOL to stake and again when you sell after unstaking. There are no monthly or annual account fees, no setup fees, and no transfer fees for in-kind distributions to a personal wallet. The bid-ask spread on executions is typically under 0.20% for major assets like Ethereum and Solana, which is competitive with most retail exchanges.
## Lock-Up Periods, Liquidity Restrictions, and When You Can Access Staked Funds

Staked assets on iTrustCapital remain locked until the network's unbonding process completes. For Solana, that unbonding period is approximately two days. For Ethereum, the unbonding period depends on the exit queue length and can range from three to seven days under normal conditions, though periods of high validator exit demand can extend that window. You cannot buy, sell, or transfer your tokens while they are staked, which means liquidity is frozen until unbonding finishes.
This is a meaningful constraint for anyone who may need to rebalance or exit a position quickly. [Liquid staking tokens](https://altcoininvestor.com/what-are-liquid-staking-tokens/) like Lido's stETH or Rocket Pool's rETH solve this problem by issuing a tradable receipt token that represents your staked position, allowing you to sell or use the token in DeFi without waiting for unbonding. iTrustCapital does not offer liquid staking derivatives, which means once you commit to staking, you must wait for the full unbonding period to regain access to your principal.
Because rewards are paid only when you unstake, rather than accruing in a separate tradable balance, you face a choice: leave your position staked to continue earning, or unstake periodically to collect rewards and manually restake if you want to compound. That creates friction for long-term compounding strategies compared to protocols that auto-compound or issue a balance-increasing liquid staking token.
In-kind distributions to a personal wallet take three to seven business days and require live personal verification. There is no iTrustCapital fee for the transfer itself, though standard IRA withdrawal rules apply. If you withdraw before age 59½, you will owe a 10% early withdrawal penalty plus ordinary income tax on the distribution if it is from a Traditional IRA. Roth IRA contributions can be withdrawn at any time without penalty, but earnings are subject to the same age and five-year holding requirements as Traditional IRAs.
## Tax Treatment: Traditional IRA Deferral, Roth Growth, and the UBIT Question
The primary reason to stake inside an IRA wrapper is tax deferral or tax elimination, depending on whether you use a Traditional or Roth structure. In a Traditional IRA, staking rewards are not taxed in the year they accrue. Instead, the entire account balance is taxed as ordinary income when you take qualified distributions in retirement. That defers the tax liability and allows the full gross return to compound without annual tax drag.
In a [Roth IRA](https://altcoininvestor.com/crypto-ira/), contributions are made with after-tax dollars, but all earnings, including staking rewards, grow tax-free and can be withdrawn tax-free after age 59½ if you have held the account for at least five years. For a long-term holder who expects staking yields to compound over 20 or 30 years, the Roth structure eliminates the entire tax liability on decades of rewards, which is a considerable advantage over taxable staking accounts where every reward payment triggers an ordinary income tax event.
The question that remains unsettled is whether staking inside an IRA could trigger Unrelated Business Income Tax (UBIT). UBIT applies to retirement accounts that earn income from an active trade or business, as opposed to passive investment income. Passive staking through a custodian-controlled platform like iTrustCapital is generally treated as investment income under IRC Section 512(b) and excluded from UBIT. However, if an IRA were operating as an active validator node, running validator software, maintaining uptime, and earning rewards as compensation for services performed, the IRS could argue that the income represents active business income subject to UBIT.
iTrustCapital uses Figment, a widely regarded institutional staking provider, to operate validators on behalf of custody accounts. That structure positions your staking activity as passive delegation to a third-party service provider, not as an active validator operation. Based on the current state of IRS guidance, passive custodial staking should not trigger UBIT. That said, the IRS has not issued definitive guidance on staking specifically, and the question remains open for interpretation. If you are staking substantial amounts or your IRA account operates in any capacity that resembles active validator management, consult a tax professional familiar with UBIT before assuming the income is exempt.
For most iTrustCapital users staking ETH or SOL through the platform's standard custody arrangement, the UBIT risk appears low. The tax advantage comes from deferral or elimination of ordinary income tax on the rewards themselves, not from any special treatment of the staking mechanism.
## When the IRA Wrapper Is Worth the Cost and When It Is Not
The decision to stake inside iTrustCapital's IRA structure comes down to three variables: your marginal tax rate, your time horizon, and your willingness to accept lower net yields in exchange for tax deferral or elimination.
If your marginal federal tax rate is 24% or higher, the tax deferral inside a Traditional IRA or the tax elimination inside a Roth IRA can offset iTrustCapital's 22% fee retention, particularly over multi-decade holding periods. If you are in the 32% or 37% bracket, the tax benefit is unambiguous. You keep more after taxes inside the IRA than you would staking the same assets in a taxable account, even after accounting for iTrustCapital's fee.
If your marginal rate is 12% or lower, the IRA wrapper costs more than it saves. You would be better off staking through a low-fee exchange or self-custody validator and paying the annual tax on rewards at your lower rate. The breakeven sits somewhere between 22% and 24%, depending on your state tax rate and the specific yield you earn.
Time horizon matters because tax deferral compounds. A single year of deferral saves you the tax on one year of rewards. Thirty years of deferral allows three decades of rewards to compound without any tax drag, which can double or triple the terminal value of your staking position compared to a taxable account. If you plan to withdraw within five years, the compounding benefit is minimal and unlikely to justify iTrustCapital's fee. If you plan to hold until retirement, the benefit grows with each additional year of deferral.
Liquidity matters. If you need the flexibility to rebalance, exit positions quickly, or use staked assets as collateral in DeFi, iTrustCapital's structure is too rigid. The absence of [liquid staking derivatives](https://altcoininvestor.com/lido-vs-rocket-pool/), the manual reward collection process, and the unbonding delays all work against active portfolio management. If you are building a long-term, set-and-forget staking position inside a tax-deferred retirement account, those constraints are acceptable. If you are managing a yield portfolio that requires frequent rebalancing, they are not.
One additional consideration: iTrustCapital's asset selection is limited. If you want to stake Cardano, Polkadot, Cosmos, or any proof-of-stake asset outside of Ethereum and Solana, you will need to wait for iTrustCapital to add support or use a different custodian. [Bitcoin IRA](https://altcoininvestor.com/best-crypto-staking-platform/) supports Cardano staking inside tax-advantaged accounts, though recent fee data for that platform's staking service is not publicly available.
## The Takeaway
iTrustCapital's staking service delivers net yields of 2.2% to 3.1% for Ethereum and 3.9% to 6.2% for Solana after the platform's 22% fee retention. The tax deferral benefit inside a Traditional IRA or the tax elimination inside a Roth IRA offsets that fee only if your marginal tax rate exceeds 22% and you hold for at least a decade. For investors in the 24%, 32%, or 37% federal brackets with multi-decade time horizons, the structure works. For investors in lower brackets, or those who need liquidity or want to compound passively, the fee retention costs more than the tax benefit delivers. The absence of automatic compounding, the manual reward collection process, and the limited asset selection all constrain the appeal of iTrustCapital's staking offering compared to liquid staking protocols or self-custody arrangements. If your goal is to build a long-term, tax-advantaged staking position in Ethereum or Solana and you are willing to accept lower net yields in exchange for deferral or elimination of ordinary income tax, iTrustCapital's IRA wrapper is a workable structure. If your goal is to maximize yield, maintain liquidity, or stake assets outside of ETH and SOL, the platform's constraints outweigh its tax advantages.
## Frequently Asked Questions
### What assets can I stake inside iTrustCapital's IRA?
iTrustCapital currently supports staking for Ethereum (ETH) and Solana (SOL) inside both Crypto IRAs and Premium Custody Accounts. Cardano (ADA) staking is listed as coming soon but is not yet available. The platform also credits rewards on supported stablecoins including USDC and RLUSD, though those arrangements differ from native proof-of-stake staking. No other proof-of-stake assets are supported for staking as of early 2026.
### How much does iTrustCapital charge for staking?
iTrustCapital retains 22% of all staking rewards as a service fee, meaning you keep 78% of the gross network yield. There are no monthly or annual account fees, no setup fees, and no transfer fees for in-kind distributions to a personal wallet. The platform also charges a 1% transaction fee on buys and sells, which applies when you purchase assets to stake and when you sell after unstaking. Bid-ask spreads on major assets like ETH and SOL typically run under 0.20%.
### Are staking rewards automatically reinvested?
No. Staking rewards on iTrustCapital are not automatically restaked. Rewards accrue immediately after you stake your assets but are paid out only when you unstake. If you want to compound your staking returns inside the IRA, you must manually unstake, collect the rewards, and then restake the combined amount. This manual process differs from liquid staking protocols like Lido or Rocket Pool, where compounding happens passively without user intervention.
### Does staking inside an IRA trigger UBIT?
Passive staking through a custodian-controlled platform like iTrustCapital is generally treated as investment income under IRC Section 512(b) and excluded from Unrelated Business Income Tax (UBIT). iTrustCapital uses Figment validators to operate staking on behalf of custody accounts, which positions the activity as passive delegation to a third-party service provider. However, the IRS has not issued definitive guidance on staking specifically, and the question remains open for interpretation. For most standard custody arrangements, UBIT risk appears low, but consult a tax professional if you are staking substantial amounts.
### How long does it take to unstake and withdraw assets?
Staked assets remain locked until the network's unbonding process completes. For Solana, unbonding takes approximately two days. For Ethereum, unbonding ranges from three to seven days under normal conditions, though high validator exit demand can extend that window. In-kind distributions to a personal wallet take an additional three to seven business days and require live personal verification. You cannot buy, sell, or transfer tokens while they are staked, which means liquidity is frozen until unbonding finishes.
The Weekly Yield Report
You have just reviewed two staking assets, net yields between 2.2% and 6.2%, and a 22% fee structure. Those yields and fees will change as network conditions and platform policies shift.
Every Thursday: where crypto yield actually is - stablecoins, liquid staking and DeFi lending, with the risk named next to the rate and what changed since last week.
[Get it free every Thursday](#/portal/signup)
Free. No trade calls, no allocations, no hype. Unsubscribe in one click.
### CoinLedger vs CoinTracker: Protocol Coverage, Import Accuracy, And Cost Breakdown
URL: https://altcoininvestor.com/coinledger-vs-cointracker/
Last updated: 2026-10-04T23:03:54.000Z
## The Question Both Platforms Exist To Answer
You ran staking positions on Lido, deposited liquidity on Uniswap V3, farmed yield on Curve, and moved tokens between wallets across Ethereum and Arbitrum. At tax time, you need software that can reconstruct cost basis for every position, classify every transaction correctly, and produce a defensible report that survives scrutiny from your accountant or the IRS.
CoinLedger and CoinTracker both promise that reconstruction. The question worth answering is which one delivers it when confronted with the transaction types that actually matter for yield allocators: liquidity pool deposits and withdrawals, staking reward accrual, yield farming distributions, cross-chain bridge transfers, and the hundreds of micro-transactions DeFi protocols generate in a single tax year.
The comparison that follows tests both platforms against the same multi-protocol wallet containing the transaction types where most tax software breaks. The goal is not to recommend the cheapest option. The goal is to identify which platform produces accurate reports for [yield-bearing positions](https://altcoininvestor.com/passive-income-stablecoins/) without requiring manual correction of hundreds of transactions, and at what cost that accuracy comes.
## Protocol Coverage: What Each Platform Actually Imports
CoinLedger advertises support for 400 exchange and wallet integrations. CoinTracker advertises 500 exchange integrations and 20,000 DeFi smart contracts. The difference in those numbers matters less than what each platform does when it encounters a transaction type it has not explicitly mapped.
CoinTracker handles Ethereum mainnet DeFi transactions with reasonable accuracy. Connect a wallet, and it reads on-chain history, labeling common actions like swaps, liquidity provision, and staking automatically. The platform recognizes Uniswap, Curve, Aave, Compound, Lido, and most mainstream protocols without requiring manual intervention. On Layer 2 networks, accuracy declines. Brand-new protocols may import as generic transfers and require manual labeling.
CoinLedger covers the same major protocols but struggles more frequently with complex multi-step transactions. A single yield farming position can create five or more taxable events: the initial deposit, the token swap that occurs during deposit, the receipt of LP tokens, the accrual of farming rewards, and the withdrawal. CoinLedger often correctly identifies the deposit and withdrawal but misclassifies the intermediate steps, tagging them as trades when they should be categorized as non-taxable internal transfers or income events.
Neither platform handles every DeFi transaction correctly without review. The difference is that CoinTracker requires manual correction on newer or less common protocols, while CoinLedger requires manual correction on mainstream protocols when the transaction structure is complex. If your yield activity centers on Ethereum mainnet and established protocols, CoinTracker produces cleaner imports. If your activity is primarily centralized exchange trades with occasional staking, CoinLedger handles it adequately at lower cost.
The key gap both platforms share is this: they aggregate continuous micro-income events into annual reportable figures, but they do not document the underlying methodology. Many lending protocols update your balance with every block, creating thousands of micro-income events. The software compresses those into a single line item on your tax report, but if that figure is challenged, you cannot reconstruct how it was calculated. That documentation gap becomes material during an audit.
## Liquidity Pool Handling: Where Import Accuracy Breaks
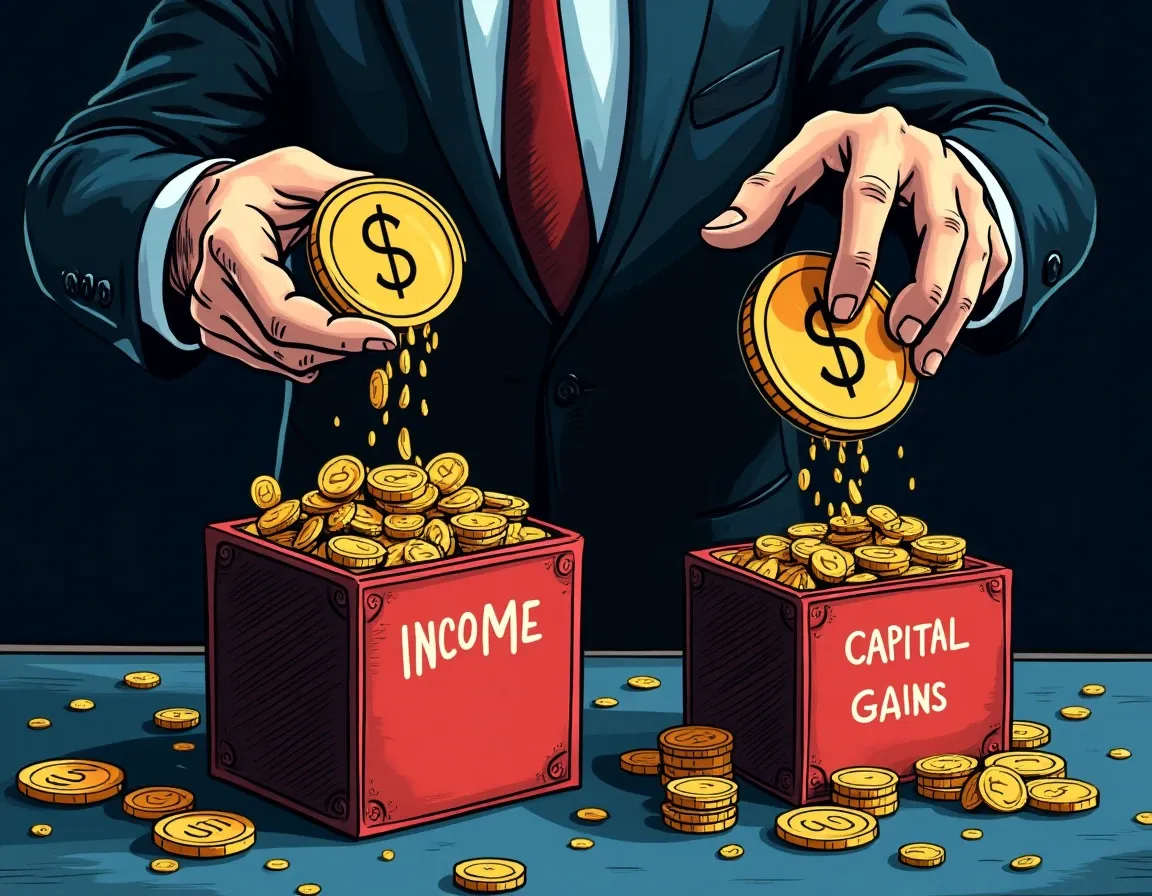
Liquidity pool transactions are the stress test for crypto tax software. When you deposit two tokens into a Uniswap V3 pool, you receive an LP token representing your position. As traders swap through the pool, you accrue fees. When you withdraw, you receive your principal plus fees, minus any impermanent loss. Each step has distinct tax treatment, and most platforms misclassify at least one.
The deposit itself is not taxable, but if the protocol swaps your tokens during deposit to achieve the correct ratio, that swap is taxable. The LP token you receive represents your claim on the pool; receiving it is not a taxable event. Fee accrual is taxable income as it occurs, but calculating the exact accrual date and value requires parsing thousands of on-chain events. Impermanent loss is not deductible until you withdraw and realize it. The withdrawal is a taxable disposal of the LP token in exchange for the underlying assets, with cost basis determined by your original deposit value.
CoinTracker handles this sequence better than CoinLedger. It correctly identifies Uniswap V3 LP deposits as non-taxable transfers in most cases, tags fee accrual as income, and calculates withdrawal basis using the original deposit value. The platform struggles with concentrated liquidity positions where the price range is narrow and rebalancing occurs frequently. Those rebalancing events are taxable, but CoinTracker often imports them as generic transfers rather than swaps.
CoinLedger frequently misclassifies the initial LP token receipt as a taxable trade, creating phantom capital gains or losses that do not exist. It aggregates fee accrual correctly but does not separate impermanent loss from principal at withdrawal, which means the cost basis calculation includes IL as a capital loss even though it should be netted against fee income. These errors are correctable, but correcting them requires manually editing transaction types and adjusting cost basis for every LP position.
For users running [multi-protocol yield strategies](https://altcoininvestor.com/best-crypto-wallet/), the question becomes whether you value your time more than the price difference between the platforms. If you run ten LP positions across three protocols, CoinLedger will save you $100 to $150 per year but cost you 6 to 10 hours of manual correction work. CoinTracker will cost you that $100 to $150 but reduce manual work to 1 to 2 hours.
## Staking and Yield Farming: Income Classification Accuracy
Staking rewards are taxed as ordinary income at fair market value when you receive or gain control of the tokens, consistent with IRS Revenue Ruling 2023-14\. That rule is clear. The implementation is not.
When you stake ETH on Lido and receive stETH, some tax professionals treat the receipt of stETH as a non-taxable like-kind exchange. Others classify it as a taxable swap, arguing that stETH and ETH are distinct assets with independent market values. As stETH appreciates through rebasing, that appreciation represents either taxable income (if the rebasing is treated as a reward distribution) or unrealized capital appreciation (if the rebasing is treated as a change in the value of the asset you hold). Neither CoinLedger nor CoinTracker documents a consistent position on this question, which means their automated classification may not align with your accountant's interpretation.
Yield farming introduces additional complexity. When you deposit liquidity on Curve and begin receiving CRV rewards, those rewards are taxable income at the moment you gain control of them. If the protocol auto-compounds those rewards back into your position, that compounding is a second taxable event: you received income, then you used that income to purchase additional LP tokens. CoinTracker recognizes this sequence and tags both the reward receipt and the compounding transaction. CoinLedger often imports auto-compounding as a single event, which understates your taxable income and overstates your cost basis in the LP position.
The failure mode that matters most for active yield farmers is this: DeFi protocols generate frequent small transactions, and aggregating those transactions incorrectly can create a material understatement of income. A yield farming position that distributes $50 in rewards weekly generates 52 taxable events per year. If the software aggregates those rewards at the year-end token price rather than the price at each distribution, you will report the wrong income figure. CoinTracker handles this correctly by timestamping each reward at receipt and valuing it at that moment's market price. CoinLedger frequently aggregates rewards by month, which improves readability but reduces accuracy.
For users who need to defend their tax position in an audit, the difference between these approaches is significant. The IRS expects you to report income when you receive it, not when you sell it. Software that aggregates by month may produce a cleaner-looking report, but it does not produce a defensible one.
## Cost Basis Methods and 1099-DA Reconciliation
Both platforms support FIFO, LIFO, and HIFO cost basis methods. CoinTracker also supports Specific Identification, which allows you to manually designate which tax lot you are selling with each transaction. CoinLedger does not offer Spec ID, which limits your ability to optimize tax outcomes in portfolios with frequent trading.
The more immediate concern for 2026 filers is 1099-DA reconciliation. Centralized exchanges now issue Form 1099-DA, which reports gross proceeds and cost basis for disposals that occurred on the exchange. If your tax software calculates a different cost basis than the exchange reported, you must reconcile the difference on Form 8949 or explain the discrepancy in an attachment. Failure to reconcile creates an IRS matching notice.
CoinLedger has built a dedicated 1099-DA dashboard that imports exchange-reported figures and highlights discrepancies. You can accept the exchange's basis, use the software's calculated basis, or manually adjust. CoinTracker offers full 1099-DA support with Coinbase integration but does not provide a line-by-line reconciliation interface for other exchanges. You receive a summary report that identifies discrepancies, but resolving them requires exporting data to a spreadsheet.
For users with high transaction volumes on exchanges that issue 1099-DA, CoinLedger's reconciliation workflow is clearer. For users whose activity is primarily on-chain or on exchanges that do not yet issue 1099-DA, the difference is immaterial.
## Pricing at Transaction Volumes That Matter for Yield Allocators
CoinLedger charges $49.99 per year for up to 3,000 transactions (Premium plan) and $99.99 per year for up to 100,000 transactions (Pro plan). CoinTracker charges $59 per year for 100 transactions (Base plan), $199 per year for 1,000 transactions (Prime plan), and $599 per year for 10,000 transactions (Ultra plan). Both platforms offer free portfolio tracking with tax reports available as a one-time purchase per tax year.
For a user running moderate yield activity across five protocols with approximately 500 transactions per year, CoinLedger costs $49.99 and CoinTracker costs $199\. CoinLedger delivers better value if the transaction imports are accurate. If the imports require 8 hours of manual correction at an opportunity cost of $50 per hour, the effective cost of CoinLedger rises to $449.99, making CoinTracker cheaper on a fully-loaded basis.
For a user running active multi-protocol yield with 2,500 transactions per year, CoinLedger remains $49.99 and CoinTracker remains $199\. At 5,000 transactions, CoinLedger rises to $99.99 and CoinTracker rises to $599\. The crossover occurs when transaction accuracy matters more than headline cost, which for most DeFi-active users occurs between 1,000 and 2,000 transactions annually.
Users should test both platforms with a free import before purchasing. Both allow you to connect wallets and review transaction classification without paying. That review identifies how many transactions require manual correction, which determines the effective cost.
For more detail on how transaction limits work and what counts as a transaction in [CoinLedger's pricing structure](https://altcoininvestor.com/coinledger-pricing/), the linked article walks through edge cases where single DeFi actions generate multiple counted transactions.
## Edge Cases Where Both Platforms Require Manual Correction
No crypto tax platform handles every transaction type automatically. The edge cases that require manual intervention are the same across CoinLedger, CoinTracker, and every competitor: flash loans, leveraged yield farming, cross-chain bridge transfers that create wrapped tokens, NFT minting with royalty structures, and governance token airdrops from staking positions.
Flash loans are typically non-taxable because you borrow and repay within the same transaction, but the fees paid are deductible expenses. Most platforms import flash loans as two separate trades (borrow and repay), which creates false taxable events. You must manually tag both sides as non-taxable and reclassify the fee as an expense.
Cross-chain bridge transfers create a similar problem. When you bridge USDC from Ethereum to Arbitrum, you deposit USDC on Ethereum and receive USDC.e on Arbitrum. Technically, those are two distinct assets with independent market values. Some tax professionals treat bridging as a non-taxable transfer of the same underlying asset. Others treat it as a taxable disposal of USDC and acquisition of USDC.e. Neither platform documents a default position, which means the classification depends on your manual input.
Governance token airdrops from staking are taxable income when you receive them, not when you sell them. Both platforms correctly tag airdrops as income, but they do not always correctly identify the date you gained control of the tokens. If a governance token is locked for six months after the airdrop, you do not have income until the lock expires. The platforms import the airdrop date, not the unlock date, which overstates your taxable income in the airdrop year and understates your cost basis when you eventually sell.
For these edge cases, CoinTracker's accountant portal is useful if you work with a CPA. The portal provides full read access to your transaction history and allows your accountant to add notes and adjust classifications without logging into your account. CoinLedger does not offer an accountant portal; you must export a CSV and email it, which creates version control problems if your accountant makes changes.
## Who Each Platform Is Right For
CoinLedger is the correct choice for users whose crypto activity is primarily centralized exchange trades with occasional staking or simple DeFi positions. If your transaction volume is under 1,000 per year and you do not run complex LP strategies, CoinLedger produces accurate reports at the lowest cost. The TurboTax integration is clean, the reconciliation workflow for 1099-DA is clearer than CoinTracker's, and the $49.99 price point is materially cheaper than competitors. The platform is US-focused, which means international tax forms are not supported, but for US filers with straightforward portfolios, that limitation does not matter.
CoinTracker is the correct choice for users running active multi-protocol yield strategies on Ethereum mainnet or established Layer 2 networks. If your portfolio includes Uniswap V3 LP positions, Curve yield farming, Lido staking, and cross-chain activity, CoinTracker imports those transactions with fewer errors and less manual correction time. The accountant portal is valuable if you work with a CPA who specializes in crypto. The portfolio tracking is more polished than CoinLedger's, which matters if you use the platform year-round rather than only at tax time. The higher cost is justified if it reduces manual correction time by 5 to 10 hours per year.
Neither platform is adequate for users running leveraged DeFi strategies, flash loan arbitrage, or positions on newer protocols that lack explicit integration. Those users need software with custom transaction tagging, manual basis adjustment, and the ability to import and reconcile across multiple data sources. For that use case, neither CoinLedger nor CoinTracker is sufficient; you need a tax accountant with crypto expertise or more advanced software designed for institutional or high-net-worth clients.
The decision rule is this: if your time is worth more than $30 per hour and your DeFi activity generates more than 1,000 transactions per year, CoinTracker's higher accuracy justifies the higher cost. If your transaction volume is lower or your activity is simpler, CoinLedger delivers adequate accuracy at meaningfully lower cost.
## The Recommendation
Use CoinTracker if you run multi-protocol yield positions where accurate DeFi import handling is worth paying an extra $150 per year. Use CoinLedger if your activity is exchange-based or simple staking where manual correction time is minimal and cost is the deciding factor. Test both platforms with a free import before purchasing to verify that the automated classification matches your transaction history.
The structural risk both platforms share is that they aggregate DeFi micro-transactions without documenting the underlying methodology, which creates audit vulnerability. If the IRS questions your reported income or cost basis, you must be able to reconstruct the calculation. Neither platform provides that reconstruction automatically. For users with high-value portfolios or complex yield strategies, that documentation gap matters more than the price difference between the two platforms. [Building a separate logging system](https://altcoininvestor.com/how-to-track-defi-yield-for-taxes/) for multi-protocol yield addresses that gap and ensures you can defend your tax position if challenged.
## The Takeaway
Where CoinLedger breaks on LP classification and yield farming income aggregation, CoinTracker produces cleaner imports but at double the annual cost for moderate transaction volumes. The choice depends on whether your DeFi activity generates transaction complexity that justifies paying $150 more per year to reduce manual correction time by 6 to 8 hours. For yield allocators running positions across five or more protocols, that math favors CoinTracker. For users with simpler activity profiles, CoinLedger's lower cost and adequate accuracy are sufficient. Test both with a free import to determine which platform handles your specific transaction history correctly, because no comparison article can predict how software will classify the edge cases unique to your wallet. The platform that produces fewer misclassified transactions on your actual data is the correct choice, regardless of headline pricing.
## Frequently Asked Questions
### Does CoinLedger or CoinTracker handle Uniswap V3 liquidity pool transactions more accurately?
CoinTracker handles Uniswap V3 LP deposits and withdrawals with fewer classification errors. It correctly identifies LP token receipt as non-taxable and separates fee accrual from principal at withdrawal. CoinLedger frequently misclassifies LP token receipt as a taxable trade and does not separate impermanent loss from fee income at withdrawal, requiring manual correction for each LP position.
### Which platform costs less for 2,500 transactions per year?
CoinLedger costs $49.99 per year for up to 3,000 transactions. CoinTracker costs $199 per year for 1,000 transactions and $599 per year for 10,000 transactions. At 2,500 transactions, CoinLedger costs $49.99 and CoinTracker costs $199\. However, if CoinLedger requires 6 to 8 hours of manual correction for DeFi transactions, the effective cost including your time exceeds CoinTracker's headline price.
### Do either CoinLedger or CoinTracker support Specific Identification cost basis?
CoinTracker supports Specific Identification, FIFO, LIFO, and HIFO cost basis methods. CoinLedger supports only FIFO, LIFO, and HIFO. Specific Identification allows you to manually designate which tax lot you are selling with each transaction, which can optimize tax outcomes in portfolios with frequent trading. The absence of Spec ID in CoinLedger limits tax optimization options.
### How do CoinLedger and CoinTracker handle staking rewards from protocols like Lido?
CoinTracker timestamps each staking reward at receipt and values it at that moment's market price, which produces accurate income reporting consistent with IRS guidance. CoinLedger often aggregates staking rewards by month rather than by individual receipt, which improves report readability but reduces accuracy. For users who need to defend their tax position in an audit, CoinTracker's per-event tracking is more defensible.
### Which platform is better for reconciling 1099-DA forms from centralized exchanges?
CoinLedger provides a dedicated 1099-DA dashboard that imports exchange-reported figures, highlights discrepancies, and allows line-by-line reconciliation. CoinTracker offers 1099-DA support with Coinbase integration but does not provide a reconciliation interface for other exchanges. For users with high transaction volumes on multiple exchanges that issue 1099-DA, CoinLedger's reconciliation workflow is clearer and requires less manual spreadsheet work.
The Weekly Yield Report
You have just compared two platforms on DeFi import accuracy, LP handling, and cost across five transaction volumes. Next year those protocols will change their reward structures, and new tax forms will arrive.
Every Thursday: where crypto yield actually is - stablecoins, liquid staking and DeFi lending, with the risk named next to the rate and what changed since last week.
[Get it free every Thursday](#/portal/signup)
Free. No trade calls, no allocations, no hype. Unsubscribe in one click.
### Decentralized Crypto Wallets: What Self-Custody Actually Means
URL: https://altcoininvestor.com/decentralized-crypto-wallets/
Last updated: 2026-10-04T22:03:21.000Z
## What 'Decentralized Wallet' Actually Means

The term "decentralized crypto wallet" appears in thousands of product descriptions, marketing pages, and beginner guides. It sounds technical. It is not. "Decentralized wallet" is marketing language for self-custody: you hold the private keys, you sign the transactions, you bear the loss risk if the keys are compromised or lost. The label does not describe a distinct product category. It describes a custody model that every non-custodial wallet shares.
MetaMask is called decentralized. Rainbow is called decentralized. Frame is called decentralized. Argent uses the term. Safe uses the term. MPC wallets use the term. The word has been applied to products with fundamentally different security architectures, recovery mechanisms, and trust assumptions. The unifying factor is not technical. It is branding.
The meaningful distinction is not whether a wallet calls itself decentralized. The meaningful distinction is who controls the signing authority. In truly non-custodial wallets, the user holds the seed phrase and signs transactions without third-party involvement. In hybrid models like social recovery wallets or MPC designs, signing authority is split across multiple parties or governed by smart contract logic. These are not equivalent security models. They are different custody architectures marketed under the same label.
## Self-Custody vs. Custodial: The Only Distinction That Matters

Self-custody means you control the private keys. No intermediary can move your funds, freeze your account, or censor your transactions. You generate the keys on your device, you store the seed phrase, you authorize every transaction. If you lose the seed phrase, the funds are gone. If someone phishes your signature, the funds are gone. The platform cannot help you. This is not a bug. This is the security model.
Custodial wallets invert the risk. The exchange or platform holds the keys. You trust them not to lose funds, not to get hacked, not to freeze your account, not to misuse your capital. You eliminate seed phrase loss risk. You introduce counterparty risk. FTX users learned this distinction in November 2022 when $8 billion in customer funds disappeared. The users held no keys. They had no recourse.
Neither model is universally safer. The question is which failure mode you can manage. Can you secure a seed phrase against phishing, device compromise, and physical loss? Use [self-custody](https://altcoininvestor.com/what-is-self-custody-crypto/). Do you trust a regulated exchange more than your own operational security? Use custodial. The trade-off is explicit.
Every product calling itself a "decentralized wallet" is making a claim about custody. The claim is that the user, not the platform, controls signing authority. That claim needs verification. Marketing language does not constitute proof.
## Pure Self-Custody Wallets: MetaMask, Rainbow, Frame
MetaMask generates a 12-word seed phrase on your device. The phrase derives your private keys using BIP-39 and BIP-44 standards. MetaMask never sees the phrase. The phrase never leaves your device unless you export it. You sign transactions locally. The wallet broadcasts the signed transaction to the network. If you lose the seed phrase, MetaMask cannot recover it. If someone tricks you into signing a malicious transaction, MetaMask cannot reverse it. This is the reference implementation of non-custodial architecture.
Rainbow follows the same model. Generate seed phrase, derive keys, sign locally, broadcast transaction. The difference is UX: Rainbow focuses on mobile-first design and offers optional iCloud backup for the encrypted seed phrase. The backup introduces a dependency on Apple's infrastructure. If your iCloud account is compromised, your seed phrase is compromised. The trade-off is convenience for iOS users versus elimination of Apple as a trust dependency. The custody model is identical to MetaMask.
Frame is a native desktop application, not a browser extension. It integrates directly with hardware wallets like Ledger and Trezor without bridge software. The architecture separates key management from transaction signing at the OS level rather than the browser level. The custody model remains identical: user holds seed phrase, user signs transactions, user bears loss risk. The variation is in the attack surface, not the custody architecture.
All three products are equally "decentralized" by any technical definition. The security model is identical. The failure modes are identical. Seed phrase loss, phishing, device compromise, and malicious contract interaction are universal risks across all pure self-custody wallets. The label "decentralized" adds no information. The relevant question is: does the user hold the seed phrase and sign transactions without third-party involvement? For [MetaMask, Rainbow, and Frame](https://altcoininvestor.com/what-are-cryptocurrency-wallets/), the answer is yes.
## Social Recovery and MPC Wallets: Custody-Assisted Models
Argent is marketed as non-custodial. Technically, Argent deploys a smart contract wallet on-chain. The contract, not an externally owned account controlled by a private key, holds your funds. The contract enforces rules: daily spending limits, guardian approvals for large transfers, whitelisted addresses. If you lose your device, you do not recover from a seed phrase. You recover through a guardian quorum.
The recovery mechanism works as follows. You designate guardians when you create the wallet. Guardians can be other Argent users, hardware wallets, or third-party services. If you lose access, you submit a recovery request. Guardians approve the request. After a 36-hour time delay, the contract transfers signing authority to a new device. If the original device still has access during the delay window, it can cancel the recovery.
This is not equivalent to seed phrase custody. The guardians are a dependency. If guardians collude, they can initiate recovery and drain the account after the time delay. If guardians are unavailable or unresponsive, recovery fails. If the smart contract has a bug, the funds are at risk. These failure modes do not exist in pure self-custody wallets. Argent is non-custodial in the sense that Argent the company does not hold your keys. Argent is not non-custodial in the sense that you alone control signing authority. The guardian system introduces a shared custody element.
MPC wallets split the private key into multiple shares. A common design is 2-of-3: the user holds one share, the MPC provider holds one share, and a third-party recovery service holds one share. No single party can sign a transaction unilaterally. Two shares must cooperate to reconstruct the signing key. The full private key is never assembled in one location.
MPC eliminates seed phrase loss risk. If you lose your device, you recover using your share plus the provider's share. But you introduce a dependency on the MPC provider's infrastructure and business continuity. If the provider shuts down, your recovery path depends on their protocol design and whether they published the key derivation logic. If the provider is compelled by legal process to freeze your share, you cannot sign transactions. This is custody exposure. The provider retains control over the means of access, even if they do not unilaterally hold the full key.
The European Union's MiCA regulation defines custody as control over crypto-assets or the means of accessing them. An MPC provider holding a key share that is necessary for transaction signing may fall under custody obligations. This is not a settled legal question. But the operational reality is clear: the user does not have unilateral signing authority. The MPC provider is a required counterparty. This is a different custody model than MetaMask.
## The Security Model Is Identical Across Pure Self-Custody Wallets
In April 2025, Coinspect published a security ranking of self-custodial browser wallets. MetaMask Extension scored highest, with a security score based on decentralized app permissions, intent verification, physical access protections, and threat prevention. The ranking evaluates implementation quality, not custody model. Every wallet in the ranking uses the same custody architecture: user holds seed phrase, wallet signs transactions locally.
MetaMask has over 100 million users and has never been directly hacked. The wallet itself has not been compromised. But in January 2026, MetaMask's security team reported a 207% surge in signature phishing attacks, draining $6.27 million from 4,700 wallets. The attack vector was not the wallet. The attack vector was the user signing malicious transactions. This is the universal risk in self-custody. If you sign a transaction that approves unlimited token spending, the wallet will execute it. The wallet does not know your intent. It knows only the transaction you signed.
Rainbow, Frame, and every other pure self-custody wallet share this failure mode. The wallet cannot protect you from signing a malicious transaction. The wallet cannot recover funds if you lose your seed phrase. The wallet cannot reverse a transaction after it is broadcast. The security properties are identical. The variation is in UX, transaction clarity, approval management, and hardware wallet integration. These are implementation details. The custody model and the failure modes are the same.
Personal wallet compromises reached $713 million in losses in 2025, representing 20% of total crypto theft that year. The losses were not from wallet software vulnerabilities. The losses were from seed phrase theft, phishing, malicious contract interactions, and social engineering. These risks apply to every self-custody wallet, regardless of branding. The label "decentralized" does not confer additional security. It describes the baseline custody model that all non-custodial wallets share.
## Why 'Decentralized' Is a Marketing Term, Not a Technical One
The term "decentralized" has no standardized technical definition in the context of wallets. The Bitcoin whitepaper used "decentralized" to describe the network architecture: no central authority controls transaction validation. Ethereum uses "decentralized" to describe the execution environment: smart contracts run on a distributed network of nodes. In both cases, decentralization refers to the elimination of a single point of control over the protocol.
Wallets do not have network consensus mechanisms. Wallets do not validate transactions. Wallets manage private keys and sign transactions. The custody model is binary: either the user controls the keys, or a third party controls the keys. There is no spectrum of decentralization. There is custody or non-custody.
Marketing teams use "decentralized" because it signals alignment with crypto's ideological roots. The term implies trustlessness, censorship resistance, and user sovereignty. These are properties of blockchains, not wallets. A wallet is decentralized only in the sense that it does not rely on a central custodian to hold your keys. That is the definition of non-custodial. The two terms are synonyms. The preference for "decentralized" is branding, not technical precision.
The conflation becomes problematic when products with fundamentally different custody models all use the same label. Argent is decentralized in that Argent the company does not hold your keys. But Argent is not decentralized in that you require guardian cooperation to recover your account. MPC wallets are decentralized in that no single party holds the full key. But MPC wallets are not decentralized in that you require provider cooperation to sign transactions. MetaMask is decentralized in that you alone control signing authority. These are not equivalent architectures. The label obscures the distinction.
## When the Custody Model Actually Matters
The custody model determines your capital loss risk. If you use a pure self-custody wallet and lose your seed phrase, your funds are gone. If you use a custodial wallet and the exchange is hacked or collapses, your funds are gone. If you use a social recovery wallet and your guardians collude or become unresponsive, your recovery path is blocked. If you use an MPC wallet and the provider shuts down without publishing recovery logic, you may lose access to your share.
For small holdings and infrequent transactions, custodial wallets reduce operational risk. You do not manage a seed phrase. You do not worry about phishing. You trust the exchange's security team. For large holdings or high-frequency DeFi interaction, self-custody eliminates counterparty risk. You do not trust the exchange. You trust your own operational security. For users who cannot reliably secure a seed phrase, social recovery or MPC models offer a middle path. You trade unilateral control for assisted recovery.
The choice depends on your threat model. If you trust your ability to secure a seed phrase against physical theft, device compromise, and phishing more than you trust an exchange to remain solvent and secure, use [pure self-custody](https://altcoininvestor.com/best-crypto-hardware-wallets/). If you trust a regulated custodian more than your own operational security, use a custodial wallet. If you want recovery options without a custodian, use social recovery or MPC, but understand that you are introducing dependencies.
The label "decentralized" does not answer the question. The architecture answers the question. Does the user hold the seed phrase and sign transactions without third-party involvement? Yes: pure self-custody. No: hybrid or custodial. The distinction matters only when the failure mode is triggered. Until then, all wallets work the same way: you send a transaction, the wallet signs it, the network executes it.
## The Takeaway
"Decentralized wallet" is a synonym for self-custody with no additional technical meaning. MetaMask, Rainbow, and Frame all implement the same custody model: user holds seed phrase, user signs transactions, user bears loss risk. Argent and Safe introduce guardian or multisig dependencies that alter the recovery and signing model. MPC wallets split key control across multiple parties, introducing provider dependencies. All of these products use the term "decentralized." The term does not distinguish between them.
The relevant question is not whether a wallet calls itself decentralized. The relevant question is who controls signing authority, what the recovery mechanism requires, and what failure modes exist. Pure self-custody wallets fail when you lose the seed phrase or sign malicious transactions. Social recovery wallets fail when guardians are unavailable or collude. MPC wallets fail when the provider becomes unavailable. These are different risk profiles. The label does not tell you which risk you are accepting.
Understanding the actual custody model prevents capital loss from assuming a wallet has protections it does not. Self-custody means you control the keys and bear all loss risk. The specific wallet you choose matters only for UX, chain support, and signing clarity. The custody model is identical across all pure self-custody implementations. "Decentralized" is branding. The architecture is what matters.
## Frequently Asked Questions
### What does decentralized wallet actually mean?
Decentralized wallet is marketing language for self-custody. It means you control the private keys and sign transactions without third-party involvement. The term does not describe a distinct technical architecture. Every non-custodial wallet uses the same custody model: user holds seed phrase, wallet signs transactions locally, user bears loss risk. The label decentralized adds no information beyond non-custodial. The meaningful question is who controls signing authority, not what the product calls itself.
### Are all self-custody wallets equally secure?
All pure self-custody wallets share the same core security model and failure modes. Seed phrase loss, phishing, device compromise, and malicious contract interaction are universal risks. Variation exists in implementation quality, transaction clarity, approval management, and hardware wallet integration. MetaMask, Rainbow, and Frame all use identical custody architecture. The difference is UX and attack surface mitigation, not fundamental security properties. The security ranking evaluates how well a wallet helps you avoid mistakes, not whether the custody model differs.
### What is the difference between MetaMask and Argent?
MetaMask is pure self-custody. You hold the seed phrase. You alone control signing authority. Argent uses a smart contract wallet with guardian-based recovery. If you lose access, guardians approve a recovery request after a time delay. This introduces dependencies: guardian availability, guardian honesty, and smart contract correctness. MetaMask fails when you lose the seed phrase. Argent fails when guardians are unresponsive or collude. These are different custody models marketed under the same non-custodial label. The architectures are not equivalent.
### Can I recover funds if I lose my seed phrase?
No. In pure self-custody wallets like MetaMask, Rainbow, and Frame, seed phrase loss is permanent capital loss. The wallet provider cannot recover the phrase. No authority can reverse the loss. This is the trade-off for eliminating counterparty risk. Social recovery wallets like Argent offer guardian-based recovery without a seed phrase. MPC wallets offer provider-assisted recovery using key shares. These models introduce dependencies. Pure self-custody eliminates dependencies and eliminates recovery options. The failure mode is explicit and irreversible.
### What is an MPC wallet and is it truly non-custodial?
MPC wallets split the private key into multiple shares distributed across user, provider, and sometimes a third-party service. Two shares are required to sign a transaction. The full key is never assembled. MPC eliminates seed phrase loss risk but introduces provider dependency. If the provider becomes unavailable, you cannot sign transactions. If the provider is compelled to freeze access, you lose control. This is custody exposure. MiCA defines custody as control over assets or the means of accessing them. MPC providers may fall under custody obligations. The model is not equivalent to pure self-custody.
Tool mentioned above
Ledger
Ledger devices display the full transaction on their own screen before you approve it, which is what stops an approval exploit at the point it matters.
[See Ledger devices](https://shop.ledger.com/?r=90612ff43561)
We may earn a commission if you sign up through this link, at no cost to you. It does not change what gets recommended.
The Weekly Yield Report
You now understand that decentralized is branding and custody architecture is mechanism. The next hybrid wallet will use the same label with a different dependency structure.
Every Thursday: where crypto yield actually is - stablecoins, liquid staking and DeFi lending, with the risk named next to the rate and what changed since last week.
[Get it free every Thursday](#/portal/signup)
Free. No trade calls, no allocations, no hype. Unsubscribe in one click.
### Sky Surges 42.6% in 30 Days on Galaxy Partnership and Burn
URL: https://altcoininvestor.com/sky-surge-42-percent-galaxy-partnership-token-burn/
Last updated: 2026-10-04T20:02:41.000Z
## Sky Rally Driven by Institutional Backing and Supply Cut

Sky climbed 42.6% over 30 days to $0.096415 as of October 4, 2026, according to CoinGecko. The token gained 26.6% over the past week and 9.2% in the last 24 hours, pushing its market capitalization to $2.26 billion and ranking it 51st among all cryptocurrencies. Sky now sits 4.1% below its all-time high of $0.100535, reached on December 4, 2024.
The rally followed two distinct catalysts. [Galaxy Digital announced on September 23, 2026](https://coinmarketcap.com/cmc-ai/sky/latest-updates/), that it had allocated $100 million from its balance sheet to hold sUSDS, Sky's yield-bearing stablecoin, making it one of the first public companies to do so. Galaxy also approved sUSDS as eligible collateral across its $1.4 billion institutional loan book, enabling clients to earn yield on posted collateral.
Earlier in September, [Sky governance approved the destruction of approximately 2.86 million SKY tokens](https://ambcrypto.com/sky-crypto-price-prediction-can-sky-hold-its-breakout-above-0-084/), removing them from circulation and reducing available supply. The burn preceded the Galaxy announcement by several weeks.
Sky is the rebranded version of MakerDAO, which launched new governance token SKY and stablecoin USDS in September 2024\. The protocol offers the Sky Savings Rate, currently 3.60% APY as of September 2026, to holders of sUSDS. Revenue jumped from $48,500 to $560,800 on September 30, 2026, according to Artemis data cited by KuCoin, though it later fell to $436,210.
## The Move Came in Stages, Not a Single Event

The 42.6% gain over 30 days did not arrive as a single vertical move. Sky traded near $0.0787 on September 29, 2026, before buyers pushed it above $0.084, according to AMBCrypto. It briefly touched $0.0875 that day, its highest price in several months. The token then broke above a descending trendline from its April 26 high on September 24, 2026, ending a roughly five-month downtrend, per CoinMarketCap analysis.
Trading volume spiked 147% to over $85.8 million on October 2, 2026, confirming strong buying conviction as SKY broke above rising channel resistance near $0.091 to $0.092, according to Crypto.news. The move coincided with broader risk-on sentiment, as Bitcoin climbed approximately 3.4% to above $86,000 and other large-cap altcoins rallied between 2% and 4% during the same session.
The rally built on positive sentiment from the late-September Galaxy Digital announcement, but no fresh coin-specific news drove the immediate 24-hour moves in early October. Standard Chartered Bank initiated coverage of Sky on September 11, 2026, calling it "DeFi's federal bank" and forecasting the SKY token could rise fivefold to $0.325 by the end of 2028, driven by growth in the USDS stablecoin business and wider ecosystem.
Sky received an S&P Global Ratings issuer credit rating of B- with a stable outlook on October 1, 2026, according to Huoxing Finance. Reserves stood at approximately $92 million as of September 17, 2026, with a target of $150 million. USDC and tokenized money market funds backed by U.S. Treasuries represented approximately 50% of circulating USDS and DAI, up from 36% in August 2025.
## Fast Moves Create Fast Reversals

A 42.6% rally over 30 days and 26.6% over seven days signals crowded positioning. The October 2 volume spike to $85.8 million and the 9.2% gain in 24 hours as of October 4 indicate momentum buying, not distribution. When a large portion of holders entered at similar price levels over a compressed window, a reversal can unwind as quickly as the rise.
The token now trades 4.1% below its all-time high of $0.100535 from December 4, 2024, per CoinGecko. That proximity to prior peaks means limited upside before sellers who bought at the December high can exit at breakeven. The move from $0.0787 on September 29 to $0.096415 as of October 4 represents a 22.5% gain in five days, a pace that typically attracts profit-taking.
For the move to hold, two conditions must persist: continued institutional adoption of sUSDS as collateral, expanding beyond Galaxy's initial $100 million allocation, and sustained protocol revenue above the late-September spike to $560,800\. If either stalls, the yield narrative weakens and holders who entered for momentum have no fundamental anchor.
What would break it is straightforward. A governance decision to lower the Sky Savings Rate below its current 3.60% APY, a reversal in broader crypto market sentiment similar to the early October drift most coins experienced, or a single large holder exiting into the $85.8 million daily volume. Sky's three main agents, Spark, Grove, and Obex, have borrowed a combined $5.9 billion in USDS and put those funds into yield strategies, paying Sky a base interest rate of 3.8% as of September 2026, per Standard Chartered. If those allocations reprice lower, the revenue that funds both the savings rate and token buybacks compresses.
## What This Does Not Mean for Yield Positioning
A large price move does not imply a large yield move. Sky's savings rate remains 3.60% APY as of September 2026, unchanged despite the 42.6% token rally. The governance-set rate has ranged from 3.60% to approximately 9.0% over the past 12 months, but the recent price action has not triggered a rate adjustment.
Someone holding USDS and earning the Sky Savings Rate through sUSDS earns the same 3.60% APY whether SKY trades at $0.067 or $0.096\. The token price affects governance voting power and staking rewards, which stood at 6.53% APY as of late September 2026 per Sky.money, but does not change the stablecoin yield. A position sized around the savings rate should not resize because the governance token rallied.
The Galaxy Digital partnership approved sUSDS as collateral across a $1.4 billion loan book, a development that matters for anyone using Sky's stablecoin as margin. But the collateral approval came before the majority of the 42.6% move, meaning the market priced in most of the news by early October. Entering a sUSDS position now captures the 3.60% yield but not the price appreciation that already occurred.
Sky's protocol revenue totaled $129.87 million from January 1 to September 15, 2026, according to a CoinGecko study cited by CoinMarketCap, ranking it among the top DeFi revenue generators. That figure reflects protocol performance, not token price performance. The $100 million Galaxy allocation and the 2.86 million token burn both occurred in September, but the revenue data predates the most recent rally stage.
For someone deciding whether to allocate to sUSDS for yield, the question is whether 3.60% APY with Sky's B- credit rating from S&P Global Ratings justifies the smart contract and governance risk, not whether the governance token gained 42.6% in 30 days. The token move is a trailing indicator of sentiment, not a leading indicator of yield opportunity. The savings rate is set by governance, funded by protocol revenue from lending and real-world asset allocations, and can be verified at sky.money before committing capital.
Daily active users hit 90,800 with 1.2 million transactions recorded on September 30, 2026, per KuCoin. A $125,000 spot accumulation in SKY showed ongoing buying pressure at that time. But elevated activity during a rally is typical and does not predict whether activity sustains after the move matures. The revenue drop from $560,800 to $436,210 after September 30 suggests the spike was an outlier, not a new baseline.
The Weekly Yield Report
You have just reviewed a 42.6% move over 30 days driven by a $100 million institutional allocation and a 2.86 million token burn. Those catalysts do not repeat weekly and the yield rate remains governance-set.
Every Thursday: where crypto yield actually is - stablecoins, liquid staking and DeFi lending, with the risk named next to the rate and what changed since last week.
[Get it free every Thursday](#/portal/signup)
Free. No trade calls, no allocations, no hype. Unsubscribe in one click.
### Free Crypto Loans Without Collateral: Why They Don't Exist
URL: https://altcoininvestor.com/free-crypto-loans-without-collateral/
Last updated: 2026-10-04T19:03:05.000Z
## The Short Answer: They Don't Exist

You cannot walk into DeFi and borrow $10,000 in stablecoins without putting up collateral. That mechanism does not exist. Not because the technology isn't ready. Because the structural barriers are insurmountable.
If you default on an unsecured loan in traditional finance, the lender has legal recourse. They know who you are. They can sue you, garnish wages, destroy your credit score. In DeFi, you're a wallet address. If you take out a loan and vanish, the lender has zero recourse and no way to find you.
The closest thing to an uncollateralized loan in crypto is the flash loan. But flash loans are not borrowing in any conventional sense. You must repay the principal and fee within the same transaction block. If you don't, the entire transaction reverts. That makes them useless for anything that needs to persist longer than a few seconds.
Every other lending mechanism in DeFi requires collateral. Not just a little. Most protocols demand you lock up $1.30 to $2.00 for every $1.00 you borrow. That's how they protect lenders from the reality that borrowers in a pseudonymous system can simply disappear.
## Why DeFi Lending Requires Collateral

Three structural problems make unsecured lending impossible in decentralized finance. None of them are solvable without removing the "decentralized" part.
**No legal recourse.** When a borrower defaults in DeFi, there is no recovery mechanism. The lender loses capital. The borrower faces no consequences. In TradFi, defaulting on a loan triggers lawsuits, credit damage, and asset seizure. In DeFi, you just create a new wallet.
**No identity verification.** Loans in DeFi are issued to wallet addresses, not people. A single person can control dozens of wallets. If one defaults, they simply use another. There is no credit history, no KYC, no way to tie wallets to real-world identity without introducing centralized gatekeepers.
**Capital inefficiency.** Overcollateralized loans force users to lock capital that could be deployed elsewhere. A borrower putting up $15,000 in ETH to borrow $10,000 in USDC is paying a massive opportunity cost. But the alternative is that lenders take unhedged exposure to anonymous counterparties with zero recourse. No rational lender accepts that trade.
Aave, Compound, and MakerDAO all require collateral ratios between 130% and 200%. That means depositing $1.50 or more for every $1.00 borrowed. This is not a design choice. It is the only way to make lending work in a trustless system.
Each asset on [major DeFi lending protocols](https://altcoininvestor.com/best-defi-protocols/) has a loan-to-value ratio that determines how much you can borrow. If ETH has a 75% collateral factor, depositing $1,000 of ETH lets you borrow up to $750\. If the value of your collateral drops below the liquidation threshold, the protocol automatically sells your collateral to repay the loan.
## Flash Loans: The Only Real Uncollateralized Option

Flash loans allow you to borrow any amount of capital without collateral. The catch is that you must repay the loan plus a fee within the same transaction block. If you cannot repay by the end of the block, the entire transaction reverts, and the loan never happened.
Aave charges 0.09% per flash loan. Uniswap and dYdX offer similar mechanisms. The borrowed funds exist only within the atomicity of a single transaction. That makes them useful for arbitrage, liquidations, and collateral swaps. It makes them useless for anything that takes longer than one block to execute.
This is not true borrowing. You are not accessing capital for consumption or investment over time. You are executing a programmatic operation that must complete within seconds. If the operation fails, the transaction fails, and no loan is issued.
Flash loan use cases include:
- Arbitrage across decentralized exchanges within the same block
- Liquidating undercollateralized positions for a profit
- Swapping collateral types without closing a loan position
- Refinancing a loan from one protocol to another
All of these operations complete in one transaction. If you need capital for longer than that, flash loans do not solve your problem.
### Flash Loan Risks
Flash loans introduce their own set of risks. Because they enable instant access to enormous amounts of capital, they are frequently used to manipulate oracle prices and exploit protocol vulnerabilities.
Protocols that rely on on-chain oracles for real-time price feeds are especially vulnerable. A flash loan can temporarily distort market conditions within a single block, manipulating the price data that protocols use to calculate collateral values and liquidation thresholds. This has been the attack vector in multiple DeFi exploits.
Smart contract risk remains the greatest threat. If a protocol contains an unpatched vulnerability, an attacker can use a flash loan to drain the liquidity pool. The loan enables the exploit, then repays itself, leaving no capital at risk for the attacker.
## CeFi Credit Lending: Why It Failed
Between 2020 and 2022, centralized crypto lenders like Celsius, BlockFi, and Voyager offered unsecured loans to institutional borrowers. They claimed to have sophisticated underwriting processes. They did not.
Most CeFi lenders determined creditworthiness based on questionnaires, reputation, and social capital. They did not require audited financials. They did not verify counterparty risk. They lent billions of dollars to entities like Three Arrows Capital, which failed to repay a $670 million loan after the Terra collapse.
When Three Arrows defaulted, the entire CeFi lending sector collapsed. Celsius, Voyager, and BlockFi all filed for bankruptcy. Retail depositors lost access to their funds. The lesson was clear: unsecured lending in crypto does not work at scale, even when it is centralized.
As of 2023, fiat or crypto collateral became a standard requirement for most crypto loans. The few CeFi lenders that survived now operate with full KYC, credit checks, and collateral requirements that mirror traditional finance.
## DeFi Lending Market in 2026
The DeFi lending market has consolidated around a few dominant protocols. [Aave holds roughly $40 billion in total value locked](https://defillama.com/protocol/aave), generates $83 million per month in fees, and has secured SOC 2 Type II attestation. It is beginning to appear on institutional approved-counterparty lists.
Morpho Blue has scaled to $11.8 billion in TVL. Compound V3 sits near $2.7 billion. All three protocols require overcollateralization. All three use automated liquidation mechanisms to protect lenders.
Current interest rates as of October 2026:
- Aave borrow APR: 5-10%
- Aave supply APY: 4-8%
- Morpho Blue USDC supply: 4-8%
- Compound III USDC supply: 3-5%
- Liquidation penalty: 5-10%
- Flash loan fee: 0.09%
All of these rates assume you have provided collateral. If you have not, you cannot borrow.
## Undercollateralized Lending: Still Marginal
A few protocols have attempted to offer undercollateralized loans by introducing off-chain identity and legal agreements. TrueFi, Goldfinch, and Maple Finance map on-chain borrowers to real-world entities. They require KYC, credit checks, and legally binding loan agreements.
This solves the recourse problem by removing the decentralized part. If a borrower defaults, the lender can pursue legal action in traditional courts. But this also removes most of the benefits of DeFi. You are back to trusting centralized intermediaries to verify identity and enforce contracts.
As of February 2022, undercollateralized lending protocols held only $1.2 billion in TVL, less than 3% of total DeFi lending volume. The status in 2026 remains marginal. Most users who want unsecured loans simply use traditional finance, where the legal infrastructure already exists.
Other emerging models include:
- Decentralized prime brokerage (Oxygen, DeltaPrime, Gearbox), which retains control over borrowed funds and restricts their use to specific on-platform activities
- Peer-to-peer lending with identity binding, which still requires either collateral or off-chain legal recourse
- Exchange credit lines, which require full KYC, credit checks, and are fully custodial
None of these options deliver the thing people search for when they type "free crypto loans without collateral." What they deliver is a hybrid model that reintroduces elements of traditional finance to make unsecured lending viable.
## What KYC and Regulation Actually Require
If you use a centralized exchange or any platform offering credit-based lending, you will face KYC requirements. The European Union's MiCA framework mandates that crypto-asset service providers implement full KYC and AML processes, including customer identification, document verification, and ongoing transaction monitoring.
Centralized exchanges now require a government photo ID, proof of address, and biometric liveness verification. Higher tiers add source-of-funds documentation and video verification. This is the standard across Coinbase, Binance, Kraken, and every other regulated exchange.
Non-custodial DeFi protocols are not subject to KYC requirements, but they also do not offer unsecured loans. The two facts are related. Without identity verification, unsecured lending does not work. With identity verification, the platform is no longer decentralized.
## What You Can Actually Do
If you want to borrow crypto without locking up significant collateral, you have two options. Neither is DeFi.
**Use a centralized exchange credit line.** Some exchanges offer margin accounts and credit lines to verified users with established trading history. These require full KYC, credit checks, and are fully custodial. You are trusting the exchange with your funds, and the exchange is trusting you with borrowed capital based on traditional creditworthiness metrics.
**Use a hybrid protocol with legal recourse.** Platforms like TrueFi and Goldfinch offer loans with lower collateral requirements by binding borrowers to real-world legal entities. You will need to pass KYC, sign legal agreements, and accept that defaults can result in lawsuits. This is closer to traditional finance than DeFi.
If you are willing to lock up collateral, [DeFi lending protocols](https://altcoininvestor.com/best-defi-protocols/) offer liquid, permissionless borrowing with competitive rates. You deposit ETH, stablecoins, or other approved assets. You borrow against them. If your collateral value drops too far, the protocol liquidates your position to protect lenders.
That is not free. That is not uncollateralized. But it is the only model that works at scale in a decentralized system.
## The Takeaway
Uncollateralized crypto loans do not exist in DeFi because the core mechanism depends on legal recourse and identity verification. If you remove those, you remove the lender's ability to recover funds from defaulting borrowers. Flash loans are the only genuinely collateral-free option, but they repay within one transaction block and are useless for conventional borrowing. CeFi lenders tried offering unsecured loans between 2020 and 2022, and the entire sector collapsed when counterparties defaulted. The few platforms offering lower-collateral loans today do so by reintroducing KYC, legal agreements, and centralized enforcement. If you want to borrow crypto, you will either lock up 130-200% collateral in DeFi or submit to traditional creditworthiness checks in CeFi. The free, uncollateralized loan you are searching for does not exist, and the structural reasons why are not going away.
## Frequently Asked Questions
### Can I get a crypto loan without putting up collateral?
No, not in DeFi. All major decentralized lending protocols require overcollateralization, typically 130-200% of the borrowed amount. Flash loans are the only uncollateralized option, but they must be repaid within the same transaction block, making them useless for conventional borrowing. Centralized platforms that offered unsecured loans between 2020-2022 collapsed after widespread defaults. If you want to borrow crypto, you will either lock up significant collateral or submit to traditional KYC and creditworthiness checks on centralized platforms.
### What are flash loans and how do they work?
Flash loans let you borrow any amount of crypto without collateral, but you must repay the loan plus a fee within the same transaction block. If you cannot repay before the block ends, the entire transaction reverts and the loan never happened. Aave charges 0.09% per flash loan. These are used for arbitrage, liquidations, and collateral swaps that execute in seconds. They are not borrowing in the conventional sense. You cannot use flash loan funds for anything that takes longer than one block to complete.
### Why did Celsius and BlockFi collapse?
CeFi lenders like Celsius, BlockFi, and Voyager offered unsecured loans to institutional borrowers based on weak underwriting. They did not require audited financials or verify counterparty risk. When Three Arrows Capital defaulted on a $670 million loan after Terra's collapse in 2022, it triggered cascading failures across the entire CeFi lending sector. Celsius, Voyager, and BlockFi all filed for bankruptcy. Retail depositors lost access to their funds. The lesson was that unsecured lending does not work in crypto, even when centralized.
### How much collateral do I need to borrow on Aave or Compound?
You typically need to deposit $1.30 to $2.00 in collateral for every $1.00 you borrow on major DeFi lending protocols. Each asset has a loan-to-value ratio. For example, if ETH has a 75% collateral factor, depositing $1,000 of ETH lets you borrow up to $750 in stablecoins. If the value of your collateral drops below the liquidation threshold, the protocol automatically sells your collateral to repay the loan. This overcollateralization protects lenders from defaults in a system where borrowers have no legal identity.
### Are there any legitimate undercollateralized lending options?
A few protocols like TrueFi, Goldfinch, and Maple Finance offer loans with lower collateral requirements by introducing off-chain identity and legal agreements. They require full KYC, credit checks, and legally binding contracts that allow lenders to pursue defaults in traditional courts. This removes the decentralized element of DeFi. As of 2022, these protocols held only $1.2 billion in TVL, less than 3% of total DeFi lending volume. The 2026 status remains marginal. Most users seeking unsecured loans simply use traditional finance where legal infrastructure already exists.
The Weekly Yield Report
You just learned why uncollateralized crypto loans collapsed in 2022 and why DeFi demands 130-200% collateral ratios. Those structural barriers are permanent.
Every Thursday: where crypto yield actually is - stablecoins, liquid staking and DeFi lending, with the risk named next to the rate and what changed since last week.
[Get it free every Thursday](#/portal/signup)
Free. No trade calls, no allocations, no hype. Unsubscribe in one click.
### Crypto Wallet Security For Active Yield Positions
URL: https://altcoininvestor.com/crypto-wallet-security-active-yield-positions/
Last updated: 2026-10-04T17:04:03.000Z
## What You Need Before Starting
This guide assumes you manage DeFi yield positions across multiple protocols and need operational security that balances capital protection against transaction speed. You need at least two wallets, a hardware device for signing, and a clear understanding of what constitutes acceptable hot wallet exposure for your portfolio size.
Prerequisites: active yield positions across two or more protocols, capital allocation above $10,000, and willingness to add 2-5 minutes of verification time per transaction. If you hold exclusively on exchanges, this workflow does not apply yet.
The income mechanism at stake: wallet security failures cause direct capital loss through phishing attacks, compromised seed phrases, or malicious contract approvals. Proper security hygiene prevents loss while maintaining transaction speed for rate-sensitive position changes. In 2025, phishing alone caused $722.9 million in losses across 248 incidents. Supply-chain attacks caused $1.45 billion across two incidents. These are not edge cases.
## Step 1: Set Your Hot Wallet Exposure Ceiling

The first structural decision is allocation split. Hardware wallets secure 80% or more of long-term capital. Software wallets allocate 15-20% for active DeFi deployment. Exchange balances maintain 5% or less for immediate liquidity.
For a $100,000 portfolio actively deployed in DeFi, the breakdown looks like this: $80,000 in cold storage earning 5-8% annually with less than 0.1% security risk, $15,000 in hot wallet earning 12-25% with 2-3% security risk, and $5,000 on exchanges for immediate rebalancing.
The hot wallet ceiling is the maximum amount you are comfortable losing in a single phishing event or seed phrase compromise. For most individual allocators, that ceiling sits between $50,000 and $100,000\. Above that threshold, the operational security friction of hardware signing and multisig workflows becomes worth the effort.
Set the ceiling based on loss tolerance, not portfolio percentage. If losing $20,000 would materially affect your financial position, your hot wallet ceiling is $20,000 regardless of whether your total portfolio is $100,000 or $500,000.
Common failure mode: allocators set percentage-based rules and fail to adjust as portfolio size grows. A 20% hot wallet allocation makes sense at $50,000 total capital. At $500,000, it puts $100,000 at elevated risk for convenience yield farming. Absolute dollar ceilings scale better than percentage rules.
## Step 2: Acquire and Verify Hardware Wallet

Hardware wallets start around $50 and provide meaningful security upgrade regardless of portfolio size. The safest models use CC EAL6+ certified Secure Element chips, tested against physical extraction, side-channel attacks, and fault injection.
Top-rated hardware wallets in 2026 include Trezor Safe 7, [Ledger Flex](https://altcoininvestor.com/ledger-backdoor/), Coldcard Q, BitBox02, and OneKey Pro. Pricing for the most common models: Ledger Nano S Plus costs $79, Ledger Nano X costs $149, Trezor Model One costs $69, and Trezor Model T costs $219.
Purchase exclusively from manufacturer websites. Never buy from third-party retailers including Amazon or eBay. Counterfeit hardware wallets pre-loaded with malware represent a documented supply-chain attack vector. Verify device authenticity using tamper-evident packaging when it arrives.
Security architecture differences matter. Ledger uses a single-chip Secure Element design that stores private keys, runs the custom OS, reads transaction data, generates the device screen display, and signs all in one protected environment. Trezor uses a multi-processor flow where the main processor parses the transaction and the Secure Element signs. Both are EAL6+ certified but represent different threat models.
After unboxing, complete these verification steps before transferring funds:
1. Update firmware to the latest version (security patches release regularly; delay beyond 30 days exposes you to known vulnerabilities)
2. Generate seed phrase on the device itself, never using computer-generated entropy
3. Write seed phrase on paper or metal backup, never digitally
4. Test recovery process by wiping device and restoring from seed phrase
5. Enable passphrase feature for additional security layer beyond the 12 or 24-word seed
The test recovery process is not optional. You need confirmation that your backup works before the device holds meaningful capital. Hardware failure or user error during seed phrase recording has caused unrecoverable loss.
## Step 3: Structure Multi-Wallet Architecture
A two-wallet strategy separates security risk from operational speed. Cold storage (hardware wallet) holds long-term positions and infrequently rebalanced capital. Hot wallet (software wallet like MetaMask or Rabby) holds actively managed yield positions requiring frequent rebalancing.
For allocators managing $200,000 to $800,000 across 8-12 yield positions, a three-wallet architecture provides better risk isolation:
1. Cold storage hardware wallet: 70-80% of capital in staking positions or long-term LP positions rebalanced quarterly or less
2. Warm wallet (hardware-backed MetaMask): 15-25% of capital in yield positions requiring weekly to monthly rebalancing
3. Hot wallet (pure software): 5-10% of capital in high-frequency arbitrage or rate-sensitive positions requiring daily interaction
The warm wallet configuration connects a hardware device to MetaMask. When you interact with DeFi protocols through the browser extension, every transaction requires physical device approval. This combines DeFi convenience with hardware security. You can access Uniswap, Aave, and OpenSea through the standard web interface while keeping private keys on the Secure Element chip.
For institutional allocators or individuals managing above $1 million, multisig wallets replace single-signature hardware wallets for cold storage. Safe multisig wallet creation costs between 0.02 and 0.05 ETH on mainnet. A 2-of-3 or 3-of-5 configuration distributes signing authority and eliminates single points of failure.
Advanced allocators add timelocks to cold storage withdrawals. Even if a hardware wallet is compromised, attackers cannot withdraw funds immediately. A 72-hour timelock window provides time to detect unauthorized attempts, execute emergency multisig override, and move funds to a new address. This architectural layer prevents hot wallet compromise from cascading to main holdings without requiring manual intervention for every transaction.
## Step 4: Verify Every Contract Interaction
The 2025 Bybit blind-signing exploit demonstrated the failure mode hardware wallets are supposed to prevent. The attacker presented a malicious transaction that appeared legitimate on the computer screen. The hardware wallet displayed only the transaction hash without human-readable details. The user approved based on what they saw in the browser, not what the device showed. The contract drained the wallet.
Clear-signing support is now a minimum security control. Your hardware wallet must display human-readable transaction details on its trusted screen before you approve. If the device shows only a hash or "Contract Interaction" without specifics, reject the transaction.
Before approving any DeFi interaction, verify these five fields:
1. Contract address: matches the protocol you intend to interact with (check against blockchain explorer, not the website URL)
2. Function being called: "approve", "deposit", "swap", "withdraw" should match your intended action
3. Token amounts: exact quantities being transferred or approved
4. Approval limits: if granting token approval, verify it is not unlimited (unlimited approvals persist indefinitely and grant future access)
5. Recipient address: for withdrawals or transfers, verify the destination address character by character
The verification happens on the hardware wallet screen, not your computer. Malware can compromise what you see in the browser. It cannot compromise the Secure Element display. If details on the device screen do not match your intended transaction, reject and investigate.
Smart contract verification means the source code is published and build metadata matches on-chain deployment. In 2026, this is a minimum security control because attackers actively hunt for unverified contracts. Before interacting with any protocol, check the contract verification status on the blockchain explorer. Unverified contracts obscure what the code actually does and slow defenders when exploits occur.
Common failure mode: users verify the domain name (app.protocol.fi) but not the contract address. Phishing sites use legitimate-looking domains with malicious contract addresses. The domain means nothing. The contract address is what executes.
## Step 5: Manage Token Approvals Aggressively
Every DeFi interaction may grant protocols unlimited access to your tokens. These approvals persist indefinitely unless explicitly revoked. A single malicious transaction months after the initial approval can drain holdings.
When you approve a protocol to spend your USDC, you choose between limited approval (exact amount for this transaction) and unlimited approval (any amount, any time, until revoked). Unlimited approvals reduce transaction friction for protocols you use frequently. They also create permanent attack surface.
Recommended approval hygiene for active yield allocators:
1. Grant limited approvals (exact amounts) for protocols used once or infrequently
2. Grant unlimited approvals only for protocols with multi-year track records that you interact with weekly
3. Revoke all approvals quarterly using Revoke.cash or Etherscan's token approval interface
4. After revoking, re-approve only protocols you are actively using that month
Approval accumulation is invisible until it is exploited. Allocators who farmed yield across 15 protocols in 2023 and 2024 may have 40+ active approvals they no longer monitor. Each represents a potential drainage vector if the protocol is compromised or if the user is phished into signing a malicious transaction.
The friction cost of limited approvals is one additional transaction per DeFi interaction (approve, then deposit). At current gas prices, this costs $3-8 extra per operation. For a $50,000 position earning 15% APY, the annual return is $7,500\. The approval friction for 12 rebalancing operations across the year costs $36-96\. The security benefit is elimination of persistent unlimited access.
## Step 6: Detect and Reject Phishing Attempts
Most DeFi losses begin with bad links, fake apps, or compromised devices long before smart contract exploits. Phishing in 2025 caused $722.9 million in losses. The attack vector is a malicious website that mimics a legitimate protocol and prompts you to approve a contract that drains your wallet.
Phishing detection checklist before connecting wallet to any dApp:
1. Verify the domain character by character (attackers use "app.unisawp.com" instead of "app.uniswap.org")
2. Check SSL certificate (click the padlock icon in browser; verify certificate issuer)
3. Bookmark legitimate protocol URLs after verifying on official Twitter or documentation
4. Access bookmarked URLs directly, never through search results or Discord links
5. Review "Connected Sites" in MetaMask monthly and disconnect protocols you no longer use
Common phishing techniques in 2026 include Google Ads that place fake protocol sites above legitimate results, compromised Discord servers posting malicious links, and airdrop scams that ask you to "claim tokens" by approving a contract that drains your wallet instead.
If a dApp asks you to approve a contract you do not recognize, or if the approval request appears without you initiating an action, reject immediately and disconnect. Legitimate protocols do not request approvals unprompted.
Hardware wallet integration provides a verification layer here. Even if you click a phishing link and attempt to approve a malicious contract, the hardware wallet displays the actual contract address and function being called. If those details do not match your intended action, the device catches what the browser missed.
## Step 7: Review Transaction Simulation Before Signing
Transaction simulation shows what will happen if you approve a transaction before you actually sign it. Tools like Tenderly, Fire, or MetaMask's built-in simulation run the transaction against current blockchain state and display the outcome (tokens transferred, balances after execution, contract state changes).
For complex DeFi interactions involving multiple contract calls, simulation catches errors that manual review misses. If you intend to deposit 10 ETH into a liquidity pool and the simulation shows 10 ETH leaving your wallet with no LP tokens received, the transaction is malformed or malicious.
Simulation also estimates gas costs. For yield positions where rebalancing costs need to stay below 0.5% of position size, pre-simulating transactions prevents approving operations that would cost more than they return. A $5,000 yield position rebalanced monthly can afford $25 in gas per operation. If simulation shows $60 gas requirement, delay until network congestion drops.
The failure mode simulation prevents: you approve a transaction that technically executes as written but does not do what you intended. The contract does not steal your funds. It simply sends them to the wrong pool, or approves the wrong token, or sets parameters you did not intend. Simulation surfaces this before the transaction is irreversible.
## Common Failure Modes and How to Avoid Them
Bridge risk in multi-chain yield: when you bridge assets from Ethereum to Arbitrum or Polygon, the bridged tokens are synthetic representations. The bridge contract holds your native tokens and mints wrapped versions on the destination chain. Bridges represent the highest-loss attack surface in DeFi, with over $40 billion in documented bridge hacks. Mitigation: prefer protocols that operate natively on a single chain or use MPC-based chain signatures instead of lock-and-mint bridges.
Firmware update exploitation: attackers compromise devices during the firmware update process when the Secure Element temporarily accepts unsigned code. Mitigation: update firmware only when the device is fully wiped and contains no funds, or use manufacturers that support signed firmware with hardware-enforced verification.
Multisig signing review window inadequacy: in a 3-of-5 multisig, if all five signers are on the same team and approve transactions in a 15-minute window, the multisig provides no defense against coordinated internal attack. Mitigation: distribute signing authority across parties with conflicting incentives (protocol team + investors + community representatives) and enforce minimum signing windows of 24-48 hours.
MetaMask session persistence: every time you connect MetaMask to a dApp, that site gains the ability to prompt transaction requests until you manually disconnect. If you connect to a protocol, complete your transaction, and leave the site open in a background tab, a compromised ad network or script injection can prompt malicious transactions hours later. Mitigation: disconnect wallet from sites immediately after completing transactions, or use browser extensions that auto-disconnect after 15 minutes of inactivity.
## What to Do Next
If you currently manage yield positions exclusively through software wallets, your immediate next step is acquiring a [hardware wallet](https://altcoininvestor.com/best-crypto-hardware-wallets/) and moving long-term holdings (positions you rebalance less than monthly) to cold storage. This takes 45 minutes and immediately removes 70-80% of your capital from daily phishing risk.
If you already use a hardware wallet for long-term holdings but sign DeFi transactions through pure software wallets, configure hardware-backed MetaMask for your yield positions above $10,000\. The workflow adds 2-5 minutes per transaction but eliminates blind-signing risk.
If you manage above $500,000 in DeFi positions, evaluate multisig architecture. A Safe multisig with 2-of-3 or 3-of-5 configuration plus 72-hour timelocks on withdrawals provides institutional-grade security while maintaining operational flexibility for [active yield positions](https://altcoininvestor.com/track-defi-yield-positions-efficiently/).
Operational security checklist to implement this week:
1. Audit current token approvals using Revoke.cash and revoke everything not actively used this month
2. Review MetaMask connected sites and disconnect protocols you have not used in 30 days
3. Set calendar reminder to repeat approval audit quarterly
4. Bookmark legitimate protocol URLs for every DeFi position you hold
5. Enable hardware 2FA (YubiKey or similar) on exchange accounts and email
For allocators managing 8-12 positions across multiple chains, the security architecture described here adds approximately 20-30 minutes of overhead per week (transaction verification, approval management, wallet connection review). The alternative is exposure to phishing attacks that caused $722.9 million in losses in 2025 alone.
The mechanism is: security practices prevent capital loss from wallet compromise while maintaining transaction speed for rate-sensitive rebalancing. The failure mode is: inadequate verification workflow or excessive hot wallet exposure allows phishing attacks or malicious approvals to drain positions faster than you can react. The specific stress condition is: one successful phishing event or compromised seed phrase when your entire portfolio sits in a software wallet with unlimited approvals across 15 protocols.
## The Takeaway
Wallet security for active yield positions is not about eliminating risk. It is about isolating risk to the minimum capital required for operational speed. Hardware wallets secure 80% of holdings. Software wallets manage the 15-20% requiring daily interaction. Clear-signing verification prevents blind approvals. Aggressive approval management limits persistent attack surface.
The verification workflow (contract address check, function confirmation, amount verification, approval limit review) takes 90 seconds per transaction. The alternative is trusting that every dApp you interact with, every link you click, and every approval you grant will remain non-malicious indefinitely. In 2025, $722.9 million in losses proved that trust model does not work.
Set your hot wallet ceiling based on absolute loss tolerance. Verify every contract interaction on the hardware device screen. Revoke approvals quarterly. Bookmark legitimate protocol URLs. The friction is 20 minutes weekly. The prevented loss is your entire actively managed yield position.
## Frequently Asked Questions
### What is the recommended hot wallet limit for active DeFi positions?
Set your hot wallet ceiling based on absolute loss tolerance, not portfolio percentage. For most individual allocators managing yield positions, $50,000 to $100,000 represents the practical threshold where hardware signing friction becomes worthwhile. Below $10,000, pure software wallets with aggressive approval management provide acceptable risk-return tradeoff. Above $100,000, hardware-backed signing or multisig architecture becomes necessary. The ceiling is the maximum amount you are comfortable losing in a single phishing event.
### How much time does hardware wallet signing add to DeFi transactions?
Hardware wallet verification adds 2-5 minutes per transaction for contract interaction review and physical device approval. For allocators managing 8-12 yield positions with weekly to monthly rebalancing, total overhead is 20-30 minutes per week. This includes contract address verification, function confirmation, amount review, and approval limit checking. Multisig workflows add 15-30 minutes due to multiple signer coordination. For rate-sensitive positions requiring immediate execution, maintain a small hot wallet allocation for speed-critical operations.
### What is the difference between limited and unlimited token approvals?
Limited approvals grant a protocol access to exact token amounts for a single transaction. Unlimited approvals grant permanent access to your entire token balance until explicitly revoked. Limited approvals require two transactions per DeFi interaction (approve then deposit) costing $3-8 extra in gas. Unlimited approvals reduce friction for frequently used protocols but create persistent attack surface. If a protocol is compromised or you are phished months after the initial approval, unlimited access allows drainage without additional signing. Revoke unused approvals quarterly.
### How do I verify a smart contract before approving a transaction?
Check five fields on your hardware wallet screen before approval: contract address matches the intended protocol verified on blockchain explorer, function name matches your action like deposit or swap, token amounts are exact quantities you intend to transfer, approval limits are not unlimited unless deliberately chosen, and recipient address is correct character by character. Never verify transaction details only in your browser as malware can compromise the display. Smart contract verification status on blockchain explorers confirms source code is published. Unverified contracts are red flags in 2026.
### What architecture should I use for managing over $500,000 in DeFi positions?
Above $500,000, implement three-tier architecture: cold storage multisig wallet (70-80% of capital) using Safe with 2-of-3 or 3-of-5 configuration plus 72-hour timelocks on withdrawals, warm wallet (15-25% of capital) using hardware-backed MetaMask for weekly to monthly rebalancing, and hot wallet (5-10% of capital) for daily high-frequency operations. Multisig creation costs 0.02-0.05 ETH on mainnet. Distribute signing authority across parties with conflicting incentives and enforce minimum 24-48 hour signing windows to prevent coordinated internal attacks.
Tool mentioned above
Ledger
Ledger devices display the full transaction on their own screen before you approve it, which is what stops an approval exploit at the point it matters.
[See Ledger devices](https://shop.ledger.com/?r=90612ff43561)
We may earn a commission if you sign up through this link, at no cost to you. It does not change what gets recommended.
The Weekly Yield Report
You just mapped hot wallet limits, hardware signing workflows, and verification steps that prevented $722.9 million in phishing losses in 2025\. Those attack vectors evolve weekly.
Every Thursday: where crypto yield actually is - stablecoins, liquid staking and DeFi lending, with the risk named next to the rate and what changed since last week.
[Get it free every Thursday](#/portal/signup)
Free. No trade calls, no allocations, no hype. Unsubscribe in one click.
### How Airdrop Sybil Detection Works: On-Chain Patterns Projects Flag
URL: https://altcoininvestor.com/how-airdrops-detect-sybil-wallets/
Last updated: 2026-10-04T16:04:55.000Z
## The Question Farmers Ask

How do airdrops detect sybil wallets? The question matters because the answer determines whether a multi-wallet farming operation nets 50x the allocation or gets fully disqualified with months of gas costs wiped.
Projects including LayerZero, Arbitrum, and Hop Protocol have disqualified hundreds of thousands of addresses. LayerZero alone flagged 803,093 wallets in June 2024, representing 38% of the initial snapshot. Arbitrum filtered 625,000 addresses from a 2.3 million wallet pool. Hop Protocol identified 10,253 sybil addresses out of 43,058 eligible wallets.
The detection methods are not speculative. They are reverse-engineered from publicly released disqualification data, GitHub repositories, and analytics vendor case studies.
## What Projects Actually Detect
Sybil detection operates on four primary signals visible in on-chain transaction data.
First: funding graphs. On-chain analytics tools trace the origin of gas funds for every wallet. If 50 wallets were all funded from a single centralized exchange withdrawal or a single seed wallet within 30 days, they form a detectable cluster in the transaction graph. Projects filter entire clusters regardless of individual wallet behavior downstream.
Second: transaction sequence matching. Wallets that interact with the same protocols in the same order, especially within tight time windows, trigger algorithmic flags. If 100 wallets bridge $500 USDC to Arbitrum, swap for ETH on Uniswap, deposit into GMX, and mint an NFT on the same day, the sequence similarity score exceeds thresholds used by clustering algorithms.
Third: temporal clustering. Sybil clusters show transaction timing patterns inconsistent with organic behavior. Wallets transacting within seconds of each other, batch claim transactions, or identical daily activity windows get flagged. Arbitrum deducted points if all transactions occurred within a 48-hour window.
Fourth: cross-chain behavioral fingerprints. A sophisticated operator might separate wallets on Ethereum mainnet but reuse the same interaction patterns on Avalanche or Polygon. Analytics vendors trace these patterns across chains. One Hop Protocol cluster was identified because the operator overlapped a few transactions both on Ethereum mainnet and Avalanche, connecting otherwise isolated address sets.
## How LayerZero Filtered 803,000 Addresses

LayerZero's June 2024 ZRO airdrop provides the most detailed public case study of sybil detection methodology.
The initial eligible snapshot included approximately 2.1 million wallets. The final count of flagged addresses reached 2.05 million when including self-reported sybils, with 803,093 ultimately excluded as confirmed sybil clusters.
Detection combined internal analysis with a public bounty program. Bounty hunters built a graph of all addresses that had used LayerZero, identified all gas funding sources, then walked up the funding tree to find hub addresses that had funded many downstream wallets. Wallets that shared a funding hub within two hops and had interaction sequence similarity above a threshold were submitted as clusters.
CEO Bryan Pellegrino posted publicly that LayerZero was working with Nansen on clustering analysis. Nansen's MEDIA algorithm combines machine learning clustering with on-chain identity signals aggregated into a TrustScore metric.
LayerZero also opened a self-reporting window. Wallets could declare themselves as sybil and receive 15% of their eligible allocation instead of 0%. Approximately 1.3 million wallets self-reported and received the reduced allocation. The mechanism reduced enforcement costs while recovering allocation that would otherwise go to disqualified addresses.
The interesting variable is that timing mattered more than transaction value. Operators who funded wallets from the same source within 30 days, even if those wallets later transacted through different bridges with varying amounts, were clustered and flagged.
## Arbitrum's Louvain Clustering and IP Correlation
Arbitrum's March 2023 ARB airdrop used community detection algorithms to partition the transaction graph into densely connected subgraphs.
Out of approximately 2.3 million wallets that had bridged to Arbitrum One before February 6, 2023, only 625,143 wallets scored more than 3 cumulative points and qualified for the airdrop. The filtering rate approached 28% of the initial set.
Arbitrum applied the Louvain method, a modularity optimization algorithm that partitions graphs into communities with high internal edge density and low external edge cuts. Large and medium-sized sybil groups were identified and removed from the airdrop list using this method.
The Arbitrum Foundation also applied specific heuristics. If all transactions of an address occurred within 48 hours, 1 point was deducted. If the wallet balance was less than 0.005 ETH and the wallet had not interacted with more than one smart contract, 1 point was deducted. If the wallet address was identified as a sybil during the Hop Protocol bounty program, the address was fully disqualified.
Projects also correlate wallet addresses with IP addresses logged by dApp frontends, centralized bridges, and RPC providers. If 200 wallets connected from the same IP or the same /24 subnet, they cluster as one operator. Arbitrum used this method to filter addresses despite those addresses having no direct on-chain linkage.
Data scientists excluded hot addresses such as centralized exchange wallets and cross-chain bridges to reduce false positives. They also avoided flagging small groups of addresses with fewer than 20 externally owned accounts when running the detection algorithm.
## Hop Protocol: Sequential Transfer Chains and Radial Funding
Hop Protocol distributed 8% of its supply to early users, each required to have at least $1,000 in transfers and two on-chain interactions. Of 43,058 initially eligible wallets, the team identified 10,253 as sybil addresses, a 24% disqualification rate.
Within each cluster, sequential transfer chains and radial, star-shaped funding patterns were extracted to peel away bot networks from genuine users. Sequential transfer chains, also called daisy chains, occur when tokens hop from one sybil account to the next in a chain, leaving a clear domino effect of funds traceable back to a single source.
Radial funding patterns show a hub address distributing gas or tokens to many spoke addresses in a star topology. Both patterns are detectable through graph traversal algorithms applied to the transaction history.
Hop Protocol reports were generated primarily using scripts that scraped Ethereum and Avalanche mainnet across all eligible addresses. Scripts searched for multiple eligible addresses clustered around each other by tracing shared on-chain transfer history. The detection code is available in the Hop Protocol [GitHub repository](https://github.com/hop-protocol/hop-airdrop), providing a rare public view of detection logic.
## Detection Algorithm Types Projects Use
Projects deploy several categories of clustering algorithms depending on data structure and cluster density.
The Louvain method, used by Arbitrum, optimizes for modularity in large graphs. It iteratively groups nodes into communities that maximize internal connections relative to external ones. The method is fast enough to run on multi-million node graphs.
DBSCAN and OPTICS are density-based clustering methods used by Hop Protocol and other projects. These algorithms identify clusters as regions of high point density separated by regions of low density. They do not require predefining the number of clusters and can identify noise points that do not belong to any cluster.
TrustLabs and Nansen use hybrid approaches combining graph partitioning with temporal feature extraction. The method constructs a two-layer deep transaction subgraph for each address, then extracts key event operation features according to the lifecycle of sybil addresses, including the time of first transaction, first gas acquisition, participation in airdrop activities, and last transaction. These temporal features capture the consistency of sybil address behavior operations.
One thing worth noting: these algorithms are not binary classifiers. They assign cluster membership probabilities or anomaly scores. Projects set thresholds based on acceptable false positive rates, and those thresholds vary.
## What Gets Missed and What Gets Caught
Detection coverage is uneven. Projects have publicly acknowledged gaps in their filtering logic.
Rules failed to stop sybils with fewer than 20 addresses. Small-scale farming operations often pass undetected because detection algorithms avoid flagging small clusters to reduce false positives. A farmer running 10 wallets with good operational security has a materially different risk profile than one running 500.
Sybils that make deposits and withdrawals using cross-chain bridges, exchanges, and smart contracts as intermediaries can break direct funding graph linkages. If an operator funds Wallet A from a centralized exchange, transfers tokens from Wallet A to a DeFi protocol, then withdraws from that protocol to Wallet B, the on-chain funding graph shows the protocol as the intermediate source, not Wallet A.
Operators with NFT holdings or fund collection activities after the snapshot introduce behavioral noise that reduces sequence similarity scores. Projects typically snapshot eligibility at a point in time but analyze behavioral patterns over a longer historical window. Post-snapshot diversification does not erase pre-snapshot clustering.
What consistently gets caught: wallets with detectable batch operation behavior on different chains. Even if wallets are not directly linked on-chain, addresses that exhibit the same behaviors across multiple chains trigger cross-chain fingerprinting. This pattern held across LayerZero, Arbitrum, and Hop disqualifications.
## The False Positive Problem
Aggressive filtering creates collateral damage. Projects balance enforcement against user trust.
Arbitrum's data scientists excluded hot addresses such as centralized exchange wallets and cross-chain bridges and avoided flagging small groups with fewer than 20 addresses. These steps reduced false positives but also reduced detection coverage.
Shared funding sources are common in legitimate use cases. A user might fund multiple wallets from the same centralized exchange account for security compartmentalization, testing, or privacy. A family might share a single exchange account. A trader might operate separate wallets for different strategies, all funded from the same source.
Projects mitigate this risk by requiring multiple correlated signals, not just shared funding. Arbitrum required a combination of funding linkage, community detection cluster membership, and behavioral heuristics before disqualifying an address. Hop Protocol required both funding graph proximity and interaction sequence similarity.
The cost of false positives is reputational. The cost of false negatives is diluted allocation to legitimate users. Projects optimize for precision over recall, meaning they prefer to miss some sybils rather than incorrectly flag legitimate users.
## Quantitative Comparison Across Projects
Four major airdrops from 2023-2024 provide comparable disqualification data.
LayerZero started with approximately 2.1 million wallets, disqualified 803,000, and filtered 38% of addresses. Primary methods included funding graph analysis, sequence matching, and a self-report mechanism at 15% allocation.
Arbitrum started with approximately 2.3 million wallets, qualified 625,000, and filtered roughly 28% of the initial set. Primary methods included Louvain clustering and IP correlation alongside behavioral heuristics.
Hop Protocol started with 43,000 wallets, disqualified 10,300, and filtered 24% of addresses. Primary methods included DBSCAN clustering and transfer pattern analysis via graph traversal scripts.
zkSync Era disqualified 60% of eligible addresses, the highest filtering rate among major airdrops. Methodology details were not publicly disclosed, but the rate suggests aggressive detection thresholds or a higher baseline sybil density in the initial set.
The data shows that disqualification rates range from 24% to 60% depending on protocol, detection methodology, and baseline sybil prevalence. [Multi-wallet strategies](https://altcoininvestor.com/how-many-wallets-for-airdrops/) face material disqualification risk when funding and behavior are not properly compartmentalized.
## Detection Vendors and Commercial Tooling
Projects rarely build detection infrastructure internally. They contract with on-chain analytics vendors.
Nansen served LayerZero, zkSync Era, Starknet, Blast, and dozens more. Their MEDIA algorithm combines machine learning clustering with on-chain identity signals aggregated into a TrustScore. The TrustScore incorporates wallet age, transaction diversity, protocol interactions, and token holdings into a composite metric.
According to Nansen's published research, their [distribution model for Arbitrum](https://www.nansen.ai/research/an-on-chain-distribution-model-for-the-arbitrum-community) used community detection algorithms to partition the address graph and identify sybil clusters. The model was calibrated to balance allocation fairness against enforcement cost.
TrustLabs provides sybil detection services with a focus on asset transfer graph analysis. Their method partitions graphs into connected components, then applies community detection algorithms to break down large components into densely connected subcommunities with few edge cuts.
These vendors charge per-address analysis fees or fixed engagement costs. For a 2 million wallet airdrop, detection costs can exceed $100,000 depending on analysis depth and iteration rounds.
## What To Watch If You Are Farming
The detection landscape is not static. Vendor algorithms improve with each airdrop cycle as they ingest more labeled training data from past disqualifications.
Funding graph linkage within 30 days remains the highest-signal indicator. If you fund multiple wallets from the same centralized exchange account, withdrawal address, or on-chain source within a month, those wallets are clusterable regardless of downstream behavior.
Transaction timing consistency is the second-highest signal. If you interact with protocols at the same time each day, in the same sequence, across multiple wallets, temporal clustering algorithms will flag the pattern.
Cross-chain behavioral fingerprints are increasingly detectable. Vendors now trace interaction patterns across Ethereum, Arbitrum, Optimism, Polygon, Avalanche, and other chains. A wallet that looks isolated on one chain but replicates behavior from another chain gets flagged.
IP correlation is table stakes. If you connect multiple wallets to the same dApp frontend, RPC endpoint, or bridge interface from the same IP or subnet, projects log and cluster those addresses. The correlation happens off-chain but informs on-chain disqualification.
The income mechanism here is direct. [Airdrop farming](https://altcoininvestor.com/how-to-earn-crypto-airdrops/) costs gas, time, and often protocol fees. A single-wallet farmer might net $500 to $3,000 per airdrop depending on allocation tiers. A 10-wallet operation could theoretically 10x that, but only if those wallets pass detection. If the cluster gets flagged, all wallets are disqualified and months of gas costs are wiped. The difference between passing and failing detection is often the difference between profit and total loss.
## When Detection Does Not Matter
Not all airdrops deploy sophisticated detection. Smaller projects with limited budgets or technical resources often use simpler snapshot-and-distribute models with minimal filtering.
Projects that gate eligibility by NFT ownership, token holdings, or on-chain attestations reduce the sybil incentive. If eligibility requires holding a $5,000 NFT, the capital requirement exceeds the expected airdrop value for most farmers.
Airdrops with points-based systems that reward long-term, diverse activity over raw transaction count also reduce sybil prevalence. If allocation scales with unique protocol interactions, transaction diversity, and wallet age rather than volume alone, the farming ROI drops and detection becomes less critical.
The pattern historically is that high-value airdrops (allocations exceeding $1,000 per wallet) deploy vendor-grade detection. Low-value airdrops (allocations under $200 per wallet) often do not. The detection investment scales with the value at stake.
## The Takeaway
Sybil detection in airdrops operates on four primary signals: funding graph linkage, transaction sequence similarity, temporal clustering, and cross-chain behavioral fingerprints. Projects including LayerZero, Arbitrum, and Hop Protocol have disqualified between 24% and 60% of initial eligible addresses using these methods. Detection algorithms are not speculative. They are reverse-engineered from publicly released disqualification data and vendor case studies. Funding graph linkage within 30 days remains the highest-signal indicator. Transaction timing consistency is the second. Multi-wallet farming operations face material disqualification risk when funding and behavior are not properly compartmentalized, and the difference between passing and failing detection is often the difference between profit and total loss.
## Frequently Asked Questions
### What percentage of airdrop wallets typically get disqualified for sybil behavior?
Disqualification rates range from 24% to 60% depending on the project and detection methodology. LayerZero disqualified 38% of wallets (803,000 out of 2.1 million), Arbitrum filtered approximately 28% of addresses, Hop Protocol flagged 24% of eligible wallets, and zkSync Era disqualified 60% of addresses. The rate depends on baseline sybil prevalence, detection algorithm sensitivity, and enforcement thresholds set by each project.
### Can airdrops detect sybil wallets if they are funded from different exchanges?
Funding from different exchanges reduces but does not eliminate detection risk. Projects analyze multiple signals beyond funding sources, including transaction sequence similarity, temporal clustering, and cross-chain behavioral fingerprints. If wallets interact with the same protocols in the same order within similar time windows, clustering algorithms flag the pattern regardless of funding diversity. The most sophisticated operators are caught via behavioral consistency, not just funding graph analysis.
### Do small-scale multi-wallet farmers get detected less often than large operations?
Yes. Detection algorithms often exclude clusters with fewer than 20 addresses to reduce false positives. Arbitrum's data scientists avoided flagging small groups during their 2023 airdrop. Projects optimize for precision over recall, meaning they prefer to miss some sybils rather than incorrectly disqualify legitimate users. A 10-wallet operation has materially lower detection risk than a 500-wallet operation, especially if wallets maintain distinct funding sources and interaction patterns.
### What is the self-reporting mechanism some airdrops offer for sybil wallets?
LayerZero pioneered a self-reporting window where sybil wallets could declare themselves and receive 15% of their eligible allocation instead of 0%. Approximately 1.3 million wallets self-reported during the June 2024 ZRO airdrop. The mechanism reduces project enforcement costs while recovering allocation that would otherwise go to disqualified addresses. It creates an incentive structure where farmers facing likely detection can salvage partial value rather than risk total disqualification.
### How do projects detect sybil wallets across multiple blockchains?
Analytics vendors trace interaction patterns across chains using cross-chain behavioral fingerprinting. If a wallet appears isolated on Ethereum but replicates transaction sequences from a linked wallet on Avalanche or Polygon, the pattern triggers detection algorithms. One Hop Protocol sybil cluster was identified because the operator overlapped transactions on both Ethereum mainnet and Avalanche, connecting otherwise separate address sets. Vendors including Nansen and TrustLabs now analyze behavior across 10+ chains simultaneously.
The Weekly Yield Report
You just examined detection methods that disqualified 24% to 60% of airdrop farmers across four major distributions. Those thresholds will tighten as vendor algorithms improve with each cycle.
Every Thursday: where crypto yield actually is - stablecoins, liquid staking and DeFi lending, with the risk named next to the rate and what changed since last week.
[Get it free every Thursday](#/portal/signup)
Free. No trade calls, no allocations, no hype. Unsubscribe in one click.
### How To Maximize Allocation In Oversubscribed Token Sales
URL: https://altcoininvestor.com/how-to-get-more-allocation-in-ido/
Last updated: 2026-10-04T15:03:32.000Z
## How Allocation Mechanisms Determine What You Actually Receive
Most platforms advertise guaranteed allocations. What they do not advertise is how oversubscription dilutes your share. A $500 guaranteed allocation sounds certain until 10x oversubscription reduces it to $50\. Understanding the difference between lottery, tiered, and proportional systems determines whether you lock $5,000 for 30 days or buy tokens two days post-launch at better pricing.
Three primary allocation mechanisms run major launchpads in 2026\. Lottery systems distribute tickets to qualified users with winners drawn randomly. Oversubscription ratios often exceed 20:1 for hyped projects. Lower tiers face single-digit win rates even after staking platform tokens.
Tiered guaranteed systems provide users who meet staking thresholds with fixed or proportional allocations. BSCPad uses a six-tier model where users stake $BSCPAD tokens to earn spots. Investors know upfront how much they can invest, removing first-come chaos. Seedify runs a nine-tier structure where higher tiers get earlier access and larger allocation caps.
StakeWeight algorithms allocate based on token quantity multiplied by staking duration. This balances fairness against economic incentives. A user staking $2,000 for 60 days receives more allocation than someone staking $2,000 for 15 days, even in the same nominal tier.
The critical insight: guaranteed allocations do not protect against extreme oversubscription. When total demand exceeds supply, allocations are adjusted after the sale. Higher tiers receive priority. Lower tiers receive reduced amounts. A platform may promise you $500, but if the sale oversubscribes 4x, you receive $125.
## What Tier Upgrades Cost And When The Math Works

Capital requirements vary across platforms, but the pattern is consistent. Most require staking native governance tokens between $500 and $10,000 to qualify for higher tiers. Lower tiers face lottery systems. Top tiers demand six-figure stakes but deliver guaranteed allocations.
You can start with as little as $50 to $200 on some platforms, especially those with low entry barriers. Many crypto launchpad platforms use staking tiers, which means higher investment often leads to better allocation. The practical framework for 2026 IDO decisions breaks into three bands.
$500 to $2,000 represents the minimum viable allocation for tier-based platforms. This range gets you out of pure lottery systems and into proportional or small guaranteed tiers. Seedify offers staking rewards with up to 11% APR for $SFUND and 40% APR for $SNFT. If you are already earning yield on staked tokens, the opportunity cost of locking them for an IDO drops.
$5,000 to $15,000 covers staking requirements for guaranteed tiers on most major platforms. Higher staking tiers receive fixed allocations like $500, $2,000, or $5,000\. Top tiers require 30-plus days of staking before the sale date. Your capital is locked even if projects are delayed or cancelled. Some platforms allow no withdrawal once the staking snapshot begins.
The break-even calculation is straightforward. If a tier upgrade costs $5,000 in additional locked capital for 45 days and increases your allocation from $200 to $1,500, you gain $1,300 in allocation. If the token launches at a 3x premium to IDO price, your profit increases by $3,900\. If your $5,000 could earn 8% APY elsewhere, the opportunity cost for 45 days is $164\. The upgrade pays off.
If the same upgrade grants you $1,500 allocation but the token launches at 0.8x IDO price, you lose $300 on the allocation itself. Your locked $5,000 also lost $164 in forgone yield. Total cost: $464\. The upgrade destroyed value.
Typical oversubscription rates range from 10x to 50x for competitive launches. When a project raises $5 million on a $500,000 hard cap, every participant receives 10% of their expected allocation regardless of tier. In this scenario, a higher-tier staker with $5,000 capital guaranteeing a $2,000 allocation receives $200\. A lower-tier lottery entrant with a $500 ceiling receives $50 if they win the lottery at all.
The tier upgrade still delivers 4x the allocation in absolute terms, but both participants are diluted identically in percentage terms. This is why tracking historical oversubscription data for specific platforms matters more than advertised allocation sizes. [CryptoSlate's launchpad reviews](https://cryptoslate.com/launchpads/ido-platforms/) publish oversubscription ratios for past launches, giving you baseline expectations.
## Staking Duration, Lock-Up Risk, And Multi-Platform Strategies

Staking duration multipliers create a second variable beyond tier entry. Platforms using StakeWeight algorithms reward users who lock tokens longer. A 60-day stake might receive a 1.5x multiplier compared to a 15-day stake. This introduces time-based strategy decisions independent of capital size.
Lock-up risk increases with duration. Top tiers require 30-plus days of staking before the sale date. If a project delays its launch or cancels, your capital remains locked. If market conditions shift and you want to exit your staked position, withdrawal is often blocked once the snapshot period begins. You are holding the platform token through whatever volatility arrives.
The 2025 cohort of top-performing IDOs delivered an average return of 29% within the first two weeks of listing. This data point suggests that secondary market entry two to three days post-TGE often beats launchpad allocation ROI for hyped projects. For mid-tier projects without significant listing hype, launchpad entry still outperforms secondary.
Multi-platform staking reduces single-platform risk but increases total capital lock-up. Staking simultaneously on Seedify, BSCPad, and Polkastarter diversifies your IDO access. You participate in more launches. You reduce the impact of any single project failing to deliver returns. The trade-off is that you now have $6,000 to $15,000 locked across three platforms instead of $2,000 to $5,000 on one.
If you deploy $15,000 across three platforms and capture allocations in six IDOs over 90 days, your average allocation per project might be $800\. If four projects return 2x, one returns 5x, and one loses 40%, your blended return is approximately 2.1x on deployed allocations. Your $15,000 in staked platform tokens remains locked, earning whatever staking yield the platforms offer. Seedify's 11% APR on $SFUND adds $412 over 90 days on a $5,000 stake.
The alternative is keeping $15,000 liquid and buying tokens on secondary markets 48 to 72 hours post-launch. You avoid lock-up risk. You avoid oversubscription dilution. You pay whatever premium or discount the market assigns after launch. For projects that launch below IDO price, you win. For projects that 3x immediately, you lose. The historical data shows that top-performing IDOs often spike hard at launch, then retrace. Timing secondary entry requires monitoring, but it eliminates the staking requirement entirely.
## KYC, Geographic Restrictions, And Vesting Schedules
Regulatory scrutiny has tightened across major launchpads. Nearly all platforms now mandate full KYC: government-issued ID, proof of address, and sometimes live selfie verification. Geographic restrictions block users from the U.S., China, and several other jurisdictions on most major platforms. This eliminates entire user bases from high-performing platforms.
If you are in a restricted jurisdiction, the tier math is irrelevant. You cannot participate. Some users route through VPNs and foreign KYC documents. This introduces legal risk and potential loss of funds if the platform detects it. The ROI calculation must now include the probability of account termination and fund seizure.
Vesting schedules add a second post-allocation variable. Many projects implement vesting to prevent instant dumps. Lock-up periods vary widely. Some IDOs release 100% at launch. Others vest over 6 to 24 months with cliff periods. [Understanding token unlock schedules](https://altcoininvestor.com/how-to-check-token-unlock-schedule-2/) becomes essential if you are locking capital for an allocation that itself locks for another 12 months.
A project offering a $1,500 allocation with 12-month linear vesting means you receive $125 worth of tokens per month. If the token price drops 60% over that year, your $1,500 allocation is worth $600 at full vesting. You cannot sell the unvested portion to cut losses. Your effective return depends on price action over 12 months, not just launch day performance.
Instant-unlock IDOs create the opposite dynamic. If 100% of tokens unlock at TGE and the project has weak post-launch demand, everyone dumps simultaneously. The token craters. Your $1,500 allocation might be worth $400 within 48 hours. The lack of vesting concentrates sell pressure at launch. Tier upgrades that cost you $5,000 in locked capital for 45 days now deliver a $400 allocation that you could have bought for $350 on secondary markets three days later.
## Calculating Real Allocation Under Oversubscription
Oversubscription handling varies by platform, but the math is consistent. When total amounts invested exceed the target, tokens received by users are diluted based on actual investment amount. The formula: ETH or token price multiplied by hard cap amount raised, divided by actual amount raised.
A project with a $500,000 hard cap that raises $5 million experiences 10x oversubscription. Every participant receives 10% of their committed allocation. A user committed for $2,000 receives $200 in tokens. A user committed for $500 receives $50\. The advertised guaranteed allocation is adjusted downward proportionally.
Some platforms apply tiered oversubscription adjustments. Higher tiers receive full allocations up to a threshold, then proportional reductions beyond that. Lower tiers receive proportional reductions from the start. This structure rewards higher capital commitment and longer staking duration but still dilutes everyone when demand massively exceeds supply.
Tracking historical oversubscription ratios for specific platforms gives you baseline expectations. If BSCPad consistently runs 8x to 12x oversubscription on popular launches, you can estimate that a $1,000 guaranteed allocation will deliver $83 to $125 in actual tokens. If Seedify runs 15x to 25x on hyped projects, your $2,000 tier allocation might deliver $80 to $133.
Adjusting your tier entry decision based on expected oversubscription changes the break-even math. Paying $5,000 for a $2,000 guaranteed allocation that you expect to be diluted to $150 means you are paying $5,000 in locked capital (plus opportunity cost) for $150 in tokens. If the token 10x from IDO price, your $150 becomes $1,500\. If it 2x, your $150 becomes $300\. The tier upgrade cost you $164 in forgone yield for a $300 payout. You are breakeven at best.
## When Secondary Market Entry Beats Launchpad Access
The case for skipping IDO allocation and buying post-launch rests on three factors: oversubscription dilution, vesting lock-ups, and secondary market pricing inefficiency. If a project oversubscribes 20x, your $1,000 allocation becomes $50\. If it vests over 12 months, you receive $4.17 per month. If the token dumps 50% in month two, your allocation is worth $25 total over the full vesting period.
Buying $1,000 worth of the same token on secondary markets 72 hours post-launch gives you immediate liquidity. You can sell if momentum breaks. You avoid the 30-day staking lock-up before the sale. You avoid the vesting lock-up after the sale. You pay whatever price the market sets, which for many projects is below IDO price within the first week.
Top-performing IDOs in 2025 delivered an average return of 29% within the first two weeks. This includes the winners that 5x and the losers that dropped 60%. For mid-tier projects without major exchange listings or influencer hype, secondary prices often settle 10% to 30% below IDO price in the first week as early participants take profit.
The staking opportunity cost calculation tilts further toward secondary entry when platform token prices are volatile. If you stake $5,000 in $SFUND at $2.50 per token and the token drops to $1.80 over 45 days, your staked capital lost $1,400 in value. Even if your IDO allocation 3x, you need that profit to exceed $1,400 just to offset the platform token loss. If your allocation was diluted from $2,000 to $150 due to oversubscription, your 3x profit is $450\. You are down $950 net.
Multi-IDO strategies partially hedge this risk by spreading capital across several platform tokens. But if the broader market corrects during your 45-day staking period, all platform tokens likely decline together. Correlation does not disappear through diversification when the entire sector moves in sync.
## The Takeaway
The math on tier upgrades depends on three numbers you can estimate before committing capital: expected oversubscription ratio, platform token price stability, and post-launch secondary market behavior. If historical data shows a platform runs 15x oversubscription, your $2,000 guaranteed allocation delivers $133 in tokens. If the platform token you must stake drops 20% during lock-up, your opportunity cost includes that loss. If secondary markets price the token 15% below IDO within 72 hours, buying there beats the allocation. Run the numbers with your own capital size and risk tolerance. For hyped launches on tier-based platforms, higher tiers still win when the token delivers a 5x-plus return. For everything else, secondary entry after the initial dump captures better pricing without the lock-up risk.
## Frequently Asked Questions
### What is the typical oversubscription ratio for popular IDOs in 2026?
Oversubscription ratios for competitive launches typically range from 10x to 50x in 2026\. This means a project with a $500,000 hard cap might raise $5 million to $25 million in commitments. Your actual allocation is your committed amount divided by the oversubscription ratio. A $1,000 commitment at 20x oversubscription delivers $50 in tokens. Platforms publish historical oversubscription data that helps you estimate dilution before staking.
### How much capital do I need to stake for guaranteed allocations?
Most platforms require $500 to $2,000 in staked platform tokens for entry-level guaranteed tiers. Mid-tier allocations typically require $5,000 to $15,000 in staked tokens. Top tiers offering the largest allocations can require six-figure stakes. Staking periods range from 15 to 45 days before the sale date. Some platforms lock your tokens from snapshot through token distribution, which can extend to 60-plus days total.
### When does buying on secondary markets beat getting an IDO allocation?
Secondary market entry outperforms IDO allocation when oversubscription dilutes your share heavily, when platform tokens lose value during lock-up, or when post-launch prices settle below IDO. Historical data shows many mid-tier projects trade 10% to 30% below IDO price within the first week as early participants take profit. Buying 48 to 72 hours post-launch avoids staking lock-ups and vesting restrictions while often capturing better entry prices.
### What are StakeWeight algorithms and how do they affect allocation?
StakeWeight algorithms calculate allocation based on both the quantity of tokens staked and the duration of the stake. A user staking $2,000 for 60 days receives more allocation than someone staking $2,000 for 15 days. Platforms apply multipliers ranging from 1x for minimum duration to 1.5x or 2x for longer lock-ups. This rewards users who commit capital earlier and for longer periods, independent of tier level.
### How does vesting impact the value of my IDO allocation?
Vesting schedules lock your allocated tokens over periods ranging from zero (instant unlock) to 24 months with cliff periods. A $1,500 allocation with 12-month linear vesting releases $125 worth of tokens per month. If the token price drops 60% over that year, your allocation is worth $600 at full vesting. You cannot sell unvested portions to cut losses. Instant-unlock IDOs concentrate sell pressure at launch, often causing sharp price drops within 48 hours.
The Weekly Yield Report
You now have the oversubscription math and tier break-even calculations for six major platforms. Those ratios will change with the next hyped launch.
Every Thursday: where crypto yield actually is - stablecoins, liquid staking and DeFi lending, with the risk named next to the rate and what changed since last week.
[Get it free every Thursday](#/portal/signup)
Free. No trade calls, no allocations, no hype. Unsubscribe in one click.
### How To Recognize A Cycle Bottom (What I Look For)
URL: https://altcoininvestor.com/how-to-recognize-crypto-cycle-bottom/
Last updated: 2026-10-04T12:03:13.000Z
## The Hardest Trade Is The One That Makes You Money
In December 2018, I sat in my office watching Bitcoin trade below $3,200 for the first time since September 2017\. My portfolio had shrunk 84% from its December 2017 peak. The mining operation I'd been running since 2015 was underwater on electricity costs. My inbox was full of people asking if crypto was finally dead. Every fiber of my emotional brain was screaming at me to sell what remained and walk away.
Instead, I started buying again.
Not because I was certain Bitcoin would recover. I wasn't. But because every quantitative signal I had learned to trust during the previous five years of trading was telling me the same thing: capitulation was either happening or had just finished happening. The hardest part wasn't identifying the signals. The hardest part was trusting them when they mattered most.
I wrote recently about [how to recognize a cycle top](https://altcoininvestor.com/how-to-recognize-crypto-cycle-top/). This is the opposite side of that analysis. If tops are defined by euphoria, bottoms are defined by capitulation. And capitulation has a signature that repeats across cycles.
## What Capitulation Actually Means

Capitulation is not just price going down. Price goes down all the time. Capitulation is the moment when the last cohort of holders who were going to sell finally sells. It's the point at which everyone who entered the market for the wrong reasons has been flushed out, and the only people left holding are the ones who either don't care about the price or genuinely believe in the long-term thesis.
You can't identify capitulation by looking at price alone. You need to look at behavior. Specifically, you need to look at the behavior of the two groups who have the most to lose during a bear market: miners and leveraged traders.
Miners operate on thin margins. When the price of Bitcoin falls below their cost of production, they have two choices: shut down their rigs or keep mining at a loss and hope the price recovers before they run out of capital. The weakest miners capitulate first. They shut down their machines, and the network hash rate drops. This process is called miner capitulation, and it has preceded every major Bitcoin bottom in history.
Leveraged traders operate on borrowed time. When the market moves against them, they either close their positions voluntarily or get liquidated by the exchange. During a prolonged bear market, the funding rate on perpetual futures contracts turns negative. This means short positions are paying long positions to keep their trades open. It's a sign that the market is structurally bearish and that leverage is stacked on the downside. Historically, sustained negative funding rates have preceded every major relief rally.
These are not theoretical patterns. They are empirical patterns that have repeated in 2015, 2018-2019, 2020, and 2022\. The reason I trust them is not because I believe history repeats itself perfectly. I trust them because they measure the same underlying economic reality: when the cost of holding a position exceeds the expected return, rational actors exit. When enough rational actors have exited, the market has cleared, and the bottom is in or near.
## The Hash Ribbon Indicator
The single most reliable capitulation signal I have used across multiple cycles is the Hash Ribbon indicator. It measures the 30-day moving average of Bitcoin's network hash rate against the 60-day moving average. When the 30-day average crosses below the 60-day average, it signals that hash rate is declining and miners are capitulating. When the 30-day average crosses back above the 60-day average, it signals that hash rate has stabilized and the capitulation phase is over.
The [Hash Ribbon recovery cross](https://glassnode.com/) occurred in January 2019, and Bitcoin tripled in price over the following three months. It occurred again in August 2021 after the China mining ban, and Bitcoin rallied from $30,000 to $69,000 by November. It occurred again in early 2023 after the FTX collapse, and Bitcoin rallied from $16,000 to $31,000 by April.
In February 2026, we saw [one of the longest mining capitulations on record](https://www.coindesk.com/markets/2026/02/25/one-of-longest-mining-capitulations-nears-end-signaling-potential-btc-price-bottom), lasting nearly three months. The recovery cross occurred in late February, with Bitcoin trading around $60,000\. By late September, Bitcoin had touched $87,000 before pulling back to the current $84,000 range.
The Hash Ribbon is not a price predictor. It does not tell you where Bitcoin will be in six months. What it tells you is when the structural pressure from miner capitulation has lifted. That is a different and more useful piece of information. It tells you when the probability distribution has shifted in favor of accumulation rather than distribution.
## MVRV: Market Value To Realized Value
The second signal I watch is the MVRV ratio. This is the ratio of Bitcoin's market capitalization to its realized capitalization. Market cap is the current price multiplied by the total supply. Realized cap is the price at which each coin last moved on-chain, multiplied by the total supply. In other words, realized cap is an estimate of the aggregate cost basis of all Bitcoin holders.
When MVRV is above 1, the market is trading above the aggregate cost basis. When MVRV is below 1, the market is trading below the aggregate cost basis, meaning the average holder is underwater. Historically, MVRV readings below 1 have marked accumulation zones, and readings below 0.8 have marked major cycle bottoms.
In December 2018, MVRV bottomed at 0.65\. In March 2020, it briefly touched 0.75 during the COVID crash. In November 2022, after the FTX collapse, it fell to 0.82\. Each of these readings marked a generational buying opportunity for anyone with the conviction and capital to act.
MVRV is not a timing tool. It can stay below 1 for months. But it is a probability tool. When MVRV is below 1, the probability that you are buying near a cycle bottom is much higher than when MVRV is above 3\. And when you are thinking in probabilities rather than certainties, that shift in the odds is all you need to justify a position.
As of early October 2026, with Bitcoin trading around $85,000 and down roughly 33% from the all-time high of $126,000, MVRV is in the neutral-to-accumulation zone, not the deep capitulation zone. This is consistent with a mid-cycle correction rather than a full cycle bottom. But the framework remains the same: watch the ratio, calibrate your conviction accordingly.
## Funding Rates And Leverage Capitulation
The third signal I track is the funding rate on Bitcoin perpetual futures. This is the periodic payment exchanged between long and short positions to keep the futures price anchored to the spot price. When the market is bullish, longs outnumber shorts, and the funding rate is positive. Longs pay shorts. When the market is bearish, shorts outnumber longs, and the funding rate is negative. Shorts pay longs.
During sustained bear markets, funding rates turn deeply negative and stay there for weeks or months. This happened in the second half of 2022, when funding rates remained negative for the longest stretch since the 2018-2019 bear. It happened again in early 2026, when funding rates stayed negative for months before flipping positive in the late summer.
Sustained negative funding is a sign of structural bearishness. It means traders are willing to pay a premium to hold short positions. But it is also a contrarian signal. When everyone is positioned for downside, any reversal in sentiment or any external catalyst can trigger a cascade of short covering. And because futures markets are leveraged, those squeezes can be violent.
I do not trade based on funding rate squeezes. But I do use funding rates as a measure of market positioning. When funding has been deeply negative for months and then starts to normalize, it tells me that the leverage capitulation phase is ending. Combined with miner capitulation and MVRV, it completes the picture.
## The Media Capitulation Signal
There is a fourth signal that is harder to quantify but just as reliable: media sentiment. Specifically, the moment when mainstream financial media declares that crypto is dead, that Bitcoin has failed, that the entire experiment was a speculative bubble with no future.
This happened in early 2015 after the Mt. Gox collapse. It happened again in December 2018 after the year-long bear market. It happened in March 2020 during the COVID crash. It happened in November 2022 after FTX. Every single time, it marked or closely preceded a major bottom.
The reason this signal works is not because the media is always wrong. The reason it works is because media sentiment is a lagging indicator of public sentiment, and public sentiment capitulates last. By the time the New York Times or Bloomberg is running stories about the death of crypto, the smart money has already capitulated, the miners have already capitulated, and the market has already cleared. What remains is the echo of fear in the minds of retail investors who were never going to hold through a bear market anyway.
I don't track media sentiment with a formula. I track it by reading the headlines and asking myself: would someone who knows nothing about crypto read this and conclude that the entire industry is finished? If the answer is yes, I pay attention.
## What I Don't Know
I have been trading crypto for more than a decade, and I have seen every one of these signals play out multiple times. But I do not pretend to have certainty about the future. There are several things I do not know, and they matter.
I do not know whether the four-year halving cycle will continue to govern Bitcoin's price action as institutional adoption scales. I wrote about this question in detail [earlier this year](https://altcoininvestor.com/how-to-recognize-crypto-cycle-top/), and the honest answer is that the cycle may be lengthening or flattening in ways that will only be visible in hindsight.
I do not know how macroeconomic conditions will interact with crypto cycles going forward. The Federal Reserve raised rates 25 basis points to 3.75-4.00% in September 2026, and there is another potential hike on October 28\. If we enter a sustained high-rate environment, the traditional risk-on / risk-off framework may dominate crypto-specific cycle dynamics in ways we have not seen before.
I do not know whether the current drawdown from $126,000 to $85,000 represents a mid-cycle correction or the beginning of a deeper bear market. The signals I described above suggest we are not in deep capitulation yet. But signals can change faster than I can update this analysis.
What I do know is this: the framework works not because it predicts the future, but because it measures the present. It tells me when the market has cleared, when the weak hands have exited, and when the probability distribution has shifted in favor of long-term holders. That is enough.
## Why This Matters Over The Next Decade
The reason I care about cycle bottoms is not because I am trying to time the market perfectly. I gave up on that ambition years ago. The reason I care is because cycle bottoms are the only time in the entire cycle when conviction costs you nothing and pays you everything.
During a bull market, conviction is expensive. You are buying into euphoria, and the probability that you are overpaying is high. During a bear market, conviction is cheap. You are buying into fear, and the probability that you are underpaying is high. The traders who build generational wealth in crypto are not the ones who trade the volatility. They are the ones who accumulate at the bottom and hold through the next cycle.
I built my first crypto portfolio from nothing between 2013 and 2017\. I built my second portfolio from a much smaller base between 2019 and 2021\. Both times, the bulk of the value was created by positions I entered during capitulation phases and held for years. The framework I described in this piece is the same framework I used both times. It is not complicated. It is just disciplined.
Over the next decade, I expect crypto to transition from a speculative asset class to a foundational layer of the global financial system. That transition will not happen in a straight line. It will happen through cycles. The people who understand how to recognize and act during the capitulation phase of those cycles will capture a disproportionate share of the value creation. The people who panic and sell during capitulation will fund that value creation.
This is not a prediction. This is an observation based on ten years of watching the same pattern repeat.
## The Takeaway
Capitulation is not a moment. It is a process. It happens when miners shut down their rigs, when funding rates stay negative for months, when MVRV falls below 1, and when the media declares the entire industry dead. You cannot time it perfectly. But you can recognize it when it is happening, and you can act with conviction when the probability distribution shifts in your favor.
I do not know whether we will see deep capitulation again in this cycle. The current market structure suggests we are in a mid-cycle correction rather than a full reset. But I do know that the next cycle bottom will look like every previous cycle bottom. The signals will be there. The only question is whether you will have the discipline to trust them when they matter most.
In December 2018, I trusted them. It was the hardest trade I ever made. It was also the most profitable.
## Frequently Asked Questions
### What is the Hash Ribbon indicator and why does it signal cycle bottoms?
The Hash Ribbon measures Bitcoin's 30-day hash rate moving average against the 60-day average. When the 30-day crosses below the 60-day, miners are capitulating and shutting down rigs. When it crosses back above, capitulation has ended and hash rate is recovering. This recovery cross has preceded major rallies in January 2019, August 2021, and early 2023, because it signals that structural selling pressure from miners has lifted.
### What does MVRV below 1 mean for Bitcoin buyers?
MVRV (Market Value to Realized Value) below 1 means Bitcoin is trading below the aggregate cost basis of all holders. The average holder is underwater. Historically, MVRV readings below 1 have marked accumulation zones, and readings below 0.8 have marked generational buying opportunities at major cycle bottoms in 2018, 2020, and 2022\. It does not time the exact bottom, but it shifts probability in favor of long-term buyers.
### Why do negative funding rates signal capitulation?
Negative funding rates on perpetual futures mean short positions are paying long positions to keep trades open. This happens when traders are overwhelmingly bearish and willing to pay a premium to hold shorts. Sustained negative funding for weeks or months signals structural bearishness and leverage stacked on the downside. When funding normalizes after a long negative streak, it indicates leverage capitulation has ended and positioning has reset.
### Can you time the exact bottom using these signals?
No. These signals do not predict exact price bottoms. They measure when capitulation is happening or has finished. MVRV can stay below 1 for months. Hash Ribbons can cross and re-cross. Funding rates can stay negative longer than you expect. The goal is not perfect timing but probability calibration. When multiple signals confirm capitulation, the odds shift in favor of accumulation even if the exact low has not occurred yet.
### How does media sentiment confirm a cycle bottom?
Mainstream financial media declaring crypto dead is a lagging indicator of public capitulation. It happened after Mt. Gox in 2015, in December 2018, during the March 2020 COVID crash, and after FTX in November 2022\. Each time marked or closely preceded a major bottom. Media sentiment capitulates last because it reflects retail fear, which peaks after smart money and miners have already exited. It is not quantifiable but it is reliable as a contrarian signal.
### Week in Crypto: DeFi Yield, Rate Collapses, and Structure
URL: https://altcoininvestor.com/week-in-crypto-2026-10-04/
Last updated: 2026-10-04T11:02:42.000Z
The week ending October 4 delivered a lesson in rate durability that most yield dashboards never teach. Uniswap V3 USDC-WETH dropped 10.65 percentage points in seven days. Aave V3 USDe collapsed 4.16pp in hours. Curve crvUSD-WBTC fell 9.69pp. At the same time, Compound V3 USDC jumped 2.76pp and SparkLend USDS rose 1.10pp. The pattern is clear: advertised APY is not income. It is a snapshot of a mechanism that changes without warning.
The week also brought structural developments. Robinhood announced CFTC-approved perpetual futures with 10x leverage on BTC and ETH. Tether returned USDT to Bitcoin for the first time since 2014 via RGB protocol. Chainlink connected 17 banks to Swift's blockchain ledger for 24/7 settlement. And MetaMask emergency-exited 523,000 staked ETH after rewards were diverted to an attacker wallet. These are not headlines. They are shifts in infrastructure, custody risk, and settlement architecture.
## DeFi Yield Volatility and Rate Collapses
The [Uniswap V3 USDC-WETH pool collapsed from 20.15% to 9.5%](https://altcoininvestor.com/why-uniswap-v3-apy-drop/) in January, then dropped another 10.65 points weeks later. Liquidity migrated to lower fee tiers. Volume shifted to Layer 2\. Positions drifted out of range during volatility spikes, earning zero fees while impermanent loss continued to accrue. Two collapses in one quarter is not noise. It is structural instability in concentrated liquidity mechanics that single APY snapshots never reveal.
Aave V3 USDe supply rate [fell from 4.75% to 0.59%](https://altcoininvestor.com/aave-usde-yield-dropped-ethena-sustainability/) when the leverage loop unwound. The loop worked as long as borrowing costs stayed below sUSDe staking yields. When the spread inverted, the entire mechanism collapsed. Curve's crvUSD-WBTC pool [dropped from 10.26% to 0.57%](https://altcoininvestor.com/curve-crvusd-wbtc-apy-drop/) after veCRV holders reallocated gauge weight and third-party incentives expired. Centrifuge USDS [declined 1.08pp on $326M TVL](https://altcoininvestor.com/centrifuge-usds-yield-drop/), a drop invisible on-chain but tied to RWA-specific utilization shifts.
[](https://altcoininvestor.com/aave-usde-yield-dropped-ethena-sustainability/)
What Aave V3 USDe's 4.16pp Drop Reveals About Ethena Yield
[](https://altcoininvestor.com/centrifuge-usds-yield-drop/)
Centrifuge USDS Rate Drop: RWA Pool Utilization Or Yield Source Change
Meanwhile, Compound V3 USDC [jumped from 3.23% to 5.99%](https://altcoininvestor.com/compound-v3-usdc-rate-increase-safe/) in hours, not because governance changed parameters but because utilization curves shifted algorithmically. SparkLend USDS [rose 1.10pp to 5.13%](https://altcoininvestor.com/sparklend-usds-rate-increase/) on $1.526B TVL. The question in both cases is whether organic demand drove the increase or whether the rate will compress as fast as it rose.
## DeFi Infrastructure and Position Monitoring
Three high-TVL positions disappeared from yield tracking dashboards simultaneously. BlackRock BUIDL showed $1.4B missing. Aave V3 USDe dropped $539M in tracked supply. Jupiter USDC positions lost $470M in visibility. The combined $2.4B tracking loss triggered panic until [allocators learned to distinguish data lag from liquidity freeze](https://altcoininvestor.com/multiple-defi-positions-disappeared-tracking/) by checking RPC node responses, on-chain balance queries, and protocol health dashboards within the first six hours.
Jupiter Lend positions vanished from trackers despite the protocol holding $1.05B TVL and $907M in active loans. The issue was not exploit or freeze. It was [rehypothecation disclosure failures and DoS risk](https://altcoininvestor.com/jupiter-lend-disappeared-why/) that broke API feeds. The week proved that manual position checks fail during real incidents. Automated alerts using RPC calls and webhooks preserve capital by notifying within one hour, not 6-12 hours after Discord posts the issue.
For allocators managing $200,000 to $800,000 across 8-12 DeFi positions, the week validated [the 20-minute weekly review process](https://altcoininvestor.com/track-defi-yield-positions-efficiently/) that monitors TVL trend, utilization slope, contract upgrade timelines, governance proposal status, and social sentiment flags. This is not portfolio tracking. This is position surveillance.
[](https://altcoininvestor.com/track-defi-yield-positions-efficiently/)
How To Monitor 8-12 Yield Positions In 20 Minutes Weekly
## Stablecoins and Settlement Infrastructure
Tether announced a $7.5M-backed deployment of USDT on Bitcoin using RGB and Lightning Network protocols. This marks [the first major stablecoin on Bitcoin in twelve years](https://altcoininvestor.com/bitcoin-usdt-settlement-rail-rgb-protocol/), since Tether abandoned Omni Layer in 2014\. The deployment transforms Bitcoin from pure store-of-value into a settlement rail for dollar payments, with implications for platform economics and cross-border corridor efficiency.
The Turkey-Russia USDT corridor moved $576 billion in crypto transaction volume between July 2024 and June 2025\. Most Western analysts track these markets separately and miss the corridor. [The spread arbitrage is structural](https://altcoininvestor.com/turkey-russia-usdt-corridor/), not temporary, driven by sanctions friction and capital control premiums that persist regardless of exchange rate volatility.
[](https://altcoininvestor.com/turkey-russia-usdt-corridor/)
The Turkey-Russia USDT Corridor: Volume, Spread, And Who Earns
Chainlink announced that it is enabling financial institutions to connect key signing infrastructure to Swift's blockchain ledger through the Chainlink Runtime Environment. [Seventeen banks are piloting live transactions](https://altcoininvestor.com/chainlink-swift-blockchain-ledger-banks/), and the architecture shifts settlement from batch cycles to 24/7 availability without requiring banks to rebuild custody infrastructure.
[](https://altcoininvestor.com/chainlink-swift-blockchain-ledger-banks/)
Chainlink Connects Banks to Swift's Blockchain Ledger
## Staking, Validators, and Custody Risk
MetaMask initiated the emergency exit of 17,000 Ethereum validators representing over 523,000 staked ETH ($1.4 billion) after 18 of 19 validators sent block rewards to an unexpected address. Approximately 0.36 ETH was diverted. The incident [exposes the operational risk embedded in delegated staking infrastructure](https://altcoininvestor.com/metamask-validator-exit-lido-concentration-risk/) and highlights the concentration risk in Lido, which processed the exit through its validator set.
Marinade's mSOL yield [dropped from 6.0% to 4.81%](https://altcoininvestor.com/why-did-marinade-msol-yield-drop/) on roughly $229M TVL. The 1.19pp collapse reflects validator commission pressure, MEV capture shifts, and structural network changes, not temporary churn. On a $300,000 position, the decline costs $3,570 annually going forward.
The week reinforced the custody trade-off between exchange staking and self-custody staking. [Exchange staking charges 26-40% commission](https://altcoininvestor.com/staking-on-exchange-vs-own-wallet/) on rewards. Coinbase takes 35% of ETH's 3.5% gross yield, netting you 1.95%. Self-custody through Rocket Pool charges 5-20%, delivering 3.46% net. On a $50,000 position, that is $755 annual difference. The threshold where custody risk outweighs fee savings is allocation-specific, but the math is clear.
## Exchanges, Derivatives, and Market Structure
Robinhood announced at its HOOD Summit that it will offer perpetual futures on BTC, ETH, SOL, XRP, DOGE, ADA, LINK, and HYPE to eligible US customers through a CFTC-registered entity. [The contracts carry no expiration and allow 10x leverage on BTC and ETH](https://altcoininvestor.com/robinhood-perpetual-futures-cftc-compliance/), with 3x on the remaining assets. Robinhood will charge 0.01% per trade through year-end, then 0.03% maker and 0.06% taker. The structure matters because it brings perpetual futures into a retail-first interface with regulatory compliance baked in, not bolted on.
Altcoin exchange deposit transactions climbed 160% in two weeks, reaching roughly 78,000 on a seven-day cumulative basis as of September 28\. That is up from around 29,800 on September 14\. [Depositing addresses tripled, signaling broad-based sell pressure](https://altcoininvestor.com/altcoin-exchange-deposits-surge-sell-pressure/) not seen since October 2025\. When holders move coins to exchanges, they usually intend to sell. This is supply moving toward liquidity, and it is happening at scale.
## Education, Tools, and Frameworks
The week brought foundational guides on DeFi primitives, leverage mechanics, and yield position management. [DeFi replaces banks, brokers, and exchanges with smart contracts](https://altcoininvestor.com/what-is-defi/), but the primitives carry specific risks: liquidity pool impermanent loss, algorithmic stablecoin death spirals, and oracle manipulation. Understanding what the primitives actually do prevents capital loss from mechanism failure, not just price movement.
[](https://altcoininvestor.com/what-is-defi/)
What Is DeFi? A Complete Explanation
Readers asked how to [use leverage safely in crypto trading](https://altcoininvestor.com/how-to-use-leverage-crypto/). The answer is that leverage is defensible when structured around asymmetric bets with defined risk. At 50x leverage, a 2% adverse price move triggers liquidation. Most traders destroy capital chasing volatility with size. The allocation framework that preserves capital starts with position sizing at 1-2% of account balance per trade, not 10-20%.
[](https://altcoininvestor.com/how-to-use-leverage-crypto/)
How To Use Leverage Safely In Crypto Trading
For allocators running 5-15 yield positions across protocols, [building a tax-proof record system](https://altcoininvestor.com/how-to-track-defi-yield-for-taxes/) captures what automated tax software cannot: auto-compounding income recognition, liquidity pool token cost basis decomposition, and cross-chain bridge transaction sequencing. The system prevents the scenario where you owe tax on $40,000 in reported income but can only produce documentation for $28,000.
[](https://altcoininvestor.com/how-to-track-defi-yield-for-taxes/)
How To Build A Tax-Proof Record System For Multi-Protocol Yield
## The Takeaway
Rate jumps look like free money until you check utilization, borrower concentration, and exit liquidity. Rate collapses look like anomalies until three protocols drop simultaneously. This week proved that advertised APY is a lagging indicator, not a forward signal. The allocators who preserved capital were the ones who built monitoring alerts that detect TVL slope changes, governance parameter votes, and whale withdrawal patterns 12-36 hours before Twitter reacts. The next rate collapse will follow the same pattern. The question is whether you will see it coming.
## Frequently Asked Questions
### Why did Uniswap V3 USDC-WETH yield collapse 10.65 percentage points in one week?
The collapse reflects three converging mechanisms: liquidity migrated to lower fee tiers, trading volume shifted to Layer 2 networks, and concentrated liquidity positions drifted out of range during volatility spikes. When positions move out of range, they earn zero fees while impermanent loss continues to accrue. Two collapses of this magnitude in one quarter indicate structural instability in concentrated liquidity mechanics, not temporary market conditions.
### What caused $2.4 billion in DeFi positions to disappear from tracking dashboards?
BlackRock BUIDL, Aave V3 USDe, and Jupiter USDC positions vanished simultaneously due to data provider API failures, not exploits or liquidity freezes. The issue was rehypothecation disclosure failures and DoS risk that broke tracking feeds. Allocators who checked RPC node responses and on-chain balance queries within six hours distinguished data lag from actual position loss. Manual daily checks failed; automated alerts using webhooks preserved capital.
### How did Robinhood's CFTC-approved perpetual futures change retail crypto access?
Robinhood will offer perpetual futures on BTC, ETH, SOL, XRP, DOGE, ADA, LINK, and HYPE through a CFTC-registered entity with 10x leverage on BTC and ETH. The structure brings perpetual futures into a retail-first interface with regulatory compliance integrated from launch, not added later. Trading fees start at 0.01% through year-end, then move to 0.03% maker and 0.06% taker, significantly lower than most perpetual exchanges.
### Why did Aave V3 USDe supply rate collapse from 4.75% to 0.59%?
The collapse was not an Aave bug or liquidity crisis. It was the predictable outcome of a leverage loop unwinding when the spread between borrowing costs and sUSDe staking yields inverted. The loop worked as long as users could borrow cheaper than they earned. When borrowing costs rose above staking yields, the entire mechanism collapsed within hours, erasing $12,480 in annual yield on a $300,000 position.
### What does the 160% increase in altcoin exchange deposits signal?
Altcoin exchange deposit transactions hit 78,000 by September 28, up from 29,800 on September 14\. Depositing addresses tripled, indicating broad-based sell pressure not seen since October 2025\. When holders move coins to exchanges, they typically intend to sell. This represents supply moving toward liquidity at scale, a leading indicator of potential downward price pressure across altcoin markets.
### What Cryptocurrency Wallets Are: Key Management, Signing, Custody
URL: https://altcoininvestor.com/what-are-cryptocurrency-wallets/
Last updated: 2026-10-04T02:03:24.000Z
## What Wallets Actually Do

Cryptocurrency wallets do not store coins. They store private keys that prove ownership of on-chain assets. The coins themselves remain on the blockchain. The wallet's job is to hold the cryptographic key that lets you move those coins.
A [private key](https://altcoininvestor.com/private-key/) is a 256-bit number that controls access to a blockchain address. The wallet generates this key, stores it, and uses it to sign transactions when you want to move funds. The signed transaction goes to the network. The network verifies the signature against the public key. If valid, the transaction executes.
This means wallet architecture is about key management, not asset custody. The critical questions are: where does the key live, who controls it, and what signing process protects it from unauthorized use.
## The Custody Spectrum: Who Controls The Keys

Custody determines who holds the private key. This divides wallets into two categories: custodial and non-custodial. The distinction is not about convenience. It is about counterparty risk versus personal responsibility.
### Custodial Wallets
Custodial wallets are managed by a third party. When you hold funds on Coinbase, Kraken, or Binance, the exchange holds the private key. You log in with a username and password. You do not control the key itself. The platform signs transactions on your behalf.
Trade-offs include exchange insolvency risk, account freezes during regulatory action or market stress, mandatory KYC requirements, and withdrawal limits when platforms impose restrictions. If the custodian suffers a breach, faces downtime, or collapses, you lose access to your funds. Historical examples: Mt. Gox (2014), FTX (2022).
For [centralized exchange yield](https://altcoininvestor.com/how-does-binance-earn-work-cex-yield/), custodial wallets create a specific risk. When you deposit ETH into Binance Earn or Coinbase Prime, you transfer custody to the platform. The platform allocates your capital to lending desks, institutional borrowers, or internal yield strategies. You do not sign the transactions that deploy your capital. The platform does. If the platform fails, your yield position disappears with it.
Custodial models work when counterparty risk is acceptable. They fail when the custodian fails.
### Non-Custodial Wallets
Non-custodial wallets give the user full control over the private key. The key lives on your device or hardware signer. You sign every transaction. No third party can freeze, reverse, or block a transfer. This is [self-custody](https://altcoininvestor.com/what-is-self-custody-crypto/).
The trade-off is personal responsibility. If you lose your private key or recovery phrase, there is no recovery mechanism. Lost keys account for approximately 20% of all Bitcoin, representing billions in permanently inaccessible funds. If you sign a malicious transaction, the network executes it. There is no fraud department to call.
For active yield position management, non-custodial wallets eliminate platform counterparty risk but introduce operational risk. You must secure the key, verify every transaction before signing, and understand the contract interaction you are approving. Most losses in self-custody come from signing a bad transaction, not from key theft.
## Key Signing Models: Hardware, Software, Smart Contract

The signing model determines where the key lives and how it approves transactions. Three architectures dominate: hardware wallets, software wallets, and smart contract wallets. Each trades security against speed.
### Hardware Wallets
Hardware wallets store private keys in a dedicated device with a tamper-resistant secure element. Ledger uses chips certified under Common Criteria EAL5+ or EAL6+. Trezor Safe 7 uses a similar secure element architecture. The key never leaves the device. When you sign a transaction, the wallet receives the unsigned transaction data, signs it inside the secure element, and returns the signed transaction to the host computer.
This protects against remote key extraction. Malware on your computer cannot read the private key. Phishing sites cannot exfiltrate it. The attack surface is limited to physical device compromise or signing a malicious transaction displayed on the device screen.
The trade-off is speed. Every transaction requires connecting the hardware device, reviewing transaction details on the device screen, and physically confirming the signature. For frequent DeFi interactions across multiple protocols, this friction compounds. Yield farmers rotating positions across Aave, Compound, and Curve face ten to fifteen signing operations per rebalancing cycle.
For long-term holdings or large capital allocations, hardware wallets are the correct tool. For active protocol interaction, the signing overhead becomes a constraint. Comparing [the best hardware wallets](https://altcoininvestor.com/best-crypto-hardware-wallets/) reveals that signing speed varies across devices, but all hardware signers are slower than software alternatives.
### Software Wallets
Software wallets store private keys on the device, protected by OS-level isolation. MetaMask on iOS uses the Secure Enclave. Android wallets use StrongBox. The key is encrypted at rest and gated by biometric authentication or a password. When you sign a transaction, the wallet decrypts the key in memory, signs the transaction, and submits it to the network.
Software wallets sign faster than hardware wallets. MetaMask processes a signature in under two seconds. This makes them the default choice for active DeFi users. The trade-off is that the key lives on an internet-connected device. If the device is compromised, the key is exposed. If you approve a malicious transaction, the wallet signs it without additional verification.
MetaMask includes anti-phishing alerts and transaction simulation features that preview the outcome of a transaction before signing. This reduces blind signing risk but does not eliminate it. The wallet cannot verify the safety of every contract interaction. It can only show you what the transaction will do based on static analysis.
### Smart Contract Wallets
Smart contract wallets replace externally owned account (EOA) custody with a deployed contract that holds assets and enforces signing rules on-chain. Safe (formerly Gnosis Safe) is the dominant implementation. The wallet is a contract deployed on Ethereum or another EVM chain. It holds assets in a programmable account controlled by a configurable set of signers.
Safe supports multisig configurations from 1-of-N to N-of-N. A 2-of-3 Safe requires two out of three designated signers to approve any transaction. The signing rules are enforced by the contract. No single signer can move funds unilaterally.
This architecture is used by DAOs, protocol treasuries, and institutions managing large on-chain positions. It eliminates single points of failure but introduces coordination overhead. Every transaction requires multiple signers to review and approve. For frequent yield rebalancing, this friction is prohibitive. For treasury management or large capital allocation, it is necessary.
Safe supports Ethereum mainnet, Polygon, Arbitrum, Optimism, Base, BNB Chain, Avalanche, zkSync Era, and several hundred other networks. Cross-chain coordination is possible but requires separate contract deployments per chain.
## Advanced Key Management: MPC And Multisig
Multi-Party Computation (MPC) and multisig are both multi-signature architectures, but they operate differently at the cryptographic level.
### MPC
MPC splits one private key into encrypted shares distributed across multiple parties or devices. The complete key never exists in one location. When signing a transaction, the shares collaborate mathematically without reconstructing the full key. The signature is valid, but no single party ever held the full key.
This eliminates the single point of failure inherent in traditional key management. If one share is compromised, the attacker cannot reconstruct the key. If one device is lost, the remaining shares can regenerate the signing capability. Cobo provides MPC custody with integrated DeFi access across 80+ chains, allowing institutions to maintain custody-grade security while accessing staking, lending, and yield farming protocols.
The trade-off is complexity. MPC requires coordination between multiple systems. Latency increases. The signing process is opaque to most users. For institutional custody, this is acceptable. For individual users, it is overkill.
### Multisig
Multisig wallets require multiple cryptographic signatures from different keys to execute a transaction. A 2-of-3 multisig setup might use three hardware wallets, each holding a separate private key. Key 1 is in your home safe. Key 2 is in a bank safe deposit box. Key 3 is with a trusted family member. Any two keys can sign a transaction. If one key is lost, the other two can still move funds.
Common practice: use multiple hardware wallet brands to avoid firmware vulnerabilities. A Ledger + Trezor + Coldcard setup prevents a single vendor exploit from compromising the entire signing set.
Multisig transactions include more data than single-signature transactions. Each additional signature and public key increases transaction size. On Bitcoin, this increases fees. On Ethereum, it increases gas costs. The overhead is 20-30% higher than standard EOA transactions.
Blind signing risk remains. If a co-signer is tricked into approving a malicious transaction, the multisig threshold can be met without anyone noticing the fraud. Transaction preview tools mitigate this, but they do not eliminate it. Each signer must independently verify the transaction details before signing.
## Wallet Architecture For Yield Position Management
Wallet choice determines signing speed, security, and operational overhead. For [active yield positions](https://altcoininvestor.com/calculate-real-defi-returns/), the trade-off is between capital security and transaction friction.
### Speed Versus Security
Hardware wallets secure keys but slow transaction flow. A Ledger requires physical confirmation for every signature. If you are rotating yield positions across Aave, Morpho, and Pendle, you face fifteen to twenty signing operations per rebalancing cycle. At thirty seconds per signature, that is seven to ten minutes of overhead. For time-sensitive rate arbitrage, this latency is prohibitive.
Software wallets sign in under two seconds. MetaMask, Rabby, and Rainbow wallet all support transaction batching and one-click approvals. This makes them the default choice for active DeFi users. The trade-off is that the key lives on an internet-connected device. Phishing risk increases. Malware risk increases. Most DeFi users accept this trade-off because the alternative is operational paralysis.
Smart contract wallets eliminate single points of failure but introduce coordination overhead. A 2-of-3 Safe requires two signers to approve every transaction. For frequent rebalancing, this is unworkable. For large capital allocations or protocol treasury management, it is necessary.
### Composability Risk
Modern yield farming frequently involves looping assets across multiple interconnected protocols. You deposit ETH into Lido to receive stETH. You deposit stETH into Aave as collateral. You borrow USDC against that collateral. You deposit USDC into Curve. A vulnerability, depeg, or exploit in just one underlying smart contract can cascade through the system and result in total loss.
Wallet choice does not prevent composability risk, but it determines your ability to respond. In [the first hour of an exploit](https://altcoininvestor.com/defi-exploit-what-to-do/), 54% to 93% of funds drain in the first five minutes. If your signing workflow requires connecting a hardware wallet, navigating to the protocol interface, and confirming multiple transactions, you will not exit in time. Software wallets with pre-approved transaction templates let you withdraw in under sixty seconds. This is the difference between preserving capital and losing it.
### Custody Concentration Risk
If you hold all assets in a single custodial wallet, you concentrate risk in one platform. FTX users learned this in November 2022\. Celsius users learned it in June 2022\. When the platform fails, every position disappears simultaneously.
Self-custody distributes risk, but it does not eliminate it. If you hold all assets in a single MetaMask wallet and the seed phrase is compromised, every position is lost. Best practice: separate wallets for different risk tiers. High-value long-term holdings in hardware wallets. Active DeFi positions in software wallets. Large allocations in multisig or MPC setups.
## What Matters For Income-Focused Users
Wallet architecture determines who controls capital and who signs transactions. For yield position management, this translates to three operational constraints.
First, custodial wallets eliminate signing overhead but introduce platform counterparty risk. If the platform fails, your yield position is lost. Non-custodial wallets eliminate platform risk but require operational discipline. You must secure the key, verify every transaction, and understand the contract interaction before signing.
Second, hardware wallets protect against remote key extraction but slow transaction flow. Software wallets sign faster but expose keys to device compromise. Smart contract wallets eliminate single points of failure but introduce coordination overhead. The correct choice depends on position size, rebalancing frequency, and acceptable downside risk.
Third, composability risk compounds across protocols. A vulnerability in one contract can cascade through an entire yield stack. Wallet choice determines your ability to respond. Pre-approved withdrawal templates and fast signing workflows preserve capital during exploits. Hardware wallets with thirty-second signing latency do not.
The income mechanism here is straightforward. Understanding custody models prevents loss from exchange failures, phishing, or seed phrase compromise. The yield you preserve is the yield you keep. Using the [best wallet for multi-protocol yield](https://altcoininvestor.com/best-crypto-wallet/) means matching your custody model to your operational requirements. For most active DeFi users, that means software wallets for frequent positions and hardware wallets for long-term holdings.
## The Takeaway
Wallets manage private keys, not coins. The coins remain on the blockchain. The wallet proves you control them by signing transactions with the private key. Custodial wallets give the key to a third party. Non-custodial wallets put the key in your hands. Hardware wallets secure keys in tamper-resistant chips. Software wallets store keys on your device. Smart contract wallets enforce signing rules on-chain. MPC splits keys across multiple systems. Multisig requires multiple keys to sign. Each model trades security against speed. For yield position management, the correct wallet depends on position size, rebalancing frequency, and acceptable downside risk. Most active DeFi users need software wallets for frequent positions and hardware wallets for long-term holdings. The specific failure mode is signing a malicious transaction or losing the seed phrase. Transaction preview tools reduce the first risk. Redundant backups reduce the second. The mechanism is not magic. It is key management with specific operational trade-offs.
## Frequently Asked Questions
### Do cryptocurrency wallets actually store coins?
No. Wallets store private keys that prove ownership of on-chain assets. The coins remain on the blockchain. The wallet holds the cryptographic key that lets you sign transactions to move those coins. When you transfer funds from a wallet, you are signing a transaction with your private key, not moving physical or digital coins from one storage location to another.
### What is the difference between custodial and non-custodial wallets?
Custodial wallets are managed by a third party like Coinbase or Kraken. The platform holds your private key and signs transactions on your behalf. Non-custodial wallets give you full control over the private key. You sign every transaction yourself. Custodial wallets introduce platform counterparty risk but eliminate personal key management responsibility. Non-custodial wallets eliminate platform risk but require you to secure the key and verify every transaction before signing.
### Why are hardware wallets considered more secure than software wallets?
Hardware wallets store private keys in a dedicated device with a tamper-resistant secure element. The key never leaves the device. When you sign a transaction, the wallet signs it inside the secure element and returns only the signed transaction to your computer. This protects against remote key extraction and malware. Software wallets store keys on internet-connected devices, encrypted but accessible to the operating system. If the device is compromised, the key can be extracted.
### What is a multisig wallet and when should I use one?
A multisig wallet requires multiple cryptographic signatures from different private keys to execute a transaction. A 2-of-3 setup means any two out of three designated keys can approve a transaction. This eliminates single points of failure. If one key is lost or compromised, the other keys can still move funds. Multisig is appropriate for large capital allocations, protocol treasuries, or shared custody scenarios where no single individual should control funds unilaterally.
### Can I lose my cryptocurrency if I lose my wallet?
If you lose the device that holds your wallet, you can recover access using your seed phrase or recovery phrase. This 12-to-24-word phrase is generated when you create the wallet and can recreate your private key on a new device. If you lose both the device and the seed phrase, there is no recovery mechanism. The funds are permanently inaccessible. Lost private keys account for approximately 20% of all Bitcoin, representing billions in unrecoverable funds. Custodial wallets do not have this risk because the platform holds the key, but they introduce platform counterparty risk instead.
Tool mentioned above
Ledger
Ledger devices display the full transaction on their own screen before you approve it, which is what stops an approval exploit at the point it matters.
[See Ledger devices](https://shop.ledger.com/?r=90612ff43561)
We may earn a commission if you sign up through this link, at no cost to you. It does not change what gets recommended.
The Weekly Yield Report
You have just decomposed five wallet custody models and their specific failure modes for yield position management. Those trade-offs will shift as signing technology and exploit vectors evolve.
Every Thursday: where crypto yield actually is - stablecoins, liquid staking and DeFi lending, with the risk named next to the rate and what changed since last week.
[Get it free every Thursday](#/portal/signup)
Free. No trade calls, no allocations, no hype. Unsubscribe in one click.
### Best Crypto Wallets For Multi-Protocol Yield: Ranked By Signing Speed And Chain Coverage
URL: https://altcoininvestor.com/best-crypto-wallet/
Last updated: 2026-10-07T18:00:06.000Z
## The Decision You Are Making

If you are managing yield positions across protocols, your wallet is not just storage. It is your transaction execution layer. The wallet you choose determines how fast you can rebalance into a rate-sensitive opportunity, whether you can access the chains your yield position lives on, and how likely you are to lose funds to a signing error or phishing attack during a hurried approval.
Hardware wallets keep your keys offline and eliminate remote exploit risk. The trade-off is slower transaction flow. Every signature requires a physical device confirmation. Mobile wallets and browser extensions sign transactions in milliseconds. The trade-off is that your keys live in software, exposed to phishing, malicious dApps, and clipboard hijacking.
For yield allocators, the optimal setup is not one wallet. It is a two-tier system: a hardware wallet holding the bulk of your capital and a hot wallet executing frequent transactions. This article decomposes the specific trade-offs in signing speed, chain coverage, dApp compatibility, and security architecture across hardware wallets, mobile wallets, and browser extensions. You will know which wallet fits your deployment frequency and risk tolerance by the end.
## Signing Speed: The Core Trade-off Between Security And Execution Velocity
Transaction signing speed is the primary friction point for active yield allocators. Every wallet architecture makes a specific trade-off between key exposure and confirmation latency.
### Hardware Wallets: Physical Confirmation Adds 15-45 Seconds Per Transaction
Ledger Flex, Trezor Safe 7, Tangem, and Keystone 3 Pro all share the same structural bottleneck. Your private key never touches the internet. To sign a transaction, you must physically connect the device (USB, Bluetooth, or NFC tap), review the transaction details on the device screen, and confirm with a button press or fingerprint scan.
For a single transaction, this adds 15 to 45 seconds depending on device boot time and connection method. For batch operations like approving a token, depositing into a vault, and staking the receipt token, you are looking at 1-2 minutes of total signing overhead. If you are chasing a funding rate arbitrage window that closes in minutes, hardware wallet latency can cost you the opportunity.
The security benefit is absolute. Keys stored in a Secure Element chip rated EAL5+ or EAL6+ cannot be extracted remotely. Ledger and Trezor devices require physical possession to compromise. Tangem cards have no firmware update mechanism, eliminating supply-chain and remote-flash attack vectors entirely. If you are holding $50,000 or more, the signing delay is worth the elimination of remote theft risk.
### Mobile Wallets And Browser Extensions: Sub-Second Signing With Key Exposure
MetaMask Mobile, Phantom, Rainbow, and Zerion sign transactions in under one second. Your private key is encrypted and stored on your phone or browser. When you approve a transaction, the app decrypts the key, signs, and broadcasts. No physical confirmation required.
This is fast enough for memecoin sniping on Solana, where Phantom users report near-instant confirmations. It is fast enough for rate-sensitive rebalancing between Aave, Compound, and Morpho when borrowing rates shift by 200 basis points in an hour. The cost is that your key lives in software, vulnerable to phishing sites, malicious browser extensions, clipboard hijackers, and any exploit that compromises your phone or laptop.
MetaMask's 100 million user base makes it the largest phishing target in crypto. Rabby Wallet mitigates this with pre-transaction simulation that shows exactly what a contract call will do to your balance before you sign. Phantom's 2026 update includes AI-powered transaction filtering that flags suspicious contract interactions. These are useful, but they do not eliminate the structural risk: if malware gets root access to your device, it can extract your key.
### Hybrid Setup: Hardware For Holdings, Hot Wallet For Execution
The optimal configuration for most yield allocators is a two-wallet system. Keep 70-90% of capital in a [hardware wallet](https://altcoininvestor.com/best-crypto-hardware-wallets/). Use a hot wallet funded with 10-30% of capital for daily execution. When the hot wallet balance drops below your comfort threshold, replenish it from the hardware wallet in a single batch transaction.
This structure gives you sub-second signing for time-sensitive moves while capping your hot wallet exposure to a fraction of total capital. If your hot wallet is compromised, you lose at most the working balance, not the entire position.
## Multi-Chain Coverage: Which Wallets Support The Networks Your Yield Lives On

Chain coverage determines whether you can access your yield positions at all. If your wallet does not support the network your vault is deployed on, you cannot interact with it. Here is the current fragmentation map.
### MetaMask: Broadest Native Support Across EVM, Solana, Bitcoin, TRON
MetaMask natively supports Ethereum, Linea, Base, Arbitrum, Optimism, Polygon, Avalanche, BNB Chain, Robinhood Chain, zkSync Era, Scroll, Mantle, Celo, Gnosis, Cronos, Aurora, Moonbeam, Moonriver, Sei, Monad, Solana, Bitcoin, and TRON. Additional non-EVM chains like Starknet and Cosmos are available via MetaMask Snaps, which are third-party modules that extend wallet functionality.
For yield allocators running positions across Ethereum Layer 2s, Solana perpetual funding strategies, and Bitcoin DeFi via wrapped assets, MetaMask offers the widest single-wallet coverage. The mobile app mirrors the browser extension's chain support and includes in-app swaps, perpetual futures, prediction markets, and hardware wallet pairing.
MetaMask remains the default DeFi wallet for a reason. It works with more dApps, more chains, and more protocols than any competitor. The ubiquity is also its largest attack surface. Phishing sites that mimic MetaMask approval flows are common. If you use MetaMask, treat every transaction approval as potentially hostile and verify contract addresses manually.
### Rabby: EVM-Only, But Best Transaction Simulation For DeFi Users
Rabby supports EVM chains only. No Bitcoin. No Solana. No TRON. If your yield strategy involves Solana perpetuals or Bitcoin-backed stablecoins, Rabby cannot access those positions.
Within EVM chains, Rabby offers the smoothest DeFi experience available. Automatic network switching means you never manually select the wrong chain when a dApp expects a different network. Pre-transaction simulation shows exactly what a contract call will do to your token balances before you approve. This eliminates most blind-signing risk.
For users primarily deploying capital into Ethereum Layer 2s, Curve pools, Aave markets, and Uniswap V3 LP positions, Rabby is the control panel. The browser extension is more fluid than the mobile app, which has been widely reported as less responsive for frequent DeFi use. If you are a desktop-first operator, Rabby is the better tool. If you rebalance from your phone, MetaMask or Phantom will feel faster.
### Phantom: Solana-Native Speed, Multi-Chain Expansion Underway
Phantom began as a Solana-only wallet and has since added Ethereum, Polygon, and Bitcoin. For users trading memecoins or deploying into Solana DeFi protocols like Drift, MarginFi, or Kamino, Phantom's near-instant transaction speed is unmatched. Token lists auto-detect new SPL tokens, and the UI is optimized for high-frequency swaps.
Phantom's Ethereum and Bitcoin support is newer and less mature than MetaMask's. If your primary activity is on Solana with occasional bridging to Ethereum, Phantom works. If you are running yield positions across 10+ EVM chains, MetaMask or Rabby will cover more ground.
Phantom's 2026 AI-powered transaction simulation flags suspicious contract interactions before you sign. This is a meaningful phishing defense, but it does not eliminate key exposure risk. Your private key still lives in software.
### Rainbow And Zerion: Ethereum-Centric With Strong Portfolio Tracking
Rainbow supports Ethereum and Polygon. Zerion supports 66 chains and integrates with 4,500+ DeFi protocols. Both wallets prioritize portfolio tracking and position visualization over raw chain coverage.
Zerion is particularly useful for yield allocators managing LP positions, staked tokens, and unclaimed rewards across dozens of protocols. The wallet aggregates your entire DeFi position set and lets you act on it in-app. If you are running 10+ simultaneous positions and need a single dashboard to monitor health and rebalance, Zerion is the best tracking and execution hybrid available.
Rainbow lacks a desktop version, which limits its appeal for users who prefer managing assets on a larger screen. If you are mobile-first and your yield positions live primarily on Ethereum and Polygon, Rainbow is clean and open-source. If you need broader chain coverage, MetaMask or Zerion will serve you better.
### Hardware Wallets: Broad Token Support, Narrow dApp Integration
Ledger supports more than 5,500 cryptocurrencies through Ledger Live and integrates natively with 15+ staking protocols. Trezor supports thousands of coins and tokens. Tangem supports 93 networks and 16,000+ tokens. Keystone 3 Pro supports 15,000+ tokens across 50+ chains.
Token support is not the bottleneck. The bottleneck is dApp integration. Tangem has no direct DeFi or dApp integration, which eliminates access to staking, LP deployment, and most yield strategies. Ledger and Trezor can connect to MetaMask and Rabby, allowing you to use the hardware wallet as a signing device while the browser extension handles dApp interaction. This is the standard workflow for yield allocators who want hardware security without sacrificing dApp access.
Keystone 3 Pro uses air-gapped QR code signing. You display the transaction as a QR code on your laptop, scan it with the Keystone device, review and sign on the device, then scan the signed transaction back to your laptop to broadcast. This eliminates all digital attack vectors but adds 30-60 seconds per transaction. For high-value, low-frequency moves like depositing $100,000 into a vault, the overhead is acceptable. For frequent rebalancing, it is prohibitively slow.
## dApp Compatibility: Which Wallets Work With The Protocols You Use
A wallet can support a chain without supporting the dApps deployed on that chain. dApp compatibility depends on wallet integration, WalletConnect support, and whether the protocol's frontend recognizes your wallet.
### MetaMask: Universal dApp Compatibility, Highest Phishing Risk
MetaMask is the default wallet connection for nearly every EVM dApp. Aave, Compound, Uniswap, Curve, Balancer, Yearn, Convex, Lido, Rocket Pool, and thousands of smaller protocols expect MetaMask. If a dApp supports only one wallet, it is MetaMask.
This ubiquity makes MetaMask the highest-value phishing target. Fake Aave frontends, malicious OpenSea clones, and token approval scams are all optimized for MetaMask users. The wallet's default UI prioritizes transaction flow speed over deep risk signals. You can approve a token spend limit of infinite tokens in two clicks. If you do not manually inspect the contract address and approval amount, you will eventually sign a malicious transaction.
MetaMask's integration with hardware wallets (Ledger, Trezor, Keystone) mitigates this. You can use MetaMask as the dApp interface while your Ledger signs the transaction. This gives you MetaMask's compatibility with hardware wallet security. The signing flow is slower, but the key never touches software.
### Rabby: Pre-Signing Simulation Reduces Blind Approval Risk
Rabby shows you what a transaction will do before you sign it. If a contract call will drain your wallet, Rabby displays the outgoing token transfer in red before you approve. This does not eliminate phishing risk. A sophisticated attacker can still trick you into approving a malicious contract. But it eliminates the most common attack vector: blind approvals of token spends with no user-readable explanation of what the contract will do.
Rabby's automatic network switching is the other major compatibility advantage. If you are on Ethereum mainnet and click a dApp button that expects Arbitrum, MetaMask will throw an error and ask you to switch networks manually. Rabby switches automatically. For users managing positions across 5-10 Layer 2s, this eliminates dozens of manual network changes per week.
### Tangem: No dApp Integration, Limited To Basic Transfers
Tangem has no direct integration with DeFi or dApps. You cannot connect a Tangem card to Uniswap, Aave, or Curve. The wallet supports sending and receiving tokens, but it does not support contract interactions. For yield allocators, this makes Tangem unusable as a primary wallet. It functions as cold storage for long-term holdings, not as an execution layer.
## Security Architecture: What Each Wallet Model Protects Against
Security is not a binary. Each wallet type protects against specific attack vectors and remains vulnerable to others. Here is the failure mode map.
### Hardware Wallets: Immune To Remote Exploits, Vulnerable To Physical Attacks
Ledger, Trezor, Tangem, and Keystone store private keys in a Secure Element chip rated EAL5+ or EAL6+. These chips are designed to resist physical tampering, power analysis, and fault injection attacks. Your key cannot be extracted remotely. Even if your laptop is fully compromised by malware, the malware cannot access the key stored on the hardware device.
The failure modes are physical. If an attacker steals your hardware wallet and has unlimited time, they can attempt to extract the key through invasive physical attacks. Ledger and Trezor devices include PIN protection and wipe mechanisms that erase the key after repeated failed login attempts. Tangem cards have no screen and no PIN entry, relying instead on a three-card backup system. If you lose one card, you still have two. If you lose two, your funds are unrecoverable.
Hardware wallets are also vulnerable to supply-chain attacks. If an attacker intercepts your device before delivery and replaces the firmware, they can steal your key when you initialize the wallet. Ledger and Trezor both provide firmware verification tools. Tangem has no firmware at all, which eliminates firmware-based attacks but also eliminates the ability to patch vulnerabilities via updates.
### Mobile And Browser Wallets: Vulnerable To Phishing, Malware, Clipboard Attacks
MetaMask, Phantom, Rabby, Rainbow, and Zerion encrypt your private key and store it on your device. The encryption is only as strong as your device's security. If malware gains root access, it can decrypt and exfiltrate your key. If you install a malicious browser extension that mimics your wallet's UI, it can intercept your seed phrase during wallet creation or recovery.
Clipboard hijacking is a common attack vector on mobile devices. You copy a wallet address to send funds. Malware silently replaces the address in your clipboard with the attacker's address. You paste and send funds to the wrong wallet. MetaMask and Phantom both warn users to verify addresses character-by-character before confirming, but many users skip this step.
Phishing is the largest threat surface. A fake Aave frontend asks you to approve a token spend. You approve. The malicious contract drains your wallet. Rabby's pre-transaction simulation and Phantom's AI filtering reduce this risk, but they do not eliminate it. The structural vulnerability is that your key lives in software and can be tricked into signing a malicious transaction if the UI looks legitimate.
### Hybrid Setup Caps Hot Wallet Exposure
The two-wallet system caps your software wallet exposure to a working balance. If your MetaMask wallet holds $5,000 and is compromised, you lose $5,000\. If your Ledger holds $50,000 and your laptop is fully compromised by malware, the malware cannot access the Ledger's keys. This is the same risk model used by institutional traders: a hot wallet for execution, cold storage for holdings.
## Who Each Wallet Is Right For
### Ledger Flex Or Trezor Safe 7: Best For Holdings Above $50,000
If you are holding more than $50,000 in crypto and rebalance infrequently (once per week or less), a hardware wallet should hold the majority of your capital. Ledger Flex costs $249 and includes an E Ink touchscreen for transparent transaction signing. Trezor Safe 7 costs $169 and includes Bluetooth, wireless charging, and IP54 dust and splash protection.
Both wallets integrate with MetaMask and Rabby, allowing you to use them as signing devices for dApp interactions. This gives you hardware security without sacrificing dApp access. The signing flow is slower, but for infrequent, high-value transactions, the security trade-off is worth it.
### Tangem: Best For Long-Term Cold Storage, Not Active Yield
Tangem's $69.90 three-card set is the cheapest hardware wallet with EAL6+ security. The cards are waterproof, dustproof, and have no firmware to exploit. They are ideal for long-term storage of assets you do not plan to move frequently. The lack of dApp integration makes them unusable for yield deployment. If you are holding Bitcoin, Ethereum, or stablecoins for years without touching them, Tangem is the lowest-friction cold storage option. If you are managing active yield positions, Tangem will not work.
### MetaMask Mobile Or Browser Extension: Best For Multi-Chain Yield Allocators
If you are managing yield positions across Ethereum, Arbitrum, Optimism, Polygon, Solana, and Bitcoin, MetaMask offers the broadest single-wallet coverage. The mobile app and browser extension support the same chains, and both integrate with hardware wallets for security-sensitive transactions.
MetaMask is the right choice for users who prioritize compatibility over security and are comfortable with the phishing risk. Pair it with a Ledger or Trezor for holdings, and use MetaMask as your hot wallet for frequent execution. This gives you the best of both models.
### Rabby: Best For EVM-Only DeFi Power Users
If your yield strategy is EVM-only and you interact with 5-10 protocols daily, Rabby is the best execution tool available. Automatic network switching eliminates manual errors. Pre-transaction simulation eliminates most blind-signing risk. The browser extension is faster and more responsive than the mobile app, so this is a desktop-first tool.
Rabby does not support Solana, Bitcoin, or TRON. If your strategy involves those chains, you will need a second wallet. But for Ethereum Layer 2 yield farmers, Rabby is the control panel that MetaMask should have been.
### Phantom: Best For Solana Traders And Yield Farmers
If your primary activity is on Solana, Phantom offers the fastest transaction signing available. Memecoin snipers, perpetual funding arbitrageurs, and Solana DeFi users report near-instant confirmations. Phantom's Ethereum and Bitcoin support is functional but secondary. If you are running yield positions on both Solana and Ethereum, you will likely use Phantom for Solana and MetaMask or Rabby for EVM chains.
### Zerion: Best For Multi-Protocol Position Tracking
If you are managing 10+ simultaneous positions across Ethereum, Arbitrum, Optimism, Polygon, and other EVM chains, Zerion is the best tracking and execution hybrid. The wallet aggregates LP positions, staked tokens, unclaimed rewards, and transaction history across 66 chains. You can monitor and rebalance your entire DeFi portfolio from a single interface. This is the tool for yield allocators who need a dashboard, not just a signing device.
## My Recommendation
Use a two-wallet system. Ledger or Trezor for holdings above $50,000\. MetaMask or Rabby as your hot wallet for daily execution, funded with 10-30% of total capital. Connect your hardware wallet to MetaMask or Rabby for high-value transactions. This gives you sub-second signing for time-sensitive moves and hardware security for bulk holdings.
If you are EVM-only, use Rabby. If you are multi-chain, use MetaMask. If you are Solana-primary, use Phantom for Solana and MetaMask for everything else. If you are managing 10+ positions and need tracking, add Zerion as a secondary interface.
Do not use Tangem for active yield. It has no dApp integration. Do not use a single hot wallet for holdings above $50,000\. The phishing risk is too high. Do not use a hardware wallet as your only wallet if you rebalance more than once per day. The signing latency will cost you opportunities.
The optimal setup is not one wallet. It is a security-tiered execution layer that matches signing speed to transaction frequency and exposure to capital at risk.
## The Takeaway
Your wallet choice determines how fast you can execute, which chains you can access, and how likely you are to lose funds to phishing or malware. Hardware wallets eliminate remote exploit risk but add 15-45 seconds per transaction. Hot wallets sign in under one second but expose your key to software-based attacks. The optimal configuration for most yield allocators is a two-wallet system: hardware for holdings, hot wallet for execution. MetaMask offers the broadest chain coverage. Rabby offers the best DeFi transaction simulation. Phantom offers the fastest Solana signing. Tangem offers the cheapest cold storage but no dApp access. Match your wallet to your deployment frequency and capital at risk. The trade-off is structural, not optional.
## Frequently Asked Questions
### What is the safest crypto wallet for DeFi yield farming?
Hardware wallets like Ledger Flex and Trezor Safe 7 offer the highest security for DeFi yield farming by storing private keys offline in Secure Element chips rated EAL5+ or EAL6+. This eliminates remote exploit risk. However, for active yield farming requiring frequent transactions, use a hybrid setup: hardware wallet for bulk holdings (70-90% of capital) and a hot wallet like MetaMask or Rabby for daily execution (10-30% of capital). Connect your hardware wallet to MetaMask for high-value transactions to maintain security while preserving dApp compatibility.
### Which crypto wallet supports the most blockchains for yield farming?
MetaMask offers the broadest native blockchain support for yield farming, covering Ethereum, Solana, Bitcoin, TRON, and major Layer 2 networks including Arbitrum, Optimism, Base, Polygon, Avalanche, BNB Chain, zkSync Era, and Scroll. For EVM-only strategies, Rabby provides superior transaction simulation and automatic network switching across all Ethereum Layer 2s. Zerion supports 66 chains and 4,500+ DeFi protocols with integrated portfolio tracking, making it ideal for users managing 10+ simultaneous positions across multiple protocols.
### How do hardware wallets slow down DeFi transaction signing?
Hardware wallets add 15-45 seconds per transaction because every signature requires physical device confirmation. You must connect the device via USB, Bluetooth, or NFC, review transaction details on the device screen, and manually approve with a button press or fingerprint scan. For batch operations like approving tokens, depositing into vaults, and staking receipt tokens, total signing overhead reaches 1-2 minutes. This latency can cost rate-sensitive arbitrage opportunities but eliminates remote key extraction risk entirely, making it worthwhile for holdings above $50,000.
### Can Tangem wallet be used for active DeFi yield strategies?
No. Tangem has no direct integration with DeFi protocols or dApps, eliminating access to staking, liquidity pool deployment, and most yield strategies. While Tangem supports 93 networks and 16,000+ tokens with EAL6+ security at $69.90 for a three-card set, it only handles basic send and receive transactions. The cards cannot connect to Uniswap, Aave, Curve, or other DeFi protocols. Tangem works as cold storage for long-term holdings you do not plan to move frequently, not as an execution layer for active yield farming.
### What is the main security risk of using MetaMask for yield farming?
MetaMask's main security risk is that private keys are encrypted and stored in software on your device, making them vulnerable to phishing attacks, malicious browser extensions, clipboard hijacking, and malware that gains root access. MetaMask's 100 million user base makes it the largest phishing target in crypto. Attackers create fake DeFi frontends that mimic legitimate protocols to trick users into approving malicious token spend contracts. Mitigate this risk by pairing MetaMask with a hardware wallet for signing, manually verifying all contract addresses before approval, and limiting your MetaMask balance to 10-30% of total capital.
Tool mentioned above
Ledger
Ledger devices display the full transaction on their own screen before you approve it, which is what stops an approval exploit at the point it matters.
[See Ledger devices](https://shop.ledger.com/?r=90612ff43561)
We may earn a commission if you sign up through this link, at no cost to you. It does not change what gets recommended.
The Weekly Yield Report
You have just compared hardware wallets, mobile wallets, and browser extensions ranked by signing speed, chain coverage, and dApp compatibility. New wallets launch and security models evolve every quarter.
Every Thursday: where crypto yield actually is - stablecoins, liquid staking and DeFi lending, with the risk named next to the rate and what changed since last week.
[Get it free every Thursday](#/portal/signup)
Free. No trade calls, no allocations, no hype. Unsubscribe in one click.
### Morpho Lending And Borrowing: How P2P Matching Improves Rates Over Compound And Aave
URL: https://altcoininvestor.com/morpho-loans/
Last updated: 2026-10-03T23:06:12.000Z
## What Morpho Does and Why the Rate Is Better

The Morpho protocol routes stablecoin and ETH deposits through a peer-to-peer matching layer on top of Aave and Compound, and when a match is made, the lender earns more and the borrower pays less. The mechanism is simple. Aave might advertise a 3% supply rate and a 5% borrow rate. The 2% spread is the cost of pooled liquidity. Morpho matches a lender with a borrower directly at 4% - the supplier gains 1%, the borrower saves 1%, and no pooled capital is required. When no peer-to-peer match exists, Morpho routes unmatched capital into the underlying Aave or Compound pool, so funds earn at least the base protocol rate.
The rate improvement is typically 0.5 to 2 percentage points annually on matched positions. USDC supply APY on Morpho vaults currently ranges from 4.0% to 8.5%, compared to 4.1% on Aave V3 and 2.6% on Compound V3\. The premium is structural and moves with borrow demand - it is not a fixed gap. You receive the higher rate only when your capital is matched. Unmatched portions earn the underlying pool rate until a borrower appears.
This is not a new income mechanism. European banking employed direct bill discounting and matched deposit-loan books for centuries before pooled savings accounts became standard. The difference was operational cost. Matching individual depositors with borrowers was expensive when done manually. Smart contracts make direct matching cheap enough to be competitive with pooled protocols. The rate improvement reflects the removal of the pooled liquidity premium, not a new source of yield.
## How Matching Works and What Happens When It Fails

When you deposit USDC into a Morpho vault, the vault curator allocates your capital across one or more Morpho Blue markets. Each market specifies a collateral asset, a loan asset, a loan-to-value ratio, an oracle, and an interest rate curve. If a borrower requests a loan in that market and sufficient lender capital is waiting, Morpho matches the two sides directly. The matched lender earns the peer-to-peer rate - higher than the underlying Aave or Compound supply rate. The matched borrower pays the peer-to-peer rate - lower than the underlying borrow rate. Both sides gain from the spread capture.
If no borrower appears, your deposit does not sit idle. Morpho routes unmatched capital into the pooled market within Morpho Blue, or it falls back to Aave or Compound, depending on vault configuration. This fallback mechanism ensures you always receive at least the base protocol rate. The advertised yield on Morpho vaults reflects a weighted average of matched and unmatched positions across all markets the curator selected. High advertised APY usually signals high matching utilization or exposure to riskier markets with higher base rates.
The matching mechanism itself is immutable. Morpho Blue's core contract is 650 lines of Solidity, heavily audited, and cannot be upgraded. This is the opposite architectural choice from Aave, where the protocol retains upgrade authority. The trade-off is that Morpho cannot patch a bug in the core matching logic without redeploying an entirely new contract. So far, the immutable design has held. The protocol has scaled from zero to $11.8 billion in total deposits in two years without a core contract failure.
## The Curator Risk You Take for the Rate Bump

Morpho Vaults are managed by third-party curators who select which markets to allocate your capital into, when to rebalance, and how much exposure to take in each market. The curator's allocation choices determine your actual yield and your actual risk. A skilled curator will prioritize high-matching markets with strong collateral and conservative loan-to-value ratios. A poor curator might chase advertised yield into long-tail collateral markets with misconfigured oracles or low liquidity.
On October 13, 2024, the Morpho PAXG/USDC market was exploited due to an oracle misconfiguration that set the price of gold far above its real market value. The total loss was $230,000\. The exploit was possible because anyone can create a Morpho Blue market, including markets with broken oracles or junk collateral. Direct depositors who vetted the market before supplying would have noticed the oracle issue. Vault depositors who trusted an inexperienced or careless curator absorbed the loss. The structural lesson is that Morpho's isolation design contains contagion - a bad oracle on one Blue market cannot contaminate another - but it does not prevent loss within the affected market.
The curator acts as your market selection agent. If the curator misjudges collateral quality, underestimates liquidation risk during volatility, or allocates into a market with insufficient liquidity to exit, your yield will suffer or your principal will be exposed. Mitigation requires vetting the curator before you deposit. Stick to vaults managed by recognized entities with a public track record. Avoid anonymous curators or vaults that advertise APY significantly above the market average without explaining the source of the premium.
## When to Use Morpho Instead of Aave or Compound
Use Morpho when you are deploying $1 million to $10 million in stablecoin yield and the 0.5 to 2 percentage point rate improvement outweighs the additional curator and oracle risk. On a $5 million USDC allocation, a 1.5% annual rate advantage translates to $75,000 in additional income. That premium justifies the time required to vet the curator and monitor vault allocations. On a $50,000 allocation, the same 1.5% premium yields $750 annually, which may not justify the additional operational overhead.
Use Aave when you need liquidity above $10 million or when your allocation is large enough that slippage and withdrawal queue risk matter more than rate. Aave V3 holds roughly $14.6 billion in total value locked across 15 chains. Morpho Blue holds $11.8 billion, concentrated on Ethereum and Base. For allocations above $10 million, Aave's deeper liquidity reduces the risk of withdrawal delays during volatility. For allocations below $1 million, Compound V3 offers the cleanest governance structure and the longest operational track record, which may appeal to treasury allocators prioritizing regulatory clarity over yield.
Use Morpho when you are a trader moving high volumes of stablecoins and want to minimize the cost of carry. If you borrow $2 million USDC against ETH collateral to deploy into a farming strategy, a 1% reduction in borrow cost saves $20,000 annually. That saving is real income recovered from the spread, not speculative token emissions. The borrow rate improvement on Morpho is the mirror image of the supply rate improvement - both reflect the removal of the pooled liquidity premium.
Institutional flows have already validated this use case. Over the past year, roughly 25% of active loans on Morpho originated from enterprise integrations - companies embedding Morpho into their own products. Another 15% of lent assets come from exchanges and fintechs using Morpho as backend lending infrastructure. Coinbase and MoonPay added Morpho touchpoints in 2025, signaling professional flows into DeFi lending venues. These allocators are not chasing advertised APY. They are capturing the structural rate improvement peer-to-peer matching delivers, at scale, with curator risk they can vet internally.
## Smart Contract Risk and the Audit Record
Morpho Blue has undergone at least 25 smart contract audits by recognized firms including Trail of Bits, Spearbit, and OpenZeppelin. Formal verification has been applied using Certora, and one ongoing bug bounty program offers $2.5 million through Cantina. Multiple independent audits reduce risk, but they do not guarantee that a DeFi protocol is exploit-proof. The PAXG/USDC oracle exploit in October 2024 was not a smart contract vulnerability - it was a market configuration error that audits cannot prevent. The curator who allocated into that market either missed the oracle misconfiguration or underestimated its importance.
The isolation design Morpho Blue introduced means a failure in one specific market does not affect the rest of the protocol. A bad oracle on one Blue market cannot contaminate another. A risky long-tail collateral asset cannot endanger USDC suppliers in a different market. This is the opposite design choice from Aave's monolithic pool, where a single bad collateral listing has historically had blast-radius implications across the entire protocol. The trade-off is that Aave's governance vets every collateral asset before listing, while Morpho allows anyone to create a market. Aave protects you from yourself. Morpho gives you the tools and expects you to vet the market before you supply.
Smart contract risk, oracle risk, and liquidation risk are inherent to all on-chain lending. During market volatility, if your loan-to-value rises, positions can be liquidated. Active monitoring is required. The difference between Morpho and Aave is not the presence or absence of risk - it is the location of responsibility. Aave's governance takes responsibility for vetting collateral. Morpho's curators take responsibility for vetting markets. If you deposit into a vault, you delegate that responsibility to the curator. If you deposit directly into a Morpho Blue market, you take that responsibility yourself.
[Understanding who sets risk parameters and what can take your principal](https://altcoininvestor.com/morpho-lending/) matters before you route capital through any lending protocol. Morpho's immutable core contract and isolation design mitigate protocol-level contagion risk, but they do not eliminate market-level risk. The curator's allocation choices determine whether the additional 0.5 to 2 percentage points you earn compensates for the additional complexity you accept.
## What Happens to Fees and Where Revenue Goes
The Morpho protocol does not take fees at this time. It has no built-in protocol fees on borrowing, supplying, flash loans, liquidations, or most operations. A governance-activated fee switch exists and could enable a 0 to 25% fee on borrower interest payments in specific markets. If activated, those fees would accrue directly to the Morpho treasury, not to MORPHO token holders. Over the past 30 days, Morpho Blue generated $19.87 million in fees based on trailing 12-month data annualized to $205.68 million. All of those fees were paid to lenders, not the protocol.
This fee structure is the inverse of Aave, where the protocol retains a portion of interest payments to fund the reserve factor and compensate governance participants. The absence of protocol fees on Morpho means the full spread captured by peer-to-peer matching flows to lenders and borrowers. That is why the advertised rates are higher. There is no protocol take. The trade-off is that Morpho has no revenue stream to fund insurance reserves, cover bad debt, or compensate governance participants. If a market suffers a loss, the protocol has no reserve fund to make lenders whole. The curator's allocation strategy is your only line of defense.
The MORPHO governance token has a fixed supply of one billion and does not accrue fees. Token holders vote on interest rate curves, risk parameters for supported assets, and protocol upgrades, but they do not receive a share of protocol revenue because there is no protocol revenue. This is a different value accrual model from Aave, where staked AAVE captures a portion of protocol fees. The absence of fee accrual to token holders means the MORPHO token is a governance instrument, not a yield instrument. If you want income from Morpho, you supply capital into vaults or markets. You do not stake the governance token.
## The Takeaway
Morpho's peer-to-peer matching delivers a structural rate improvement of 0.5 to 2 percentage points annually on matched positions by removing the pooled liquidity premium Aave and Compound charge. The mechanism is sound. The architecture is audited. The isolation design contains contagion. The risk you take for the rate bump is curator risk. A skilled curator who vets markets, monitors oracle quality, and rebalances during volatility will deliver the advertised yield with acceptable exposure. A careless curator who chases APY into misconfigured markets or long-tail collateral will expose your principal to loss no audit can prevent. The decision to route capital through Morpho depends on allocation size, your ability to vet curators, and whether the additional income justifies the additional operational complexity. For allocations between $1 million and $10 million, the rate improvement usually justifies the effort. Below $1 million, [the decision depends on allocation size, rebalancing frequency, and tolerance for curator risk](https://altcoininvestor.com/best-defi-lending-platform/). Above $10 million, Aave's liquidity depth typically matters more than Morpho's rate premium. The peer-to-peer matching mechanism has proven itself at scale. The curator risk has not disappeared.
## Frequently Asked Questions
### How much better are Morpho rates compared to Aave and Compound?
Morpho typically delivers 0.5 to 2 percentage points better annual rates on matched positions. USDC supply APY on Morpho vaults currently ranges from 4.0% to 8.5%, compared to 4.1% on Aave V3 and 2.6% on Compound V3\. The premium reflects spread capture from peer-to-peer matching and moves with borrow demand. Unmatched portions earn the underlying pool rate until a borrower appears.
### What is curator risk in Morpho Vaults?
Curator risk is the exposure you take when a third-party manager selects which markets your capital flows into. The curator's allocation choices determine your actual yield and risk. A skilled curator vets markets, monitors oracle quality, and rebalances during volatility. A careless curator might chase yield into misconfigured markets or long-tail collateral. The October 2024 PAXG/USDC oracle exploit resulted in a $230,000 loss for vault depositors who trusted a curator that missed the oracle misconfiguration.
### When should I use Morpho instead of Aave?
Use Morpho when you are deploying $1 million to $10 million in stablecoin yield and the 0.5 to 2 percentage point rate improvement outweighs the additional curator and oracle risk. Use Aave when you need liquidity above $10 million or when withdrawal queue risk during volatility matters more than rate. Below $1 million, the additional operational overhead of vetting curators may not justify the income premium.
### Does Morpho charge protocol fees?
The Morpho protocol does not take fees at this time. A governance-activated fee switch exists and could enable a 0 to 25% fee on borrower interest payments in specific markets, but it is currently inactive. Over the past 30 days, Morpho Blue generated $19.87 million in fees, all of which were paid to lenders. The absence of protocol fees means the full spread captured by peer-to-peer matching flows to lenders and borrowers.
### What happens if a Morpho market fails?
Morpho Blue's isolation design means a failure in one market does not affect other markets. A bad oracle or risky collateral in one Blue market cannot contaminate USDC suppliers in a different market. However, Morpho has no protocol reserve fund to cover losses. If a market suffers an exploit or liquidation cascade, vault depositors absorb the loss unless the curator exits the affected market before the failure materializes.
The Weekly Yield Report
You have just compared Morpho's 0.5 to 2 percentage point rate improvement against Aave and Compound. Those numbers will shift as borrow demand and curator allocations change.
Every Thursday: where crypto yield actually is - stablecoins, liquid staking and DeFi lending, with the risk named next to the rate and what changed since last week.
[Get it free every Thursday](#/portal/signup)
Free. No trade calls, no allocations, no hype. Unsubscribe in one click.
### Staking Rewards Explained: How They're Calculated And What Reduces Your Actual Return
URL: https://altcoininvestor.com/staking-rewards-explained-calculation-reductions/
Last updated: 2026-10-03T22:03:50.000Z
## The Number You See Isn't The Number You Keep

Ethereum shows 3.8% staking APY. Solana advertises 7%. Avalanche promises 9%. None of these numbers reflect what you actually earn after validator commission, network penalties, and the inflation that dilutes your stake while you sleep.
The gap between advertised yield and realized return is structural. Understanding where staking rewards come from and what eats into them determines whether you're gaining purchasing power or just accumulating more of a diluting asset.
## Where Staking Rewards Actually Come From
Staking rewards have three sources. The composition varies by chain, but every proof-of-stake network combines these components.
**Block rewards.** New tokens issued by the protocol to validators who successfully propose blocks and attest to their validity. This is inflation-funded yield. Ethereum issues roughly 0.5% of supply annually at current stake levels. Cosmos issues closer to 12%. The difference matters.
**Transaction fees.** Priority fees paid by users to have their transactions included quickly. On Ethereum, validators earn consensus-layer fees for attestations and execution-layer priority tips for block proposals. During high activity, these fees can double base yield. During low activity, they approach zero.
**MEV (maximal extractable value).** Revenue from reordering, inserting, or censoring transactions within a block. Validators running MEV-Boost on Ethereum capture an additional 0.5% to 1% annually. Without it, you forfeit that income to someone else who will propose the next block.
The advertised APY you see aggregates all three, averaged across recent epochs. It does not account for variance. One validator proposing a block during a DeFi liquidation cascade earns multiples of the average. Another proposing during low activity earns a fraction. The number is an estimate, not a guarantee.
### How Gross APY Gets Calculated
Network APY starts with total rewards distributed in a given period, divided by total staked supply. If Ethereum distributed 500,000 ETH in rewards last year and 39 million ETH is staked, the gross APY is roughly 1.28%. Add execution-layer fees and MEV, and you approach 3-4%.
But that's network-wide. Your actual share depends on validator effectiveness. A validator with 99.9% uptime capturing MEV earns more than one with 95% uptime that misses high-value blocks. The protocol doesn't distribute rewards evenly. It pays for performance.
Ethereum's issuance scales inversely with the square root of total stake. As more ETH gets staked, per-validator rewards compress. At 25% of supply staked, base issuance yields roughly 3.2%. At 33%, it drops to 2.6%. If staking reaches 50%, base yield falls below 2%. The math is hardcoded.
## What Reduces Your Net Return
Five mechanisms cut into gross APY. Most staking dashboards show the top-line number and bury the rest in fine print.
### Validator Commission
If you're delegating tokens instead of running your own node, the validator takes a cut. Commission typically ranges from 5% to 10% on most chains. Solana validators charge 0% to 10%. Cosmos validators go higher, often 5% to 20%.
A 10% commission on 8% gross APY leaves you with 7.2%. That's before any other reductions.
Liquid staking protocols stack another layer. [Lido charges 10% of staking rewards](https://altcoininvestor.com/what-are-liquid-staking-tokens/) and passes the rest to stETH holders. Rocket Pool charges a different structure but achieves similar economics. Marinade on Solana takes roughly 6%.
ETF wrappers add a third fee. Ethereum staking ETFs charge management fees of 1.9% to 2.6% annually. If gross network yield is 3.2%, you're left with 0.6% to 1.3% before taxes and inflation. The stacking is intentional and disclosed, but most buyers don't compute the cumulative drag.
### Slashing Penalties
Slashing removes principal stake as punishment for malicious behavior or operational failures. The severity varies by chain and infraction type.
Ethereum slashing events are rare, affecting only 0.04% of validators. But when they occur, the penalty is immediate. A double-sign violation costs 1/4096 of effective balance, roughly 0.02%. Correlated slashing, where multiple validators fail simultaneously, triggers exponentially higher penalties. If 1% of validators get slashed in the same period, each loses up to 1% of stake. If 33% fail together, each validator can lose their entire 32 ETH.
Avalanche does not slash principal. Solana does not currently implement slashing, though proposals exist. Cosmos chains vary by implementation. When evaluating staking yield, check whether the chain socializes validator failure risk or isolates it.
The primary slashing cause is operational error: running duplicate validator keys across servers, software bugs during updates, or clock drift causing double attestations. Intentional attacks are nearly nonexistent. Competent infrastructure eliminates most risk, but the tail risk is nonzero.
### Downtime Penalties And Opportunity Cost
Simple downtime does not trigger slashing on major networks. Your validator just stops earning. But prolonged absence can lead to gradual balance reduction through inactivity leaks, especially if the network is not finalizing.
Missing an attestation forfeits the reward for that epoch. On Ethereum, a validator offline for one day loses roughly the same amount it would have earned during that period. The penalty is symmetric with the reward, but compounded across time.
Opportunity cost exceeds explicit penalties. A validator missing its block proposal during high MEV activity can forfeit $500 to $5,000 in a single slot. Uptime is the primary profit driver. Most networks require 99%+ availability. Falling below that threshold erodes returns faster than any fee.
Avalanche requires 80% uptime for reward eligibility. Fall below that, and you earn zero for the staking period. Solana's vote credits scale with participation. Miss votes, earn fewer credits, receive lower rewards. The math is forgiving for brief outages, punishing for sustained failures.
### Inflation Dilution
Staking rewards are not free money. They are paid in newly issued tokens. If token supply grows 5% annually and you earn 5% staking yield, your nominal balance increases but your share of network supply stays flat. You are treading water.
Real yield is nominal yield minus inflation. Ethereum issues roughly 0.5% annually and pays 3-4% gross yield, meaning real yield is positive. Cosmos issues 12% and pays 18.5% nominal, delivering 6.5% real yield if you're staking and roughly -12% if you're not.
Inflation punishes holders who do not stake. On high-inflation chains, staking is not optional. It's a defensive action to avoid dilution. The advertised APY looks generous until you realize half of it is just keeping pace with supply expansion.
[Ethereum stakers gain purchasing power relative to non-stakers](https://altcoininvestor.com/crypto-staking-returns-across-chains/). Solana stakers break even or gain modestly. Cosmos stakers earn real yield but face significant dilution risk if governance increases issuance. Always subtract inflation from APY before comparing yields across chains.
### Tax Drag
Staking rewards are taxable as income in most jurisdictions, due at the time of receipt, not when you sell. If you earn 100 tokens worth $3,000, you owe tax on $3,000 even if you never liquidate.
A U.S. investor in California (37% federal plus 13.3% state) earning 3.77% on Lido stETH pays 50.3% of rewards in taxes, leaving 1.84% after-tax nominal yield. Subtract 3.2% inflation (2026 U.S. CPI) and the real return is -1.31%. You are losing purchasing power while holding an appreciating number of tokens.
Tax-deferred accounts like IRAs can shelter staking income, but custodial fees often exceed the tax benefit at yields below 5%. Offshore structures reduce tax drag but introduce legal and operational complexity most individual stakers do not want.
Non-U.s. investors face different rates. Some jurisdictions do not tax staking rewards until disposal. Others treat them as income. The after-tax math determines whether staking is yield or theater.
## Worked Example: Ethereum Staking Through Lido
You stake 10 ETH through Lido at the start of 2026\. Gross network APY is 3.77%. Here's the return breakdown.
**Gross annual reward:** 10 ETH x 3.77% = 0.377 ETH
**Lido protocol fee (10%):** 0.377 x 0.10 = 0.0377 ETH
**Net reward after fee:** 0.377 - 0.0377 = 0.3393 ETH
**Effective APY:** 3.39%
Now apply slashing and downtime. Assume zero slashing events (historically accurate) and 99.5% uptime. Downtime costs roughly 0.5% of potential rewards, or 0.0017 ETH.
**Net reward after downtime:** 0.3393 - 0.0017 = 0.3376 ETH
**Adjusted APY:** 3.38%
Subtract Ethereum's 0.5% token inflation:
**Real yield (purchasing power):** 3.38% - 0.5% = 2.88%
Apply U.S. federal tax (37%) on the nominal 0.3376 ETH reward, valued at $7,500 (assuming $2,500 per ETH at year-end):
**Tax owed:** $7,500 x 0.37 = $2,775
**After-tax nominal return:** $7,500 - $2,775 = $4,725, or 1.89 ETH equivalent
If CPI inflation is 3.2%, subtract that from the after-tax nominal return to find real purchasing power gain. At 1.89%, you are losing ground.
This is the full-stack math. Advertised 3.77% becomes 1.89% after fees, taxes, and inflation. Most dashboards stop at step one.
## How To Evaluate A Validator Before Delegating
Validator commission is the visible fee. Performance is the hidden one. A 5% commission validator with 95% uptime underperforms a 10% commission validator with 99.9% uptime.
Check three metrics before delegating:
**Uptime history.** Most block explorers publish this. Look for 99.5% or higher over the trailing six months. Occasional dips are normal. Sustained underperformance is disqualifying.
**Slashing record.** Zero tolerance. If a validator has been slashed once, they have operational or security deficiencies. Find another.
**Execution-layer participation.** On Ethereum, validators not running MEV-Boost forfeit 0.5-1% annually. Check whether your validator is registered with Flashbots or another relay. If not, you are leaving money on the table.
Commission stacking is the other variable. [Centralized exchanges and liquid staking platforms](https://altcoininvestor.com/best-crypto-staking-platform/) often obscure the full fee by showing net APY instead of itemizing each layer. Compare net yield, not gross, when choosing a provider.
## When Low Fees Are A Red Flag
A 0% commission validator is either subsidizing operations temporarily to attract stake or cutting corners on infrastructure. Neither is sustainable.
Running a validator costs $100 to $500 per month for cloud infrastructure, plus engineering time for monitoring, updates, and incident response. A 0% commission on $100,000 of delegated stake earning 5% yields $5,000 annually in gross rewards. The validator earns nothing. The math does not work long-term.
Low-commission validators often compensate by maximizing MEV extraction aggressively, which introduces execution risk, or by running high validator counts on shared infrastructure, which increases correlated slashing risk. You are trading visible fees for invisible operational risk.
Sustainable commission on Ethereum is 5-10%. On Solana, 5-8%. Below that, investigate why.
## Chain-Specific Reward Structures
Ethereum distributes rewards through two layers. Consensus-layer rewards (attestations, sync committees, block proposals) pay in newly issued ETH. Execution-layer rewards (priority fees, MEV) pay from user transactions. Total APY is the sum. A validator not participating in execution-layer rewards forfeits 20-30% of potential income.
Solana combines inflation rewards with transaction fees but does not currently implement MEV markets the way Ethereum does. [Validator income comes primarily from inflation](https://altcoininvestor.com/how-to-start-staking-solana/), with fees as a smaller component. Starting in 2026, Solana's Vote Account V4 splits commission into inflation commission and block revenue commission, allowing validators to charge different rates for different income sources.
Cosmos chains rely heavily on inflation. Nominal APYs of 15-20% are common, but inflation often runs 10-12%. Real yield is the difference. Validators charge commission on gross rewards, not net-of-inflation, so you pay fees on dilution.
Avalanche does not slash principal, which reduces tail risk but also reduces validator accountability. Yield is lower, typically 8-10%, with inflation around 3-4%. Real yield is positive but compressed compared to higher-inflation chains.
## The Takeaway
Gross APY is a marketing number. Net return after validator commission, downtime, slashing risk, and inflation is the only number that determines whether you are gaining purchasing power. On Ethereum, real yield after all reductions is roughly 2-3% for solo validators and 1-2% for liquid staking token holders. On high-inflation chains like Cosmos, nominal 18% can collapse to 3-6% real once you subtract issuance and fees. Always subtract inflation before comparing yields across chains. Always verify validator uptime and execution-layer participation before delegating. And always calculate after-tax returns if you're staking in a taxable account, because the difference between 5% nominal and 2% after-tax real is the difference between building wealth and treading water.
## Frequently Asked Questions
### What is the difference between gross APY and net staking return?
Gross APY is the total reward distributed by the network before any deductions. Net return is what you actually keep after validator commission (typically 5-10%), downtime penalties, slashing risk, and token inflation. On Ethereum, a 3.8% gross APY often becomes 2-3% net for solo validators and 1-2% for liquid staking token holders after all reductions. Always calculate net return when comparing staking opportunities across chains or providers.
### How does validator commission reduce my staking rewards?
When you delegate tokens to a validator instead of running your own node, the validator charges a commission on rewards earned, typically 5-20% depending on the chain. A validator charging 10% commission on 8% gross yield leaves you with 7.2%. Liquid staking protocols add another layer, often taking 10% of rewards. Exchange-based staking or ETFs stack a third fee. Always check the cumulative commission across all intermediaries, not just the validator rate.
### Can I lose my staked tokens due to slashing?
Yes, but it is rare. Slashing removes principal stake as punishment for validator failures like double-signing or extended downtime. On Ethereum, only 0.04% of validators have been slashed, usually due to operational errors, not attacks. A typical slashing event costs 0.02% of stake, but correlated failures across many validators trigger exponentially higher penalties. Avalanche does not slash principal. Solana does not currently implement slashing. Always verify a validator's slashing history before delegating.
### Why does inflation matter when evaluating staking yield?
Staking rewards are paid in newly issued tokens, which dilutes total supply. If a chain issues 5% new tokens annually and pays 5% staking yield, your nominal balance grows but your share of supply stays flat. Real yield equals nominal yield minus inflation. Ethereum issues 0.5% and pays 3-4%, so real yield is positive. Cosmos issues 12% and pays 18.5%, delivering 6.5% real. Always subtract inflation to determine whether you are gaining purchasing power or just accumulating a diluting asset.
### What validator metrics should I check before staking?
Check uptime history (target 99.5%+ over six months), slashing record (zero tolerance for any past slashing), and execution-layer participation on Ethereum (validators without MEV-Boost forfeit 0.5-1% annually). Do not choose validators based solely on low commission. A 5% commission validator with 95% uptime underperforms a 10% commission validator with 99.9% uptime. Sustainable commission is 5-10% on Ethereum and 5-8% on Solana. Below that, investigate operational risk.
The Weekly Yield Report
You just saw how 3.8% gross APY becomes 1.9% net after fees, penalties, and inflation. Those numbers change every quarter as stake levels and network activity shift.
Every Thursday: where crypto yield actually is - stablecoins, liquid staking and DeFi lending, with the risk named next to the rate and what changed since last week.
[Get it free every Thursday](#/portal/signup)
Free. No trade calls, no allocations, no hype. Unsubscribe in one click.
### How Liquidity Pools Generate Yield And What IL Costs You
URL: https://altcoininvestor.com/liquidity-pools-crypto-yield-impermanent-loss/
Last updated: 2026-10-03T19:10:58.000Z
## Where Liquidity Pool Yield Actually Comes From

When you deposit ETH and USDC into a Uniswap pool, you become a liquidity provider and earn a share of every swap fee traders pay when they use that pool. The mechanism is straightforward: Uniswap v3 offers four standard fee tiers (0.01%, 0.05%, 0.30%, and 1%), and every trade executed in the pool you service generates a fee that is distributed proportionally to all liquidity providers based on their share of total pool liquidity. If you supply 2% of a pool's liquidity and the pool processes $10 million in daily volume at the 0.30% tier, you earn your proportional share of the $30,000 in daily fees.
The formula for your annual percentage yield from fees alone is: APY = (24h Volume × Fee Rate × 365) / TVL × 100%. A pool with $100 million in TVL and $5 million in daily volume at 0.30% generates roughly 5.475% base APY before any token incentives. That number represents the real yield component, the fee revenue paid by traders who need liquidity to execute their swaps. It is the only yield component that does not rely on token emissions or promotional subsidies.
Most pools also distribute token incentives on top of base fee yield. These emissions (often displayed as "reward APY" on [DeFi protocol dashboards](https://altcoininvestor.com/best-defi-protocols/)) are paid in the protocol's governance token and are typically promotional, designed to attract liquidity during a launch phase or to deepen liquidity in strategically important pairs. Reward APY can disappear when incentive programs end or when the protocol reduces emissions. Base APY, by contrast, persists as long as trading volume continues. The distinction matters because only base APY represents sustainable yield derived from actual economic activity.
## How Impermanent Loss Erodes Your Position

Impermanent loss is the opportunity cost you incur when the price ratio between the two tokens in your pool shifts away from the ratio at which you deposited. It is called impermanent because if the price ratio returns to the original level, the loss disappears. If it does not return, the loss becomes permanent when you withdraw.
The mechanism is inherent to the automated market maker (AMM) model, which relies on the constant product formula x × y = k, where x and y represent the quantities of the two assets and k is a constant. When traders buy one token from the pool, the AMM sells it from your position and buys more of the other token to maintain the product k. If ETH appreciates against USDC, the pool automatically sells your ETH as its price rises and accumulates more USDC. You end up holding less of the appreciating asset and more of the depreciating one. Had you simply held the two tokens in your wallet, you would have retained the original ratio and captured the full upside of the appreciating token.
The impermanent loss formula quantifies this: IL = 2 × √(price\_ratio) / (1 + price\_ratio) - 1\. For a 2x price move, impermanent loss is 5.72%. For a 5x move, it is 25.5%. The larger the price divergence, the greater the loss. A 1.25x move costs 0.61%; a 1.50x move costs 2.02%. These percentages represent the difference between the value of your LP position and the value you would have had if you simply held the tokens.
In practice, [over half of Uniswap v3 liquidity providers in volatile token pairs have been unprofitable](https://chain.link/article/impermanent-loss-defi) after accounting for impermanent loss. The headline APY displayed on protocol dashboards systematically overstates returns because it excludes impermanent loss entirely. When you deposit 1 ETH and 2,000 USDC, then later withdraw 0.5 ETH and 3,000 USDC, it is left to you to translate that into USD terms and calculate whether the fees you earned offset the value you lost by holding less ETH. Most dashboards do not perform that calculation for you.
## The Breakeven Analysis Most Dashboards Omit

The question that determines whether a liquidity position is profitable is whether fee income plus token incentives exceed impermanent loss. The formula is: Net Return = Fees + Incentives - Impermanent Loss. If impermanent loss is 5.72% and you earned 3% in fees over the same period, your net return is -2.72%. You lost money. If you earned 8% in fees, your net return is +2.28%. You profited.
Here is the breakeven timeline for a Uniswap v3 ETH/USDC pool at the 0.30% tier. Since December 2025, Uniswap governance activated protocol fees, which reduced LP earnings on the 0.30% tier from 0.30% to 0.25% (LPs now receive 0.25% per trade, with 0.05% routed to the protocol treasury). Assume the pool generates 0.25% in fees on your liquidity per trade, and daily volume is steady.
For a 2x price move (5.72% IL), you need approximately 23 days of fee revenue at an effective daily rate of 0.25% to break even. For a 3x price move (13.4% IL), you need roughly 54 days. For a 5x price move (25.5% IL), you need over 100 days. Those timelines assume constant volume and no further price divergence. If volume declines or if the price continues to move away from your entry ratio, breakeven recedes further.
Stablecoin pools present a different profile. Because both tokens are pegged to the same unit (typically USD), price divergence is minimal and impermanent loss is negligible. A USDC/USDT pool on Curve or Uniswap v4 can deliver 3-10% APY from fees and incentives without the IL drag that plagues volatile pairs. The trade-off is that base fee APY is lower because stablecoin pairs trade at tighter fee tiers (0.01% or 0.05% rather than 0.30%) to remain competitive. The yield is real, but it is smaller. The risk is that one of the stablecoins depegs, in which case [impermanent loss will appear where none was expected](https://altcoininvestor.com/what-is-impermanent-loss/).
## Concentrated Liquidity And IL Amplification
Uniswap v3 introduced concentrated liquidity, which allows liquidity providers to set custom price ranges for their positions (for example, ETH/USDC between $3,000 and $4,000). Concentrating your liquidity within a narrower range increases your share of fee revenue when the price stays inside that range, because your capital is deployed more efficiently than a full-range position spread across all possible prices.
The cost is that when the price moves outside your range, your position becomes 100% of one token and stops earning fees entirely. If ETH rises above $4,000, your position converts entirely to USDC, and you no longer participate in any trades until the price falls back into your range. If ETH keeps rising, you have exited the position at $4,000 and missed the entire subsequent appreciation. That outcome is impermanent loss in its most acute form: you sold the appreciating asset automatically as it rose, and you hold only the stablecoin.
Concentrated liquidity amplifies both fee yield and impermanent loss. A tight range (for example, ±10% around the current price) may capture 5x or 10x the fees of a full-range position, but it will also suffer greater impermanent loss if the price moves 20% in either direction. The gross fee accrual formula is: Gross Fee = f × V × (L\_position / L\_total) × E, where f is the fee tier, V is volume, and E approximates 1 / range width. A narrower range increases E, which increases your fee share, but it also increases the probability that price exits your range and you stop earning.
The strategic implication is that concentrated liquidity is most effective in range-bound or low-volatility markets where you can reasonably expect the price to remain within a defined band for weeks or months. In trending or highly volatile markets, concentrated positions tend to underperform full-range positions because they exit the market precisely when the price movement is largest. The fee income you earned while in range often fails to compensate for the opportunity cost of having been forced out of the appreciating token.
## Fee Tier Selection As Risk Management
The fee tier you select determines both the competitiveness of your pool (traders prefer lower fees) and the compensation you receive for impermanent loss risk. Uniswap v3's four standard tiers reflect increasing volatility and impermanent loss expectations: 0.01% for highly correlated pairs (such as USDC/USDT), 0.05% for stablecoin pairs, 0.30% for most volatile pairs (such as ETH/USDC), and 1% for exotic or highly volatile assets.
The 0.30% tier is the workhorse. It accounts for the majority of volume in non-stablecoin pairs because it balances trader cost with LP compensation. Since December 2025, LPs on this tier earn 0.25% per trade (down from 0.30%) due to the activation of protocol fees, which route 0.05% to the Uniswap treasury. The reduction lowers your breakeven timeline and makes it harder to offset impermanent loss in volatile pairs. If you were previously breaking even on a 2x price move after 20 days, you now need approximately 23 days under the same volume conditions.
Lower fee tiers attract higher average liquidity per wallet because the lower impermanent loss risk makes it safer to deploy large positions. Higher fee tiers attract smaller LPs who are willing to accept greater risk in exchange for higher fee revenue. The data shows that the 0.30% tier can generate more total fees than the 0.05% tier even when volume is six times lower, because the fee per trade is six times higher. As an LP, your choice of tier reflects your view on future volatility: if you expect the price to remain stable, select a lower tier to capture more volume; if you expect volatility, select a higher tier to ensure that fee income compensates for impermanent loss.
## Emission Sustainability And The Reward APY Trap
Most liquidity pools advertise two yield components: base APY (from trading fees) and reward APY (from token emissions). The combined figure is what you see displayed on protocol dashboards, and it is often what draws liquidity providers into a pool. A pool showing 25% APY may be paying 5% in fees and 20% in emissions. The 20% is paid in the protocol's governance token, which you must sell or hold. If the token price declines while you hold it, your effective yield declines with it.
Reward APY is promotional. It can disappear when the protocol reduces emissions or when the incentive program ends. Base APY, by contrast, persists as long as trading volume continues, because it is paid from actual economic activity (traders paying fees to access liquidity). The distinction matters because a pool with 5% base APY and 20% reward APY is far less durable than a pool with 20% base APY and 5% reward APY, even though both advertise 25% headline yield.
As of September 2026, [Uniswap processes $81.3 billion in monthly volume and generates $194.5 million in monthly fees](https://defillama.com/protocol/uniswap) across $3.69 billion in TVL. That translates to a blended base APY of roughly 6.3% before protocol fee deductions. The number is derived from real trading activity, and it represents the sustainable yield floor for the protocol. Any APY advertised above that figure is either concentrated liquidity amplification or token emissions. When evaluating a pool, separate base APY from reward APY and ask whether the base component alone justifies the impermanent loss risk. If the answer is no, you are relying on emissions to compensate for structural loss, and that reliance is a bet on the future price of the incentive token.
## Volatile Pairs Versus Stablecoin Pairs
Volatile pairs (such as ETH/USDC, BTC/USDT, or SOL/USDC) generate higher fee revenue because traders execute larger and more frequent swaps, but they also impose impermanent loss that often exceeds fee income. Real-world data shows that [over half of Uniswap v3 LPs in volatile pairs lose money](https://altcoininvestor.com/calculate-real-defi-returns/) after accounting for IL, even in pools with high volume. The mechanism is sound, but the math is unforgiving: unless fee APY exceeds the annualized rate of price divergence, the position will be unprofitable.
Stablecoin pairs eliminate impermanent loss by holding two tokens pegged to the same value. A USDC/USDT pool or a DAI/USDC pool should experience near-zero price divergence under normal conditions, which means all fee income translates directly to profit. The trade-off is that stablecoin pairs trade at the 0.01% or 0.05% tier, which generates lower fee income per dollar of liquidity than the 0.30% tier used for volatile pairs. In 2026, top stablecoin pools offer 3-10% APY from fees and incentives, with Curve, Uniswap v4, and Aerodrome leading for depth and efficiency.
The risk in stablecoin pools is depeg risk. If one of the stablecoins loses its peg (as USDT briefly did in May 2022 and as UST did permanently in May 2022), impermanent loss will appear where none was expected. Your position will automatically sell the pegged stablecoin and accumulate the depegging one, leaving you holding the distressed asset. For this reason, stablecoin LP positions are not risk-free; they are low-volatility positions with tail risk. The yield they pay is compensation for that tail risk, not for price volatility.
## The Protocol Fee Switch And Its Impact On LP Returns
In December 2025, Uniswap governance approved the "UNIfication" proposal, which activated protocol fees across Uniswap v2 and selected v3 pools. The change reduced LP fee capture on the 0.30% tier from 0.30% to 0.25%, with the remaining 0.05% routed to the Uniswap treasury. On the 0.01% and 0.05% tiers, the protocol now takes one-quarter of LP fees; on the 0.30% and 1% tiers, it takes one-sixth.
The impact on LP profitability is direct. Where you previously needed 20 days of fee income to offset 5.72% impermanent loss on a 2x price move, you now need approximately 23 days under identical volume conditions, because your fee income per trade has declined by 16.7%. The change shifts the breakeven timeline for all volatile pairs and makes it harder to justify LP positions in low-volume pools. For stablecoin pairs, the impact is smaller in absolute terms (the fee reduction is measured in basis points on an already-low fee tier), but the percentage reduction is the same.
The protocol fee switch reflects a broader trend in DeFi: protocols are moving from growth phase (where all fees flow to LPs to attract liquidity) to revenue phase (where a portion of fees flows to the protocol treasury or token holders). The transition reduces LP yields and increases the importance of fee tier selection, range selection, and pool choice. Liquidity providers who previously broke even in marginal pools may now lose money unless they move to higher-volume pools or tighter fee ranges.
## Tools And Data For Breakeven Analysis
To calculate whether a liquidity position is profitable, you need three inputs: fee income, token incentive income, and impermanent loss. Most AMM dashboards display gross APY (base + reward) but do not calculate impermanent loss for you. You must perform the calculation manually or use a third-party tool.
DefiLlama's yields page displays real-time APY data for thousands of pools, separated into base APY (fees only) and reward APY (incentives). The data allows you to identify pools where base APY alone may compensate for impermanent loss, which are the pools most likely to remain profitable if token prices decline or incentive programs end. Online impermanent loss calculators (such as those provided by Chainlink, Otomato, or Defbuddy) allow you to input entry and exit price ratios and calculate IL as a percentage. Combine the two datasets to estimate breakeven timelines for specific pools.
The calculation is: Days to Breakeven = (IL % / Daily Fee %) × 100\. If impermanent loss is 5.72% and your daily fee income is 0.25%, you need 23 days to break even. If the price continues to diverge, impermanent loss increases and breakeven recedes. If volume declines, daily fee income declines and breakeven recedes. The analysis is dynamic, not static, and it requires monitoring both price movements and volume trends throughout the life of the position.
## When Liquidity Provision Makes Sense
Liquidity provision is profitable in three scenarios. First, when the pool generates high fee volume relative to TVL, such that base APY alone offsets expected impermanent loss. Second, when the two tokens are highly correlated or pegged (stablecoin pairs, or pairs like ETH/stETH), such that impermanent loss is minimal. Third, when you hold a view that the price ratio will remain range-bound for the duration of your position, allowing you to collect fees without suffering large impermanent loss.
The mechanism is not profitable in most other scenarios. If the pool has low volume, fee income will not compensate for impermanent loss. If the tokens are uncorrelated and volatile, impermanent loss will grow faster than fee income. If the price trends strongly in one direction, you will exit the appreciating token automatically and miss the upside. In all three cases, you would have been better off simply holding the tokens.
The European monetary history parallel is the decision to hold sovereign bonds during a currency crisis. When the euro sovereign debt crisis unfolded in 2011-2012, Greek and Portuguese government bonds advertised yields of 20% or more. Those yields reflected the market's expectation of default, not the promise of return. Investors who bought the bonds expecting 20% yield received haircuts of 50% or more when the bonds were restructured. The advertised yield was not yield; it was the market pricing in a structural loss that had been accruing all along. Liquidity pools that advertise 20% APY without disclosing impermanent loss are engaged in a similar practice: the advertised yield ignores the structural cost that accrues whenever the price ratio diverges. The cost is disclosed only when you withdraw and calculate what your position is actually worth.
## Frequently Asked Questions
### What is the main source of yield in liquidity pools?
Liquidity pools generate yield from two sources: swap fees paid by traders who use the pool, and token incentives (emissions) distributed by the protocol. Swap fees represent real yield derived from economic activity and persist as long as trading volume continues. Token incentives are promotional and can disappear when programs end or emissions are reduced. Base APY (fees only) is the sustainable component; reward APY (incentives) is temporary.
### How much impermanent loss occurs on a 2x price move?
A 2x price move produces 5.72% impermanent loss relative to simply holding the two tokens. This means if you deposited $10,000 in liquidity and one token doubled in price, your position would be worth 5.72% less than if you had held the tokens in your wallet. The loss is called impermanent because it disappears if the price ratio returns to the original level, but it becomes permanent when you withdraw at the diverged ratio.
### Do stablecoin liquidity pools have impermanent loss?
Stablecoin pools holding only dollar-pegged assets (such as USDC/USDT or DAI/USDC) have near-zero impermanent loss under normal conditions because both tokens maintain the same value. This means all fee income translates directly to profit without the IL drag that affects volatile pairs. The risk is depeg risk: if one stablecoin loses its peg, impermanent loss will appear, and your position will automatically accumulate the depegging asset.
### How long does it take for fees to offset impermanent loss?
For a Uniswap v3 ETH/USDC pool at the 0.30% tier, you need approximately 23 days of fee income to offset the 5.72% impermanent loss from a 2x price move, assuming constant volume and no further price divergence. For a 3x move (13.4% IL), you need roughly 54 days. For a 5x move (25.5% IL), you need over 100 days. The timeline extends if volume declines or if the price continues to diverge.
### Why do AMM dashboards show APY without including impermanent loss?
AMM dashboards display gross APY (base fees plus token incentives) but exclude impermanent loss because IL is position-specific and depends on entry and exit price ratios, which vary for each liquidity provider. The result is that displayed APY systematically overstates actual returns. Over half of Uniswap v3 LPs in volatile pairs lose money after accounting for impermanent loss, even though dashboards show positive APY figures. You must calculate IL separately to determine real profitability.
The Weekly Yield Report
You have just examined the breakeven timelines and IL costs that AMM dashboards omit. Those numbers will shift when the next protocol fee adjustment arrives.
Every Thursday: where crypto yield actually is - stablecoins, liquid staking and DeFi lending, with the risk named next to the rate and what changed since last week.
[Get it free every Thursday](#/portal/signup)
Free. No trade calls, no allocations, no hype. Unsubscribe in one click.
### Crypto Staking Returns: Where Yield Comes From And What It Costs
URL: https://altcoininvestor.com/crypto-staking-returns-across-chains/
Last updated: 2026-10-03T17:06:26.000Z
## The Question Every Staking Calculator Ignores

Cosmos advertises 18.5% staking APY. Ethereum advertises 4%. If you assume the higher number means higher returns, you lose money.
The figure that matters is real yield: the APY you earn minus the rate at which the network dilutes your holdings through token inflation. Cosmos inflates at 12% annually. Ethereum inflates at 0.5%. That 18.5% Cosmos APY delivers 6.5% real yield. Ethereum's 4% delivers 3.5%. The gap is smaller than the headline suggests, and once you account for lock-up periods, slashing risk, and platform fees, the gap narrows further or reverses entirely.
This is the analysis most staking guides skip. You will not find it on exchange landing pages, because exchanges earn commissions on your gross APY, not your real return. This article breaks down staking returns across Ethereum, Solana, Cosmos, Polkadot, and other major proof-of-stake networks using three lenses: real yield after inflation, total cost after fees, and risk-adjusted return after accounting for slashing penalties and lock-up periods.
## How Staking Rewards Are Generated
Staking rewards come from two sources: newly minted tokens and transaction fees paid by network users. Ethereum distributes both new issuance and priority fees to validators. Cosmos relies more heavily on inflation-based rewards. The mix determines how sustainable the yield is and how much of your return represents real economic value versus dilution of existing holders.
When a network issues new tokens as staking rewards, it dilutes the total supply. If the network inflates at 8% annually and you earn 10% APY, your real yield is 2%. If you are not staking, you lose 8% of your purchasing power each year. If you stake, you gain 2%. The difference between earning nothing and earning the advertised rate is not 10%. It is 10% minus 8%, or 2%.
Transaction fees represent actual economic activity. Users pay fees to have their transactions processed. Validators earn those fees. This is yield in the traditional sense: income derived from providing a service. Inflation-based rewards are not yield in that sense. They are a transfer from non-stakers to stakers, paid for by diluting the purchasing power of every token holder.
Ethereum's rewards are majority fee-based. Around 60-70% of validator income comes from priority fees and MEV. Solana and Cosmos derive most of their staking rewards from inflation. That structural difference explains why Ethereum's 4% APY is more durable than Cosmos's 18.5%. When transaction activity drops, Ethereum's yield compresses. When staking participation rises, Cosmos's inflation adjusts, but the real yield available to each staker shrinks because the same inflation pool is divided among more participants.
## Real Yield By Network: The Actual Math
Ethereum currently pays 3.5-4.2% base APY, with 0.5% annual inflation. Real yield: 3-3.7%. Solo stakers running MEV-boost can earn 4-5%, pushing real yield to 3.5-4.5%. Roughly one-third of ETH supply is staked, which keeps issuance low and real yield positive. Ethereum delivers one of the strongest real yields among major chains because minimal inflation means almost every token you earn is genuine profit rather than a hedge against dilution.
Solana pays 6-8% APY with 5-6% inflation. Real yield: 1-2%. The headline number looks attractive. The post-inflation number is weaker than Ethereum. Solana requires 2-3 days to unstake, the shortest lock-up period among major PoS chains, which offsets some of the lower real yield by reducing liquidity risk.
Cosmos offers 18.5% APY with 10-14% inflation. Real yield: 4.5-8.5%. The range is wide because Cosmos inflation is dynamic, adjusting based on the percentage of ATOM staked. When fewer tokens are staked, inflation rises to incentivize participation. When more tokens are staked, inflation falls. The 21-day unbonding period is material. If the market drops 20% during that three-week window, your real yield is negative regardless of what the APY calculator showed.
Polkadot advertises up to 15% APR with roughly 8% inflation. Real yield: 4-7%. Polkadot uses a nomination proof-of-stake system that targets around 50% of total DOT supply staked. When actual staking falls below the target, inflation increases. When staking exceeds the target, rewards compress. The 28-day unbonding period is the longest among the chains compared here. That is 28 days of price exposure with no ability to exit.
The formula is simple: real staking yield equals headline APY minus the chain's token inflation rate. This is the only figure that tells you whether your stake is growing or merely keeping pace with new supply. If you stake on a platform that charges 25% commission, subtract that from your real yield. If you choose a validator that underperforms or goes offline, subtract further. The advertised number is the ceiling. Your actual return is what remains after you account for dilution, fees, and execution risk.
## What Platform Fees Actually Cost You
Exchange staking is the most expensive option. Kraken applies a 30% commission on staking rewards. Coinbase charges roughly 25-35%, resulting in effective ETH APY around 2.3-2.6% before inflation. KuCoin charges similarly. If you start with 4% gross APY, pay 30% commission, and subtract 0.5% inflation, your real yield is approximately 2.3%. That is 40% lower than solo staking.
Self-custody staking reduces fees to 5-10%, depending on whether you run your own validator or delegate to one. Solo stakers on Ethereum pay only infrastructure costs and earn the full protocol reward. Effective APY: 3.2-3.5% after modest fees and inflation. The trade-off is technical complexity and capital requirements. Running a validator requires 32 ETH and enough technical competence to avoid slashing penalties.
Liquid staking protocols like Lido charge 5-10% of rewards as fees and issue a transferable token in return. You stake ETH, receive stETH, and continue earning while maintaining liquidity. The token's value accrues staking rewards either as a growing balance or a rising exchange rate against ETH. Liquid staking lowers the barrier to entry by pooling ETH from multiple users and eliminates lock-up periods, at the cost of protocol risk and a 5-10% fee.
The difference between 25% exchange commission and 5% liquid staking commission compounds over time. On a $10,000 ETH position earning 4% gross APY, a 25% commission costs you $100 annually. A 5% commission costs $20 annually. Over five years, that is a $400 difference before compounding. If you are staking a six-figure position, the fee structure is not a detail. It is a material driver of total return.
Fee transparency varies. Exchanges disclose commission rates in their terms of service but rarely surface them in marketing. Liquid staking protocols publish fee schedules on-chain. Solo staking has no intermediary fees, only infrastructure and gas costs. The choice is a trade-off between convenience, cost, and control. For positions under $5,000, exchange staking may be the most practical option despite higher fees. Above that threshold, [choosing the right staking platform](https://altcoininvestor.com/best-crypto-staking-platform/) based on fee structure and technical support becomes material to your net return.
## Lock-Up Periods and Exit Risk
Lock-up periods range from zero to 42 days depending on the network and current queue length. During unbonding, your tokens are illiquid, staking rewards stop accruing, and you remain exposed to price risk. If the market crashes while your tokens are locked, you cannot sell.
Ethereum's exit queue is variable. As of recent data, approximately 2.4 million ETH are queued for withdrawal with an estimated wait time of 42 days. When exit demand spikes, the queue lengthens. When demand is low, exits complete in days. You do not know your exit time until you initiate the withdrawal.
Polkadot requires 28 days. Cosmos requires 21 days. Solana requires 2-3 days. Cardano has zero unbonding period, making it the most liquid option among major PoS networks. The difference between 28 days and zero is the difference between watching your position lose 15% with no recourse and exiting immediately.
During the May 2022 Terra collapse, ATOM dropped 30% in two weeks. If you initiated unbonding on day one, you waited 21 days before you could sell. By day 21, the price was another 15% lower. The opportunity cost of illiquidity exceeded several years of staking yield. This is not hypothetical risk. It is realized loss, and it occurs in every major drawdown.
Liquid staking eliminates unbonding periods by issuing a transferable derivative. You can sell stETH or mSOL immediately. The trade-off is smart contract risk and the possibility that the derivative trades at a discount to the underlying asset during periods of stress. In June 2022, stETH traded as low as 0.93 ETH, a 7% discount. You could exit, but at a loss relative to the value of the underlying stake.
The exit timing risk is not symmetrical. Lock-up periods do not cost you anything when prices rise. They cost you everything when prices fall and you cannot act. If you are staking a material percentage of your net worth, the unbonding period is a risk parameter that belongs in the same calculation as APY and fees.
## Slashing Risk By Network
Slashing penalties occur when validators misbehave or go offline. The penalty structure varies across networks. Ethereum, Cosmos, and Polkadot implement slashing. Solana does not currently enforce in-protocol slashing, which reduces one layer of risk for delegators.
Ethereum's penalties are correlated. If a validator double-signs or violates consensus rules, it faces an initial penalty of roughly 1 ETH, equivalent to 1/32 of the validator's effective balance. The validator is then removed from the network over a 36-day period, during which additional penalties accrue. If many validators are slashed simultaneously, a correlation penalty applies, compounding losses. In networks where more than 33% of validators run the same execution or consensus client, a critical bug in that client can trigger mass slashing events affecting every operator running it. This happened on smaller testnets. It has not happened on Ethereum mainnet, but the structural risk exists.
Cosmos delegates face slashing if their chosen validator is penalized for downtime or double-signing. Penalties can reach 5% or more of the bonded stake. Because Cosmos allows you to nominate up to 16 validators, you can diversify slashing risk across multiple operators. If one validator is penalized, your other delegations remain unaffected. The trade-off is that spreading your stake across many validators increases monitoring overhead.
Polkadot uses a similar nomination model. You back up to 16 validators. If your chosen validators underperform or misbehave, your rewards decrease or you face slashing penalties. The network targets roughly 50% staking participation and adjusts rewards accordingly. When participation exceeds the target, individual rewards compress, making validator selection more important as a driver of total return.
Solana does not implement slashing at the protocol level, which eliminates that specific risk for delegators. The trade-off is that validator quality matters less from a penalty standpoint and more from an uptime and performance standpoint. A validator that goes offline does not cause you to lose principal, but you lose rewards during downtime.
Slashing risk is not distributed evenly across all stakers. Solo stakers bear the full risk of their own operational errors. Delegators bear the risk of their validator's errors. Liquid staking protocol users bear the aggregated risk of the protocol's validator set, plus smart contract risk. The question is not whether slashing risk exists. The question is where it concentrates and whether you have the information and tools to monitor it.
## Compounding: Automatic vs Manual
Some networks automatically compound staking rewards. Others leave rewards in a claimable balance earning nothing until you manually reinvest them. The difference compounds over time.
Solana credits rewards into your stake account each epoch. Cardano counts rewards in the next snapshot. Both compound without manual intervention. If you stake 100 SOL at 7% APY, your balance grows to 107 SOL after one year, and the following year you earn 7% on 107 SOL, not 100.
Cosmos and TRON leave rewards sitting as a claimable balance. You must manually claim and restake. If you do not, your rewards earn zero. Over one year, the difference between automatic compounding and manual compounding on a $10,000 position at 7% APY is approximately $25\. Over five years, it is several hundred dollars, assuming you claim and restake quarterly. If you forget or delay, the opportunity cost is higher.
Exchange platforms typically auto-compound for you, which is one of the few structural advantages of centralized staking. Liquid staking protocols handle compounding within the derivative token's exchange rate. Self-custody staking requires you to monitor and reinvest manually, unless the protocol does it automatically.
Compounding frequency is a second-order detail on a $1,000 position. On a $100,000 position, it is a material driver of five-year return. The difference between quarterly and continuous compounding on $100,000 at 5% APY over five years is roughly $200\. Not large, but not zero, and easy to capture if the protocol automates it.
## Choosing Where To Stake Based On Real Return
If your priority is real yield after inflation and you can operate a validator or accept technical complexity, Ethereum offers 3-4.5% real yield with the lowest inflation among major PoS chains. If you want liquidity and are willing to accept protocol risk, Ethereum liquid staking via Lido delivers 3-3.5% real yield with zero lock-up period.
If your priority is high nominal APY and you can tolerate a 21-day unbonding period, Cosmos offers 4.5-8.5% real yield, though the range is wide due to dynamic inflation. The headline APY is attractive, but the lock-up period and manual compounding reduce the effective return unless you actively manage the position.
If your priority is liquidity and short exit times, Solana offers 1-2% real yield with 2-3 day unbonding and no current slashing risk. The real yield is lower than Ethereum or Cosmos, but the flexibility is higher. For a position you may need to exit quickly, Solana's short unbonding period has option value that does not appear in an APY calculator.
If your priority is minimizing lock-up risk entirely, Cardano offers zero unbonding with modest real yield. You can unstake and sell immediately, which is worth something in volatile markets even if the APY is lower than alternatives.
The choice depends on your liquidity needs, technical capability, and risk tolerance. A $5,000 position on Coinbase at 2.5% net APY is reasonable if you want simplicity and are not optimizing for maximum return. A $100,000 position on Coinbase at 2.5% net APY is leaving $1,500 annually on the table compared to solo staking or liquid staking at 4% net APY. At that scale, the decision is material.
For further context on how staking compares to other yield strategies, see [staking vs lending](https://altcoininvestor.com/staking-vs-lending-crypto/), which covers the risk trade-offs between protocol risk and counterparty risk across different yield products.
## Tax Implications of Staking Rewards
Staking rewards are taxable as ordinary income in most jurisdictions, including the United States. The taxable amount is the fair market value of the tokens at the time you receive them, not when you sell them. If you earn 1 ETH in staking rewards when ETH is trading at $2,000, you owe income tax on $2,000, regardless of whether you sell the ETH or continue staking it.
Exchanges that auto-compound rewards create a tax reporting burden because each compounding event may be a taxable distribution. If your rewards compound daily, you have 365 taxable events per year. Platforms that leave rewards in a claimable balance simplify reporting because the taxable event occurs only when you claim, not when the rewards accrue.
If you sell staked tokens at a gain or loss relative to the value at which you received them, that triggers a capital gain or loss. If you received 1 ETH at $2,000 and later sold it at $2,500, you owe income tax on $2,000 and capital gains tax on the $500 appreciation. This is a second layer of taxation, and it applies whether you held the ETH for one day or one year, though the rate differs based on holding period.
Tax software varies in how well it handles staking income. Most platforms handle exchange trades correctly. Fewer handle auto-compounding rewards, liquid staking derivatives, or cross-chain bridges without manual intervention. [Choosing tax software that supports DeFi yield and staking](https://altcoininvestor.com/best-crypto-tax-software-defi-yield-staking/) reduces the time you spend reconciling transactions manually and lowers the risk of reporting errors.
If you are staking five or six figures, the tax liability is not trivial. On a $100,000 position earning 4% annually, you receive $4,000 in staking rewards, which may be taxed at 24-37% depending on your bracket. That is $960 to $1,480 in tax owed, regardless of whether you convert the rewards to cash. If you do not set aside cash to pay the tax, you may be forced to sell part of your stake at an inopportune time.
## When Staking Makes Sense And When It Doesn't
Staking makes sense when you plan to hold the asset regardless of staking availability, the lock-up period is acceptable relative to your liquidity needs, and the real yield after fees and inflation exceeds your opportunity cost. If you are holding ETH for multiple years and can tolerate a variable exit queue, earning 3.5% real yield instead of 0% is a rational choice.
Staking does not make sense when the lock-up period prevents you from exiting during a drawdown, the real yield is negative after accounting for inflation and fees, or you lack the technical or operational capability to manage slashing risk. If you are holding a token for speculative appreciation and may need to sell on short notice, a 28-day unbonding period is a structural handicap that costs more than the yield is worth.
Staking also does not make sense if the platform fees are high enough to eliminate the real yield. If you are staking ETH on an exchange at 25% commission, your net APY after fees and inflation is roughly 2.5%. A liquid staking protocol charges 10% commission and delivers 3.2% net APY. The difference is 0.7% annually, or $70 on a $10,000 position. Over five years, that is $350 before compounding. If the exchange offers better security or insurance and you value that above the fee difference, the trade-off may be rational. If not, you are paying for convenience you do not need.
The decision is not binary. You can stake part of your holdings and keep part liquid. You can stake on a network with a short unbonding period and accept lower real yield in exchange for flexibility. You can use liquid staking to eliminate lock-up risk and accept smart contract risk in its place. The question is not whether to stake. The question is how much to stake, where to stake it, and whether the return justifies the risks and costs you are accepting.
## The Takeaway
Real staking yield is gross APY minus inflation minus fees. Ethereum at 4% gross with 0.5% inflation and 10% liquid staking fees delivers roughly 3.1% real yield. Cosmos at 18.5% gross with 12% inflation and 5% validator commission delivers roughly 6.2% real yield. Solana at 7% gross with 5.5% inflation and 7% commission delivers roughly 1% real yield. The advertised number is not the number you earn. The number you earn is what remains after you subtract dilution, subtract fees, and account for the opportunity cost of lock-up periods and slashing risk. If you are staking based on headline APY without calculating real yield, you are optimizing for the wrong variable.
You have just compared real yields across five proof-of-stake networks, accounting for inflation, fees, and lock-up risk. Those inflation rates and staking participation levels will shift, and the yields will shift with them.
## Frequently Asked Questions
### What is the difference between staking APY and real yield?
Staking APY is the gross annual percentage yield advertised by the network or platform. Real yield is APY minus token inflation minus platform fees. If a network pays 10% APY but inflates supply by 8% annually, your real yield is 2%. Most calculators show gross APY, which overstates your actual purchasing power gain. Real yield tells you whether your stake is growing in absolute terms or just keeping pace with dilution.
### Which proof-of-stake network offers the highest real yield after inflation?
Cosmos offers the highest real yield among major PoS networks, ranging from 4.5% to 8.5% after accounting for its 10-14% inflation rate. Ethereum offers 3-4.5% real yield with minimal 0.5% inflation. Polkadot delivers 4-7% real yield. Solana provides 1-2% real yield after its 5-6% inflation. The highest advertised APY does not always translate to the highest real return. Inflation rate and fee structure determine actual purchasing power gain.
### How do exchange staking fees compare to liquid staking protocols?
Exchanges charge 25-35% commission on staking rewards, resulting in effective APY of 2.3-2.6% on Ethereum after fees and inflation. Liquid staking protocols like Lido charge 5-10% fees, delivering effective APY of 3.2-3.5%. Solo staking eliminates intermediary fees entirely but requires technical expertise and 32 ETH minimum on Ethereum. On a $10,000 position, the difference between 25% and 10% commission costs approximately $100 annually, compounding over time.
### What happens to my tokens during the unbonding period?
During unbonding, your tokens are illiquid, staking rewards stop accruing, and you remain fully exposed to price risk. You cannot sell or transfer the tokens until the unbonding completes. Ethereum currently requires approximately 42 days, Polkadot 28 days, Cosmos 21 days, Solana 2-3 days, and Cardano zero days. If the market crashes during this period, you cannot exit. Liquid staking eliminates unbonding by issuing a transferable derivative, but at the cost of smart contract risk.
### Are staking rewards taxable as income or capital gains?
Staking rewards are taxable as ordinary income in most jurisdictions, including the United States, at the fair market value when received. If you earn 1 ETH when ETH trades at $2,000, you owe income tax on $2,000 immediately, regardless of whether you sell. If you later sell that ETH at $2,500, you owe capital gains tax on the $500 appreciation. Auto-compounding rewards create frequent taxable events. Manual claiming reduces reporting complexity but requires periodic action to reinvest.
The Weekly Yield Report
You have just compared real yields across five proof-of-stake networks, accounting for inflation, fees, and lock-up risk. Those inflation rates and staking participation levels will shift, and the yields will shift with them.
Every Thursday: where crypto yield actually is - stablecoins, liquid staking and DeFi lending, with the risk named next to the rate and what changed since last week.
[Get it free every Thursday](#/portal/signup)
Free. No trade calls, no allocations, no hype. Unsubscribe in one click.
### Best Staking Opportunities Ranked By Real Return And Risk
URL: https://altcoininvestor.com/best-staking-opportunities-real-return-risk/
Last updated: 2026-10-03T16:06:32.000Z
## The Decision You Are Actually Making

Staking selection determines yield on locked capital and exposure to slashing or downtime losses. The decision is not which network shows the highest APY. The decision is which network delivers the highest real return after token inflation, validator fees, lock-up opportunity cost, and slashing risk.
Cosmos advertises 18.5% APY. Network inflation runs near 10%. Real yield after dilution is closer to 2-8%.
Polkadot shows 11.5% staking yield. Inflation runs 7-10%. Real yield after inflation is 3-6%, and you wait 28 days to unbond.
Ethereum yields 3.5-4.2% with no inflation during periods of heavy network usage due to EIP-1559 fee burning. On the numbers, Ethereum's real yield is often higher than Cosmos despite a lower headline APY.
This article ranks five staking opportunities by real return after accounting for inflation, fees, lock-up requirements, slashing risk, and validator operational quality. The data is current as of October 2026.
## Real Yield vs Nominal Yield: The Core Distinction
Real yield is what remains after the dilutive effect of newly issued tokens.
If a network inflates at 8% annually and staking yield is 6%, you fall behind in net terms even as your wallet balance increases. Your share of total supply shrinks. Your purchasing power relative to non-stakers declines.
High APY funded primarily by inflation can be misleading. If a network inflates supply by 15% annually and you earn 18% APY, real yield above inflation is only 3%. Every token holder, staker or not, experiences dilution when new tokens are minted to fund staking rewards.
Protocols with longer minimum staking periods tend to offer higher returns as compensation. The data suggests real staking returns are much more similar and less attractive across blockchains once inflation is factored in.
According to Staking Rewards methodology for calculating real reward rate, the formula is straightforward: subtract network inflation rate from gross staking APY to determine real reward rate in token terms. The interesting variable is not the headline number. The interesting variable is what you keep after the network issues new tokens.
## Ethereum: Lowest Nominal Yield, Strongest Real Yield Mechanics
Ethereum currently offers 3.5-4.2% APY with approximately 37 million ETH staked across the network.
Solo staking requires 32 ETH minimum and yields 2.5-3.0% APY. Your capital is locked. You run validator hardware 24/7\. You bear slashing risk and operational complexity.
Liquid staking offers semi-liquid exposure with lower yields after fees. Lido charges 10% of staking rewards and delivers 2.29% APY on $26.3 billion in TVL. Ether.Fi yields 2.38% on $6.1 billion TVL. Coinbase charges a 35% commission on rewards and delivers 2.39% APY on $1.2 billion TVL.
The withdrawal queue runs approximately 8 days as of September 2026, the shortest unbonding period of any major network after Solana.
Ethereum has some of the strongest real yield mechanics due to EIP-1559 fee burning. The network issues new ETH to validators while burning the base fee of each transaction. During periods of heavy usage, Ethereum can become net deflationary. This is unique among staking networks. You earn yield while the total supply shrinks, compounding your relative purchasing power.
Measured over the last 30 days, Ethereum's real yield ranges from 3% to 4.2% depending on network activity and fee burn rate. That puts it ahead of Solana, Polkadot, and Cosmos on a real-yield basis despite showing the lowest headline APY.
One thing worth noting: [solo staking vs pooled staking](https://altcoininvestor.com/solo-staking-vs-pooled-staking/) introduces a trade-off between capital efficiency and operational risk. Solo staking captures full yield but requires hardware, uptime, and technical skill. Pooled or liquid staking captures partial yield after fees but eliminates operational complexity.
## Solana: Moderate Yield With Fast Liquidity
Solana offers 5-8% APY across most platforms, with current rates near 6.06% as of October 2026\. Total staked is 406.2 million SOL, representing 69.20% of supply with a $41.6 billion staking market cap.
The network's inflation schedule starts at 8% per year and gradually decreases to 1.5% long-term. Current inflation runs approximately 4.47%. At 6-8% APY with 4.47% inflation, real yield is closer to 1.5-3.5% in token terms.
Validator commission varies widely. Coinbase takes 35% of SOL staking rewards before passing the rest to users. For every 100 SOL worth of rewards earned, Coinbase keeps 35\. This is the highest cut of any platform reviewed and a meaningful drag on long-term returns easily missed when looking at headline APY.
Marinade Finance offers liquid staking at 6.79% with 6% fees, a more favorable fee structure than centralized platforms.
The unbonding period is 2-3 days, the shortest lock-up of any network in this comparison. That makes Solana the most liquid staking option for capital that may need to be redeployed quickly. Price exposure during unbonding is minimal compared to Polkadot's 28-day or Cosmos's 21-day periods.
Solana's appeal is liquidity and simplicity. The platform works for stakers who value fast exit over maximum yield.
## Polkadot: High Nominal Yield, Long Lock-Up, Complex Operational Model
Polkadot offers 11.5% staking yield with 56% of supply staked, approximately 853.2 million DOT. Network inflation runs 7-10%, so real yield after accounting for dilution is 3-6%.
The unbonding period is 28 days, the longest of any major network. Tokens earn no rewards and cannot be transferred during this time. If DOT drops 25% during that window, your 11.5% APY does nothing to protect you. Price exposure during lock-up is real.
Polkadot's nominated proof-of-stake (NPoS) model is more complex than most chains. Users choose up to 16 validators. Operational quality varies across validators. Validator underperformance affects your returns indirectly, particularly when stake is concentrated in a small number of nodes.
Minimum stake dropped to 1 DOT after recent updates through nomination pools, lowering the barrier to entry compared to Ethereum's 32 ETH requirement.
Slashing risk on Polkadot is similar to Cosmos: typically 0.01% for downtime, 5% for double-signing. The pattern holds across most proof-of-stake networks. Validator operational quality matters.
On the numbers, Polkadot's 3-6% real yield after inflation is competitive with Ethereum and higher than Solana. The trade-off is a 28-day unbonding period and operational complexity in validator selection. This works for capital that will stay staked for quarters, not weeks.
## Cosmos: Highest Headline APY, Highest Inflation, Misleading Real Yield
Cosmos shows 18.5% current yield with 59% staking ratio and approximately $1.2 billion in staked ATOM, or 248.8 million ATOM.
The headline number is misleading.
Cosmos inflates near 10% annually. At 18.5% APY with roughly 10% supply inflation, real yield in token terms is closer to 2-8%, not 18.5%. The network mints new tokens to fund staking rewards. Every token holder experiences dilution. Your wallet balance increases while your share of total supply barely moves.
The unbonding period is 21 days, a fixed protocol value regardless of exit demand. No rewards accrue during unbonding. You bear full price exposure for three weeks before capital becomes liquid.
Cosmos has no minimum stake requirement, the lowest barrier to entry of any network in this comparison. That makes it accessible for smaller allocations.
Slashing risk is typically 0.01% for downtime, 5% for double-signing, consistent with Polkadot and other proof-of-stake networks.
The data shows Cosmos delivers 2-8% real yield after inflation, lower than Ethereum and comparable to Solana at the high end. The 18.5% headline APY is funded almost entirely by token dilution. Investors comparing staking options should subtract the network's inflation rate from quoted APY before making allocation decisions.
## Liquid Staking Derivatives: Fee Drag And Smart Contract Risk
Liquid staking tokens (LSTs) like Lido's stETH, Rocket Pool's rETH, or Ether.Fi's eETH offer semi-liquid exposure to staking yield. You stake ETH, receive a derivative token, and continue earning yield while maintaining the ability to trade or deploy that token in DeFi.
Fee structures matter.
Lido charges 10% of staking rewards. Rocket Pool charges similar fees. Coinbase charges 35%. These fees compound over time. A 10% fee on 3.5% gross yield reduces net APY to 3.15%. A 35% fee reduces it to 2.28%. Over five years, that gap becomes material.
Liquid staking introduces smart contract risk absent from native staking. Vulnerabilities in LST protocols create failure modes that do not exist when staking directly on-chain. De-pegging events have materialized multiple times in recent history, with liquid staking tokens trading at discounts to their underlying assets during periods of stress.
Concentration risk is real. If a single provider controls a significant share of staked supply, validator centralization increases and slashing risk becomes correlated across the network. [MetaMask's emergency exit of 523,000 staked ETH](https://altcoininvestor.com/metamask-validator-exit-lido-concentration-risk/) after rewards were diverted to an attacker wallet exposes the operational risk embedded in delegated staking infrastructure.
Leverage staking amplifies risk of cascading liquidations through intensified selling pressure. When LSTs are used as collateral in lending protocols, a price decline can trigger liquidations that de-peg the token further, creating a feedback loop.
For users prioritizing [the best crypto staking platform](https://altcoininvestor.com/best-crypto-staking-platform/), the decision between native staking and liquid derivatives depends on liquidity needs, fee tolerance, and risk capacity. Liquid staking is not free. You trade operational simplicity and liquidity for fee drag and smart contract risk.
## Who Each Option Is Right For
Ethereum works for capital that values real yield over nominal yield and can tolerate 8-day unbonding periods. The deflationary mechanics during high network usage create the strongest real-yield profile of any network in this comparison. Solo staking at 32 ETH suits technical operators. Liquid staking suits passive allocators willing to pay 10-35% fees for liquidity.
Solana works for capital that needs liquidity. The 2-3 day unbonding period is the shortest in this comparison. Real yield of 1.5-3.5% after inflation is lower than Ethereum or Polkadot, but the ability to redeploy capital quickly offsets the yield gap for traders or yield farmers rotating across opportunities.
Polkadot works for capital that will stay staked for quarters. Real yield of 3-6% after inflation is competitive. The 28-day unbonding period is punitive for short-term holders but acceptable for long-term stakers. The NPoS model adds operational complexity in validator selection. This is not a set-it-and-forget-it platform.
Cosmos works for small allocations with no minimum stake requirement. Real yield of 2-8% after inflation is comparable to Solana. The 18.5% headline APY is misleading. The 21-day unbonding period is longer than Solana, shorter than Polkadot. The primary appeal is accessibility, not yield.
Liquid staking derivatives work for capital that needs to remain semi-liquid or be deployed in DeFi while earning staking yield. You pay 10-35% fees and accept smart contract risk. You gain the ability to use staked assets as collateral or trade them without unbonding. For users comparing [exchange staking vs self-custody staking](https://altcoininvestor.com/staking-on-exchange-vs-own-wallet/), liquid staking occupies a middle ground: more control than exchange staking, more liquidity than solo staking.
## The Recommendation: Ethereum For Real Yield, Solana For Liquidity
On the numbers, Ethereum delivers the highest real yield after inflation despite showing the lowest headline APY. EIP-1559 fee burning creates net deflationary periods during high network usage. Real yield ranges from 3% to 4.2% depending on activity. The 8-day unbonding period is the shortest after Solana. Solo staking at 32 ETH captures full yield. Liquid staking at any amount captures partial yield after 10-35% fees.
Solana is the liquidity choice. Real yield of 1.5-3.5% after inflation is the lowest in this comparison, but the 2-3 day unbonding period is the fastest. This works for capital that may need to be redeployed quickly or for stakers rotating across yield opportunities.
Polkadot and Cosmos show higher headline APYs but deliver comparable or lower real yields after inflation. Polkadot's 28-day unbonding period is punitive unless you are staking for quarters. Cosmos's 18.5% APY is funded almost entirely by token dilution, delivering 2-8% real yield, lower than Ethereum and only marginally higher than Solana at the top end.
The interesting variable is not the headline number. The interesting variable is what you keep after the network issues new tokens, after validators take their commission, and after you account for lock-up opportunity cost.
For users managing [staking income for tax purposes](https://altcoininvestor.com/best-crypto-tax-software-defi-yield-staking/), real yield calculations matter. Nominal yield inflates your taxable income while token dilution erodes purchasing power. The gap between gross APY and net return after inflation is the difference between profitable staking and break-even capital deployment.
## The Takeaway: Subtract Inflation Before You Compare
Headline APY is not yield. Real yield is yield.
Subtract network inflation from quoted APY. Subtract validator commission. Account for unbonding periods and the price risk they introduce. Slashing risk across proof-of-stake networks is typically 0.01% for downtime, 5% for double-signing, relatively consistent across platforms.
Ethereum yields 3-4% real after accounting for fee burning. Solana yields 1.5-3.5% real after inflation. Polkadot yields 3-6% real after inflation with a 28-day lock. Cosmos yields 2-8% real after inflation despite an 18.5% headline number.
If you need liquidity, stake Solana. If you want real yield, stake Ethereum. If you are staking for quarters and can navigate validator selection complexity, Polkadot is competitive. If you are attracted to Cosmos's 18.5% APY, run the inflation math first.
The decision is real return after dilution, not nominal return before it.
## Frequently Asked Questions
### What is real yield in crypto staking?
Real yield is the staking return that remains after subtracting network inflation from the headline APY. If a network offers 18% staking APY but inflates supply by 10% annually, real yield is approximately 8%. Token dilution from new issuance erodes purchasing power for all holders. Real yield measures what stakers actually gain in purchasing power relative to non-stakers and relative to the total token supply.
### Which staking network has the shortest unbonding period?
Solana has the shortest unbonding period at 2-3 days. Ethereum follows at approximately 8 days as of September 2026\. Cosmos requires 21 days. Polkadot requires 28 days, the longest of major networks. During unbonding, tokens earn no rewards and cannot be transferred, creating price exposure risk. Shorter unbonding periods reduce opportunity cost and allow faster capital redeployment.
### How much do liquid staking platforms charge in fees?
Liquid staking fees range from 10% to 35% of gross staking rewards. Lido charges 10% on Ethereum staking. Ether.Fi charges similar rates. Coinbase charges 35% commission on both ETH and SOL staking rewards, the highest cut among major platforms. Marinade Finance charges 6% on Solana. These fees compound over time and reduce net APY by 0.3% to 1.4% depending on gross yield and platform commission structure.
### Why does Cosmos show higher APY than Ethereum?
Cosmos shows 18.5% APY compared to Ethereum's 3.5-4.2% because Cosmos funds staking rewards primarily through token inflation running near 10% annually. Ethereum uses transaction fee burning under EIP-1559, which can make the network deflationary during high usage. After subtracting inflation, Cosmos delivers 2-8% real yield while Ethereum delivers 3-4.2%. Higher headline APY does not equal higher real return when inflation differs across networks.
### What is slashing risk and how much can you lose?
Slashing is the penalty applied when a validator behaves maliciously or fails to maintain uptime. Across most proof-of-stake networks including Cosmos and Polkadot, slashing is typically 0.01% of staked tokens for downtime and 5% for double-signing or provably malicious behavior. Validator operational quality directly affects slashing exposure. Solo stakers bear full risk. Pooled and liquid staking distribute slashing losses across all participants in proportion to stake.
The Weekly Yield Report
You have just compared five networks yielding between 1.5% and 18.5% headline APY with real yields between 1.5% and 4.2%. Those rates and inflation schedules will shift next quarter.
Every Thursday: where crypto yield actually is - stablecoins, liquid staking and DeFi lending, with the risk named next to the rate and what changed since last week.
[Get it free every Thursday](#/portal/signup)
Free. No trade calls, no allocations, no hype. Unsubscribe in one click.
### Presale Red Flags: Contract Patterns That Signal Intent To Rug
URL: https://altcoininvestor.com/how-to-check-if-token-presale-is-safe/
Last updated: 2026-10-03T15:08:36.000Z
## The Question That Protects Your Capital
The presale contract advertises locked liquidity, a multisig wallet, and a completed audit. The developer claims everything is safe. The question is whether the contract itself enforces those claims or whether the claims exist only in marketing. Between January and May 2026, PancakeSwap V2 alone confirmed 103,695 rug pull events extracting $569 million from retail investors - approximately $28.5 million per week. Most of those events came from presales where investors trusted claims instead of verifying the contract code that governs what the developer can actually do after launch.
This article identifies the specific Solidity patterns that enable rug pulls: mint functions hidden behind owner-only modifiers, fee manipulation without time constraints, blacklist toggles that trap buyers, and liquidity lock mechanisms with secret override functions. It explains how to verify whether the liquidity lock contract you are reading is genuine or a facade with a built-in escape hatch. It provides the block explorer queries, automated scanning tools, and contract function names that separate legitimate presales from operations designed to extract capital the moment retail commits funds.
## The Historical Pattern: Why Contract Verification Matters More Than Promises

European banking spent the decade after 2008 learning that verbal assurances from counterparties mean nothing when the contract permits breach without penalty. Greek sovereign bonds paid elevated yields throughout 2010 and early 2011 while government ministers publicly reassured markets that debt sustainability was not in question. The yields were not compensation for risk - they were the market pricing in the contractual reality that Greece could restructure, could impose capital controls, could default selectively on foreign holders. When the restructuring came in 2012, the investors who had relied on ministerial statements rather than the bond covenants lost 53.5% of principal. The contract permitted the haircut; the promises did not prevent it.
Token presales operate under similar conditions. A developer promises locked liquidity for six months. A Telegram channel posts screenshots of a multisig wallet. An audit report from an unknown firm declares the contract safe. None of those promises change what the Solidity code permits. If the contract includes a function that allows the owner to withdraw liquidity before the advertised lock expiration, then the liquidity is not locked regardless of what the marketing claims. The contract is the covenant. Everything else is a verbal assurance from a counterparty you cannot sue in a jurisdiction you cannot reach.
The 2026 rug pull data from PancakeSwap illustrates the pattern. Detection tools that analyze contract code alone achieve approximately 70-80% accuracy. ChainAware V3, which combines contract analysis with deployer wallet behavioral history, reaches 90.1% accuracy by recognizing that professional rug operators often deploy clean-looking contracts but leave patterns in their wallet transaction history - prior rug pulls, liquidity drains on earlier tokens, repeated presale cycles with identical structures. The code may look safe. The operator's history shows intent. Both matter, but the contract is what permits the action.
## The Contract Functions That Enable Rug Pulls
When you inspect a presale contract on Etherscan or BscScan, you are searching for functions that grant the contract owner unilateral control over features that should be immutable after launch. The following patterns appear repeatedly in confirmed rug pull contracts.
### Hidden Mint Functions
A mint function allows the contract owner to create new tokens at will, diluting existing holders. Legitimate projects either disable minting after the initial supply is created or impose strict governance controls. Rug pull contracts include mint functions with the `onlyOwner` modifier and no public visibility restriction. The function is executable but not advertised. You find it by reading the verified contract source code on the block explorer. Search for `function mint` or `function _mint`. If the function exists and is restricted to `onlyOwner`, the developer can issue unlimited new tokens after the presale closes, crashing the price while they sell into the diluted supply.
### Fee Manipulation Without Timelock
Many presale tokens include transaction fees - a percentage deducted from each buy or sell to fund marketing, development, or liquidity. The fee structure itself is not a red flag. The absence of constraints on changing that fee is. Functions named `setFee`, `setTax`, `setBuyFee`, or `setSellFee` allow the owner to adjust fees at any time. If there is no timelock contract or governance mechanism requiring a delay and public notice before the fee changes, the owner can raise the sell fee to 99% the moment after launch, trapping buyers in a honeypot where they cannot sell without losing everything. You verify this by checking whether the fee-setting function includes a timelock delay or whether it is a simple `onlyOwner` call with no additional safeguards.
### Blacklist and Whitelist Abuse
Some contracts include blacklist functions to comply with regulatory requirements or prevent malicious bots. The function allows the owner to designate specific addresses as blocked from trading. The legitimate use case is narrow. The rug pull use case is to blacklist large holders or early buyers, preventing them from selling while the developer drains liquidity. Search for `blacklist`, `isBlacklisted`, or `excludeFromFee` functions. If the contract allows the owner to toggle these settings post-launch with no governance delay, the developer can selectively trap holders. The Solidity pattern looks like this: `mapping(address => bool) private _isBlacklisted` combined with `require(!_isBlacklisted[from], "Address blacklisted")` in the transfer function and `function blacklist(address account) external onlyOwner`. The presence of that pattern without a governance timelock is disqualifying.
### Trading Locks and Anti-Whale Mechanisms That Hide Honeypot Restrictions
Anti-whale mechanisms limit the maximum transaction size or the maximum wallet balance to prevent large holders from dominating price action. The stated purpose is to protect small investors. The actual purpose in rug pull contracts is often to create a honeypot where buyers cannot sell meaningful amounts. If the maximum transaction is set to 0.1% of supply and there is no function to remove that limit, early buyers are trapped. You verify by searching for `max_tx`, `maxTransactionAmount`, or `trading_lock` variables. Check whether the contract includes a function to disable the restriction after launch. If the restriction is permanent or if the removal function is `onlyOwner` with no timelock, the mechanism is not protecting small investors - it is preventing exits.
### Pausable Contracts
A pausable contract allows the owner to freeze all token transfers. The legitimate use case is to halt trading during a security incident. The rug pull use case is to freeze the market after extracting liquidity, preventing anyone from selling while the price collapses. Look for `pause()` and `unpause()` functions. If they exist and are restricted to `onlyOwner`, the developer can freeze your position at will. OpenZeppelin's Pausable contract is widely used and well-documented - if a presale contract imports Pausable, verify that the pause function either has a timelock or is controlled by a decentralized governance mechanism, not a single externally-owned address.
### Proxy Patterns and Upgradeable Contracts
Upgradeable contracts use a proxy pattern where the token contract address you interact with delegates all calls to a separate implementation contract. The owner can change the implementation address, replacing the token's logic with entirely different code. This pattern is common in enterprise DeFi where protocols need to patch bugs or add features. It is disqualifying in a presale unless the upgrade function is controlled by a multisig with multiple independent signers and a mandatory delay. If the presale contract is a proxy and the admin address is a single EOA (externally-owned account, meaning a wallet controlled by one private key), the developer can replace the entire contract with a rug pull implementation after you buy. You verify this on Etherscan by checking the "Read as Proxy" tab. If the contract is upgradeable, inspect the admin address and the upgrade delay. If the admin is a single wallet and there is no delay, the contract is not safe regardless of what the current implementation does.
## How To Verify Liquidity Lock Claims
A liquidity lock means the LP (liquidity provider) tokens representing the presale's liquidity pool are either burned - sent permanently to a dead address like 0x000000000000000000000000000000000000dEaD - or deposited in a third-party time-lock contract that prevents withdrawal until a specified block timestamp. The lock protects buyers by ensuring the developer cannot drain the liquidity pool and collapse the price immediately after launch. Marketing materials routinely claim locked liquidity. The question is whether the claim is enforceable.
The verification process starts on the block explorer. Navigate to the token's liquidity pool address on Uniswap, PancakeSwap, or the relevant DEX. Find the LP token contract address (it is usually labeled as "Pair" or "LP"). Open that LP token contract. Click the "Holders" tab. This tab shows every address holding LP tokens and the percentage of total LP supply each address holds. If the presale claims 80% of liquidity is locked, you should see at least 80% of LP tokens held by either a burn address or a recognized time-lock contract address.
Burn addresses are easy to verify - they are addresses like 0x000000000000000000000000000000000000dEaD or 0x0000000000000000000000000000000000000000\. Tokens sent there cannot be retrieved. If 80% of LP tokens are sent to a burn address, the liquidity is permanently locked. Time-lock contracts require more scrutiny. Recognized platforms like Unicrypt, Team Finance, and PinkSale operate time-lock contracts that are publicly verifiable. According to Team Finance, over 38,000 projects have used their locking service, with total value locked peaking at $6.5 billion. If the LP tokens are held by a contract address you do not recognize, you must verify that the contract is a legitimate time lock and not a fake.
Open the contract address holding the LP tokens. Click "Contract" and then "Read Contract." Look for a public variable named `releaseTime`, `unlockTimestamp`, or similar. This variable should contain a Unix timestamp indicating when the LP tokens can be withdrawn. Verify that the timestamp is at least six months in the future - anything shorter is insufficient to protect against rug pulls in volatile presale environments. Next, search the contract code for a `withdraw()` or `claim()` function. The function should include a check like `require(block.timestamp >= releaseTime, "Tokens are locked")`. This line enforces that the LP tokens cannot be withdrawn before the unlock date. Finally, and critically, search for any admin override functions. Look for `setReleaseTime`, `emergencyWithdraw`, or any function that allows the contract owner to change the unlock date or bypass the time constraint. If such a function exists, the lock is fake - the developer can withdraw liquidity at any time regardless of the advertised lock period.
Automated tools simplify this process. Token Sniffer and GoPlus Security scan contract code and liquidity lock status automatically, flagging whether LP tokens are locked, the lock percentage, and the unlock date. Rugcheck.xyz provides similar analysis and assigns a risk score based on liquidity lock, contract ownership, and other factors. For individual investors, the recommended workflow is to run the token address through Token Sniffer or GoPlus for a fast initial scan, then manually verify the LP token holder tab and time-lock contract code on the block explorer. Automated tools miss edge cases - custom time-lock contracts with hidden override functions, cross-chain liquidity where the lock is on a different chain than the presale, or fake lock contracts designed to pass automated scans but fail manual inspection.
## When Audit Reports Do Not Protect You
An audit report from CertiK, Hacken, or another security firm is evidence that someone reviewed the contract code at a specific point in time. It is not evidence that the deployed contract matches the audited code, that the audit firm is reputable, or that critical findings were resolved. Three failure modes are common.
First, audit-to-deployment mismatch. The developer submits contract version A for audit. The audit report is published. The developer then deploys contract version B, which includes modifications not reviewed by the auditor. You verify this by comparing the audited contract address in the audit report to the live contract address on the block explorer. If the addresses do not match, the audit is irrelevant. If the report does not include a specific contract address at all - only a GitHub repository link or a general description of the project - the audit cannot be verified and should be treated as marketing rather than assurance.
Second, unresolved critical findings. Audit reports typically categorize issues as critical, high, medium, or low severity. A critical finding means the contract has a vulnerability that can result in total loss of funds. If the final audit report shows unresolved critical or high-severity findings, the contract is not safe. Developers sometimes publish preliminary audit reports that list issues discovered during the review but not yet fixed, then fail to publish the final report confirming resolution. You verify by reading the entire audit report, checking the "Resolution" or "Status" column for each finding, and confirming that all critical and high-severity issues are marked as resolved. If the report is incomplete or if critical issues remain open, the audit does not protect you.
Third, post-audit contract upgrades. If the presale contract uses a proxy pattern, the developer can change the implementation contract after the audit, rendering the audit obsolete. Even non-upgradeable contracts can be modified if the presale structure involves migrating to a new contract address after launch. A March 2026 exploit of Movie Token, flagged by CertiK, stemmed from flawed sell/burn accounting that could distort supply and price - the vulnerability was in logic added after the original audit. You protect against this by verifying that the contract is not upgradeable or, if it is upgradeable, that the upgrade function is controlled by a decentralized multisig with a mandatory public delay and that no upgrades have occurred since the audit date.
For reference, [reading the whitepaper](https://altcoininvestor.com/how-to-read-crypto-whitepaper/) in parallel with the contract audit reveals whether the tokenomics described in marketing match the mechanisms enforced in code.
## Deployer Wallet History: The Signal Most Retail Investors Miss
A presale contract can look clean - no hidden mint functions, no fee manipulation, legitimate liquidity lock - and still be a rug if the deployer wallet has a history of deploying similar contracts and draining them. This is the insight behind ChainAware V3's 90.1% detection accuracy. The system scores not only the contract code but also the transaction history of the wallet that deployed the contract. Professional rug operators often use the same deployer wallet across multiple scams, leaving a pattern of prior liquidity drains, presale cycles with identical structures, and wallets funded from known rug pull proceeds.
You verify deployer history manually by copying the contract deployer address from the block explorer - it is listed on the contract page under "Creator" - and searching that address on the blockchain. Review the wallet's transaction history. Look for prior token deployments. If the wallet has deployed ten tokens in the past six months and nine of them show rugged liquidity pools (LP token balance drops to zero within days of launch), the tenth token is almost certainly a rug regardless of how clean the contract looks. Look for funding sources. If the deployer wallet was funded by another wallet that has a history of rug pulls, the presale is a coordinated operation. Look for patterns of behavior: repeated presale cycles, liquidity removals within hours of launch, identical contract structures across multiple tokens.
Automated tools that combine contract analysis and deployer scoring include ChainAware V3 and, to a lesser extent, Token Sniffer's "creator risk" metric. For manual verification, the process is time-consuming but straightforward: trace the deployer wallet's history on Etherscan or BscScan, flag any prior token deployments, and check whether those tokens still have active liquidity or whether the liquidity was drained. If the history shows repeated rug pulls, the current presale is part of the same pattern.
## Cross-Chain Exploitation and Multi-Chain Liquidity Verification
A less common but increasingly relevant failure mode is cross-chain liquidity bypass. The presale launches on Ethereum, and the marketing claims liquidity is locked on Ethereum. The contract is verified, the LP tokens are in a time-lock contract, everything appears safe. Then the developer drains liquidity on Polygon or Binance Smart Chain, where the same token has been bridged and where liquidity is not locked. The result is that the price collapses on one chain, arbitrage forces the price down on all chains, and the Ethereum liquidity lock becomes irrelevant because the token has no value.
You verify this by checking whether the token exists on multiple chains. Most presales now launch on at least two chains to capture liquidity from different ecosystems. Search the token contract address on multiple block explorers - Etherscan for Ethereum, BscScan for Binance Smart Chain, PolygonScan for Polygon. If the token exists on multiple chains, verify the liquidity lock status on every chain. A lock on Ethereum means nothing if the developer can drain liquidity on Binance Smart Chain. The verification process is identical on each chain: check the LP token holders tab, verify the time-lock contract, inspect for override functions.
## The Tools and Workflow That Protect Capital
The recommended verification stack for token presales in 2026 combines automated scanning for fast initial triage and manual contract inspection for final confirmation. Start with an automated tool - GoPlus Security, Token Sniffer, or Rugcheck.xyz - to scan the contract address. These tools flag obvious red flags: unverified contract, honeypot functions (code that prevents selling), concentrated token holdings (one wallet holds 30%+ of supply), missing or insufficient liquidity lock. If the automated scan shows critical red flags, stop. The presale is disqualified. If the scan passes, proceed to manual verification.
Manual verification involves five steps. First, open the contract on the block explorer (Etherscan, BscScan, etc.) and verify that the source code is published and matches the audit report if one exists. Second, read the contract code and search for the functions identified earlier: hidden mint, fee manipulation, blacklist toggles, pausable functions, proxy patterns. If any of those functions exist with `onlyOwner` access and no timelock, the contract is disqualifying. Third, verify the liquidity lock by checking the LP token holders tab and inspecting the time-lock contract for override functions. Fourth, trace the deployer wallet's transaction history and check for prior rug pulls or suspicious funding sources. Fifth, if the token is deployed on multiple chains, repeat the liquidity lock verification on every chain.
For deployer wallet behavioral scoring, add ChainAware V3 to the workflow if you have access. For readers who prefer open-source verification, the [How AI Detects Rugpulls](https://github.com/AmirhosseinHonardoust/How-AI-Detects-Rugpulls) repository provides technical breakdowns of Solidity pattern mining and feature extraction methods used in machine learning detection systems.
Additional resources for contract security verification include [OpenZeppelin's contract development documentation](https://docs.openzeppelin.com/learn/developing-smart-contracts), which outlines best practices for access control, upgradeability, and pausable mechanisms. Reading the standard implementations helps you recognize when a presale contract deviates from accepted patterns in ways that introduce risk.
## When Contract Verification Is Not Enough
Even a presale contract with no hidden functions, locked liquidity, and a clean deployer history can fail if the tokenomics themselves are unsustainable. A contract that enforces 10% transaction fees and uses 8% to buy back and burn tokens will eventually run out of liquidity regardless of whether the contract has a rug pull function. The price collapses not because the developer drained liquidity but because the mechanism itself is extractive. That failure mode is outside the scope of contract verification - it requires analyzing whether the token actually earns revenue or whether the promised yield comes from other people's deposits. For that analysis, see [whether the token actually earns anything](https://altcoininvestor.com/crypto-protocol-revenue-token-holders/) and [whether you can actually sell](https://altcoininvestor.com/crypto-liquidity-depth-slippage-small-cap/) when the time comes.
Similarly, a presale with locked liquidity and a clean contract can still fail if the team unlock schedule allows insiders to sell 50% of supply within three months of launch. The liquidity is locked, the contract is safe, but the price collapses under insider selling pressure. For that risk, [reading token unlock schedules](https://altcoininvestor.com/how-to-check-token-unlock-schedule/) is the necessary parallel analysis.
## Solidity Version Variance and Obfuscated Code
Two edge cases complicate contract verification. First, Solidity compiler version differences can affect bytecode output, which in turn affects decompilation and automated detection. A contract compiled with Solidity 0.6.12 may produce different EVM bytecode than the same source code compiled with 0.8.19, even if the logic is identical. Automated tools that rely on bytecode pattern matching may flag false positives or miss obfuscated rug pull functions depending on the compiler version used. You mitigate this by verifying that the contract source code is published on the block explorer (which confirms the compiler version and settings) and by reading the source code directly instead of relying solely on automated bytecode analysis.
Second, obfuscated code deliberately hides rug pull logic in ways that pass superficial audits. A developer can write a custom rug pull function that is syntactically valid Solidity but uses misleading variable names, complex conditional logic, or external contract calls that obscure the actual behavior. Automated audits that check only for known vulnerability patterns miss custom obfuscated logic. Manual code review by an experienced Solidity developer is the only reliable defense, and even that is fallible if the obfuscation is sophisticated. For individual investors, the practical mitigation is to avoid presales where the contract code is unusually complex, where variable names are non-descriptive (single letters or random strings instead of meaningful identifiers like `liquidityLockTime`), or where critical logic is delegated to external contracts that are not verified.
## The Takeaway
A presale contract that includes `onlyOwner` mint functions, fee manipulation without timelock constraints, blacklist toggles, or liquidity lock mechanisms with override functions is designed to enable a rug pull regardless of what the marketing promises. Verification is not a matter of reading the whitepaper or trusting an audit report published on the developer's website. It is a matter of opening the contract on Etherscan or BscScan, reading the source code, searching for the specific function names identified here, checking the LP token holder tab to confirm liquidity lock, inspecting the time-lock contract for hidden withdrawal functions, tracing the deployer wallet's transaction history for prior rug pulls, and repeating the liquidity verification on every chain where the token is deployed. The tools exist - block explorers, Token Sniffer, GoPlus, Rugcheck, ChainAware V3 - and the patterns are documented. The $569 million extracted from PancakeSwap presales in the first 20 weeks of 2026 came from investors who trusted claims instead of verifying the code. The contract is the covenant. Everything else is a promise from a counterparty you cannot hold accountable.
For broader context on disqualifying red flags beyond contract patterns, see [what disqualifies a low-cap token](https://altcoininvestor.com/crypto-red-flags-before-investing/) before you commit capital.
## Frequently Asked Questions
### What contract functions indicate a token presale is unsafe?
Functions restricted to onlyOwner that allow minting new tokens, changing transaction fees, blacklisting addresses, pausing trading, or upgrading the contract implementation without timelock delays are red flags. Search verified contract code on Etherscan or BscScan for mint, setFee, blacklist, pause, or proxy upgrade functions. If these exist with single-wallet control and no governance delays, the developer can drain value or trap holders after launch regardless of marketing promises about locked liquidity or audited code.
### How do I verify that presale liquidity is actually locked?
Open the token's liquidity pool on the DEX (Uniswap, PancakeSwap), find the LP token contract address, and check the Holders tab on the block explorer. At least 80% of LP tokens should be held by a burn address (0x000...dEaD) or a recognized time-lock contract (Unicrypt, Team Finance, PinkSale). If held by a time-lock, read the contract code to verify it has a releaseTime variable, a withdraw function that enforces block.timestamp checks, and no admin override functions like emergencyWithdraw or setReleaseTime.
### Why do audit reports sometimes fail to protect against rug pulls?
Audit reports review contract code at a specific point in time but do not guarantee the deployed contract matches the audited version, that critical findings were resolved, or that the contract was not upgraded or replaced after the audit. Verify the audited contract address matches the live deployment address on the block explorer, confirm all critical and high-severity findings are marked as resolved in the final report, and check whether the contract is upgradeable via a proxy pattern that allows post-audit modifications.
### What tools automatically detect presale rug pull patterns?
Token Sniffer, GoPlus Security, and Rugcheck.xyz scan contract code and flag unverified contracts, honeypot functions, concentrated holdings, and insufficient liquidity locks. ChainAware V3 adds deployer wallet behavioral scoring and achieves 90.1% detection accuracy by analyzing both contract patterns and the wallet's history of prior token deployments and liquidity drains. Use automated tools for fast initial triage, then manually verify LP token locks, contract functions, and deployer transaction history on the block explorer for final confirmation.
### Can a presale contract look safe but still be a rug?
Yes. A contract with no hidden functions and locked liquidity can still be a rug if the deployer wallet has a history of draining liquidity on prior tokens, if liquidity is locked on one chain but drained on another where the token is bridged, if the tokenomics are unsustainable and extract value mechanically over time, or if insider unlock schedules allow massive selling pressure within months of launch. Contract verification protects against code-level exploits but not against operator intent, cross-chain bypass, or structural economic failure.
The Weekly Yield Report
You now have the specific Solidity patterns and verification steps that detected $569 million in rug pulls across 20 weeks of 2026 data. The contract patterns and bypass methods evolve every quarter.
Every Thursday: where crypto yield actually is - stablecoins, liquid staking and DeFi lending, with the risk named next to the rate and what changed since last week.
[Get it free every Thursday](#/portal/signup)
Free. No trade calls, no allocations, no hype. Unsubscribe in one click.
### Bitcoin as USDT Settlement Rail After 12-Year Stablecoin Gap
URL: https://altcoininvestor.com/bitcoin-usdt-settlement-rail-rgb-protocol/
Last updated: 2026-10-06T18:00:06.000Z
Tether-backed Utexo is launching USDT on Bitcoin using RGB and Lightning Network protocols after closing a $7.5 million seed round co-led by Tether. This marks the first major stablecoin deployment on Bitcoin in twelve years, since Tether abandoned the Omni Layer protocol in 2014\. The October 2026 release is designed to turn Bitcoin from a pure store-of-value asset into a settlement rail for dollar-denominated transactions, directly competing with Ethereum and Tron as USDT infrastructure.
For crypto gambling operators, this development matters more than most infrastructure announcements. Settlement speed, transaction cost, and custody flexibility determine which platforms can offer competitive withdrawal economics and which cannot. Bitcoin-native USDT changes the calculation for licensed operators who have avoided Bitcoin because it lacked programmable dollar settlement. It also changes the income economics for affiliates, VIP players, and treasury managers operating within the crypto gambling vertical.
## Why Bitcoin Lost Stablecoin Settlement in 2014

Tether launched on Bitcoin's Omni Layer in 2014, the first blockchain deployment of USDT. The protocol worked, but it did not scale. Transaction throughput was low, confirmation times were long, and the scripting environment was not designed for the kind of programmable settlement logic that stablecoin issuers and institutional users required. By 2017, Ethereum had become the dominant USDT settlement layer, offering ERC-20 programmability, faster block times, and a developer ecosystem built around token standards. Tron followed in 2019, optimizing for high throughput and near-zero transaction costs, which made it the preferred chain for exchange deposit and withdrawal operations.
Bitcoin remained the largest cryptocurrency by market capitalization and the most trusted settlement layer for final value transfer, but it could not support the transactional velocity that stablecoin use cases required. Operators who wanted to offer USDT deposits and withdrawals built on Ethereum or Tron. Players who wanted to move USDT between wallets and platforms used those chains. Bitcoin was the reserve asset. It was not the payment rail.
The RGB protocol changes that. RGB is a smart contract system built on Bitcoin that uses off-chain computation with on-chain anchoring, similar in architecture to Lightning but designed for asset issuance and programmable logic rather than payment channels. The protocol allows USDT to settle on Bitcoin while maintaining the same programmability and transaction speed that Ethereum and Tron provide. When combined with Lightning Network for instant settlement, Bitcoin becomes a viable USDT rail for the first time since Omni.
## What RGB and Lightning Enable for Platform Economics
The RGB release allows Tether to issue USDT on Bitcoin with smart contract functionality, while Lightning provides instant settlement for small-to-medium transactions. This combination addresses the two primary barriers that kept Bitcoin out of transactional stablecoin use: speed and programmability. For operators, this opens new custody and settlement architectures that were not previously possible.
Licensed crypto casinos currently hold player balances in USDT on Ethereum or Tron, because those chains allow for automated hot wallet management, instant withdrawals, and low-cost batch processing. Bitcoin has been used primarily for player deposits and large withdrawals, where final settlement security matters more than speed. With RGB and Lightning, operators can now hold player balances in Bitcoin-native USDT, which provides the same programmable wallet infrastructure as Ethereum but with Bitcoin-level security and a custody model that institutional treasury managers and compliance officers prefer.
For affiliates and VIP players, the income implication is withdrawal cost and speed. Platforms that settle on Ethereum charge gas fees that vary with network congestion. During high-volatility periods, withdrawal costs can exceed $20 for a single USDT transaction, which erodes rakeback and affiliate commission income for users who withdraw frequently. Tron offers lower fees but carries reputational and regulatory risk that some licensed operators avoid. Bitcoin-native USDT on Lightning offers sub-dollar settlement cost with Bitcoin-grade finality, which makes frequent small withdrawals economically viable for the first time.
This matters specifically for players who treat gambling activity as a revenue surface. Skilled poker players, sports bettors with positive expected value, and bonus arbitrage specialists typically withdraw earnings frequently to minimize platform risk and to reallocate capital across opportunities. Withdrawal cost is a real friction in that income model. Lightning-settled USDT on Bitcoin reduces that friction to near zero while maintaining the custody security that Ethereum cannot match.
## The $7.5 Million Seed Round and Tether's Strategic Position
Tether co-led the $7.5 million seed round for Utexo, the infrastructure company building the RGB deployment. This is not a speculative investment. Tether controls the dominant stablecoin by circulating supply, with more than $120 billion USDT outstanding across multiple blockchains. The company earns revenue from the interest on reserve assets backing that supply, which means every additional use case for USDT increases the total circulating supply and therefore increases Tether's income.
Deploying USDT on Bitcoin expands the addressable market for Tether into custody environments and regulatory jurisdictions that prefer Bitcoin infrastructure over Ethereum or Tron. Institutional treasury managers, regulated exchanges, and licensed gambling operators in jurisdictions with strict custody requirements have historically avoided Ethereum-based stablecoins because the custody model and smart contract risk surface do not meet their compliance standards. Bitcoin-native USDT solves that problem, which expands Tether's total addressable market without requiring users to trust a new issuer or a new reserve structure.
For operators, this creates a new compliance path. Casinos licensed in Malta, Isle of Man, and certain Curaçao sub-licenses are required to hold player funds in segregated accounts with specific custody standards. Ethereum-based USDT does not meet those standards in many cases, which forces operators to settle in fiat or to use licensed stablecoin custodians with higher operational cost. Bitcoin-native USDT on RGB allows operators to hold player balances in a Bitcoin wallet structure that meets custody requirements while maintaining dollar-denominated accounting and instant settlement through Lightning.
The result is lower operational cost for licensed operators, which translates into better VIP economics and higher affiliate commission sustainability. Operators with lower treasury and custody costs can afford to pay higher rakeback percentages and more competitive RevShare structures, because their cost structure supports it. That is a direct income benefit for affiliates and skilled players operating within those platforms.
## Settlement Rail Competition and Operator Adoption Incentives
Bitcoin competes with Ethereum and Tron as USDT settlement infrastructure, but the competitive dynamics differ by use case. Ethereum remains the dominant chain for DeFi applications, which require composable smart contracts and deep on-chain liquidity. Tron remains the lowest-cost chain for high-volume exchange and remittance use, where transaction throughput and near-zero fees matter more than decentralization or security. Bitcoin offers final settlement security and a custody model that institutional users and regulated operators trust, which makes it the preferred chain for large-value storage and for compliance-sensitive environments.
For crypto gambling operators, the choice of settlement rail determines treasury cost, regulatory risk, and withdrawal economics. Platforms that serve retail players with small deposits and frequent small withdrawals will likely continue using Tron, because the cost structure is unbeatable for that use case. Platforms that serve VIP players, high-stakes poker, and sports betting with large balances will likely migrate toward Bitcoin-native USDT, because those users value custody security and withdrawal finality more than they value marginal cost savings on small transactions.
The [stablecoin income strategies](https://altcoininvestor.com/how-to-earn-passive-income-stablecoins-2026/) that work on Ethereum-based USDT will also work on Bitcoin-native USDT, but with different risk and cost profiles. Lending USDT on DeFi platforms requires Ethereum because that is where the liquidity pools and smart contract infrastructure exist. Holding USDT in a platform treasury or in a cold wallet for capital preservation works better on Bitcoin because the custody model is simpler and the security assumptions are stronger. Affiliates who earn RevShare commissions in USDT will prefer Bitcoin settlement if they withdraw frequently, because Lightning offers lower cost and faster finality than Ethereum without the regulatory uncertainty of Tron.
Operator adoption will depend on licensing jurisdiction and player demographics. I expect licensed operators in European jurisdictions to adopt Bitcoin-native USDT faster than unlicensed operators, because the compliance and custody benefits matter more in regulated environments. I expect poker rooms and sportsbooks to adopt faster than slots-focused casinos, because poker and sports betting attract skilled players who withdraw frequently and who value custody security. I expect VIP-focused platforms to adopt faster than casual-player platforms, because VIP players hold larger balances and care more about final settlement security than about marginal transaction cost.
## Income Implications for Affiliates and Platform-Adjacent Earners
Affiliates earn commission on player deposits, either as cost-per-acquisition (CPA) or as revenue share (RevShare) based on gross gaming revenue (GGR). Both models are sensitive to withdrawal friction. Players who face high withdrawal costs or slow settlement times are more likely to leave balances on-platform and to continue playing, which increases GGR and therefore increases affiliate income in the short term. But those same players are also more likely to experience platform risk, regulatory seizure, or exit scams, which destroys long-term affiliate income because the player never deposits again.
Bitcoin-native USDT on Lightning reduces withdrawal friction to near zero, which means players can withdraw earnings instantly at sub-dollar cost. This reduces short-term GGR because players hold smaller on-platform balances, but it increases long-term player lifetime value (LTV) because players trust the platform more and return more frequently. For affiliates operating on RevShare structures, this is a net positive. Lower withdrawal friction increases player retention, which increases total commissionable GGR over the player's lifetime, even if individual session GGR is lower.
For treasury managers and LP-into-casino-token holders, Bitcoin-native USDT offers a new reserve asset structure. Many casino tokens are backed by a percentage of platform GGR, which is held in a treasury and distributed to token holders as yield. Those treasuries are typically denominated in USDT or other stablecoins, held on Ethereum or Tron. Bitcoin-native USDT allows those treasuries to be held on Bitcoin with the same dollar accounting but with stronger custody security and lower smart contract risk. This reduces the probability of treasury loss due to Ethereum smart contract exploits, which have drained hundreds of millions from DeFi protocols over the past three years.
For skilled players, the income implication is capital efficiency. Players who extract positive expected value from poker, sports betting, or bonus arbitrage typically operate across multiple platforms simultaneously, moving capital to wherever the best opportunity exists. Withdrawal speed and cost determine how quickly they can reallocate capital. Lightning-settled USDT on Bitcoin allows instant reallocation at near-zero cost, which increases the number of opportunities a skilled player can exploit in a given time period. That is a direct income multiplier.
## The Takeaway
Tether's return to Bitcoin after twelve years is not a symbolic move. It is an infrastructure upgrade that changes settlement economics for licensed operators, affiliates, and skilled players operating within the crypto gambling vertical. Bitcoin-native USDT on RGB and Lightning offers the custody security and regulatory clarity that Ethereum cannot match, combined with the instant settlement and low cost that Tron provides but without the reputational risk. Operators in regulated jurisdictions will adopt first, followed by VIP-focused platforms and poker rooms. Affiliates on RevShare structures will see higher player LTV due to lower withdrawal friction. Skilled players will see faster capital reallocation and lower withdrawal cost, which increases the number of income opportunities they can exploit. The first platforms to integrate RGB-based USDT settlement will have a measurable competitive advantage in VIP retention and compliance cost, and that advantage will show up in affiliate commission sustainability within six months of deployment.
## Frequently Asked Questions
## Frequently Asked Questions
### Why did Tether leave Bitcoin in 2014 and why is it returning now?
Tether launched on Bitcoin's Omni Layer in 2014 but migrated to Ethereum in 2017 because Bitcoin lacked programmable smart contract infrastructure and transaction throughput for stablecoin use cases. The RGB protocol changes that by enabling off-chain smart contract computation with on-chain Bitcoin anchoring, combined with Lightning Network for instant settlement. This allows USDT to settle on Bitcoin with the same speed and programmability as Ethereum but with Bitcoin-grade custody security, which meets institutional and regulatory requirements that Ethereum cannot.
### How does Bitcoin-native USDT affect crypto casino withdrawal costs?
Crypto casinos currently settle USDT withdrawals on Ethereum or Tron. Ethereum gas fees can exceed twenty dollars during network congestion, which erodes income for affiliates and skilled players who withdraw frequently. Tron offers lower fees but carries regulatory risk. Bitcoin-native USDT on Lightning Network provides sub-dollar settlement cost with Bitcoin-level finality, making frequent small withdrawals economically viable for the first time. This reduces withdrawal friction for VIP players and improves capital efficiency for skilled players moving funds across platforms.
### Which crypto gambling operators will adopt Bitcoin USDT first?
Licensed operators in European jurisdictions like Malta and Isle of Man will adopt first because Bitcoin-native USDT meets custody and compliance requirements that Ethereum-based stablecoins do not. Poker rooms and sportsbooks will adopt faster than slots casinos because they serve skilled players who withdraw frequently and value custody security. VIP-focused platforms will adopt faster than casual-player platforms because VIP players hold larger balances and prioritize final settlement security over marginal transaction cost savings. Unlicensed operators will likely continue using Tron for cost reasons.
### How does this affect affiliate commission structures for crypto casinos?
Affiliates earning RevShare commissions based on gross gaming revenue will see higher player lifetime value because lower withdrawal friction increases player trust and retention. Bitcoin-native USDT on Lightning allows instant withdrawals at sub-dollar cost, which reduces on-platform balance size and short-term GGR but increases long-term player return frequency. Platforms with lower treasury and custody costs can afford higher rakeback percentages and more competitive RevShare rates, which directly benefits affiliates. This is especially valuable for affiliates promoting licensed operators to VIP players.
### What is the RGB protocol and how does it enable USDT on Bitcoin?
RGB is a smart contract system built on Bitcoin that uses off-chain computation with on-chain anchoring, similar in architecture to Lightning but designed for asset issuance and programmable logic. It allows Tether to issue USDT on Bitcoin with the same programmability as Ethereum ERC-20 tokens while maintaining Bitcoin-level security. When combined with Lightning Network for instant settlement, RGB enables Bitcoin to function as a transactional stablecoin rail for the first time since 2014, competing directly with Ethereum and Tron for USDT settlement infrastructure.
The Weekly Yield Report
You have just reviewed the first major stablecoin return to Bitcoin infrastructure in twelve years, with specific implications for operator custody cost, affiliate commission sustainability, and player withdrawal economics. Those settlement rails and adoption timelines will shift as licensed platforms integrate RGB deployment over the next six months.
Every Thursday: where crypto yield actually is - stablecoins, liquid staking and DeFi lending, with the risk named next to the rate and what changed since last week.
[Get it free every Thursday](#/portal/signup)
Free. No trade calls, no allocations, no hype. Unsubscribe in one click.
### Trust Wallet Review: Mobile Signing For Yield Deployment
URL: https://altcoininvestor.com/trust-wallet-review/
Last updated: 2026-10-03T02:03:31.000Z
## The Fee You Never See Itemized
Trust Wallet advertises "$0 wallet fee" in marketing materials and charges nothing to download, set up, or hold assets. That number is technically accurate. It is also deliberately incomplete.
When you execute a swap inside the Trust Wallet app, the wallet takes a 0.5-1% spread that never appears as a separate line item. The fee is baked into the exchange rate you receive. For an allocator rebalancing yield positions, liquidating staking rewards, or rotating LP exposure, that hidden margin compounds across every trade.
Uniswap's interface dropped its swap fee to 0% in late 2025\. Trust Wallet's undisclosed spread is wider than the transparent 0.50% that most aggregators publish. You are paying more for convenience, and the wallet never discloses how much.
## Built-In Staking: 20+ Assets, No Platform Fee, Direct Validator Risk

Trust Wallet supports native staking for more than 20 assets, including BNB, ATOM, SOL, DOT, and TRX. The wallet routes your stake directly to validators on each network and charges zero platform commission. Yields follow network rules: Cosmos often exceeds 16% APR, while BNB sits lower.
You bear validator commission and slashing exposure directly. Unlike exchange-based staking on Coinbase or Kraken, Trust Wallet does not abstract that risk or socialize slashing losses across a pooled product. If your chosen validator underperforms or is penalized, your stake absorbs the loss.
Lock-up times and unbonding periods follow protocol rules. Cosmos requires approximately 21 days to unbond. Trust Wallet does not shorten that window or offer instant liquidity. For allocators who need to exit quickly, that unbonding lag introduces opportunity cost that liquid staking tokens avoid.
The Stablecoin Earn feature deploys your assets into DeFi lending protocols and liquidity pools. Trust Wallet does not disclose which protocols receive your capital, the collateralization ratios behind them, or whether those protocols have been audited. You earn yield, but you do not know where the smart contract risk sits.
### Staking vs Self-Custody Yield Tools
Exchange staking charges 26-40% commission on gross rewards but removes operational complexity. Self-custody staking via Trust Wallet captures full validator yield but requires you to evaluate validator performance, track unbonding schedules, and manage slashing risk yourself. [Exchange staking vs self-custody staking](https://altcoininvestor.com/staking-on-exchange-vs-own-wallet/) presents a clear trade: convenience and socialized risk versus full control and direct exposure.
For allocators who treat staking as a long-term position and are comfortable selecting validators, Trust Wallet's zero-fee staking model preserves more yield than exchange products. For those who need liquidity or prefer delegated risk management, exchange staking or liquid staking derivatives are structurally better fits.
## Multi-Chain Support and RPC Data Leakage

Trust Wallet supports more than 100 blockchains under a single recovery phrase. That span includes Ethereum, BNB Chain, Polygon, Arbitrum, Optimism, Solana, Cosmos, and dozens of smaller networks. For an allocator managing staking positions, LP deployments, and lending exposure across multiple chains, the unified interface reduces operational overhead.
Trust Wallet is a light client. It queries remote nodes to retrieve balances, transaction history, and network state. Those queries disclose your wallet address, the assets you hold, and the frequency of your activity to the RPC operators the wallet defaults to.
The wallet does not offer a native privacy RPC option or allow you to configure custom endpoints without modifying settings manually. For allocators managing large positions or rotating capital frequently, that data leakage creates a potential surveillance vector. Competitors like Rabby and Rainbow offer RPC configuration at setup.
Network switching is smooth. Chain selection happens in two taps, and the wallet correctly adjusts gas denomination and fee estimation for each network. Gas controls and slippage settings are accessible, though slippage defaults are not always tight enough for low-liquidity pairs.
### Where Mobile Constraints Limit Yield Operations
Trust Wallet is available on desktop (Windows, macOS, Linux), mobile (iOS, Android), and as a browser extension. The mobile app remains the primary interface. Desktop and extension versions lag in feature parity and user experience design.
Complex DeFi operations like multi-leg swaps, flash loan arbitrage, or contract simulation are better suited to web-first tools such as Instadapp, Zapper, or DeFi Saver. Trust Wallet's DApp browser on mobile supports WalletConnect and direct integrations, but screen real estate and transaction preview limitations make it harder to verify complex calls before signing.
For allocators who rebalance positions frequently or interact with protocols that require precise parameter entry, the mobile-first design introduces friction. Desktop wallets with larger displays and better transaction simulation reduce the chance of costly errors.
## Transaction Security: Simulation Gaps and MEV Exposure
Trust Wallet includes a built-in security scanner that flags risky contracts and addresses before you sign. The scanner checks against known scam databases and warns when a contract requests unusual permissions. That layer catches low-sophistication attacks like honeypots and fake token approvals.
The wallet does not simulate transaction outcomes before execution. You see the contract call and requested permissions, but you do not see projected balance changes, token flows, or worst-case outcomes if the transaction reverts. For yield allocators entering new LP pools, exiting leveraged positions, or interacting with unaudited protocols, that lack of simulation increases the chance of signing a draining transaction.
Trust Wallet offers no native MEV protection. When you execute a large swap or exit a yield farm, your transaction is visible in the public mempool. Searchers can front-run your trade, extract value through sandwich attacks, or reorder transactions to your disadvantage. For allocators moving five-figure positions or more, that MEV exposure introduces slippage beyond what the wallet estimates.
Approval transactions on Ethereum and EVM-compatible chains require a separate on-chain call the first time you interact with a new token. That approval grants the contract permission to spend your tokens, often with no upper limit by default. Trust Wallet does not surface limited approvals or prompt you to set spending caps. If the dApp is compromised later, your tokens remain accessible until you manually revoke the approval.
On Ethereum L1, approval gas costs 50,000-80,000 gas. At 30 gwei and $3,000 ETH, that approval costs $4.50-$7.20\. For allocators testing new yield pools or rotating between protocols frequently, those approval fees compound.
## Security Audits, Certifications, and Breach History
Trust Wallet is ISO/IEC 27001 and ISO/IEC 27701 certified, with independent verification by A-LIGN. The wallet has been audited by CertiK, Cure53, Halborn, Kudelski Security, and Quantstamp. The codebase is built on the open-source Wallet Core library, which allows external review and community contribution.
The browser extension has logged two security breaches and a migration bug since 2026\. Desktop users managing larger positions via the extension face a higher attack surface than mobile app users. The mobile app has not experienced a comparable breach, but the extension's track record introduces concern for allocators who prefer desktop workflows.
For allocators deploying meaningful capital, [hardware wallets](https://altcoininvestor.com/best-crypto-hardware-wallets/) remain the structurally safer choice. Trust Wallet is a hot wallet. Your private keys are stored on your device, encrypted, but accessible to any process with sufficient permissions. Hardware wallets isolate keys in a secure element that never connects directly to the internet.
## Fee Structure Breakdown: What You Actually Pay
Trust Wallet charges no wallet creation fee, no account maintenance fee, and no direct transfer fee. Network gas fees apply to every on-chain transaction and vary by blockchain. BNB Chain charges approximately 0.000063 BNB per simple transfer, roughly $0.03 at current prices. Polygon transactions cost fractions of a cent. Ethereum L2 networks like Arbitrum and Optimism charge cents per transaction, far cheaper than L1.
Swap fees are where the wallet extracts revenue. The built-in swap feature routes transactions through decentralized exchanges or liquidity providers and embeds a 0.5-1% spread into the rate. That spread does not appear as a separate line. You see the final amount you will receive, not the breakdown of how much went to liquidity providers, how much went to the aggregator, and how much went to Trust Wallet.
Holding 100 or more TWT tokens waives the 1% surcharge on fiat on-ramp purchases. Without that holding, on-ramp partners like MoonPay or Ramp charge 2-5% for credit card or bank purchases, plus the Trust Wallet surcharge. For allocators buying stablecoins to deploy into yield, that 3-6% entry cost is structurally worse than wire transfers to a centralized exchange at 0-0.1%.
### TWT Token Discount Dependency
Trust Wallet's fee advantage requires locking liquidity in TWT. For allocators whose portfolio thesis does not include TWT, that discount creates an allocation conflict. You either accept higher fees or divert capital into a token you would not otherwise hold.
If TWT appreciates, the discount pays for itself. If TWT underperforms or you need to liquidate during a drawdown, the locked capital becomes a drag on portfolio returns. Compare that to wallets like MetaMask, which charge transparent fees with no token lock-in, or Rabby, which aggregates swaps with no native token dependency.
## Who Trust Wallet Is Right For
Trust Wallet fits allocators who prioritize mobile access, need multi-chain support under one recovery phrase, and are comfortable managing validator selection and unbonding schedules themselves. If you hold positions across 5-10 chains, check balances frequently on mobile, and prefer not to manage multiple wallet apps, Trust Wallet reduces operational overhead.
The wallet also fits smaller allocators for whom the 0.5-1% swap spread is less costly than the time required to move capital to an exchange, execute a trade, and withdraw. For positions under $5,000, convenience may justify the hidden fee.
### Who Should Use a Different Tool
Trust Wallet does not fit allocators who execute frequent rebalancing trades, manage five-figure positions, or require transaction simulation before signing. The hidden swap spread compounds across every trade. The lack of MEV protection introduces slippage on large exits. The mobile-first design limits complex DeFi interactions.
For allocators who need transparent fee breakdowns, configurable RPC endpoints, and native MEV protection, [wallets like Rabby, Rainbow, or MetaMask](https://altcoininvestor.com/best-crypto-wallet-for-beginners/) offer better control. For those managing six-figure positions or interacting with unaudited protocols, hardware wallets remain structurally safer.
If your primary use case is stablecoin yield, [centralized venues with transparent rates and disclosed counterparty risk](https://altcoininvestor.com/where-to-earn-interest-on-stablecoins/) deliver better risk-adjusted returns than Trust Wallet's undisclosed DeFi deployments.
## My Recommendation
Trust Wallet is acceptable for multi-chain position monitoring and small staking deployments. It is not the right tool for frequent rebalancing, large capital deployment, or yield strategies that require precise transaction control.
The hidden 0.5-1% swap spread is a toll you pay every time you rotate capital. That toll is acceptable if you trade infrequently and value mobile convenience. It is not acceptable if you rebalance weekly or manage positions above $10,000.
The lack of transaction simulation and MEV protection introduces risk that other wallets have solved. Rabby simulates every transaction before you sign. Cowswap routes trades through MEV-resistant batch auctions. Trust Wallet does neither.
Use Trust Wallet for monitoring balances, signing transactions on mobile when you are away from a desktop, and staking positions you intend to hold for months. Do not use it as your primary rebalancing tool, your entry point for complex DeFi strategies, or your wallet for positions large enough that a 1% hidden fee matters.
## The Takeaway
The decision is not whether Trust Wallet is good or bad. The decision is whether the convenience of mobile-first multi-chain access justifies a 0.5-1% fee on every swap, no MEV protection, and limited transaction simulation. For allocators who trade infrequently and hold small positions, it does. For those who rebalance often or manage meaningful capital, it does not. The wallet's revenue model extracts more from active allocators than passive holders, which means the more you use it for yield operations, the worse the economics become.
## Frequently Asked Questions
### Does Trust Wallet charge fees for staking crypto?
Trust Wallet charges no platform fee for staking. You pay validator commission and network fees directly, which vary by blockchain. Cosmos validators typically charge 5-10% commission on gross staking rewards. BNB Chain validators charge similar rates. Unlike exchange staking, Trust Wallet does not add an additional platform layer fee, but you bear slashing risk and unbonding delays directly. Lock-up periods follow protocol rules, often 21 days for Cosmos-based chains.
### What is the hidden swap fee in Trust Wallet?
Trust Wallet embeds a 0.5-1% spread into every swap executed through its built-in interface. The fee does not appear as a separate line item. You see the final amount you receive, not the breakdown of liquidity provider fees, aggregator fees, and Trust Wallet's margin. For a $1,000 swap, that hidden spread costs $5-$10, which compounds across frequent rebalancing trades. Uniswap's interface dropped to 0% in late 2025, making Trust Wallet's undisclosed margin comparatively expensive.
### Is Trust Wallet safe for large crypto positions?
Trust Wallet is a hot wallet, meaning your private keys are stored encrypted on your device but remain accessible to any process with sufficient permissions. The mobile app has not experienced a security breach, but the browser extension logged two breaches and a migration bug since 2026\. For positions above $10,000, hardware wallets like Ledger or Trezor provide structurally better security by isolating keys in a secure element that never connects to the internet.
### Does Trust Wallet protect against MEV and front-running?
No. Trust Wallet offers no native MEV protection. When you execute a swap or exit a DeFi position, your transaction is visible in the public mempool. Searchers can front-run your trade, sandwich your order, or extract value through transaction reordering. For allocators moving five-figure positions or larger, that MEV exposure introduces slippage beyond the wallet's estimates. Wallets like Cowswap and MEV Blocker offer batch auction routing and private mempool submission to mitigate this risk.
### Can Trust Wallet simulate transactions before signing?
No. Trust Wallet does not simulate transaction outcomes before execution. You see the contract call and requested permissions, but not projected balance changes, token flows, or revert conditions. Wallets like Rabby and Pocket Universe simulate every transaction and show worst-case outcomes before you sign. For yield allocators interacting with unaudited protocols or complex DeFi strategies, that lack of simulation increases the chance of signing a transaction that drains funds or fails unexpectedly.
Tool mentioned above
Ledger
Ledger devices display the full transaction on their own screen before you approve it, which is what stops an approval exploit at the point it matters.
[See Ledger devices](https://shop.ledger.com/?r=90612ff43561)
We may earn a commission if you sign up through this link, at no cost to you. It does not change what gets recommended.
The Weekly Yield Report
You have just read why Trust Wallet's 0.5-1% hidden swap spread and lack of MEV protection make it unsuitable for frequent rebalancing. Fee structures and security records change, and the next wallet breach or fee hike will shift the comparison.
Every Thursday: where crypto yield actually is - stablecoins, liquid staking and DeFi lending, with the risk named next to the rate and what changed since last week.
[Get it free every Thursday](#/portal/signup)
Free. No trade calls, no allocations, no hype. Unsubscribe in one click.
### Best DeFi Lending Platform: Aave, Compound, Morpho Compared
URL: https://altcoininvestor.com/best-defi-lending-platform/
Last updated: 2026-10-03T00:05:57.000Z
## The Decision You Are Making

You have capital to lend. Aave holds $19.6B across 23 chains. Morpho holds $11.4B across 45 chains. Compound holds $1.6B across 10 chains. The same USDC deposit yields 3.8-5.2% on Aave, 4.1-6.8% on Morpho, and 3.5-5.8% on Compound. The spread between them is driven by architecture, not marketing.
No single platform is best. The question is which one fits your asset, allocation size, and how often you want to rebalance when rates change. This article decomposes three mechanisms, names their failure modes, and identifies who each platform suits.
## Architecture Determines Rate and Risk Surface
Aave uses a monolithic pool. All deposits sit in a single contract. Borrowers post collateral and draw any supported asset against it. Risk parameters are set per asset by governance. When a new asset is added, every depositor is exposed to that asset's failure mode. The advantage is deep liquidity and a single risk surface. The trade-off is that adding an asset exposes the entire pool.
Morpho Blue is a minimal lending primitive. Anyone can deploy an isolated market. Curated vaults allocate deposits across those markets. Suppliers capture more of the spread because less capital sits idle than in a pooled model. The advantage is that risk choices are unbundled from liquidity provision. The cost is curator dependency.
Compound V3 uses one borrowable base asset per market. A collateral failure is contained by construction rather than by parameter tuning. The advantage is simplicity for risk reporting. The trade-off is reduced flexibility for multi-asset strategies.
The architectural difference is not cosmetic. When the KelpDAO crisis hit in April 2026, Morpho's isolated markets were entirely unaffected. Aave lost $11.6B in TVL over 30 days. Morpho continued growing. The isolation property limited blast radius. [Morpho's 650-line immutable core has undergone 25+ audits](https://altcoininvestor.com/is-morpho-lending-safe/) and the protocol risk is mitigated. The curator risk is not.
## Current Rates and What Drives the Spread

USDC supply APY as of October 2026:
- Aave V3: 3.8-5.2%
- Morpho Blue via MetaMorpho vaults: 4.1-6.8%
- Compound V3: 3.5-5.8%
The Morpho premium over Aave compresses to roughly 50 basis points when borrow demand thins. When ETH funding turns negative or basis-trade demand thins, borrow demand falls and the premium narrows. When borrow demand is rich, the Morpho premium widens past 200 basis points and the case for vault exposure strengthens.
None of the rates are fixed. Depositors looking to lock in a rate need a Pendle PT wrapper or a fixed-rate aggregator on top. The same asset can yield 3% on one protocol and 8% on another, driven primarily by utilization and borrow demand concentration.
Aave pools often run at 40 to 60% utilization. A meaningful share of supplied capital sits idle and dilutes lender returns. Morpho's vault architecture keeps capital closer to matched. Morpho's P2P matching eliminates the supply-borrow spread for matched positions. When a borrower and lender are matched directly, both receive better rates. For large positions, rate improvements of 0.5-2% are common.
The rate spread is not a marketing artifact. It is a structural consequence of how capital is deployed.
## Liquidation Mechanisms and Collateral Failure Modes
All three platforms rely on overcollateralization. Borrowers who let loan-to-value drift past the liquidation threshold lose collateral at a discount to liquidators, typically 5-15%. During fast collateral price drops, liquidations cascade and pile bad debt onto the protocol. March 2020, May 2022, and August 2024 all saw cascade events.
Aave's Safety Module stakes AAVE to cover bad debt. Compound and Morpho rely on overcollateralization buffers. The mechanism is not theoretical. The Euler exploit in March 2023 cost $197M. Cream Finance lost $130M in October 2021\. Mango Markets lost $114M to a price-oracle manipulation. [DefiLlama's hack tracker](https://defillama.com/protocol/aave) records $7.6B in cumulative DeFi losses, with lending protocols accounting for roughly 28% of that total.
The liquidation threshold is a parameter set by governance on Aave and by market deployers on Morpho. A poorly-parameterized Blue market with an LLTV too aggressive or a weak oracle can be unsafe. This is mitigated by curators choosing not to allocate to bad markets and by the isolation property limiting blast radius. Users must evaluate each vault independently rather than relying on a single protocol-level risk framework.
## Smart Contract Audit History and Track Record
Aave V3 has undergone 10+ audits including OpenZeppelin, Trail of Bits, SigmaPrime, Certora, and ABDK. Compound has been live since 2018 without a major exploit. Its simple architecture reduces attack surface. Morpho has had at least 25 smart contract audits by well-known security companies like Trail of Bits, Spearbit, and OpenZeppelin. Morpho Blue uses a minimalist, immutable smart contract (650 lines of Solidity) that has been formally verified by Certora.
Audit history is not a guarantee. But it is a prior. Compound's track record since 2018 is the longest in DeFi lending. Aave's audit count is the highest. Morpho's formal verification is the most rigorous. All three have strong technical foundations. The risk is not in the core contracts. The risk is in parameter choices, oracle dependencies, and governance execution.
## TVL Trends and Protocol Revenue Models
Aave holds 33.1% of the lending category's $55.02B TVL. Aave handles roughly 48% of all active DeFi loans as of early 2026\. Morpho has grown steadily through 2026 while Aave shed TVL during the KelpDAO crisis. Compound's TVL has declined relative to newer protocols but remains stable in absolute terms.
Over the 30 days to 29 September 2026, Aave's protocol kept $5.07 million of $36.97 million in fees. Morpho kept $0 of $19.51 million. DefiLlama records $0 of Morpho protocol revenue on all 958 days from 15 February 2024 to 29 September 2026\. Morpho returns all fees to lenders and borrowers. Aave and Compound retain a share for governance and protocol reserves.
The revenue model difference matters for long-term sustainability. Aave's reserve fund can backstop bad debt. Morpho has no protocol-level reserve. The isolation property limits contagion, but it does not eliminate it. If a vault allocates to a bad market, that vault's depositors lose capital. No protocol backstop exists.
## Allocation Size and Rebalancing Frequency
For allocations under $100K, gas costs and rebalancing friction matter. Aave's monolithic design means one transaction to deposit, one to withdraw. Morpho's vault design means the curator handles rebalancing across markets. Compound's single-asset markets mean straightforward entry and exit.
For allocations above $500K, rate differences compound. A 200 basis point spread on $500K is $10K annual. The case for Morpho exposure strengthens when the premium is wide. The case for Aave strengthens when depth and liquidity matter more than rate.
For treasury-style capital that does not rebalance often, Compound offers simplicity and containment. For active allocators who rebalance monthly or quarterly, Morpho offers rate and Aave offers depth. [Active allocators cluster in Aave for depth and rate](https://altcoininvestor.com/best-defi-protocols/). Treasury-style capital keeps showing up in Compound for containment.
## Institutional Proof Points and Custody Integration
Coinbase built its $300M+ bitcoin-backed loan product on Morpho infrastructure. SparkLend, within the Sky ecosystem, holds $6.8 billion in TVL and tracks the DAI Savings Rate. Aave has the longest list of institutional integrations, including Fireblocks, Copper, and BitGo custody layers. Compound is integrated into Coinbase Earn and other retail custody products.
Institutional adoption is not a recommendation. But it is a signal of operational maturity. The protocols that custody providers integrate are the protocols that have passed internal risk reviews. All three have.
## Who Each Platform Is Right For
Choose Aave if you want deep liquidity, E-Mode for correlated-asset strategies, and a single risk surface you can model. Aave suits allocators who deposit once and check quarterly, who value governance maturity over rate optimization, and who want the longest track record in multi-chain lending.
Choose Morpho if you want rate optimization, are comfortable evaluating individual vaults, and have the operational capacity to rebalance when the premium compresses. Morpho suits allocators who chase 50-200 basis points of yield, who trust specific curators, and who prefer isolation over pooled risk.
Choose Compound if you want simplicity, containment, and a track record since 2018\. Compound suits treasury allocations, institutional depositors who need straightforward risk reporting, and anyone who values minimalism over flexibility.
## My Recommendation
For most depositors with $50K-$500K in stablecoin allocation: split between Aave and Morpho. Put 60-70% in Aave V3 for depth and stability. Put 30-40% in a well-curated Morpho vault for rate. Rebalance quarterly when the Morpho premium compresses below 50 basis points or widens above 150 basis points.
For institutional or treasury allocations above $1M: use Aave V3 or Compound III. Both have long track records, extensive audits, and established governance processes. Aave offers more flexibility with E-Mode and multi-asset markets. Compound offers simplicity for straightforward risk reporting.
For active allocators who rebalance monthly and have operational capacity to monitor curator decisions: use Morpho. The rate premium is structural, not transient. [Understanding who sets risk parameters and what can take your principal](https://altcoininvestor.com/morpho-lending/) matters more than the APY displayed on the vault page.
Do not chase yield without decomposing the mechanism. The same 6% APY on USDC can come from real borrow demand or from emissions that dilute your position. [Verify the source of return before allocating](https://altcoininvestor.com/best-yield-bearing-stablecoins/). All three platforms publish utilization rates, borrow rates, and reserve factors. Check them.
## The Takeaway
The best DeFi lending platform is the one whose risk model matches your allocation size and rebalancing frequency. Aave offers depth and a single risk surface. Morpho offers rate and isolation. Compound offers containment and simplicity. The decision is not which protocol has the best marketing. The decision is which mechanism you understand well enough to recognize when it is breaking. LlamaRisk posted recommended cap and interest-rate changes for Aave V3 to the DAO's forum on 28 September 2026\. Aave rates and risk parameters move through active governance cycles, creating edge-case windows for rate hunters. Morpho curators reallocate capital across markets weekly. Compound parameters change slowly. Match your monitoring capacity to the protocol's volatility. If you cannot check your position monthly, do not allocate to the platform with the highest rate.
## Frequently Asked Questions
### Which DeFi lending platform pays the highest yield?
Morpho Blue via curated MetaMorpho vaults currently offers 4.1-6.8% on USDC, compared to Aave V3 at 3.8-5.2% and Compound V3 at 3.5-5.8%. The premium compresses to roughly 50 basis points when borrow demand thins and widens past 200 basis points when demand is rich. The higher rate comes from P2P matching that eliminates idle capital and reduces the supply-borrow spread. Users must evaluate each vault independently rather than relying on a single protocol-level risk framework.
### Is Aave safer than Morpho or Compound?
Aave V3 has undergone 10+ audits and holds 33.1% of lending TVL, but its monolithic pool design means adding a new asset exposes every depositor to that asset's failure mode. Morpho's isolated markets limit contagion but introduce curator dependency. Compound has operated since 2018 without a major exploit and uses single-asset markets for containment. All three have strong technical foundations. The risk is not in the core contracts but in parameter choices, oracle dependencies, and governance execution.
### How often should I rebalance between DeFi lending platforms?
For allocations under $100K, rebalancing monthly or quarterly makes sense when rate spreads exceed 100 basis points after accounting for gas costs. For allocations above $500K, a 200 basis point spread is $10K annual, justifying more frequent monitoring. Aave pools run at 40-60% utilization with stable rates. Morpho vault curators reallocate weekly. Compound parameters change slowly. Match your monitoring capacity to the protocol's volatility. If you cannot check your position monthly, do not allocate to the platform with the highest rate.
### What is the liquidation risk when lending on DeFi platforms?
Liquidation risk applies to borrowers, not lenders. Lenders face protocol risk and collateral cascade risk. When collateral prices drop fast, borrowers who cross liquidation thresholds lose collateral at a 5-15% discount to liquidators. During March 2020, May 2022, and August 2024 cascade events, bad debt piled onto protocols. Aave's Safety Module stakes AAVE to cover bad debt. Compound and Morpho rely on overcollateralization buffers. DefiLlama records $7.6B in cumulative DeFi losses, with lending protocols accounting for 28% of that total.
### Can I lose my principal when lending on Aave, Morpho, or Compound?
Yes. Smart contract risk, oracle manipulation, and governance failures can result in loss of principal. The Euler exploit cost $197M in March 2023\. Cream Finance lost $130M in October 2021\. Mango Markets lost $114M to oracle manipulation. All three platforms rely on overcollateralization, but during extreme market conditions bad debt can accumulate. Aave has a reserve fund backstop. Morpho has no protocol-level reserve but uses isolation to limit contagion. Compound's single-asset design contains collateral failures by construction.
The Weekly Yield Report
You have just compared three lending platforms with yields between 3.5% and 6.8% and different risk architectures. Those rates and risk parameters change weekly.
Every Thursday: where crypto yield actually is - stablecoins, liquid staking and DeFi lending, with the risk named next to the rate and what changed since last week.
[Get it free every Thursday](#/portal/signup)
Free. No trade calls, no allocations, no hype. Unsubscribe in one click.
### Centralized Exchange Yield: What You're Actually Lending Into
URL: https://altcoininvestor.com/how-does-binance-earn-work-cex-yield/
Last updated: 2026-10-02T23:10:45.000Z
## What You Think Is Happening When You Deposit Into Binance Earn
Binance Earn advertises 3-4% annual yield on Ethereum deposits. Coinbase shows 1.92% on the same asset. Kraken offers 2.56% if you accept a bonded lock-up. The user interface describes these products as "staking" or "flexible savings," language that suggests your deposit is assigned to a validator somewhere, earning consensus rewards, and that those rewards accrue to your account automatically. That is not what is happening in most cases.
What centralized exchange yield products actually do is transfer custody of your capital to the platform, which then deploys that capital into institutional loan markets, proprietary trading collateral, or validator infrastructure depending on the asset. The yield you receive is the residual after the platform retains its commission, covers operational costs, and absorbs the risk of counterparty default. The rate you see advertised is not the rate the platform earns. It is what remains after the platform has taken its share.
This is not new. European sovereign debt markets operated on the same principle throughout the 2000s. Greek government bonds advertised yields above 5% when German Bunds paid 3%. The spread reflected perceived default risk, not a magical ability of Greece to generate superior returns. When the underlying credibility broke in 2011, those yields stopped being yields. They became losses that had been accruing all along, disclosed at last. Every yield opportunity has one question that matters. Where does the money actually come from?
## Where the Yield Actually Comes From
The source of return depends on the asset you deposit and the product you select. For proof-of-stake assets such as Ethereum, Solana, or Cardano, the platform aggregates user deposits, runs validator nodes, collects consensus rewards and transaction fees, then distributes the net proceeds after deducting a commission. Binance retains 10-15% of gross staking rewards. Coinbase charges 25-35%. Kraken operates a tiered structure where commission drops from 30% to as low as 10% for larger bonded positions.
For stablecoins and non-staking assets, the mechanism is different. Flexible products work like a money market position. The deposited asset earns a variable daily rate recalculated from platform borrowing demand. The rate drops when borrow demand is thin and rises when traders are actively borrowing. For USDT specifically, flexible rates tend to run above those for BTC or ETH because stablecoin borrow demand is structurally higher. Traders borrow stablecoins to go long on altcoins without liquidating existing positions. Market makers borrow stablecoins to fund arbitrage and delta-neutral strategies. That institutional borrowing demand is what generates the 1.5% to 3% yields advertised on USDT flexible products.
The critical detail is that your deposit is no longer held in the platform's cold storage. It has been lent to a third party, introducing additional layers of risk. A user deposits one Bitcoin into a centralized lending platform in exchange for a 5% annual yield. The platform then lends that same Bitcoin to an institutional borrower such as a hedge fund or market maker at a higher interest rate that may reach 8%. In practice, this means the deposited asset is placed under the control of a third party. If that borrower defaults, or if the collateral backing the loan loses value faster than the platform can liquidate it, the loss may be absorbed by the platform's reserve fund or passed through to depositors depending on the platform's capital structure.
This is rehypothecation. The same capital is used multiple times as collateral for different obligations. Centralized crypto lenders have frequently engaged in this practice without explicit limits. These entities use customer deposits to fund proprietary trading desks or extend loans to other institutions. Because these activities often occur offchain, depositors have limited visibility into where their assets are deployed or how many times they have been re-pledged. The European interbank market discovered the consequences of this opacity in 2008\. When Lehman Brothers collapsed, counterparty chains seized because no institution could quantify its exposure to others. The crypto industry rediscovered the same risk in 2022 when Celsius, Voyager, and BlockFi all froze withdrawals within weeks of one another.
## Counterparty Risk and the Custody Trade-Off

Keeping assets in a [hardware wallet](https://altcoininvestor.com/best-crypto-exchanges/) earns nothing but preserves full self-custody. Binance Earn transfers custody in exchange for that yield, and the counterparty trade-off is the core risk consideration. When you deposit into a centralized exchange yield product, you are no longer the legal owner of that specific asset. You hold a contractual claim against the platform for the return of an equivalent quantity of the asset. If the platform enters bankruptcy, that claim joins the queue of unsecured creditors unless the jurisdiction or the platform's structure provides specific protections.
Centralized lenders may use omnibus wallets where all user funds sit in shared addresses, segregated wallets with individual addresses per user, or third-party qualified custodians. The latter offers better bankruptcy protection. If the platform fails, custodied assets may be ring-fenced from creditors. Coinbase, for example, is a publicly traded, NASDAQ-listed company and an S&P 500 constituent. Kraken holds a Wyoming-chartered bank subsidiary and received Federal Reserve recognition. Both are regulated, US-headquartered, and widely used by retail and institutional investors. That regulatory oversight does not eliminate counterparty risk, but it does create a legal framework for asset recovery that unregulated offshore platforms do not provide.
The question worth asking is what happens when the borrowing chain breaks. If a market maker borrows $10 million USDT from Binance at 8% and deploys it into a leveraged position that liquidates, Binance must decide whether to cover the loss from its reserve fund or halt withdrawals until the shortfall is resolved. The platform's capital adequacy and the size of its reserve fund determine whether depositors experience a delay, a haircut, or a total loss. This is not a hypothetical scenario. FTX held billions in user deposits and used them to fund Alameda Research's trading positions. When those positions collapsed in November 2022, [the exchange](https://altcoininvestor.com/best-crypto-exchanges/) froze withdrawals and entered bankruptcy within 72 hours.
## Commission Transparency as the Primary Differentiator
The single most important principle in staking comparisons is that gross APY, the headline figure a platform advertises, is not what stakers receive. CEX platforms withhold 25-40% of gross staking rewards as their operating fee before distributing the remainder to users. Platforms including Kraken, Coinbase, Binance, Bybit, and Nexo handle validator infrastructure, slashing coverage, and tax reporting summaries in exchange for a commission on rewards. It is that commission, not the headline APY, that determines what actually reaches your account.
Consider Ethereum staking at a gross protocol rate of approximately 3.2%. Kraken's bonded product charges a 20% commission, netting you approximately 2.56% APY. Coinbase's standard product charges 35%, netting approximately 2.08%. Binance retains 10-15%, netting approximately 2.7-2.9%. The difference between 2.08% and 2.56% is 48 basis points. On a $10,000 position held for one year, that difference is $48\. On a $100,000 position, it is $480\. [The arithmetic of leaving capital in below-market venues](https://altcoininvestor.com/defi-yield-opportunity-cost-rate-difference/) compounds over time.
Kraken's twice-weekly reward payout schedule is one of the most frequent among major CEX platforms. Binance distributes staking rewards daily for most assets. Coinbase distributes monthly. The frequency matters for two reasons. First, more frequent payouts allow you to compound rewards sooner if you reinvest them. Second, frequent payouts reduce the platform's working capital advantage. When Coinbase holds your rewards for 30 days before distributing them, it can deploy that capital during the interval.
Asset coverage varies widely. Binance Earn supports over 100 stakeable assets, making it the broadest CEX staking offering in 2026\. Coinbase supports eight primary proof-of-stake assets including Ethereum, Solana, Cosmos, Cardano, Tezos, and Polkadot. Kraken supports 23 stakeable assets compared to Coinbase's eight, and Kraken's net APY is typically higher after platform commissions. If you hold a mid-cap proof-of-stake token, Binance is the only major exchange likely to support it. If you hold Ethereum or Solana, all three platforms offer the product, and commission becomes the deciding factor.
## Lock-Up Terms, Early Exit Penalties, and Rate Volatility
Flexible products allow same-day redemption for major assets. Locked subscriptions offer a fixed APY for the chosen term, typically 30, 60, 90, or 120 days, but that rate applies only to the current subscription period. Early redemption triggers Binance's standard policy. All interest accrued up to that point is forfeited. If you lock 10 ETH for 90 days at 4.5% APY and redeem after 60 days, you receive your 10 ETH principal but zero interest. The opportunity cost of that forfeiture can exceed the yield differential between flexible and locked products.
Rate volatility is the second hidden cost. Flexible USDT rates on Binance ranged from 1.5% in August 2026 to over 8% during periods of high leverage demand in previous years. The rate recalculates daily based on platform borrowing demand. If you deposit $10,000 USDT expecting 5% based on last week's rate, and borrow demand collapses, the rate may drop to 2% the following week. The advertised rate is not guaranteed. It is a snapshot of current market conditions.
This is why comparing exchange staking to self-custody staking reveals structural trade-offs. Self-custody staking using a validator client or a non-custodial liquid staking protocol such as Lido captures full protocol yield without platform commission. Lido's stETH is deployable as collateral in Aave and as liquidity in Curve, enabling a second layer of yield on top of base validation rewards. That capital efficiency is not available with CEX staking because exchange-held staked assets are not transferable to external protocols. Your Binance-staked ETH cannot be used as collateral elsewhere. It sits in the platform's validator pool until you redeem it.
## Platform Comparison: Custody, Regulation, and Capital Deployment
The table below compares the three largest centralized exchange yield platforms by asset coverage, commission structure, and regulatory status.
| Feature | Binance | Coinbase | Kraken |
| --------------------- | --------------------------- | --------------------------- | ---------------------------------- |
| Assets Supported | 100+ | 8 primary | 23 |
| ETH APY (Net) | \~3-4% | \~1.92% | \~2.56% (bonded) |
| Staking Commission | 10-15% | 25-35% | 10-30% (tiered) |
| Spot Trading Base Fee | 0.10% | 0.40-0.60% | 0.25-0.40% |
| Lock-up Options | Flexible & 30-120 day | Flexible | Flexible & Bonded |
| Regulatory Status | Offshore, limited US access | US-regulated, NASDAQ-listed | US-regulated, Wyoming bank charter |
Binance offers the broadest asset coverage and the lowest commission, but operates with limited regulatory oversight in most jurisdictions. US users access Binance.US, a separate entity with lower liquidity and fewer supported assets. Coinbase and Kraken are both US-regulated and publicly accountable. Coinbase is a publicly traded company subject to SEC disclosure requirements. Kraken holds a Wyoming bank charter, which subjects it to state banking regulation and capital adequacy standards.
That regulatory framework matters when the platform encounters stress. In 2022, when Celsius and Voyager froze withdrawals, users had no legal recourse because the platforms operated offshore with no segregation of customer funds. Coinbase and Kraken, by contrast, are subject to periodic audits, capital adequacy requirements, and legal frameworks that establish customer priority in bankruptcy. The yield differential between Binance and Coinbase is approximately 1-2 percentage points on Ethereum. The regulatory differential is the legal enforceability of your claim if the platform fails.
## Hidden Risks: Validator Slashing, Contagion, and Custodian Defaults
Validator slashing occurs when a proof-of-stake validator is penalized for downtime or equivocation, the act of signing two conflicting blocks. The penalty can range from a small portion of staked capital to the entire validator balance depending on the severity of the infraction. Most CEX platforms absorb slashing penalties rather than passing them through to users, but the terms of service typically reserve the right to deduct losses if the platform's reserve fund is insufficient.
Coinbase staked 4.5 million ETH with its own validators by Q1 2026, representing 12.17% of all staked Ethereum on the network. That concentration creates systemic risk. If Coinbase's validator infrastructure experiences a mass slashing event due to a software bug or a coordinated attack, the losses could exceed the platform's reserve fund. The risk is not hypothetical. In 2020, a bug in Prysm, one of the most widely used Ethereum consensus clients, caused hundreds of validators to be slashed simultaneously. Platforms with large concentrated validator sets amplify that risk.
Contagion risk refers to the interconnected lending and collateral chains that link centralized platforms. If Platform A lends customer deposits to Market Maker B, and Market Maker B defaults, Platform A may face a capital shortfall that forces it to halt withdrawals or liquidate other positions to cover the loss. That liquidation pressure can trigger margin calls at Platform C, which holds collateral posted by Market Maker B. This is the dynamic that collapsed Three Arrows Capital, Celsius, Voyager, and BlockFi in sequence during the summer of 2022\. Each institution had exposure to the others, and the failure of one triggered cascading liquidations across the system.
[When TVL outflows accelerate](https://altcoininvestor.com/defi-tvl-outflow-meaning/), it is worth distinguishing data lag from liquidity freeze. If a platform suddenly restricts withdrawals or introduces processing delays, those are early signals of capital stress. The first hour of a liquidity crisis determines whether you can exit at par or join the bankruptcy queue. Most exploits drain 54-93% of funds in the first five minutes. [The sequence of actions that has actually preserved capital](https://altcoininvestor.com/defi-exploit-what-to-do/) in past incidents involves monitoring on-chain withdrawal queues, checking validator exit queues for proof-of-stake assets, and comparing platform-advertised rates to benchmark yields. If the platform is paying 3 percentage points above market to attract deposits, it may be attempting to cover a liquidity shortfall.
## Who Each Option Is Right For
Binance Earn is the correct choice if you hold mid-cap or niche proof-of-stake tokens that Coinbase and Kraken do not support, if you prioritize low commission and daily reward distribution, and if you accept the regulatory and jurisdictional risks of an offshore platform. Binance's 10-15% commission is the lowest among major exchanges, and its flexible products offer same-day redemption. The trade-off is limited legal recourse if the platform encounters stress.
Coinbase is the correct choice if you prioritize regulatory oversight and legal enforceability, if you hold only large-cap proof-of-stake assets such as Ethereum or Solana, and if you are willing to accept a 25-35% commission in exchange for US banking protections. Coinbase is publicly traded, subject to SEC disclosure requirements, and operates with transparent capital adequacy standards. The yield is lower, but the legal framework for asset recovery is stronger.
Kraken is the correct choice if you hold mid-sized proof-of-stake positions and want to optimize commission through bonded lock-ups, if you value frequent reward payouts, and if you prefer a US-regulated platform with a Wyoming bank charter. Kraken's tiered commission structure rewards larger positions with lower fees, and its twice-weekly payout schedule is the most frequent among major platforms. The trade-off is that bonded products lock your capital for the chosen term, and early redemption forfeits all accrued rewards.
Self-custody staking is the correct choice if you hold large positions in Ethereum or other liquid staking-compatible assets, if you want to deploy staked capital into DeFi protocols for additional yield, and if you are comfortable managing validator keys or using non-custodial liquid staking protocols. [Lido, Rocket Pool, and similar protocols](https://www.kraken.com/learn/kraken-vs-coinbase-staking) eliminate platform commission and enable capital efficiency that CEX staking cannot match. The trade-off is operational complexity and smart contract risk.
## The Recommendation
Use Kraken for Ethereum and Solana if your position size exceeds $10,000 and you can accept a bonded lock-up. The commission differential between Kraken bonded at 20% and Coinbase standard at 35% is worth $150 annually on a $10,000 ETH position. Use Binance for mid-cap and niche proof-of-stake assets that other platforms do not support. Use Coinbase only if regulatory enforceability is your primary concern and you are willing to pay the highest commission in the industry for that assurance.
For stablecoin yield, [DeFi protocols such as Morpho](https://altcoininvestor.com/morpho-lending/) and Aave offer transparent on-chain lending with real-time visibility into borrower collateral and utilization rates. Centralized exchange flexible products for USDT pay 1.5-3% with zero transparency into counterparty deployment. The yield is comparable, but the risk profile is not. On-chain lending allows you to verify that your capital is overcollateralized. CEX flexible products do not.
The decision rule is straightforward. If the platform cannot or will not disclose where your deposited capital is deployed, who is borrowing it, and what collateral backs that loan, you are taking blind counterparty risk. The yield may be higher, but the 2022 collapse of Celsius, Voyager, and BlockFi demonstrated that undisclosed rehypothecation chains break when leverage unwinds. European sovereign debt markets spent 2011 through 2013 discovering that yields advertised on Greek and Portuguese bonds reflected the perceived probability of default rather than any actual return of principal. When the underlying credibility broke, the yields stopped being yields. They became losses that had been accruing all along, disclosed at last.
## The Takeaway
Centralized exchange yield products transfer custody of your capital to the platform in exchange for a residual yield after commission, operational costs, and reserve fund contributions. The rate you see advertised is not the rate the platform earns. For proof-of-stake assets, the platform runs validators and retains 10-35% of gross rewards. For stablecoins, the platform lends your deposit to institutional borrowers and retains the spread. Commission transparency, regulatory status, and capital deployment disclosure are the three factors that determine whether you are taking compensated risk or blind counterparty exposure. Kraken offers the best net yield for bonded Ethereum positions. Binance offers the broadest asset coverage at the lowest commission. Coinbase offers the strongest regulatory framework at the highest cost. The choice depends on whether you prioritize yield, asset selection, or legal enforceability.
## Frequently Asked Questions
### How does Binance Earn actually generate the yield it advertises?
For proof-of-stake assets such as Ethereum or Solana, Binance aggregates user deposits, runs validator nodes, collects consensus rewards and transaction fees, then distributes the net proceeds after retaining a 10-15% commission. For stablecoins and non-staking assets, Binance lends your deposit to institutional borrowers such as market makers and hedge funds at a higher rate, retaining the spread. The yield you receive is the residual after Binance covers operational costs, commission, and reserve fund contributions. Flexible USDT rates fluctuate between 1.5% and 8% depending on institutional borrowing demand.
### What happens to my crypto when I deposit it into Coinbase Earn?
When you deposit into Coinbase Earn, custody transfers from your wallet to Coinbase. You no longer hold the private keys to that specific asset. Instead, you hold a contractual claim against Coinbase for the return of an equivalent quantity. Coinbase aggregates user deposits into validator nodes for proof-of-stake assets, retaining 25-35% of gross staking rewards as commission. If Coinbase enters bankruptcy, your claim joins the queue of unsecured creditors unless the platform's custodial structure or US regulatory framework provides specific protections. Coinbase is a NASDAQ-listed, SEC-regulated company, which creates a legal framework for asset recovery that unregulated offshore platforms do not provide.
### Why does Kraken charge lower commission than Coinbase for the same staking product?
Kraken operates a tiered commission structure where fees drop from 30% to as low as 10% for larger bonded positions. Coinbase charges a flat 25-35% commission regardless of position size or lock-up term. Kraken's bonded products require you to lock capital for a fixed term, and early redemption forfeits all accrued interest. Coinbase offers only flexible staking for most assets, which allows same-day redemption but commands a higher commission. The difference reflects operational cost structure, capital retention strategy, and competitive positioning. On a $10,000 Ethereum position, the commission differential is approximately $150 annually.
### What is rehypothecation and how does it affect my deposited crypto?
Rehypothecation occurs when a centralized platform uses your deposited crypto as collateral for its own trading or lending activities. Your one Bitcoin deposit may be lent to an institutional borrower, who then pledges it as collateral for a leveraged position elsewhere. This creates a chain of obligations where the same asset backs multiple liabilities. If any link in that chain defaults, the platform may face a capital shortfall. Centralized crypto lenders including Celsius, Voyager, and BlockFi engaged in undisclosed rehypothecation, which collapsed when counterparty defaults cascaded through the system in 2022\. Most CEX platforms do not disclose the extent or limits of rehypothecation in their terms of service.
### Should I use a centralized exchange or self-custody staking for Ethereum?
Use self-custody staking if your position exceeds $20,000, if you want to deploy staked ETH into DeFi protocols for additional yield, and if you are comfortable managing validator keys or using non-custodial liquid staking protocols such as Lido. Self-custody eliminates platform commission and enables capital efficiency through liquid staking tokens. Use a centralized exchange if you hold smaller positions, if you want the platform to handle validator infrastructure and slashing risk, and if you are willing to pay 10-35% commission for that operational simplicity. Kraken's bonded staking at 20% commission offers the best net yield among major CEX platforms. Coinbase charges 35% but provides stronger US regulatory protections.
The Weekly Yield Report
You have just compared three platforms charging between 10% and 35% commission on the same underlying yield. Those commission tiers will adjust again, and rates will shift with borrowing demand.
Every Thursday: where crypto yield actually is - stablecoins, liquid staking and DeFi lending, with the risk named next to the rate and what changed since last week.
[Get it free every Thursday](#/portal/signup)
Free. No trade calls, no allocations, no hype. Unsubscribe in one click.
### Home Mining With Variable Electricity Rates: Scheduling For Profit
URL: https://altcoininvestor.com/mine-crypto-with-time-of-use-electricity-rates/
Last updated: 2026-10-02T22:03:17.000Z
## What You Will Accomplish

Most home mining is unprofitable. Residential electricity averages $0.16 to $0.20 per kilowatt-hour in the United States, far above the $0.08 threshold where current-generation ASICs break even. Time-of-use pricing changes that equation.
This guide shows you how to schedule mining operations around variable electricity rates to achieve profitability that does not exist at flat pricing. You will learn to calculate your true breakeven point, automate hardware on and off cycles, and avoid the failure modes that turn a marginal setup into a money pit.
Prerequisites: a basic understanding of [Bitcoin mining economics](https://altcoininvestor.com/is-bitcoin-mining-still-profitable/), access to a time-of-use electricity plan, and willingness to run automation scripts or management software. If your utility offers only flat-rate residential power, this strategy does not apply.
## Why Time-of-Use Mining Works

Time-of-use plans charge different rates based on when you consume power. Off-peak hours typically run $0.06 to $0.08 per kWh. Peak hours can hit $0.25 or higher. The arithmetic is simple: mine when power is cheap, shut down when it is expensive.
A standard Antminer S21 Pro pulls 3,510 watts and consumes roughly 84 kWh per day. At a blended rate of $0.144/kWh running 24/7, you pay $312 monthly in electricity. Run the same miner only 15 hours daily during off-peak periods at $0.08/kWh, and your bill drops to $108\. That is a 65% cost reduction.
The breakeven line in 2026 sits around $0.10 per kWh when running S21-class equipment rated near 15 J/TH. Drop below that threshold and you are profitable. Stay above it and you burn cash. Time-of-use pricing gives you a narrow window to operate below breakeven during the hours that matter.
Heat recovery adds another layer. A miner producing 3,500W of heat output is equivalent to a $300 to $500 annual electric space heater. If you already heat with electricity in winter, mining converts that same cost into crypto rewards plus heat. The value compounds when you schedule mining during cold nights that overlap with off-peak hours.
## Step 1: Map Your Rate Structure

Contact your utility or check your billing portal for your exact time-of-use schedule. You need three numbers: off-peak rate, mid-peak rate, and peak rate. You also need the hours assigned to each tier.
Most residential TOU plans structure rates into three windows. Off-peak typically runs from 9 PM to 7 AM on weekdays and all weekend. Peak hits between 3 PM and 9 PM on weekdays. Mid-peak fills the gaps.
Watch for tiered pricing on top of TOU schedules. Some utilities implement usage tiers where your rate increases after you cross a monthly consumption threshold. A miner running 84 kWh per day adds 2,520 kWh monthly. If your tier two threshold sits at 1,000 kWh, you will push into the highest bracket and erase any off-peak savings.
Seasonal shifts matter. Summer cooling demand drives rates higher in hot climates. Winter heating demand does the same in cold regions. Your off-peak rate in January may differ from July. Pull 12 months of billing data if your utility provides it.
## Step 2: Calculate Your Breakeven Threshold
You need to know the exact electricity rate at which your hardware becomes unprofitable. Start with your miner's efficiency rating in joules per terahash. The Antminer S21 Pro runs 15 J/TH. The S21 XP hits 13.5 J/TH. The S23 series achieves 9.5 J/TH with hydro cooling and 11.0 J/TH with air cooling.
Lower J/TH means higher efficiency and a higher breakeven rate. At 15 J/TH, the S21 Pro breaks even around $0.088 per kWh. At 13.5 J/TH, the S21 XP extends that to roughly $0.10\. At 11 J/TH, you can tolerate rates up to $0.12 and still turn a small profit.
Use a mining calculator to input your hardware specs, current network difficulty, and electricity cost. MiningStore's free calculator pulls live network data and shows you daily, monthly, and annual profitability at different rate tiers.
Run three scenarios: off-peak only, mid-peak only, and blended 24/7\. Compare the outputs. If off-peak mining shows positive returns and peak mining shows losses, you have a viable TOU strategy. If all three scenarios show red, your hardware is too inefficient or your rates are too high.
At $0.07/kWh with an S21 Pro, you net roughly $77 per month in profit. At $0.12/kWh, you mine at a loss. The difference is $0.05 per kWh, which translates to $126 monthly on 2,520 kWh consumption. Every cent matters.
## Step 3: Choose Automation Tools
Manual power cycling is not scalable. You need software that starts and stops your miner based on your TOU schedule.
The simplest option is a Linux cron job paired with a script like mining-scheduler. It starts, stops, and rotates mining software on a fixed schedule. If you run a single miner on a dedicated Linux box, this works. Configuration requires basic command-line literacy but no programming.
For multi-rig setups or remote management, use Braiins Manager or Awesome Miner. Braiins Manager offers mining monitoring, remote configuration, curtailment management, and automation built for ASICs. Awesome Miner supports profit switching, rule-based scheduling, and monitoring across mixed hardware.
RainbowMiner measures real-time power consumption and pauses mining when profitability drops below zero. It works well for GPU rigs but adds unnecessary complexity for ASIC setups with fixed power draw.
All three options integrate with smart plugs or network-controlled PDUs. A TP-Link Kasa smart plug costs $15 and lets you cut power remotely via API. A Geist PDU costs $300 and handles eight outlets with per-port control. Choose based on how many miners you run and whether you need remote access.
Set your automation to power on 30 minutes before off-peak starts and power off 30 minutes before peak begins. The buffer accounts for boot time and prevents rate-boundary violations.
## Step 4: Test and Monitor Daily Consumption
Run your scheduled setup for one full billing cycle before scaling. Track daily kWh consumption using your utility's portal or a smart meter. Compare actual usage against your projected 84 kWh per day per miner.
If consumption exceeds projections, check for three issues. First, your miner may be drawing more power than rated due to overclocking or poor ventilation. Second, your automation may be failing to shut down during peak hours. Third, you may have crossed a tier threshold that raised your effective rate.
Download your utility's hourly usage data if available. Match the timestamps against your automation logs. Any overlap between high-rate hours and active mining means lost profit.
Monitor your miner's uptime percentage. ASICs tolerate power cycling better than GPUs, but repeated cold starts stress capacitors and fans. Expect a 3 to 5 year hardware lifespan under normal conditions. Frequent power cycling can reduce that to 2 to 3 years. Factor replacement cost into your ROI model.
## Step 5: Adjust for Seasonal Rate Changes
Most TOU plans shift rates seasonally. Summer cooling demand in Texas or California can spike peak rates to $0.30 or higher during heatwaves. Winter heating demand in the Northeast has the opposite effect, lowering off-peak rates but raising mid-peak.
Review your utility's rate schedule every quarter. Adjust your automation windows if off-peak hours shift or if rates cross your breakeven threshold. Some utilities publish rate forecasts 90 days ahead. Use them.
In extreme cases, shut down entirely during high-rate months. A summer shutdown in a hot climate preserves hardware lifespan, avoids cooling costs, and eliminates the risk of tier creep. Resume mining in fall when rates normalize.
## Common Failure Modes
Tier creep is the most common killer. You schedule mining perfectly, stay within off-peak hours, and still lose money because your total monthly consumption pushed you into a higher rate bracket. The fix: reduce total hours mined or add solar generation to offset baseline consumption.
Automation failures are the second failure mode. A script crashes, a smart plug loses Wi-Fi, or a PDU reboots during a firmware update. Your miner runs through peak hours and burns $50 in a single afternoon. The fix: redundant monitoring via SMS alerts or third-party uptime services.
Hardware obsolescence is the third. ASICs physically survive 3 to 5 years but become economically obsolete in 2 to 3 years as network difficulty rises and newer hardware ships. A miner profitable today at $0.08/kWh may require $0.06/kWh next year to break even. The fix: sell used hardware while it retains resale value and upgrade every 18 to 24 months.
## ROI Timeline and Payback Periods
At 2026 conditions, current-generation hardware on [hosted industrial power](https://altcoininvestor.com/is-bitcoin-mining-still-profitable/) pays back in 29 to 36 months. Home miners on TOU rates face longer timelines due to reduced uptime.
A $3,000 S21 Pro running 15 hours daily at $0.08/kWh generates roughly $77 monthly profit. That yields a 39-month payback period before accounting for difficulty increases or hardware depreciation. Add 20% to account for both, and you land near 47 months.
Compare that to the same miner running 24/7 on flat $0.12/kWh power, which produces a loss. TOU mining converts a losing setup into a breakeven or slightly profitable one, but it does not match industrial-scale returns.
The edge case where TOU mining shines: you already heat with electricity, you live in a region with winter off-peak rates below $0.07/kWh, and you can offset 80% of your heating bill with miner waste heat. In that scenario, payback drops to 24 to 30 months.
## What To Do Next
Run the breakeven calculation using your exact hardware and rate structure. If off-peak profitability is borderline, wait for the next hardware generation or negotiate a better TOU plan with your utility.
If the math works, start with one miner and one billing cycle. Prove the automation, confirm your tier assumptions, and verify your utility bills match projections. Scale only after you confirm positive cash flow.
Track network difficulty weekly. Bitcoin difficulty adjusts every 2,016 blocks, roughly every two weeks. Rising difficulty erodes profit margins. If difficulty climbs 10% while your electricity rate holds flat, your profit margin shrinks proportionally. [Join a mining pool](https://altcoininvestor.com/solo-mining-vs-pool-mining/) to smooth variance and receive predictable payouts.
## The Takeaway
Time-of-use mining converts an unprofitable flat-rate setup into a marginal or breakeven operation by exploiting off-peak electricity rates below $0.08/kWh. The strategy depends on automation, precise rate tracking, and hardware efficient enough to tolerate reduced uptime. Tier creep and seasonal rate shifts will erase gains if you do not monitor monthly. This is not passive income. It is active arbitrage of your utility's pricing structure.
## Frequently Asked Questions
### What electricity rate makes home Bitcoin mining profitable in 2026?
Bitcoin mining becomes profitable below approximately $0.08 to $0.10 per kWh when using current-generation ASICs rated between 11 and 15 J/TH. Time-of-use plans offering off-peak rates of $0.06 to $0.08/kWh enable profitability that does not exist at flat residential rates of $0.16 to $0.20/kWh. Every $0.01/kWh difference compounds to roughly $252 annually per 3.5kW miner.
### How much electricity does a home Bitcoin miner consume daily?
A standard Antminer S21 Pro rated at 3,510 watts consumes approximately 84 kWh per day when running continuously. At $0.08/kWh, that equals $6.72 daily or $201.60 monthly in electricity costs. Limiting operation to 15 off-peak hours reduces consumption to 52.65 kWh daily and cuts monthly costs to roughly $126, a 37% reduction in power usage.
### What automation tools work for scheduling miners on time-of-use rates?
Mining-scheduler is a simple Linux cron script for single-miner setups. Braiins Manager and Awesome Miner offer enterprise-grade remote control, curtailment management, and rule-based scheduling for multi-rig operations. Pair any of these with smart plugs or network-controlled PDUs to automate power cycling. Set buffers of 30 minutes before rate changes to account for boot time and prevent boundary violations.
### What is the payback period for home mining on time-of-use electricity?
A $3,000 Antminer S21 Pro running 15 hours daily at $0.08/kWh generates approximately $77 monthly profit, yielding a 39-month payback before difficulty adjustments. After accounting for rising network difficulty and hardware depreciation, expect 47 months or longer. Industrial-scale miners on 24/7 hosted power achieve 29 to 36 month payback. Home TOU mining converts a losing setup into marginal profitability but does not match industrial returns.
### Can tiered electricity pricing ruin time-of-use mining profitability?
Yes. Many utilities layer usage tiers on top of TOU schedules, increasing your rate after crossing a monthly consumption threshold. A miner consuming 2,520 kWh monthly can push you into the highest tier, erasing off-peak savings. Check your utility's tier structure before deployment. If tier two starts at 1,000 kWh and your baseline household usage is 800 kWh, adding a miner will trigger tier three pricing on every additional kilowatt-hour.
The Weekly Yield Report
You now have the breakeven math, automation tools, and failure modes for time-of-use mining. Your utility's rate structure and network difficulty will both change next month.
Every Thursday: where crypto yield actually is - stablecoins, liquid staking and DeFi lending, with the risk named next to the rate and what changed since last week.
[Get it free every Thursday](#/portal/signup)
Free. No trade calls, no allocations, no hype. Unsubscribe in one click.
### CoinLedger Pricing Tiers: Transaction Limits and What Counts
URL: https://altcoininvestor.com/coinledger-pricing/
Last updated: 2026-10-02T21:04:08.000Z
## CoinLedger Pricing Tiers: What Each Tier Actually Covers
CoinLedger charges based on transaction count, not features. Every paid tier includes identical functionality. The only variable is how many transactions you can report before hitting the tier limit.
The 2026 pricing structure breaks down as follows:
- **Hobbyist:** $49/year for up to 100 transactions
- **Investor:** $99/year for up to 1,000 transactions
- **Pro:** $199/year for up to 3,000 transactions
- **Advanced:** $299/year for up to 10,000 transactions
- **Unlimited:** $499/year for unlimited transactions
Portfolio tracking is free. You pay only when you need to generate tax reports. All tiers include Form 8949, Schedule D, capital gains and income reports, international reports, audit trails, and direct exports to TurboTax, TaxAct, H&R Block, and TaxSlayer.
If you exceed your tier limit mid-year, you pay the difference to the next tier, not the full price again. Someone who buys the $99 tier and later realizes they need the $199 tier pays an additional $100, not $199\. This removes the lock-in penalty that some competitors impose.
## What Counts as a Billable Transaction
The transaction count that determines your tier includes all taxable events CoinLedger imports. The definition is broader than most users expect.
**These activities count toward your transaction limit:**
- Trades: buying, selling, or swapping one crypto asset for another
- Staking rewards: each reward payout is a separate income transaction
- Interest income: daily, weekly, or monthly payouts from lending protocols
- Airdrops: tokens received for holding assets or participating in governance
- Mining income: block rewards and transaction fees
- LP position changes: depositing into liquidity pools, withdrawing, or receiving LP tokens
- Yield farm reward claims: governance tokens or protocol emissions
- Bridging: moving assets between blockchains creates disposal on the origin chain and acquisition on the destination chain
- Wrapping: converting ETH to WETH or similar token wraps is treated as a taxable disposition under conservative interpretation
**Fees do not count.** Transaction fees and gas costs are included in your cost basis calculations but do not increment your billable transaction count.
The critical mechanism here is how DeFi yield activity stacks transactions. A user who holds ETH and stakes it via Lido receives daily staking payouts. That is 365 income transactions per year from a single position. Add a second staking position or a yield farm with weekly reward claims, and the count escalates quickly.
### The $25 Micro-Transaction Deduction Rule
CoinLedger automatically deducts up to $25 worth of micro-transactions from your billable count. This applies specifically to staking rewards, interest payments, and other high-frequency income events.
The deduction is based on fair market value at the time of receipt, not transaction count. If you earn daily staking rewards worth $0.10 each, roughly 250 of those transactions are excluded from your billable count. This can prevent you from jumping to a higher tier solely because of high-frequency, low-value payouts.
No other major competitor offers a comparable deduction. For users earning yield from multiple staking positions or interest-bearing protocols, this mechanism can save $100 to $200 in annual tier costs by keeping total billable transactions under the 1,000 or 3,000 thresholds.
## How DeFi Yield Activity Inflates Transaction Counts

Yield farming and liquidity provision generate more taxable events than they appear to. A single yield farm position can produce five or more transactions per reward cycle.
Here is the breakdown of a typical LP position with auto-compounding:
1. **Swap into the pair:** You sell USDC for ETH and USDT. Each swap is a capital gain or loss transaction.
2. **Deposit for LP tokens:** Under conservative IRS interpretation, depositing assets into a liquidity pool and receiving LP tokens in return is a taxable disposition. You dispose of ETH and USDT and acquire a different asset (the LP token).
3. **Receive governance token rewards:** The protocol issues weekly or daily rewards in its native token. Each payout is ordinary income at fair market value.
4. **Auto-compound:** If the protocol or your wallet auto-compounds rewards, the system sells the governance token, buys more of the LP pair, and re-deposits. That adds three more transactions: sell governance token (capital gain/loss), buy LP pair assets (capital gain/loss), deposit (capital gain/loss).
A single auto-compounding LP position that pays weekly rewards generates approximately 260 transactions per year: 52 reward claims plus 156 transactions from auto-compounding (sell, buy, deposit). Add a second farm, and you are over 500 transactions without placing a single discretionary trade.
For users running multiple yield strategies, the transaction count explodes. Someone with three active farms, daily staking rewards, and occasional airdrop claims can easily exceed 1,000 transactions within three to four months.
### LP Deposit Tax Treatment Ambiguity
The IRS has not issued explicit guidance on whether depositing assets into a liquidity pool and receiving LP tokens constitutes a taxable disposition. The conservative position, which CoinLedger follows, treats each LP deposit as taxable. If the IRS later rules that LP deposits are not taxable, users who took the conservative stance will not face penalties. But the ambiguity means your transaction count in CoinLedger may not match your actual tax liability if you adopt a more aggressive interpretation.
## Staking Rewards and Compounding: What Gets Billed
Staking rewards are taxable as ordinary income when received, per IRS Revenue Ruling 2023-14\. Each reward also establishes cost basis for the tokens, so when you sell them later, only the change in value since receipt triggers a capital gain or loss.
Daily staking rewards from a single validator can add 365 income transactions per year. If you stake on multiple protocols or hold positions in multiple liquid staking derivatives (Lido, Rocket Pool, Frax), each generates its own stream of income events.
Compounding complicates this further. If you manually or automatically reinvest staking rewards, the reinvestment is a separate transaction. You sell the reward (capital gain/loss) and stake the proceeds (new acquisition). A monthly compounding routine adds 12 additional transactions per position per year.
The $25 micro-transaction deduction softens this. A user earning modest daily staking rewards (under $1 per day) may see 200 to 300 of those transactions excluded from billing, keeping them in the $99 Investor tier instead of the $199 Pro tier.
## Bridging, Wrapping, and Cross-Chain Activity
CoinLedger imports transactions from EVM-compatible chains, Bitcoin, Solana, and other major blockchains. Moving assets between chains creates two transactions: disposal on the origin chain and acquisition on the destination chain.
Bridging ETH from Ethereum to Arbitrum is not tax-neutral. You dispose of ETH on Ethereum mainnet (capital gain/loss based on cost basis versus fair market value at the time of bridge) and acquire ETH on Arbitrum (new cost basis at fair market value when received). If you bridge back later, you dispose of Arbitrum ETH and acquire mainnet ETH again. Each round trip is four transactions.
Wrapping tokens (ETH to WETH, for example) is treated as a taxable disposition under current guidance. Frequent wrapping and unwrapping for DeFi interactions can add dozens of transactions. A user who wraps ETH to provide liquidity, unwraps after withdrawal, and repeats this cycle across multiple protocols can easily add 50 to 100 transactions annually from wrapping alone.
## Where Each Tier Breaks Even Compared to Competitors
CoinLedger's pricing is competitive at mid-to-high transaction volumes. Below 100 transactions, free tiers from competitors like Koinly (which shows gains but gates report downloads) may be sufficient. Above 1,000 transactions, CoinLedger's $199 Pro tier is priced similarly to Koinly's $199 tier and CoinTracking's $169 tier (which covers 3,500 transactions).
At 3,000 transactions, CoinLedger charges $199\. CoinTracking charges $169 for 3,500 transactions, making it slightly cheaper at that volume. At 10,000 transactions, CoinLedger's $299 Advanced tier is competitive, though some competitors offer custom pricing at that scale.
The break-even point depends on how much of your transaction count consists of micro-transactions. If 20% to 30% of your transactions are staking rewards or small interest payouts under $0.50, CoinLedger's $25 deduction can save you one full tier upgrade, effectively making the $99 tier as capable as a competitor's $199 tier for your specific activity profile.
For more details on how other platforms price by volume, see [What Crypto Tax Software Really Costs At Your Transaction Volume](https://altcoininvestor.com/koinly-pricing/).
## Real-World Scenario: What 40 Trades Actually Costs
Maya placed 40 trades on Coinbase last year. She assumed the $49 Hobbyist tier would cover her. But she also staked ETH via Lido and received daily rewards. That added 365 income transactions. Her total count exceeded 400, putting her in the $99 Investor tier.
If Maya also participated in a single yield farm with weekly reward claims and monthly compounding, the farm added approximately 64 transactions (52 reward claims plus 12 compounding cycles). Her count is now over 460 transactions. If she bridged assets between Ethereum and Arbitrum twice during the year, add eight more transactions. She is firmly in the $99 tier, not the $49 tier.
Had Maya imported her data into CoinLedger's free portfolio tracker first, she would have seen the exact transaction count before purchasing a tier. CoinLedger recommends this: import everything, review your gains and losses, check your transaction count, and purchase the appropriate tier. This eliminates surprises.
### Missing Cost Basis and Manual Corrections
Newer DeFi contracts or incomplete exchange integrations sometimes require manual transaction labeling. CoinLedger may import a transaction but fail to identify its type correctly, requiring you to label it as a swap, income event, or transfer.
Manual corrections do not reduce your billable transaction count. They improve the accuracy of your tax report, but the transaction still counts toward your tier limit. Users with activity on newer protocols or less-common blockchains may spend additional time correcting labels without reducing the cost.
## When You Should Upgrade Mid-Year
If you discover mid-year that your transaction count exceeds your tier limit, upgrade immediately. The cost is incremental, not punitive. Waiting until year-end does not save money and risks incomplete data if you delay importing new transactions.
Common reasons to upgrade:
- You added a new staking position or yield farm
- You received an unexpected airdrop with retroactive vesting that counts as multiple income events
- You bridged assets between chains more frequently than anticipated
- You participated in a governance vote or protocol migration that generated additional taxable events
The free portfolio tracker shows your cumulative transaction count in real time. Check it quarterly if you are active in DeFi. If you are approaching your tier limit by mid-year, either upgrade or reduce transaction-generating activity (stop compounding rewards manually, consolidate staking positions, avoid unnecessary bridging).
## Where CoinLedger Falls Short
CoinLedger's feature set is U.S.-focused. International users can generate reports, but the platform lacks jurisdiction-specific cost basis methods for some countries. If you file taxes outside the U.S. and your jurisdiction uses FIFO, LIFO, or specific identification differently than the IRS, verify that CoinLedger supports your method before purchasing.
The $25 micro-transaction deduction is automatic and non-configurable. If you prefer to include all transactions for audit defensibility, you cannot opt out. The deduction applies whether or not you want it.
Integration coverage for newer DeFi protocols lags. If you farm on a protocol that launched within the past six months, expect to manually label some transactions. This does not break the system, but it adds work.
## How to Minimize Transaction Count Without Reducing Yield
If you want to stay in a lower tier without sacrificing income, adjust how you interact with DeFi protocols.
**Strategies that reduce transaction count:**
- **Consolidate staking positions:** Instead of staking across three validators, stake with one. This cuts income transactions by two-thirds.
- **Avoid manual compounding:** Let rewards accumulate and compound quarterly or semi-annually instead of weekly. Fewer compounding events mean fewer taxable transactions.
- **Minimize bridging:** Choose a primary chain for DeFi activity and avoid moving assets between chains unless necessary. Each bridge is two transactions.
- **Use protocols with lower reward frequency:** Protocols that pay monthly instead of daily reduce transaction count by 30x.
- **Batch withdrawals:** Withdraw yield once per quarter instead of weekly. This does not reduce income transactions but eliminates unnecessary trades and transfers.
These adjustments do not reduce your yield. They reduce the frequency of taxable events. The trade-off is flexibility. If you prefer to compound weekly or switch chains frequently, accept that you will pay for a higher tier.
For context on what yield positions actually return after accounting for transaction costs, see [What Your Yield Position Actually Returned](https://altcoininvestor.com/calculate-real-defi-returns/).
## The Takeaway: Know Your Count Before You Buy
CoinLedger's pricing is straightforward: count your transactions, pick the tier that covers them. The complexity is in understanding what counts as a transaction before you import your data.
DeFi yield activity inflates transaction counts faster than most users expect. Daily staking rewards, auto-compounding farms, bridging, and wrapping all generate taxable events. A user who thinks they made 50 trades may have 800 transactions once staking rewards and LP activity are included.
The $25 micro-transaction deduction is a meaningful edge case. If you earn frequent, low-value staking rewards, it can keep you in a lower tier. But it does not exempt you from reporting those rewards as income. It only reduces how many count toward your CoinLedger bill.
Use the free portfolio tracker to import all your wallets and exchanges first. Check your transaction count before purchasing a tier. If you are near a threshold, decide whether to upgrade immediately or adjust your DeFi activity to stay under the limit.
The real cost is not the tier price. It is the surprise of discovering you need a higher tier after you have already purchased. Import first. Count second. Buy third.
For users comparing CoinLedger to other platforms, see [Crypto Tax Software Free Tiers: What You Actually Get](https://altcoininvestor.com/is-koinly-free/) to understand what competitors offer at zero cost versus what requires payment.
## Frequently Asked Questions
### What counts as a transaction in CoinLedger?
Trades, staking rewards, interest income, airdrops, LP deposits and withdrawals, bridging between blockchains, and token wrapping all count as billable transactions. Each staking reward payout is a separate transaction. Yield farms with auto-compounding can generate five or more transactions per cycle. Transaction fees and gas costs do not count toward your limit but are included in cost basis calculations.
### How does CoinLedger's $25 micro-transaction deduction work?
CoinLedger automatically deducts up to $25 worth of staking rewards, interest payments, and other high-frequency income events from your billable transaction count. The deduction is based on fair market value at receipt, not transaction count. If you earn daily staking rewards worth $0.10 each, approximately 250 transactions are excluded. This can prevent you from upgrading to a higher tier due to low-value, high-frequency payouts.
### What happens if I exceed my CoinLedger tier limit mid-year?
You pay the difference to the next tier, not the full price again. If you buy the $99 Investor tier and later need the $199 Pro tier, you pay an additional $100\. There is no penalty for upgrading mid-year. The free portfolio tracker shows your cumulative transaction count in real time, so you can monitor whether you are approaching your tier limit.
### Do bridging and wrapping tokens count as transactions?
Yes. Bridging assets between blockchains creates two transactions: disposal on the origin chain and acquisition on the destination chain. Wrapping ETH to WETH is treated as a taxable disposition under conservative IRS interpretation. Each wrap or unwrap increments your transaction count. Frequent cross-chain activity or wrapping for DeFi interactions can add 50 to 100 transactions annually.
### How many transactions does a typical yield farm generate?
A single auto-compounding yield farm with weekly rewards generates approximately 260 transactions per year. This includes 52 reward claims plus 156 transactions from auto-compounding (sell governance token, buy LP pair, deposit). Farms that pay daily rewards or require manual compounding produce even more. Users running multiple farms can exceed 1,000 transactions within three to four months.
The Weekly Yield Report
You just saw how DeFi activity can inflate transaction counts from 40 trades to 800 billable events. Those counts will change as you add positions.
Every Thursday: where crypto yield actually is - stablecoins, liquid staking and DeFi lending, with the risk named next to the rate and what changed since last week.
[Get it free every Thursday](#/portal/signup)
Free. No trade calls, no allocations, no hype. Unsubscribe in one click.
### Wallet Hygiene For Airdrop Eligibility: What Protocols Check
URL: https://altcoininvestor.com/how-to-avoid-airdrop-sybil-detection/
Last updated: 2026-10-02T19:04:36.000Z
After reading this, you will know which on-chain behaviors disqualify wallets from airdrops and how to structure activity that passes detection filters. This is not about avoiding rules. It is about understanding what the rules measure and why farming operations get caught.
Prerequisites: A wallet you control. Enough ETH to pay gas for protocol interactions over months, not days. Realistic expectations that no method guarantees eligibility when the rules are not published in advance.
## What Actually Gets Flagged: The Five Signal Classes

Sybil detection algorithms run on five observable signals: funding lineage, transaction timing, behavioral clustering, contract interaction patterns, and IP connectivity. Each signal can disqualify a wallet independently. In combination, they produce a confidence score that determines allocation or disqualification.
Funding lineage is the single most reliable clustering method because it is cheap to compute and hard to obscure. Arbitrum's March 2023 distribution used on-chain data from Nansen, Hop, and OffChain Labs to identify wallets funded from the same source. LayerZero's June 2024 distribution filtered 803,093 wallets as Sybils, with funding graph analysis as the primary detection layer. The classic pattern is a star topology: one centralized exchange withdrawal address funds fifty wallets within a two-hour window, or one wallet distributes gas to fifty others in a single transaction batch.
Transaction timing compression is the second-most common flag. Wallets that execute all protocol interactions within 48 hours carry less evidence of independent usage. Arbitrum penalized wallets with all activity occurring within 48 hours by deducting one point from eligibility scoring. Transactions that always occur between the same two-hour UTC window, or batches of wallets executing identical actions within the same block range, produce a timing signature no organic user population generates.
Behavioral clustering flags wallets that follow identical transaction sequences. Common detection signals include wallets that bridge identical amounts on the same day, interact with the same set of contracts in the same order with the same function arguments, and execute the same number of swaps or liquidity deposits at the same intervals. AI-powered on-chain analytics now tag addresses as Smart Money, Whale, Airdrop Farmer, or Sybil Cluster by matching behavior templates across millions of addresses.
Contract interaction patterns measure activity depth. Arbitrum penalized wallets with balance below 0.005 ETH that had interacted with only one smart contract, reducing the score by one point. The threshold tests whether a wallet demonstrates economic commitment and behavioral diversity. Wallets that interact with only the minimum required contracts to qualify, with no additional protocol usage, consistently score lower.
IP connectivity clustering is the vulnerability most farmers underestimate. Connecting multiple wallets through the same residential Wi-Fi or commercial VPN server creates an immediate red flag. Protocols running Sybil checks inspect HTTP request headers, IP subnets, and Autonomous System Numbers via Infura logs or centralized exchange deposit IPs. LayerZero disqualified hundreds of thousands of wallets partly on IP clustering. Optimism disqualified 17,000 addresses with 14 million OP tokens reallocated, using IP analysis as one layer of the filter stack.
## The Funding Source Problem: How Clusters Form
Most Sybil disqualifications trace back to a single mistake: funding multiple wallets from the same source address within a compressed time window. The aPriori airdrop was exploited by one entity using 14,000 wallets that claimed more than 60 percent of the distribution. All wallets were freshly funded through Binance with zero prior history, received identical 0.001 BNB deposits, and immediately funneled tokens to a second layer of fresh addresses. On-chain analysis by Bubblemaps caught the cluster because the funding graph revealed the star topology.
To avoid this failure mode, fund each wallet from a different source or introduce significant time spacing between funding events. Withdraw from different centralized exchanges on different days. Use peer-to-peer transfers or decentralized exchange purchases with varied amounts and timing. The goal is to break the visible graph connection between wallets at the funding layer.
Even with staggered funding, post-claim consolidation remains the highest-risk behavior. Sending all airdrop rewards to one address after distribution is the primary method by which farmers get retroactively disqualified. Projects monitor claim transactions and flag addresses that consolidate tokens within hours of distribution. If you must consolidate, wait weeks or months, route through mixers or privacy tools, and never consolidate directly to the original funding source.
False positive risk is real. Fund five wallets from the same exchange account on the same day, and to an algorithm you are indistinguishable from a mini Sybil farm. Aggressive clustering algorithms flag legitimate wallets that merely look suspicious. This is a known trade-off. Projects accept false positives to reduce Sybil dilution, and appeals processes are rare or non-existent.
## Transaction Timing and Interaction Depth

The 48-hour activity window is outdated but still enforced in older distributions. Arbitrum's rule penalized wallets with all transactions occurring within 48 hours. Newer airdrops use graduated penalties rather than binary cutoffs. A wallet flagged for timing compression may receive a reduced allocation rather than full disqualification, which makes appeals harder and maximizes retained value for the project.
To pass timing filters, spread protocol interactions across months. Interact with target protocols at irregular intervals. Avoid batch operations where multiple wallets execute the same action within the same block range. Vary transaction times across different UTC hours and different days of the week. Organic users do not interact with protocols at precisely 09:00 UTC every Monday for twelve consecutive weeks.
Interaction depth measures how many unique contracts a wallet touches and how much economic value flows through it. Arbitrum's filter penalized wallets with balance below 0.005 ETH that interacted with only one smart contract. To pass depth filters, interact with multiple protocols, not just the minimum required for eligibility. Hold a balance above dust thresholds. Execute swaps, liquidity provisions, NFT purchases, or governance votes that demonstrate independent economic activity.
The challenge is that interaction depth requirements are never published in advance. You cannot know which contracts will count toward eligibility or which minimum balance threshold will be applied. The best heuristic is to behave like a user with genuine protocol interest rather than a wallet created solely to qualify for an airdrop. That heuristic is imperfect but historically more reliable than attempting to reverse-engineer unpublished rules.
### What Optimism and Arbitrum Actually Filtered
Optimism disqualified 17,000 addresses from the 2022 airdrop, reallocating 14 million OP tokens. Addresses needed to have used Ethereum for more than one day, measured as at least 24 hours between first and last transaction. Optimism explicitly stated it identified patterns of likely Sybil attackers who created tens, hundreds, or more duplicate addresses and required stronger activity criteria for these flagged clusters while preserving allocations for real users.
Arbitrum's March 2023 distribution implemented three published anti-Sybil rules. Wallets with all transactions occurring within 48 hours lost one point. Wallets with balance below 0.005 ETH that interacted with only one smart contract lost one point. Wallets identified as Sybils during the Hop protocol bounty program were fully disqualified. Despite these filters, X-explore analysis found 279,328 same-person addresses and 148,595 Sybil addresses bypassed the rules, representing approximately 253 million ARB tokens or 21.8 percent of the total airdropped supply.
The gap between published rules and actual detection demonstrates why reverse-engineering is necessary. Protocols publish minimal rules to avoid teaching farmers how to evade detection, but third-party on-chain analysis reveals the actual filtering logic after distribution. Nansen's research on Arbitrum's distribution provides detailed breakdowns of clustering methods, funding source analysis, and behavioral pattern matching that the project did not disclose in advance.
## IP and Connectivity: The Invisible Disqualifier
Using the same IP address across multiple wallets is the single biggest Sybil detection vulnerability that farmers underestimate. Protocols running Sybil checks cluster wallets by IP via Infura logs, centralized exchange deposit IPs, or RPC endpoint telemetry, then disqualify entire clusters. LayerZero disqualified more than 800,000 wallets in their 2024 distribution, with IP clustering as one detection layer.
To avoid IP-based clustering, use different network connections for each wallet. This means different physical locations, different ISPs, or different mobile data connections. Commercial VPN services do not solve this problem because multiple wallets routed through the same VPN exit node share the same IP in the protocol's logs. Residential proxies or mobile hotspots provide better isolation, but they introduce cost and complexity that most farmers cannot sustain at scale.
The alternative is to accept that multi-wallet farming carries IP clustering risk and structure activity to pass the other four signal classes. If funding source, timing, behavior, and interaction depth all pass scrutiny, IP clustering alone may not trigger disqualification. But if IP clustering combines with any other red flag, the confidence score rises and the wallet gets filtered.
## What Detection Missed: The Loopholes That Still Work
Sybil detection rules failed to stop four forms of Sybils in Arbitrum's distribution. Wallets with fewer than 20 addresses in a cluster passed filters because the clustering threshold was set higher. Wallets that made deposits and withdrawals using cross-chain bridges and exchanges obscured their funding lineage by introducing intermediary hops. Wallets with NFT purchases or fund collection activities after the snapshot but before distribution added behavioral noise that reduced clustering confidence. Wallets with detectable batch operation behavior on different chains like Ethereum and Optimism evaded single-chain clustering algorithms.
LayerZero introduced a self-reporting mechanism where farmers who voluntarily disclosed Sybil activity before the snapshot received 15 percent of their initial allocation. Approximately 1.3 million wallets self-reported and were accepted at reduced allocation, while an additional 803,000 flagged post-snapshot were zeroed. This precedent suggests that some projects now allow voluntary disclosure with partial recovery, which changes the risk calculus for farmers who believe they will be detected.
Cross-chain obfuscation remains the most effective evasion method. Fund wallets on Ethereum, bridge to Layer 2, interact with protocols, bridge back, and consolidate on a different chain. Each bridge hop breaks the direct funding graph connection and introduces intermediary addresses that dilute clustering confidence. This method adds cost and time but historically reduces detection rates.
## How to Structure Wallet Activity That Passes Filters
Fund each wallet from a different source. If you must use the same centralized exchange, withdraw on different days with varied amounts. Introduce intermediary wallets or peer-to-peer transfers to break the direct graph connection.
Spread protocol interactions across months, not days. Interact with multiple protocols beyond the minimum required for eligibility. Vary transaction timing across different hours and days. Avoid batch operations where multiple wallets execute the same action within the same block range.
Maintain balance above dust thresholds. Arbitrum's 0.005 ETH threshold is a known minimum, but newer distributions may use higher thresholds. Hold enough ETH to pay gas for ongoing interactions without needing frequent top-ups from the same source.
Use different network connections for each wallet. Different physical locations, different ISPs, or different mobile data connections. Do not route multiple wallets through the same VPN exit node or residential proxy.
Do not consolidate airdrop rewards immediately after distribution. If you must consolidate, wait weeks or months, route through mixers or privacy tools, and never consolidate directly to the original funding source. Post-claim consolidation is the primary behavioral flag that triggers retroactive disqualification.
Interact with protocols as a user with genuine interest, not as a wallet created solely to qualify. Execute swaps, liquidity provisions, NFT purchases, or governance votes that demonstrate independent economic activity. The heuristic is imperfect but historically more reliable than attempting to reverse-engineer unpublished rules.
## What to Monitor Ongoing
Check Nansen, Trusta Labs, and Bubblemaps for published Sybil analyses after each major airdrop. These firms provide the most detailed post-distribution breakdowns of filtering logic and clustering methods. [Nansen's research on Arbitrum's distribution](https://www.nansen.ai/research/an-on-chain-distribution-model-for-the-arbitrum-community) remains the most comprehensive public documentation of how a major airdrop applied Sybil filters.
Monitor your own wallet's on-chain footprint using block explorers and graph analysis tools. If your funding source, timing, or behavior matches known Sybil patterns, adjust before the next airdrop snapshot. Most disqualifications are visible in retrospect by comparing your wallet's graph structure to published Sybil cluster examples.
Understand that no method guarantees eligibility when the rules are not published in advance. Projects explicitly choose not to publicize filters to avoid teaching farmers how to evade detection. Optimism stated directly that "teaching sybils how to become undetectable is not in anyone's best interest." The best you can do is structure activity to pass the five observable signal classes and accept residual detection risk.
For broader context on [how to structure months-long airdrop farming campaigns](https://altcoininvestor.com/how-to-earn-crypto-airdrops/) and [how to assess single-wallet versus multi-wallet strategies](https://altcoininvestor.com/how-many-wallets-for-airdrops/), see the linked references. Those articles decompose the strategic trade-offs and cost structures that determine whether farming is economically viable.
## The Takeaway
Funding lineage analysis catches more wallets than any other detection method. If your wallets share a funding source, they will cluster. Spread funding across different exchanges, different days, and different amounts. Post-claim consolidation is the second-highest risk behavior. Wait months or route through privacy tools before consolidating. IP clustering disqualifies wallets that farmers assume are isolated. Use different network connections or accept that multi-wallet farming carries IP detection risk. The filters are not published in advance, the rules change with each distribution, and no heuristic guarantees eligibility. Structure activity to pass the five signal classes and monitor your on-chain footprint against published Sybil analyses after each major airdrop.
## Frequently Asked Questions
### What is the most common reason wallets get disqualified from airdrops?
Funding lineage is the primary disqualification trigger. Wallets funded from the same centralized exchange withdrawal address or wallet within a short time window cluster together in on-chain analysis. Arbitrum, Optimism, and LayerZero all used funding graph analysis as the first detection layer. The classic pattern is one address funding multiple wallets within hours, creating a star topology that algorithms flag immediately. Post-claim consolidation, where all airdrop rewards flow to one address, is the second-highest risk behavior.
### How long should I spread wallet activity to avoid timing flags?
Arbitrum penalized wallets with all transactions occurring within 48 hours. Newer distributions use graduated penalties rather than hard cutoffs, so spreading activity across months rather than days reduces timing-based clustering confidence. Interact with protocols at irregular intervals across different UTC hours and days of the week. Avoid batch operations where multiple wallets execute identical actions within the same block range. Organic users do not interact with protocols at precisely scheduled intervals.
### Can I use a VPN to prevent IP-based Sybil detection?
Commercial VPN services do not solve IP clustering because multiple wallets routed through the same VPN exit node share the same IP in protocol logs. Residential proxies or different mobile data connections provide better isolation, but protocols can still cluster by Autonomous System Number or subnet. LayerZero disqualified hundreds of thousands of wallets partly using IP clustering via Infura logs and centralized exchange deposit IPs. The safest method is different physical network connections for each wallet.
### What is the 0.005 ETH threshold in Arbitrum's airdrop rules?
Arbitrum penalized wallets with balance below 0.005 ETH that had interacted with only one smart contract, deducting one point from eligibility scoring. This threshold tested whether a wallet demonstrated economic commitment and behavioral diversity. Newer distributions may use higher balance requirements, so maintaining balance above dust thresholds and interacting with multiple protocols reduces the risk of depth-based filtering. The exact thresholds are never published in advance.
### What happens if I consolidate airdrop rewards after claiming?
Post-claim consolidation is the primary method by which farmers get retroactively disqualified. Projects monitor claim transactions and flag addresses that consolidate tokens within hours or days of distribution. If you must consolidate, wait weeks or months, route through mixers or privacy tools, and never consolidate directly to the original funding source. Some projects have clawed back allocations months after distribution based on consolidation patterns visible on-chain.
Tool mentioned above
Ledger
Ledger devices display the full transaction on their own screen before you approve it, which is what stops an approval exploit at the point it matters.
[See Ledger devices](https://shop.ledger.com/?r=90612ff43561)
We may earn a commission if you sign up through this link, at no cost to you. It does not change what gets recommended.
The Weekly Yield Report
You have just reverse-engineered the five signal classes that filtered 427,923 Arbitrum wallets and 803,093 LayerZero wallets. Those filters will be different for the next airdrop.
Every Thursday: where crypto yield actually is - stablecoins, liquid staking and DeFi lending, with the risk named next to the rate and what changed since last week.
[Get it free every Thursday](#/portal/signup)
Free. No trade calls, no allocations, no hype. Unsubscribe in one click.
### How To Buy Crypto With A Credit Card Without Destroying Your Return
URL: https://altcoininvestor.com/how-to-buy-crypto-with-credit-card/
Last updated: 2026-10-02T17:08:08.000Z
## The Dual Fee Structure Most Platforms Do Not Disclose Upfront
When you purchase cryptocurrency with a credit card, you pay two separate costs. The first is visible: the exchange fee charged by Coinbase, Binance, Crypto.com, or whichever platform you select. That fee typically ranges from 1.8% to 3.99% depending on the processor and your jurisdiction. The second cost is less visible but often larger: your credit card issuer's treatment of the transaction. Most major banks classify cryptocurrency purchases as cash advances, which means a separate cash advance fee of 3% to 5%, no grace period on interest, and an APR that often exceeds 25%. The combined cost before you have held the asset for a single day can reach 9% of your principal.
This is not theoretical. For a $500 crypto purchase, a 3.99% exchange fee costs approximately $20\. Add a 3% to 5% cash advance fee and you pay another $15 to $25\. The total upfront cost is $35 to $45, which represents 7% to 9% of your initial investment. If your card issuer treats the purchase as a cash advance, interest begins accruing immediately at an APR between 17.99% and 29.99%. There is no grace period. If you carry the balance for 30 days, you pay an additional 2% to 2.5% in interest charges. The all-in cost for that $500 purchase can exceed $50 before you have deployed the capital into any yield-generating position.
The eurozone experienced a similar dynamic during the sovereign debt crisis between 2011 and 2013\. Investors purchasing Greek and Portuguese sovereign bonds saw advertised yields of 15% to 22%, which appeared attractive until the underlying credibility of the issuer broke. The yields were not returns. They were compensation for default risk that had been accruing all along, disclosed only when the mechanism failed. Credit card fees operate in reverse: the cost is disclosed immediately, and the question is whether the yield you deploy into can recover that cost within a reasonable holding period. In most cases, it cannot.
## Exchange Fees And Processor Spreads By Platform
Coinbase charges approximately 3.99% on credit card purchases. Binance fees range from 1.8% to 3.5% depending on the payment processor and your region. Crypto.com charges around 2.99% for credit card purchases and frequently runs promotions offering zero fees for new users during their first 30 days. Kraken credit card deposits incur around 3.75% plus a fixed fee of approximately €0.25 per transaction. Zengo charges a combined processing fee of 3.75% and a gateway fee of 1.99%, bringing the total to 5.74% before your bank applies any additional treatment.
These are the fees the platforms disclose. What they do not always disclose is the spread embedded in the quoted price. Many exchanges mark up the purchase price by 1% to 2% above the real-time market rate. This spread is not labeled as a fee. It is embedded in the execution price. If Bitcoin trades at $63,000 on the spot market and your exchange quotes $63,800 for a credit card purchase, that $800 difference is a 1.27% markup. Combined with a 3.99% exchange fee, your actual cost is 5.26% before your bank applies any cash advance treatment.
OKX publicly discloses a 1% spread on basic buy and sell orders with no additional trading fees on top. That transparency is useful for calculating your actual cost. If you are deploying capital into a yield position, you need to know the total cost basis including spread. Otherwise your breakeven calculation will be wrong from the start, and you will discover months later that your position has not recovered the initial drag.
The lowest disclosed fee among major platforms is Binance at 1.8%, but that rate applies only to specific processors in specific regions. Most users pay closer to 3% to 3.5%. [Best Crypto Exchanges](https://altcoininvestor.com/best-crypto-exchanges/) tracks fee structures across platforms, but you should verify the exact rate for your jurisdiction and card type before initiating a purchase. Visa and Mastercard are accepted most often. American Express is inconsistent, and some issuers block crypto purchases entirely or process them as cash advances by default.
## Cash Advance Classification And Why Your Bank Treats Crypto Differently

The larger hidden cost is your credit card issuer's treatment of the transaction. Most major U.S. credit card issuers including JPMorgan Chase, Bank of America, Capital One, and Wells Fargo classify cryptocurrency purchases as cash advances or block them outright. When a transaction is coded as a cash advance, three things happen. First, you pay a cash advance fee, typically 3% to 5% of the transaction amount with a minimum of $10\. Second, interest begins accruing immediately at the cash advance APR, which ranges from 17.99% to 29.99% depending on your card and creditworthiness. Third, there is no grace period. If you pay your credit card balance in full every month, your purchases normally enjoy a grace period of at least 21 days before interest accrues. Cash advances do not. Interest starts on day one.
This matters because the effective cost of a credit card crypto purchase is not static. It grows every day you carry the balance. If you purchase $1,000 of cryptocurrency with a credit card and your issuer treats it as a cash advance, you pay a 4% cash advance fee ($40) plus a 3.5% exchange fee ($35), bringing your initial cost to $75 or 7.5%. If you carry that balance for 30 days at a 25% APR, you accrue an additional $20.55 in interest. Your total cost after one billing cycle is $95.55, or 9.55% of your principal. If you intended to deploy that $1,000 into a stablecoin yield position paying 6% APY, you are starting from a 9.55% deficit. It will take 19 months of compounding yield just to break even, assuming no withdrawal costs, no gas fees, and no volatility in the underlying asset.
Issuers may also set separate spending caps for cryptocurrency transactions. The merchant category code for cryptocurrency purchases is MCC 6051\. Some card issuers apply lower transaction limits to this category than to your overall credit limit. A cardholder with a $15,000 credit limit might find only $1,000 to $2,000 available for crypto-coded transactions in any given month. This is not disclosed prominently. You discover it when your transaction is declined or when your issuer calls to verify the purchase and informs you that crypto purchases are restricted.
The European Banking Authority issued warnings in 2013 and 2014 about the treatment of cryptocurrency purchases, noting that consumers often did not understand whether they were receiving the same protections as traditional card purchases. In the UK, Section 75 of the Consumer Credit Act provides chargeback protection for purchases between £100 and £30,000, but that protection does not extend to cash advances or to assets purchased on unregulated exchanges. The same dynamic applies in the U.S. If your credit card issuer treats the crypto purchase as a cash advance, you forfeit the standard dispute and chargeback protections. If the exchange fails to deliver the asset or if your account is frozen, your recourse through the card issuer is limited.
## Calculating The Breakeven Period For Yield Positions
The question that matters is not whether credit card fees are high. They are. The question is whether the yield position you intend to deploy into can recover those fees within a holding period that makes the purchase defensible. That requires a breakeven calculation.
Assume you purchase $1,000 of a stablecoin using a credit card. The exchange charges 3.5%. Your bank treats the purchase as a cash advance and charges 4%. Your total upfront cost is 7.5%, or $75\. You deploy the $1,000 into a stablecoin lending position on Aave paying 6% APY. How long does it take to recover the $75 cost?
At 6% APY, your position earns $60 per year, or $5 per month. To recover $75, you need to hold for 15 months. But this calculation assumes you can withdraw your funds and convert them back to fiat without incurring additional costs. In practice, you will pay gas fees to withdraw from Aave to your wallet (typically $3 to $50 depending on network congestion), then a withdrawal fee or spread when converting the stablecoin back to fiat on the exchange (another 0.5% to 1%). Add those costs and your breakeven period extends to 16 or 17 months. If the stablecoin you purchased experiences any depeg event during that holding period, your effective yield drops or turns negative, and the breakeven point moves further out or becomes unattainable.
Now assume the same $1,000 purchase, but you deploy into a higher-yield liquidity pool on Curve Finance offering 12% APY. At 12%, your position earns $120 per year, or $10 per month. To recover $75, you need to hold for 7.5 months. That is still a long holding period, but it is within the range where a credit card purchase might be defensible if you have no other funding option available and you need to deploy capital immediately to capture a time-sensitive opportunity.
The threshold where credit card purchases begin to make financial sense is around 15% APY, assuming your total upfront cost is 7% to 8% and you can hold for at least six months. At 15% APY, your $1,000 position earns $150 per year, or $12.50 per month. Recovering $75 takes six months. Below 15% APY, the breakeven period extends beyond one year, and you are exposed to protocol risk, depeg risk, regulatory changes, and interest rate shifts for an extended duration just to recover the initial fee drag. That is not a yield position. It is a speculative bet that the yield mechanism will remain intact long enough for you to break even.
## When Credit Card Purchases Are Defensible
There are scenarios where purchasing crypto with a credit card makes financial sense, but they are narrow. The first is when you have confirmed that your card issuer does not treat cryptocurrency purchases as cash advances. A small number of issuers code crypto transactions as standard purchases, which means you receive the normal grace period, no cash advance fee, and potentially rewards points. If your card offers 2% cash back on all purchases and your issuer does not code crypto as a cash advance, your effective cost is the exchange fee minus the rewards. A 3.5% exchange fee minus 2% cash back is a net 1.5% cost. That is recoverable within one to three months if you deploy into a position yielding 6% to 12% APY.
The second scenario is time-sensitive liquidity events. If a new Aave market launches offering 25% APY for the first 30 days to bootstrap liquidity, and you need to deploy capital within hours to capture that rate, a 7% upfront credit card cost can be recovered in less than four months even after the rate normalizes. But this requires confidence that the yield is real, that the protocol is solvent, and that you can withdraw when the rate drops. Most promotional yields are subsidized by token emissions, not protocol revenue. If the 25% APY comes from governance token rewards, you need to account for the likelihood that those tokens will decline in value by the time you can sell them. In that case, your effective yield is lower than advertised, and the breakeven period extends.
The third scenario is [airdrop farming](https://altcoininvestor.com/how-to-earn-crypto-airdrops/) where early participation is weighted heavily in the allocation formula. If a new protocol announces that the first 1,000 users who deposit liquidity will receive 10x weighting in the airdrop, and you expect the airdrop to be worth $200 to $500, a $70 credit card fee to deploy $1,000 immediately is recoverable if the airdrop materializes. But this is speculative. Most airdrops do not materialize at the valuations early participants expect, and many protocols never distribute tokens at all. You are paying a certain 7% cost for an uncertain future payment.
In all other cases, the math does not work. If you are deploying into passive stablecoin yield at 4% to 7% APY, the breakeven period is 12 to 24 months. That is longer than most market cycles. If you are purchasing Bitcoin or Ethereum with the intention of holding for appreciation, a 7% to 9% upfront cost is a permanent drag on returns. A Bitcoin purchase at $63,000 with a 7% fee has an effective cost basis of $67,410\. Bitcoin needs to appreciate 7% from the market price just for you to break even, before accounting for any opportunity cost of the interest you paid on the credit card balance.
## The Alternative Payment Methods That Preserve Capital
Credit card purchases should be compared to the alternatives. Bank transfers via ACH in the United States or SEPA in Europe typically cost zero. The settlement time is one to three business days, which means you cannot deploy capital immediately, but you preserve 7% to 9% of your principal. Debit card purchases cost 1.5% to 3.99% depending on the platform, which is half the cost of a credit card purchase when cash advance treatment applies. Wire transfers cost $15 to $30 in flat fees, which is cheaper than percentage-based fees for purchases above $1,000.
If you are deploying $500, a $25 wire fee is 5%, which is comparable to a credit card fee. But if you are deploying $5,000, a $25 wire fee is 0.5%. The larger the purchase, the more a flat fee favors wire transfers over percentage-based credit card fees. The tradeoff is time. ACH takes one to three days. Wires take several hours to one business day. Credit cards settle in minutes. The question is whether the time saved is worth 6% to 8% of your capital.
For [yield deployers starting with $1,000](https://altcoininvestor.com/how-to-start-earning-yield-on-crypto/), the calculus is clear. A $70 credit card fee is seven months of yield at 10% APY. Waiting two days for an ACH transfer preserves that $70, which compounds over time. At 10% APY compounding monthly, $70 grows to $77 after one year. That is an additional $7 of yield you would have lost to fees. Over a three-year holding period, the $70 saved at the start compounds to $94\. The time cost of waiting two days is measured in hours of foregone yield. The financial cost of paying 7% upfront is measured in months or years of compounding.
There is one exception. If the asset you are purchasing is experiencing a sharp short-term price movement, and you believe you can capture 10% or more appreciation by purchasing immediately rather than waiting two days for ACH settlement, the credit card fee can be justified as the cost of execution speed. But that is speculation on price volatility, not yield deployment. If your thesis is that Bitcoin will appreciate 15% over the next 48 hours, a 7% fee to enter the position immediately has a positive expected value. But if your thesis is that Bitcoin will appreciate 15% over the next six months, waiting two days to save 7% is the higher expected value trade.
## Step-By-Step Process For Credit Card Crypto Purchases
If you have determined that a credit card purchase is defensible for your situation, the process is straightforward, but there are common failure modes that will cost you additional fees or result in a declined transaction.
**Step 1: Verify your card issuer's treatment of cryptocurrency purchases.** Call the number on the back of your card and ask whether cryptocurrency purchases are coded as standard purchases or cash advances. Ask whether there is a separate transaction limit for cryptocurrency purchases under MCC 6051\. If the representative cannot answer, escalate to a supervisor. If your issuer treats crypto as a cash advance, calculate whether the total cost including cash advance fees and daily interest accrual is recoverable within your intended holding period. If it is not, use a different payment method.
**Step 2: Select a platform with transparent fee disclosure.** [Compare fee structures](https://altcoininvestor.com/best-crypto-exchanges/) across Coinbase, Binance, Crypto.com, and Kraken. Look for platforms that disclose both the percentage fee and the spread. Request a quote for your intended purchase amount and compare the quoted price to the real-time market price on a neutral source like CoinGecko or CoinMarketCap. If the spread exceeds 1.5%, the platform is embedding additional cost that is not labeled as a fee. Factor that into your breakeven calculation.
**Step 3: Confirm your card is accepted and your purchase amount is within limits.** Visa and Mastercard are accepted on most platforms. American Express is inconsistent. Some platforms accept Amex but apply higher fees. Confirm that your intended purchase amount is within both your card's overall credit limit and any category-specific limit for cryptocurrency purchases. If you are purchasing $2,000 and your card has a $1,500 crypto purchase limit, the transaction will be declined, and you may incur a failed transaction fee depending on your issuer.
**Step 4: Execute the purchase and verify the transaction code on your card statement.** After completing the purchase, wait 24 to 48 hours for the transaction to post to your card account. Check whether it is coded as a standard purchase or a cash advance. If it is coded as a cash advance and your issuer told you it would be coded as a standard purchase, call immediately to dispute the coding. Some issuers will reverse the cash advance fee if you can document that you were given incorrect information. If the transaction is coded as a standard purchase, verify that you are within the grace period and that interest will not accrue if you pay the balance in full by the due date.
**Step 5: Deploy the purchased crypto into your intended yield position within 24 hours.** Every day you hold the asset in your exchange wallet without deploying it into a yield-generating position is a day you are paying credit card interest (if coded as cash advance) without earning offsetting yield. Transfer the asset to your self-custody wallet or directly into the DeFi protocol where you intend to earn yield. Account for gas fees in your breakeven calculation. If you purchased $1,000 of ETH and it costs $15 in gas to transfer it to Aave, your deployed capital is $985, not $1,000, and your effective cost basis is higher.
**Step 6: Track your position and calculate actual yield net of fees.** [Portfolio tracking tools](https://altcoininvestor.com/how-to-track-crypto-portfolio/) allow you to input your cost basis including fees and monitor whether your yield position is on track to recover the upfront cost within your target holding period. If the advertised yield drops or if gas fees to maintain the position are higher than expected, your breakeven period extends. Reassess monthly whether continuing to hold the position is optimal or whether withdrawing and redeploying through a lower-cost funding method would improve your net return.
## Common Failure Modes And How To Avoid Them
The most common failure mode is discovering after the fact that your card issuer treated the purchase as a cash advance. You see the exchange fee of 3.5% and assume that is your total cost. Two weeks later, your card statement shows a 4% cash advance fee and daily interest accrual at 27.99% APR. Your effective cost is now 8.5% plus 30 days of interest, and your breakeven period has extended by six months. This is avoidable by calling your issuer before initiating the purchase and documenting the response. If the representative tells you crypto is coded as a standard purchase and it is later coded as a cash advance, you have grounds to dispute the fees.
The second failure mode is ignoring the spread. You compare exchange fees and select Binance at 1.8% over Coinbase at 3.99%. But Binance quotes you $64,200 for Bitcoin when the market price is $63,000\. The 1.9% spread plus the 1.8% fee means your total cost is 3.7%, not 1.8%. You thought you saved 2%, but you saved only 0.29%. Always compare the quoted execution price to the real-time market price and include the spread in your cost calculation.
The third failure mode is deploying into yield positions that pay in governance tokens without accounting for token price decline. A protocol advertises 20% APY, which looks attractive compared to your 7% credit card cost. But the 20% is paid in the protocol's governance token, which declines 40% in value over the six months you hold the position. Your nominal yield is 10% (half a year at 20% APY), but the token you received is worth 40% less, so your realized yield is negative 24%. Your credit card cost of 7% is a realized loss. The token yield was not real yield. It was dilution disguised as return.
The fourth failure mode is underestimating gas fees for withdrawal. You deploy $1,000 into a position on Ethereum mainnet. After six months, you have earned $50 in yield and recovered most of your credit card fee. You attempt to withdraw, and gas costs $35\. Your net yield after fees is $15, and your breakeven period just extended from six months to 10 months. If you had known withdrawal would cost $35, you would have deployed through an L2 or waited to accumulate a larger balance before withdrawing. Always confirm withdrawal costs before deploying capital, and factor them into your breakeven calculation.
## What To Do After Your Purchase
Once you have purchased crypto with a credit card and deployed it into a yield position, your next priority is paying off the credit card balance before interest compounds. If your issuer coded the purchase as a standard purchase and you are within the grace period, pay the balance in full by the due date. If it was coded as a cash advance, interest is already accruing. Pay off the balance as quickly as possible to minimize the total interest cost. Every dollar of interest you pay is another dollar your yield position needs to recover.
Monitor your yield position weekly for the first month and monthly thereafter. Verify that the advertised yield is being paid, that the protocol remains solvent, and that there are no liquidity issues that would prevent you from withdrawing when your target holding period is reached. If the yield drops below your breakeven threshold, calculate whether continuing to hold is optimal or whether you should withdraw, accept the loss, and redeploy through a lower-cost method.
Document all fees, gas costs, and realized yield for tax reporting. Credit card fees increase your cost basis, which reduces your taxable gain when you eventually sell or withdraw. Gas fees paid to deploy and withdraw are also deductible as transaction costs in most jurisdictions. [Crypto tax software](https://altcoininvestor.com/best-crypto-tax-software-3/) can track these costs automatically if you connect your wallet and exchange accounts, but you should verify that all fees are captured correctly.
Reassess your funding method before your next deployment. If you broke even or generated positive net yield after credit card fees, calculate whether waiting two days for an ACH transfer next time would have produced higher net yield. In most cases, it will have. If you deploy monthly or quarterly, the time cost of waiting two days is negligible, and the fee savings compound over multiple deployments.
## The Takeaway
Credit card crypto purchases cost 6% to 9% upfront when exchange fees and bank cash advance treatment are combined. That cost is recoverable only if you deploy into positions yielding above 15% APY and hold for at least six months, or if you are capturing a time-sensitive opportunity where speed of execution has measurable value. Below 15% APY, the breakeven period extends beyond one year, and you are exposed to protocol risk, depeg risk, and regulatory changes for a duration that makes the credit card cost indefensible. ACH transfers cost zero and settle in one to three days. Wire transfers cost $15 to $30 flat and settle in hours. For deployers starting with $1,000 or more, waiting two days preserves 7% of principal, which compounds to $94 over three years at 10% APY. The time cost of waiting is hours. The financial cost of paying 7% upfront is years.
## Frequently Asked Questions
### Do all credit cards treat cryptocurrency purchases as cash advances?
No. Treatment varies by issuer and card type. Most major U.S. banks including JPMorgan Chase, Bank of America, Capital One, and Wells Fargo either block crypto purchases or code them as cash advances, which trigger separate fees and immediate interest accrual. A smaller number of issuers code crypto as standard purchases, which means you receive the normal grace period and potentially earn rewards. Call your card issuer before purchasing to confirm how your specific card will code the transaction.
### What is the breakeven holding period for credit card crypto purchases?
Breakeven depends on your total upfront cost and the yield you deploy into. At 7% total fees and 10% APY, you need approximately eight to nine months to recover the cost. At 7% fees and 6% APY, breakeven extends to 14 to 15 months. Below 15% APY, credit card purchases are difficult to justify unless you are capturing a time-sensitive opportunity. Above 15% APY, breakeven drops to six months or less, which may be defensible if you have no lower-cost funding option available.
### Which crypto exchange has the lowest credit card fees?
Binance advertises fees starting at 1.8%, but this rate applies only in specific regions and with specific processors. Most users pay 3% to 3.5%. Crypto.com charges 2.99% and offers zero-fee promotions for new users. Coinbase charges 3.99%. Kraken charges 3.75% plus a small flat fee. Always compare the quoted execution price to the real-time market price, because exchanges often embed a 1% to 2% spread that is not labeled as a fee. Your total cost is the disclosed fee plus the spread.
### Can I dispute credit card fees if crypto was coded as a cash advance?
Possibly, if your issuer told you the purchase would be coded as a standard purchase and later coded it as a cash advance. Document your conversation with the issuer, including the representative's name and date. If the actual coding contradicts what you were told, call to dispute the cash advance fee. Some issuers will reverse the fee if you can show you received incorrect information. If you did not confirm treatment in advance, the issuer has discretion to code crypto purchases as cash advances, and disputes are less likely to succeed.
### Are there scenarios where credit card crypto purchases make financial sense?
Yes, but they are narrow. If your card issuer does not treat crypto as a cash advance and you earn 2% rewards, your net cost is the exchange fee minus rewards, which may be 1.5% to 2%. That is recoverable in one to three months at 6% to 10% APY. If you are capturing a time-sensitive yield opportunity above 20% APY or an airdrop with weighted early participation, a 7% upfront cost can be justified. For passive stablecoin yield at 4% to 7% APY, credit card purchases destroy returns and should be avoided.
The Weekly Yield Report
You now have the fee breakdowns, breakeven calculations, and platform comparisons for credit card crypto purchases. Those fees and yields will be different next month.
Every Thursday: where crypto yield actually is - stablecoins, liquid staking and DeFi lending, with the risk named next to the rate and what changed since last week.
[Get it free every Thursday](#/portal/signup)
Free. No trade calls, no allocations, no hype. Unsubscribe in one click.
### Reading Crypto Cycles: The Great Reset Playbook For 2026
URL: https://altcoininvestor.com/crypto-cycle-2026/
Last updated: 2026-10-02T16:05:42.000Z
## The Question: What Would a 2026 Crypto Reset Actually Look Like
Bitcoin traded at $84,201 as of October 1, 2026, approximately 47% off its October 2025 all-time high of $126,296\. BTC dominance held at 58.65%. The Fear and Greed Index read 74, still in greed territory. On-chain data from [Glassnode](https://insights.glassnode.com) showed 41 of 45 Bitcoin indicators sitting in the bottom two quintiles, with the Cycle Composite at 19.9, the coldest reading since the FTX collapse.
Those numbers point to a market in the reset window.
But what does a reset actually look like in 2026, when ETFs have fundamentally changed how capital flows into crypto, when on-chain valuation extremes have compressed compared to prior cycles, and when the traditional four-year halving framework shows signs of structural change?
This is the cycle-aware positioning question that matters for long-term holders in the fourth quarter of 2026.
## How Prior Resets Played Out: 2018 and 2022 Patterns

Two prior reset periods provide the historical baseline: 2018 and 2022.
In late January 2018, South Korean and Chinese regulators issued successive ICO bans. Many projects were exposed as scams. Market confidence collapsed. Within one month, most altcoins fell 70% to 90%. The reset was regulatory-driven and retail-heavy. Bitcoin dominance rebounded from cycle lows near 37% in January 2018 to above 70% by September 2019 as capital rotated back to the only asset with proven staying power.
The 2022 reset followed a different script.
Terra Luna collapsed in May 2022, wiping out $40 billion in market value in 72 hours. Three Arrows Capital defaulted. Celsius froze withdrawals. FTX filed for bankruptcy in November 2022\. Bitcoin fell from $69,000 in November 2021 to $15,476 in November 2022, a 78% drawdown. Throughout 2022 and 2023, altcoins remained depressed. Bitcoin dominance rebounded from 40% to over 55% as contagion spread through leveraged entities.
Both resets shared common on-chain signals: exchange inflows spiked as long-term holders distributed, MVRV (Market Value to Realized Value) dropped below 1.0 into capitulation territory, and altcoin-to-BTC ratios collapsed as capital fled to safety.
The 2026 reset carries echoes of both periods but operates under different structural conditions.
## What Changed: Institutional Capital and ETF Structural Effects
The April 19, 2024 halving reduced the block reward from 6.25 BTC to 3.125 BTC. At the October 2025 ATH, Bitcoin had gained 100% from the halving price, the smallest post-halving gain on record. ETF inflows absorbed daily new supply. Institutional demand dwarfed the supply shock.
That changed the cycle mechanics.
US spot Bitcoin ETFs create institutional demand flowing through OTC channels not fully captured by traditional on-chain exchange flow data. Fidelity's entity-adjusted MVRV stayed mostly between two and three during the 2024-2025 advance. Earlier cycle peaks reached approximately four to six. The compression signals that institutional presence is dampening traditional cycle extremes.
Inflows through spot ETFs contributed to shorter consolidation periods. Traditional cycle timing windows became less reliable for 2026 bottom-calling. The four-year halving cycle has not been broken, but it has evolved. Global liquidity conditions and institutional capital flows now determine amplitude and timing more than the halving alone.
This means historical drawdown comparisons lose some predictive power. The 80% drawdowns that marked prior bear markets may not repeat if institutional buyers treat 40% to 50% corrections as accumulation opportunities.
## The On-Chain Signals That Mark Cycle Inflection Points
MVRV remains the most reliable cycle positioning indicator historically. Readings below 0.8 mark deep bear territory. Readings between 0.8 and 1.0 identify cycle bottoms. The 1.0 to 2.5 range represents recovery and accumulation. Readings from 2.5 to 3.0 signal late bull conditions. Above 3.0 enters the danger zone.
As of October 2026, Bitcoin's MVRV sat in the lower recovery range, consistent with a market in early accumulation.
Bitcoin dominance provides the second key signal. Dominance remained elevated near 58% to 60%, well above the 55% threshold that many analysts flag as a prerequisite for meaningful capital rotation into altcoins. The [Blockchain Center's Altcoin Season Index](https://altcoininvestor.com/crypto-market-cycles-altcoin-timing/) read 49, still 26 points below the 75 threshold for confirmation. A sustained BTC dominance break below 55% would be needed before a broad altcoin rotation could be confirmed.
Exchange inflows mark the third inflection signal.
In November 2021, Bitcoin hit its $69,000 all-time high with over $8 billion in exchange inflows over 72 hours, primarily from long-term holder distribution. That preceded a 75% crash to $15,000 over 12 months. In contrast, exchange outflows and declining exchange balances signal accumulation as coins move to long-term holder wallets.
As of late September 2026, Bitcoin exchange inflows surged to 49,000 BTC, a rare level historically associated with heightened volatility. Average Bitcoin exchange deposits doubled to two BTC, signaling rising whale and institutional activity. That pattern does not yet confirm a bottom, but it does confirm the reset is in process.
## The 2026 Altcoin Problem: Oversupply and Institutional Selectivity
Altcoins gained 38% from June through early October 2026 and held $1.16 trillion in market value. Bitcoin added over $508 billion. Altcoins took in over $319 billion. But the gains were not evenly distributed.
One major reason for the lack of a classic altcoin season this cycle is the oversupply of newly launched tokens. Barriers to creating and issuing tokens have decreased, resulting in a surge of new projects. Large institutional players concentrated holdings in major assets while retail capital pursued short-term investment narratives. As liquidity distributed across numerous tokens, potential gains for most altcoins diminished.
The data suggests that 99% of altcoins may never return to prior all-time highs.
That creates a bifurcated market structure. A small number of altcoins with institutional backing, real revenue models, and defensible network effects will survive and compound through the cycle. The rest will fade. Autumn 2021 marked the end of the bull market with a meme coin and GameFi frenzy. Most GameFi and meme coins fell over 95% from peaks. Many investors who bought at highs remain deeply trapped today.
The reset playbook for 2026 requires selectivity at the asset level, not broad basket exposure to "altcoins."
## Strategies That Survive a Reset vs Strategies That Fail
What survives a reset?
Structural yield holdings survive. Staking positions on proof-of-stake networks with established validator ecosystems continue generating yield through drawdowns. Ethereum staking, Solana staking, and Cosmos ecosystem staking all produced positive real yield through the 2022 bear market. Those positions benefit from lower entry cost basis during resets and compounding through accumulation phases.
Long-term holder positions in BTC and top-tier altcoins survive. [Institutions accumulated Ethereum, Chainlink, and Solana](https://altcoininvestor.com/2026-altcoin-reset-top-3-tokens/) during the 2026 correction, driven by real-world asset growth, Layer-2 scaling demand, and validator network expansion. Those assets have revenue models, institutional custody infrastructure, and regulatory clarity that most altcoins lack.
What fails?
Leverage stacks fail. Margin calls and liquidations cascade through resets. The entities that collapsed in 2022 all carried excessive leverage into a deleveraging event. Retail and institutional players alike learned that lesson. Leverage amplifies gains in bull markets and guarantees wipeouts in resets.
Farming rotations fail. Yield farming strategies that rely on continuous token emissions and speculative APYs collapse when liquidity exits. The DeFi summer of 2020 produced 1,000%+ APYs that disappeared by early 2021\. Farming strategies that chase the highest advertised yields lose capital during resets as those projects lose liquidity and token prices fall faster than yields can compensate.
Meme coin and narrative-driven altcoin positions fail. Most meme coins and GameFi tokens fell over 95% from peaks and never recovered. The same pattern is repeating in 2026 across AI agent tokens and other hype-driven narratives with no defensible revenue models.
## The Positioning Framework for Long-Term Holders
The cycle-aware positioning framework for the 2026 reset window has three components: accumulation criteria, position sizing, and time horizon clarity.
Accumulation criteria start with on-chain valuation. When MVRV drops below 1.0, Bitcoin trades below its realized value, meaning all holders are aggregate net losers. That marks capitulation and historically strong entry points. As of early October 2026, MVRV sat above 1.0 but within the fair value accumulation range of 1.0 to 2.5\. That suggests the bottom window is close but not yet confirmed.
Exchange flow data provides the second criterion. When exchange balances decline and coins move to long-term holder wallets, accumulation is underway. When exchange inflows spike, distribution is happening. The late September surge to 49,000 BTC in exchange inflows suggested the market was still in distribution or volatility mode, not confirmed accumulation.
Dominance rotation provides the third criterion. A sustained break below 55% BTC dominance would confirm capital rotation into altcoins. Until that happens, the positioning bias should favor BTC and top-tier altcoins with institutional backing, not broad altcoin exposure.
Position sizing during resets should reflect the fact that precise bottom-calling is not possible. Historical accumulation phases lasted roughly 14 months after the 2018 bottom and closer to 10 months after the 2022 bottom. Euphoria in 2017 ran for about three months. In 2021, it played out across two separate peaks over eight months. That variability increases the challenge of precise cycle positioning in 2026.
The solution is dollar-cost averaging into positions across the reset window rather than attempting to time a single bottom.
Time horizon clarity matters because reset positioning only works for capital held across cycles. Short-term traders will get chopped up by volatility. Long-term holders who enter at lower cost basis during resets and hold through the next recovery phase capture the bulk of cycle gains. That is the cycle-aware income mechanism: better entry cost basis during resets improves capital efficiency for positions held across cycles.
## What to Watch in the Fourth Quarter of 2026
Three specific signals will confirm whether the reset window is nearing a bottom or whether further downside remains.
First, watch MVRV. A drop below 1.0 would confirm capitulation and mark a historically strong entry zone. Until that happens, the market remains in the fair value range, not the deep value range.
Second, watch BTC dominance. A confirmed break below 55% with rising altcoin volume would signal the start of capital rotation. Until that happens, altcoin positioning remains higher risk than BTC positioning.
Third, watch exchange flows. A sustained shift from inflows to outflows, combined with declining exchange balances, would confirm the market has moved from distribution to accumulation. The late September spike to 49,000 BTC in inflows suggested that shift had not yet occurred.
One additional variable worth noting: global liquidity conditions.
The 2026 reset is occurring in an environment where central bank policy and institutional capital flows drive crypto markets more than in prior cycles. [DeFi TVL](https://defillama.com), stablecoin supply, and ETF inflow data all provide leading indicators of whether institutional capital is entering or exiting. If those flows turn positive while on-chain valuation sits in the accumulation range, the reset window will close faster than traditional cycle timing models predict.
## The Takeaway
The 2026 crypto reset is following the same broad cycle pattern as 2018 and 2022: BTC dominance rising, altcoins underperforming, on-chain valuation sitting in the fair value to slight undervalue range, and exchange flows showing mixed signals between distribution and accumulation. What has changed is the presence of institutional capital flowing through ETFs and OTC channels, which compresses valuation extremes and shortens consolidation periods compared to prior cycles. The positioning framework for long-term holders is clear: accumulate BTC and top-tier altcoins with revenue models and institutional backing during the reset window using dollar-cost averaging, avoid leverage and speculative farming strategies, and focus on structural yield positions that compound through drawdowns. The specific signals to watch are MVRV below 1.0 for confirmed capitulation, BTC dominance breaking below 55% for altcoin rotation, and exchange outflows confirming the shift from distribution to accumulation. The cycle has not broken. It has evolved. Recognizing the reset window and positioning accordingly improves entry cost basis for capital held across cycles, which is the core cycle-aware income mechanism for altcoin investors.
## Frequently Asked Questions
### What is the most reliable indicator for identifying a crypto cycle reset in 2026?
MVRV (Market Value to Realized Value) remains the most reliable cycle positioning indicator historically. Readings below 0.8 mark deep bear territory, while 0.8 to 1.0 identifies cycle bottoms. The 1.0 to 2.5 range represents recovery and accumulation. As of October 2026, Bitcoin's MVRV sits in the lower recovery range, consistent with early accumulation but not yet confirmed capitulation. Historical data shows MVRV below 1.0 has marked the strongest entry points across multiple cycles.
### How does the 2026 crypto reset differ from the 2018 and 2022 bear markets?
The 2026 reset differs primarily due to institutional capital flowing through spot Bitcoin ETFs and OTC channels, which compress valuation extremes compared to prior cycles. Fidelity's entity-adjusted MVRV stayed between two and three during 2024-2025, while earlier peaks reached four to six. ETF inflows absorb supply shocks and create shorter consolidation periods, making traditional cycle timing less reliable. The halving cycle has evolved rather than broken, with global liquidity and institutional flows now determining amplitude and timing more than the halving alone.
### Which crypto investment strategies survive a market reset and which fail?
Strategies that survive resets include structural yield holdings like proof-of-stake staking positions, which generate yield through drawdowns and benefit from lower entry cost basis. Long-term holder positions in BTC and top-tier altcoins with revenue models and institutional backing also survive. Strategies that fail include leverage positions, which cascade into liquidations during resets, and yield farming rotations chasing speculative APYs that collapse when liquidity exits. Meme coins and narrative-driven tokens without revenue models typically fall over 95% and rarely recover.
### When will altcoin season begin in the 2026 crypto cycle?
A sustained Bitcoin dominance break below 55% is required before broad altcoin rotation can be confirmed. As of October 2026, BTC dominance held at 58.65%, well above that threshold. The Blockchain Center's Altcoin Season Index read 49, still 26 points below the 75 confirmation threshold. Historical patterns show altcoin seasons follow Bitcoin accumulation phases and dominance rotation, but the 2026 cycle faces structural headwinds from token oversupply and concentrated institutional capital in major assets. Selectivity at the asset level matters more than broad altcoin exposure this cycle.
### What specific metrics should long-term holders watch in Q4 2026 to time reset accumulation?
Three key signals matter for reset positioning: First, MVRV dropping below 1.0 confirms capitulation and marks historically strong entry zones. Second, BTC dominance breaking below 55% with rising altcoin volume signals capital rotation. Third, sustained exchange outflows and declining exchange balances confirm the shift from distribution to accumulation. As of late September 2026, exchange inflows surged to 49,000 BTC, suggesting that shift had not yet occurred. Global liquidity indicators like DeFi TVL, stablecoin supply, and ETF flows provide additional leading signals of institutional capital movement.
The Weekly Yield Report
You just reviewed the on-chain signals that marked every prior crypto reset and the specific MVRV, dominance, and flow thresholds to watch in Q4 2026\. Those thresholds will shift week by week as institutional capital moves.
Every Thursday: where crypto yield actually is - stablecoins, liquid staking and DeFi lending, with the risk named next to the rate and what changed since last week.
[Get it free every Thursday](#/portal/signup)
Free. No trade calls, no allocations, no hype. Unsubscribe in one click.
### Aave Surges 45.5% in 30 Days on V4 Tokenized Stock Launch
URL: https://altcoininvestor.com/aave-surge-45-percent-v4-tokenized-stock-launch/
Last updated: 2026-10-02T14:02:43.000Z
## What Happened and By How Much
Aave climbed 45.5% over 30 days to $183.63 as of October 2, 2026, according to CoinGecko. The move brought the token's market capitalization to $2.83 billion and extended a weekly gain of 23.9% and a 24-hour jump of 10.6%. The protocol ranks 41st by market cap and trades 72.2% below its May 18, 2021 all-time high of $661.69.
The rally accelerated in the final week of September, with [DeFi lending](https://altcoininvestor.com/best-defi-protocols/) activity and V4 adoption serving as the primary drivers. The 30-day gain places Aave among the strongest performers in the DeFi lending sector during the period, outpacing both Bitcoin and Ethereum on a percentage basis.
## What Drove the Move: V4 Equities Hub and Tokenomics

The catalyst that triggered the final leg of the rally was the September 25, 2026 launch of Aave V4's Equities Hub on Base. The market allows eligible non-U.S. users to deposit Coinbase-issued tokenized stocks as collateral to borrow USDC, according to CoinMarketCap on September 25\. Seven tokenized equities are available at launch, including Apple, Nvidia, and Tesla, with Chainlink providing price feeds.
The Equities Hub caps collateral at approximately $29 million, USDC supply at $32 million, and borrowing at $21 million as of September 25, per CoinMarketCap. The market operates under Regulation S and is restricted to users outside the United States. It represents the first live deployment of Aave V4's hub-and-spoke architecture for real-world asset collateral, moving beyond the protocol's March 30, 2026 Ethereum mainnet launch of V4's Core, Plus, and Prime hubs.
The rally began well before the Equities Hub announcement. Aave V4 launched on Ethereum mainnet on March 30, 2026, as reported by DL News on that date. The protocol then expanded to Avalanche on July 16, 2026, marking its first multi-chain V4 deployment, according to CoinMarketCap. By early September, V4 had surpassed $1 billion in deposits, per Aave Labs' September 1, 2026 development update.
A secondary catalyst emerged on September 29, 2026, when Aave founder Stani Kulechov indicated the protocol is considering adding token burns to its existing buyback program under Aavenomics 3.0\. The proposal would permanently remove some AAVE tokens from circulation rather than directing repurchased tokens to the DAO treasury, as reported by multiple outlets on September 29\. Aave already operates a $50 million annual buyback budget with weekly purchases ranging from $250,000 to $1.75 million, according to protocol documentation cited on September 29.
The timing matters. The rally built momentum through July and August as V4 adoption grew, then accelerated on September 25 when the Equities Hub went live, and extended further on September 29 as burn discussions gained traction. The sequence suggests the market priced in V4's real-world asset potential over weeks, not days, with the Equities Hub serving as confirmation rather than surprise.
## What the Move Means for Lending and Yield
For holders focused on yield mechanics, the V4 upgrade changes how liquidity is structured but does not fundamentally alter the risk-return profile of supplying capital to Aave. The hub-and-spoke model consolidates liquidity into unified pools per blockchain, with specialized markets drawing from shared collateral. That design improves capital efficiency but introduces cross-contamination risk if one spoke experiences stress.
The Equities Hub specifically creates a new risk vector for USDC lenders. Tokenized stock price feeds freeze when U.S. markets close, but borrowing and liquidations can still occur, as noted by CryptoSlate on September 27, 2026\. A borrower using tokenized Tesla shares as collateral faces liquidation risk based on stale weekend prices while the underlying equity trades in after-hours or pre-market sessions. That disconnect does not affect most Aave markets, but it is material for anyone supplying USDC to the Equities Hub spoke.
The broader V4 ecosystem offers no immediate yield advantage over V3 for standard crypto collateral. Aave V3 held $12.5 billion in active loans as of September 2026, per Aave Labs' September update, while V4 crossed $1 billion in deposits during the same period. The older protocol remains the dominant liquidity venue, and supply rates on USDC, ETH, and stablecoins are comparable across versions as of early October 2026.
Where V4 matters for income-focused holders is institutional real-world asset lending through Aave Horizon, a permissioned market for tokenized Treasuries and comparable instruments. Horizon held approximately $540 million in assets against $163.5 million in borrowing as of July 2026, with a stated goal of exceeding $1 billion, according to a report dated August 25, 2026\. That market targets regulated counterparties and does not compete with retail DeFi yield, but its growth could drive protocol revenue and, under Aavenomics 3.0, buyback volume.
The potential token burn mechanism adds a layer of supply-side pressure if implemented, but it does not change the lending yield available today. Buybacks funded by protocol revenue reduce circulating supply over time, which can support price if demand holds. A burn accelerates that dynamic by making the reduction permanent. Neither action increases the interest paid to lenders or changes the collateral requirements for borrowers.
## What Could Hold or Break the Move
A 45.5% move over 30 days reflects positioning ahead of expected catalysts, not a fundamental repricing of the protocol's earning power. For the rally to hold, V4 adoption must continue to grow at a pace that justifies the valuation step. That means Horizon scaling past $1 billion, additional hub-and-spoke deployments across chains, and sustained institutional inflows into tokenized asset markets.
The rally breaks if V4 growth stalls, if the Equities Hub experiences a liquidation event that damages confidence in the hub-and-spoke model, or if the burn proposal fails to gain governance approval. Each of those outcomes removes a leg of the narrative that drove the move. The token repriced on the expectation of V4 becoming the dominant infrastructure for onchain credit. If that does not materialize, the rally reverses.
Leverage is the mechanical risk. A fast move attracts positioned traders, and the September 29 rally saw exchange reserves climb to a monthly high, as noted by AMBCrypto on September 29, 2026\. Rising reserves on exchanges typically precede increased selling pressure, as tokens move from wallets to venues where they can be liquidated. If the move stalls and leveraged longs start closing, the reversal can be as sharp as the ascent.
The broader DeFi lending market also matters. Aave held a 48% market share of active loans as of September 1, 2026, according to CoinMarketCap. Morpho, the second-largest lending protocol, has grown rapidly through modular market creation and institutional partnerships, including a Coinbase integration in 2025\. If Morpho continues to capture share, Aave's dominance narrows, and the V4 upgrade becomes less differentiated. That scenario does not break the token immediately, but it caps the upside and increases sensitivity to any execution miss.
## What It Does Not Mean
A large move does not mean the asset is undervalued at the new price, and it does not mean the trend will continue. The 45.5% gain over 30 days reflects a repricing around specific developments: V4 going live, tokenized stock collateral launching, and burn discussions gaining visibility. Those catalysts are now known. The next 30 days will not have the same concentration of announcements unless the roadmap accelerates unexpectedly.
The move also does not mean Aave is now the best venue for yield. Lending rates are determined by utilization, and utilization depends on borrowing demand, not token price. A holder supplying USDC to Aave V3 on Ethereum earns the same rate today as they did when AAVE traded 30% lower. The protocol's revenue has grown, and that revenue funds buybacks, but the connection between token price and lender yield is indirect and operates on a longer time horizon than a 30-day rally.
For someone holding Aave for its income mechanics, the V4 launch is structurally significant because it expands the types of collateral the protocol can accept and the institutions it can serve. That matters over quarters and years as tokenized assets scale. It does not mean October will repeat September's performance, and it does not mean the token is mispriced if it consolidates or retraces.
The Equities Hub is a proof of concept with $29 million in collateral capacity. If it scales to hundreds of millions and additional asset classes are added, the V4 architecture becomes validated. If it remains a niche product with limited adoption, the hub-and-spoke model stays theoretical. The rally priced in the optimistic scenario. The next phase depends on whether usage confirms it.
The Weekly Yield Report
You have just reviewed a 45.5% move driven by V4 adoption, tokenized stock collateral, and potential burns. Those catalysts are now priced in, and the next 30 days will reveal whether usage confirms the thesis.
Every Thursday: where crypto yield actually is - stablecoins, liquid staking and DeFi lending, with the risk named next to the rate and what changed since last week.
[Get it free every Thursday](#/portal/signup)
Free. No trade calls, no allocations, no hype. Unsubscribe in one click.
### MetaMask Validator Exit Materializes Lido's Concentration Risk
URL: https://altcoininvestor.com/metamask-validator-exit-lido-concentration-risk/
Last updated: 2026-10-05T18:00:06.000Z
## The Security Incident and Precautionary Exit

MetaMask has initiated the exit of 17,000 affected Ethereum validators representing over 523,000 staked ETH ($1.4 billion). The exit follows a security incident in which 18 of 19 MetaMask-operated validators that earned payments for producing blocks sent those payments to an unexpected address. Approximately 0.36 ETH was diverted.
Lido expects the final affected MetaMask validators to exit by October 7\. The incident triggered a precautionary mass exit rather than an immediate threat to user wallets. MetaMask stated it has identified no immediate threat to MetaMask wallets themselves.
The diverted block rewards signal compromised validator credentials. Someone controlling those credentials could make a validator approve conflicting records, triggering slashing, in which Ethereum destroys a portion of its stake. The precautionary exit avoids this tail risk.
## The Mechanism Behind Delegated Staking Risk

Ethereum staking via liquid staking protocols like Lido operates through a delegated infrastructure model. Here is how the mechanism works:
- Users deposit ETH into Lido's staking pool
- Lido distributes deposited ETH across a set of node operators
- Node operators control the validator credentials and run the validator software
- Validators produce blocks and earn staking rewards
- Rewards flow back to the pool and are distributed proportionally to stETH holders
The risk embedded in this mechanism is operational concentration. When a single node operator controls a large number of validators, a security compromise at that operator affects all validators under its control. MetaMask operated 17,000 validators within Lido's network. A single credential compromise affected all 17,000.
This is not a smart contract risk. The underlying Lido protocol functioned as designed. The vulnerability sits at the infrastructure layer where node operators manage validator keys. Control of those keys permits two failure modes: diversion of block rewards (what happened here) and intentional slashing (what MetaMask exited to prevent).
## The Yield Impact on stETH Holders During the 45-Day Queue
Affected validators could miss rewards during an exit and re-entry process lasting up to 45 days. Lido has confirmed that stETH holders do not need to take action. The protocol will absorb the yield gap.
Here is what happens during the exit queue:
- Validators stop earning attestation rewards once they enter the exit queue
- Exit time depends on the current validator queue length, typically 1-5 days under normal conditions
- After exit, MetaMask must investigate the credential compromise, remediate the vulnerability, and generate new validator keys
- Re-entry into the validator set requires joining the activation queue, which adds additional days depending on network activity
- The total gap between exit and reactivation is estimated at 45 days
During this period, 523,000 ETH earns zero staking yield. For context, Ethereum staking currently yields approximately 3.2% annually. A 45-day gap represents roughly 0.39% of annual yield, or about 2,040 ETH in foregone rewards across the affected stake.
Lido's stETH yield compresses temporarily because the protocol's total staked ETH decreases while the circulating stETH supply remains unchanged. The yield earned by the remaining active validators gets spread across the full stETH holder base, diluting returns until MetaMask's validators rejoin.
This is a short-term yield reduction, not a principal loss. The mechanism assumes MetaMask will successfully remediate and re-stake. If MetaMask cannot or does not re-enter, Lido would need to redistribute that stake to other node operators, extending the yield gap further.
## The Specific Stress Condition That Materialized
The stress condition that materialized here is operational compromise of a high-concentration node operator. This is a known risk in delegated staking models. The failure mode is when a single operator's credential security fails and affects a large portion of the network's validators.
Lido's diversification strategy spreads stake across multiple node operators to mitigate this risk. As of this incident, MetaMask operated approximately 17,000 of Lido's total validator set. While Lido runs validators across dozens of operators, MetaMask represented a meaningful concentration.
The specific failure sequence was:
- An attacker gained access to MetaMask's validator credential infrastructure
- The attacker modified the fee recipient address for affected validators
- Block rewards produced by those validators flowed to the attacker's wallet instead of the expected Lido distribution contract
- MetaMask detected the diversion after 18 of 19 block-producing validators sent rewards to the wrong address
- MetaMask initiated a precautionary exit to prevent further reward diversion and potential slashing
The stress test here is not hypothetical. Credential compromise is a recurring threat in staking infrastructure. In 2022, multiple smaller staking providers experienced similar incidents, though not at this scale. The MetaMask incident is the largest precautionary exit triggered by credential compromise in Lido's history.
## What On-Chain Data Reveals About the Incident
The on-chain evidence of this incident is visible in validator block production records and fee recipient addresses. Here is what readers can verify:
- Check Ethereum beacon chain explorer for MetaMask-operated validators
- Review recent block proposals by those validators
- Compare the fee recipient address in recent blocks to historical fee recipient addresses
- Confirm the unexpected address received approximately 0.36 ETH in total diverted rewards
The exit queue status is also visible on-chain. Readers can track the number of validators in the exit queue and estimate when MetaMask's validators will fully exit. As of October 2, the queue shows the expected completion by October 7, consistent with Lido's statement.
The key metric to monitor is Lido's total staked ETH and the corresponding stETH yield rate. When MetaMask's validators exit, total staked ETH will drop by 523,000\. If the stETH yield rate compresses visibly, the mechanism is functioning as expected. If it does not compress, Lido may be subsidizing the gap from its treasury or insurance fund.
For those exploring [the best crypto staking platform](https://altcoininvestor.com/best-crypto-staking-platform/) for their holdings, this incident underscores the importance of understanding node operator diversification within liquid staking protocols.
## Comparing This to Prior Staking Infrastructure Failures
This incident is structurally similar to credential compromise events in other delegated proof-of-stake networks, but the scale is larger. In 2022, a smaller Ethereum staking provider lost validator keys in a phishing attack, resulting in slashing penalties for affected validators. That incident affected fewer than 100 validators and resulted in measurable principal loss due to slashing.
MetaMask's precautionary exit avoided slashing. The decision to exit immediately after detecting the diverted rewards prevented the attacker from using the compromised credentials to submit conflicting attestations, which would have triggered slashing penalties. The cost was foregone yield during the exit and re-entry period, not principal destruction.
The broader risk model here applies to all liquid staking protocols. Lido, Rocket Pool, and others rely on node operators who control validator keys. The concentration risk is proportional to how much stake a single operator controls. Lido's approach spreads stake across many operators, but no distribution eliminates the risk entirely.
Readers should note that this is distinct from smart contract risk. The Lido protocol itself was not exploited. The vulnerability was in the operational security of a specific node operator. This distinction matters for risk assessment. A smart contract exploit could affect all stETH holders simultaneously. An operational compromise affects only the validators controlled by the compromised operator.
## What This Incident Means for Lido Yield Going Forward
The short-term impact is a temporary yield compression for stETH holders. The long-term impact depends on MetaMask's remediation timeline and whether Lido adjusts its node operator selection criteria.
If MetaMask re-enters the validator set within 45 days, the yield impact is a one-time reduction of roughly 0.39% annualized yield. If the remediation takes longer or if Lido decides to reduce MetaMask's validator allocation, the yield gap could extend or the stake could be redistributed to other operators.
Lido's response to this incident will signal how the protocol manages node operator risk going forward. Possible responses include:
- Reducing the maximum number of validators any single operator can run
- Implementing stricter security audits for node operators
- Requiring node operators to post additional bonds or insurance
- Increasing the diversity of the operator set by onboarding new operators
None of these changes are confirmed. They represent plausible risk mitigation strategies that other liquid staking protocols have adopted after similar incidents.
For stETH holders, the mechanism is working as designed. The protocol absorbed the operational failure without requiring user action. The yield reduction is temporary and proportional to the affected stake. The principal remains intact.
## The Takeaway
MetaMask's emergency exit of 523,000 staked ETH materialized the operational concentration risk embedded in delegated staking infrastructure. The incident exposed a specific failure mode: credential compromise at a high-concentration node operator. The precautionary exit avoided slashing but will compress Lido stETH yields for approximately 45 days during the remediation and re-entry period. The on-chain data is visible and verifiable. Readers can track the exit queue, monitor yield compression, and assess whether Lido adjusts its operator diversification strategy in response. The mechanism is sound, but the stress condition is real and has now been tested at scale. For more details on the incident, see [CoinDesk's coverage of the security incident](https://www.coindesk.com/tech/2026/10/01/metamask-security-incident-forces-ethereum-staking-exits-with-lido-warning-of-lost-rewards).
## Frequently Asked Questions
### Do stETH holders need to take action after the MetaMask validator exit?
No. Lido has confirmed that stETH holders do not need to take any action. The protocol will absorb the temporary yield gap during the 45-day exit and re-entry period. Your stETH position remains intact, though yields will compress slightly while the affected validators are offline. The mechanism is designed to handle node operator failures without requiring user intervention.
### How much yield will stETH holders lose during the MetaMask exit period?
The estimated impact is approximately 0.39% of annualized yield over the 45-day exit and re-entry period. This represents the foregone staking rewards on 523,000 ETH while those validators are offline. The actual compression will be distributed across all stETH holders proportionally. The loss is temporary, not permanent, assuming MetaMask successfully remediates and re-enters the validator set.
### What is the specific risk that caused MetaMask to exit its validators?
An attacker gained access to MetaMask's validator credential infrastructure and modified the fee recipient address for 18 of 19 block-producing validators, diverting approximately 0.36 ETH in block rewards. The immediate risk was further reward diversion. The tail risk was that the attacker could use the compromised credentials to submit conflicting attestations, triggering slashing penalties that would destroy a portion of the staked ETH. MetaMask exited to prevent slashing.
### How can I verify the MetaMask validator exit on-chain?
Use an Ethereum beacon chain explorer to check MetaMask-operated validators. Review recent block proposals and compare the fee recipient address in recent blocks to historical addresses. The unexpected address received approximately 0.36 ETH in diverted rewards. You can also track the validator exit queue to confirm the expected October 7 completion date and monitor Lido's total staked ETH for the 523,000 ETH reduction.
### Is this incident a smart contract vulnerability in Lido's protocol?
No. This is an operational security failure at the node operator level, not a smart contract exploit. The Lido protocol itself functioned as designed. The vulnerability was in MetaMask's validator credential management. Smart contract risk would affect all stETH holders simultaneously through a protocol-level exploit. Operational risk affects only the validators controlled by the compromised operator. These are distinct risk categories requiring different mitigation strategies.
The Weekly Yield Report
You have just decomposed the operational risk that took 523,000 ETH offline for 45 days. That concentration risk exists in every delegated staking protocol.
Every Thursday: where crypto yield actually is - stablecoins, liquid staking and DeFi lending, with the risk named next to the rate and what changed since last week.
[Get it free every Thursday](#/portal/signup)
Free. No trade calls, no allocations, no hype. Unsubscribe in one click.
### How To Vet Fluid Lending's 4.11% USDT And 1.86% ETH Rates Within 48 Hours
URL: https://altcoininvestor.com/fluid-lending-protocol-review-safe/
Last updated: 2026-10-02T02:05:36.000Z
## What You Will Verify Before Deploying Capital

Fluid Lending currently holds $985.46 million in total value locked and quotes 4.11% on USDT against Aave's 3.6%. On a $100,000 allocation, that 0.51 percentage point difference generates an additional $510 annually. The downside is total loss of principal if the protocol fails.
This evaluation framework requires 48 hours and answers five questions: Has the code been audited by credible firms? Who built this and what did they ship before? Can the rate quoted today persist at your allocation size? How fast can you exit if conditions change? What is the maximum prudent first allocation given your total portfolio?
You will use live on-chain data, public audit reports, team background verification, and utilization modeling. No speculation. No trust. By the end, you will know whether Fluid merits capital and at what size.
### Prerequisites
You need a wallet with at least $5,000 in stablecoins or ETH for meaningful testing. You need access to Etherscan, DefiLlama, and the Fluid app interface. You should understand how lending protocols generate yield - if you do not, start with [How To Earn With Crypto Lending Protocols](https://altcoininvestor.com/how-to-earn-crypto-lending/) before proceeding.
## Step 1: Verify Audit Status And Code Quality Within 2 Hours
Fluid's core architecture combines three components: the Liquidity Layer, Smart Collateral, and Smart Debt. The Liquidity Layer is fungible capital shared across Fluid Lending and Fluid DEX. A vulnerability in the DEX can drain Lending deposits. The two products are not isolated.
Spearbit, Trail of Bits, and Certora audited the Liquidity Layer and core lending contracts. Mixbytes audited the DEX in December 2024 and found no significant vulnerabilities. Statemind audited the Vault contract. All reports are public at docs.fluid.instadapp.io.
Read the executive summary and critical findings section of each report. You are looking for four things:
- High or critical severity findings that were not resolved
- Centralization risks such as admin keys with upgrade authority
- Oracle manipulation vectors
- Reentrancy or state inconsistency issues in the shared Liquidity Layer
Fluid's architecture is more complex than Aave or Compound because lending and DEX liquidity share the same balance sheet. The mitigation is formal verification on core invariants via Certora and capital caps per asset. If you see unresolved critical findings or no mention of formal verification, stop here.
### What Good Looks Like
The Mixbytes DEX audit explicitly states: "No significant vulnerabilities were identified. The contracts are of high quality, gas-optimized, and well-documented." That is the standard. Anything less than that language requires a deeper review or a pass.
### Common Failure Mode
You see "audit in progress" or "audit planned" instead of completed reports. Do not deploy capital into unaudited code. The rate premium is not worth the principal risk.
## Step 2: Validate Team Background And Institutional Backing Within 1 Hour

Fluid was built by Samyak Jain and Sowmay Jain, co-founders of Instadapp. Instadapp reached top-five DeFi TVL ranking between 2018 and 2021 as a lending aggregator. The team introduced DeFi smart accounts and flash-loan architecture that influenced the current state of account abstraction.
Pantera Capital and Coinbase Ventures backed the project in 2021\. Those are Tier-1 venture firms with reputational capital at stake. That does not eliminate smart contract risk, but it does reduce the probability of an exit scam or founder abandonment during a bear market.
Go to the Fluid blog at blog.instadapp.io and verify the launch announcement is signed by Samyak Jain. Cross-reference his LinkedIn and GitHub activity. You are confirming continuity between the Instadapp team and the Fluid launch. If the team is anonymous or the launch announcement lacks attribution, that is a red flag.
### What You Are Really Checking
Track record through a full market cycle. Instadapp survived 2018-2020 and shipped products that users adopted. Founders who have been rugged or who disappeared during prior bear markets are higher risk. Founders who ground through three years of low TVL and kept shipping are lower risk.
## Step 3: Model Rate Sustainability At Your Allocation Size Within 3 Hours
Fluid's 4.11% USDT rate and 1.86% ETH rate are market-clearing rates, not governance-subsidized incentives. The rates reflect utilization - how much of the supplied capital is currently borrowed. Higher utilization means higher rates, but also less buffer for withdrawals.
Navigate to [DefiLlama's Fluid Lending page](https://defillama.com/protocol/fluid-lending). Note the total supplied capital and active loans. As of late September 2026, Fluid shows $1.552 billion supplied and $811.06 million in active loans. That is roughly 52% utilization.
Now model what happens when you deposit $100,000 in USDT. Your deposit increases total supply by $100,000, which lowers utilization slightly and pushes the rate down. If the pool already holds $150 million in USDT supply, your $100,000 is 0.067% of the pool and will not move the rate materially. If the pool holds $5 million, your deposit is 2% of supply and the rate will drop noticeably.
Check current USDT pool size in the Fluid app. If your intended allocation exceeds 1% of current pool size, expect the rate to compress after you deposit.
### Utilization And Withdrawal Buffer
Fluid runs higher utilization than Aave because the Liquidity Layer is shared across lending and DEX products. Higher utilization means less idle capital available for instant withdrawals. Fluid uses an Automated Debt Ceiling that increases withdrawal capacity every block, creating a smoothing curve that prevents sudden large movements.
In stress scenarios, you may face a withdrawal queue. That is a feature, not a bug, but it limits your exit speed. If you need same-block liquidity for trading strategies, Fluid is not the right venue.
### Rate Comparison Context
As of September 15, 2026, Fluid USDC yields 5.19% on Ethereum and USDT yields 4.15%. Aave v3 sits at approximately 3.6% for USDC on Ethereum. [Morpho curated vaults](https://altcoininvestor.com/morpho-lending/) and Fluid carry higher rates because their architectures concentrate borrow demand into specific markets rather than pooling all liquidity. The rates are sustainable as long as utilization holds. Track utilization weekly.
## Step 4: Test Withdrawal Liquidity With A Small Deposit Within 24 Hours
Deposit $5,000 in USDT or ETH into Fluid. Wait 24 hours. Withdraw the full amount. Time the transaction from submission to confirmed receipt in your wallet. This tests three things: the withdrawal queue mechanism in practice, gas efficiency of the contract, and whether the quoted rate matches the realized rate after 24 hours.
If withdrawal takes more than 10 blocks under normal network conditions, you have confirmed that Fluid's smoothing curve is active and withdrawal speed is throttled. That is acceptable for long-duration allocations, but incompatible with strategies requiring fast rotation.
If the realized rate after 24 hours is more than 0.2 percentage points below the quoted rate, utilization changed or your deposit moved the rate. Check the pool size again and recalculate whether your target allocation will compress the rate unacceptably.
### What To Watch During The Test
Monitor the Fluid app for any contract pause events or governance proposals during your test window. New protocols sometimes introduce parameter changes or upgrades during the first six months. A governance vote to lower supply caps or change fee structures is not necessarily negative, but you want to see it before you scale to a six-figure allocation.
## Step 5: Calculate Maximum Prudent First Allocation
Fluid is a new protocol with innovative architecture. Smart contract risk, oracle risk, and correlated exposure between lending and DEX products are all present. You mitigate these risks through position sizing, not by pretending they do not exist.
Start with less than 5% of your target DeFi allocation. If your total intended DeFi exposure is $200,000, your first Fluid deposit should not exceed $10,000\. After 48 hours of monitoring, you can scale.
What you monitor during those 48 hours:
- Withdrawal queue depth - check the Fluid app for any backlog in withdrawals
- TVL inflows and outflows - sudden 10%+ drops in TVL indicate other depositors are exiting
- Rate volatility - if the quoted rate swings more than 1 percentage point in 24 hours, utilization is unstable
- Smart contract pause or upgrade activity - check Etherscan for admin transactions on the Liquidity Layer contract
If all four indicators remain stable, double your allocation. Repeat the monitoring cycle. Scale to your target allocation over four weeks, not four days.
### Capital Caps Per Asset
Fluid enforces dynamic supply and borrow ceilings per asset. The more critical an asset becomes within the protocol, the higher its ceiling. These caps limit total exposure and reduce the damage from a single-asset oracle failure. Check current caps in the Fluid documentation. If your allocation would approach or exceed 10% of the current supply cap for USDT or ETH, you are too concentrated.
## Common Failure Modes And How To Avoid Them
Three failure modes account for most capital loss in new lending protocols:
### Oracle Manipulation
Fluid uses Chainlink for token prices and reads AMM state on-chain. A manipulated Chainlink feed combined with manipulated AMM state could misprice collateral and trigger incorrect liquidations. The mitigation is multi-oracle redundancy, which Fluid does not fully implement as of late 2026\. Limit exposure accordingly.
### Liquidity Crunch During Market Stress
If ETH drops 30% in 24 hours, borrowers get liquidated and withdrawal demand spikes. Fluid's high utilization and withdrawal smoothing mean you may wait hours or days to exit during extreme volatility. Do not allocate capital you need for margin calls or tax payments.
### DEX Exploit Draining Lending Deposits
Because the Liquidity Layer is shared, a bug in Fluid DEX can drain funds deposited into Fluid Lending. This is structural. The only mitigation is auditor quality and your position size. If you are not comfortable with correlated risk across two products, use Aave or Compound instead.
## What To Do After Your First 48 Hours
You have audited the code, verified the team, modeled rate sustainability, tested withdrawals, and sized your first allocation. Now you maintain the position.
Set a calendar reminder every two weeks to check:
- Current utilization and rate - if the rate drops below your threshold, rotate to another protocol
- Protocol TVL trend - if TVL declines 20% or more, investigate why before the crowd exits
- Governance proposals - any change to fee structure, withdrawal limits, or oracle sources requires re-evaluation
- Exploit activity in similar protocols - if Morpho or Aave suffers an oracle exploit, assume Fluid could be next and reduce exposure preemptively
You are not passive. You are active. Yield farming is not "set and forget." It is ongoing monitoring with predefined exit triggers. If you do not have time to check every two weeks, reduce your allocation or use a lower-yield, lower-maintenance protocol like Aave.
For systematic comparison of equivalent-risk positions across multiple protocols, see [How To Systematically Find 1-3% Better Rates At Same Risk](https://altcoininvestor.com/how-to-find-better-defi-yield-same-risk/).
## The Takeaway
Fluid's 4.11% USDT rate is real, but so is the structural risk of a shared Liquidity Layer across lending and DEX. The protocol has credible audits, a team with a multi-year track record, and institutional backing. It also has higher utilization than Aave, which reduces withdrawal speed, and architectural complexity that introduces correlated risk.
Your edge is not finding the highest rate. Your edge is vetting the rate properly, sizing the position to survive a failure, and monitoring for early exit signals. Most depositors skip the vetting, deploy six figures on day one, and discover the withdrawal queue during a market crash. You just spent 48 hours ensuring that will not be you.
## Frequently Asked Questions
### Is Fluid Lending safe for large stablecoin deposits?
Fluid has been audited by Spearbit, Trail of Bits, Certora, and Mixbytes with no unresolved critical findings. The team has a multi-year track record from Instadapp and institutional backing from Pantera and Coinbase Ventures. However, Fluid's shared Liquidity Layer between lending and DEX introduces correlated risk - a DEX exploit can drain lending deposits. Start with under 5% of your target DeFi allocation, monitor for 48 hours, and scale gradually. Fluid is not inherently unsafe, but it is newer and more architecturally complex than Aave or Compound.
### Why does Fluid offer higher rates than Aave?
Fluid's architecture concentrates borrow demand into specific markets rather than pooling all liquidity like Aave. This creates higher utilization, which drives higher lending rates. Fluid also runs a shared Liquidity Layer across lending and DEX products, enabling more efficient capital deployment. The rates are market-clearing, not subsidy-driven. Higher utilization means less buffer for instant withdrawals, so Fluid uses an Automated Debt Ceiling that smooths withdrawal capacity over time. The rate premium reflects both efficiency and structural withdrawal constraints.
### How fast can I withdraw from Fluid during market stress?
Fluid uses an Automated Debt Ceiling that increases withdrawal capacity every block, creating a smoothing curve instead of instant full liquidity. During normal conditions, withdrawals complete within a few blocks. During market stress when utilization spikes and many depositors exit simultaneously, you may face a withdrawal queue lasting hours or days. This is a design feature to prevent sudden liquidity crunches, not a bug. If you need same-block exit liquidity for trading strategies or margin management, use Aave or Compound instead.
### What is the maximum safe allocation to Fluid Lending?
Start with under 5% of your total DeFi allocation for the first 48 hours while you monitor withdrawal queue depth, TVL stability, rate volatility, and smart contract activity. If all indicators remain stable, you can scale to 10-20% of your DeFi portfolio over four weeks. Never allocate more than 10% of Fluid's current supply cap for a given asset, and never deploy capital you need for margin calls or tax payments. Fluid is a new protocol with innovative architecture - position sizing is your primary risk control.
### Should I choose USDT or USDC on Fluid for better returns?
As of September 2026, Fluid quotes 4.15% on USDT and 5.19% on USDC on Ethereum. The rate difference reflects utilization in each pool. Check current pool size for both assets in the Fluid app - if your allocation exceeds 1% of pool supply, you will compress the rate after deposit. USDC typically has deeper liquidity and lower volatility in utilization. USDT may offer slightly different rates depending on chain deployment. Model both at your allocation size and choose the one with the best risk-adjusted return after accounting for pool depth and withdrawal liquidity.
The Weekly Yield Report
You just walked through audit verification, team validation, rate modeling, and liquidity testing for Fluid's 4.11% USDT yield. Those metrics will shift next week.
Every Thursday: where crypto yield actually is - stablecoins, liquid staking and DeFi lending, with the risk named next to the rate and what changed since last week.
[Get it free every Thursday](#/portal/signup)
Free. No trade calls, no allocations, no hype. Unsubscribe in one click.
### Why Curve crvUSD-WBTC APY Collapsed 9.69 Points In One Week
URL: https://altcoininvestor.com/curve-crvusd-wbtc-apy-drop/
Last updated: 2026-10-02T00:06:25.000Z
## The Question: Why Did Curve crvUSD-WBTC APY Collapse 9.69 Percentage Points In One Week?
The crvUSD-WBTC pool fell from 10.26% APY to 0.57% APY over seven days in late September 2026\. That is a 9.69 percentage point drop on a pool holding approximately $70M in total value locked.
The collapse was not gradual. It was structural.
Three mechanisms converged: veCRV holders reallocated gauge weight away from WBTC pools, $2.45M in WBTC collateral was repaid during Week 32 2026, and third-party liquidity mining incentives expired. The result was an immediate evaporation of reward APY, leaving only base swap fee income around 0.5-0.6%.
If you held a $100,000 position, the collapse cost you $9,690 in annualized yield. Whether you should have exited immediately or waited for recovery depends entirely on which of those three drivers caused the drop.
## How Curve APY Actually Works
Curve pools generate two distinct income streams. The first is base APY, derived from swap fees. Stablecoin pairs charge 0.04% per trade, split 50/50 between liquidity providers and veCRV holders. On a pool with moderate volume, base APY typically runs 1-2%.
The second is reward APY, which comes from CRV token emissions and third-party incentives. Curve distributes 260,000-320,000 CRV per day across all pools, allocated weekly by veCRV governance vote. A pool receiving 2% of total gauge weight earns roughly 5,200-6,400 CRV/day. At $0.30 per CRV, that translates to $1,560-1,920 per day, or about 3-5% annualized APY on a $50M pool.
Third-party protocols (Yearn, Convex, liquidity mining programs) can add extra incentives on top. Those incentives are typically time-limited.
When crvUSD-WBTC showed 10.26% APY, roughly 0.5-0.6 percentage points came from swap fees. The other 9.6+ points came from CRV emissions and third-party programs.
When gauge weight shifts or incentives expire, reward APY disappears. Base APY remains.
## What Happened During Week 32, 2026
The data shows three concurrent events.
First, WBTC collateral saw $2.45M in repayments across Curve's Llamalend markets during Week 32\. That was the only meaningful repayment among Bitcoin-backed pools. cbBTC added $2.17M in borrowing, and tBTC added $1.33M. Collateral was migrating away from WBTC to newer Bitcoin standards.
Second, veCRV holders vote weekly to allocate CRV emissions. When a pool loses liquidity or volume, governance typically reallocates gauge weight to more active markets. The cbBTC-crvUSD and tBTC-crvUSD pools were showing growth. WBTC pools were contracting. Gauge weight followed the flow.
Third, third-party incentive programs often run for fixed durations (30, 60, 90 days). If a liquidity mining program ended in late September without renewal, the associated APY would drop to zero overnight.
The combination of those three factors explains a 9.69 percentage point collapse. Gauge weight reallocation alone can remove 6-8 points. Incentive expiration can remove another 2-4 points. Base swap fee APY (0.5-0.6%) is what remains.
## Why WBTC Collateral Is Migrating To cbBTC And tBTC
WBTC has been the dominant tokenized Bitcoin on Ethereum for years. But institutional allocators and compliance-focused protocols prefer cbBTC and tBTC for three reasons.
cbBTC (Coinbase Wrapped Bitcoin) offers institutional custody, transparent reserves, and regulatory clarity. tBTC is decentralized and threshold-signed, removing single-entity custody risk. Both standards are newer, better documented, and more aligned with current institutional compliance requirements.
When $2.45M in WBTC was repaid during Week 32 while cbBTC and tBTC added $3.5M combined, the message was clear: liquidity providers and borrowers are rotating to newer Bitcoin collateral standards.
That rotation reduces WBTC pool volume, which reduces fee generation, which signals to veCRV holders that gauge weight should shift elsewhere. The APY collapse on crvUSD-WBTC reflects that feedback loop.
## How To Read Gauge Weight Reallocation In Real Time
Curve governance votes occur weekly on Snapshot. You can track gauge weight proposals by monitoring the Curve DAO [official documentation](https://docs.curve.fi/) and reviewing vote outcomes every Thursday.
If a pool's gauge weight drops from 2.0% to 0.3% in a single vote, you should expect APY to collapse by 6-8 percentage points within 24 hours. CRV emissions are distributed proportionally. A pool receiving 0.3% of total weight earns roughly 780-960 CRV/day instead of 5,200-6,400.
On a $70M pool, that difference is worth $1,300-1,400 per day, or about 7% annualized APY.
The WBTC-crvUSD collapse likely reflects exactly that scenario. Gauge weight shifted to cbBTC-crvUSD and tBTC-crvUSD, both of which showed borrowing growth and stronger collateral demand.
## When High APY Is Sustainable And When It Is Not
APY above 12% on a stablecoin or BTC-stablecoin pair is almost always unsustainable. The income either comes from short-term liquidity mining incentives or temporary CRV emission boosts that governance will reallocate within weeks.
Sustainable yield on Curve stablecoin pairs runs 3-8% for standard depositors, boosted to 7-20% for users with veCRV locks. That range reflects base swap fees plus structural CRV emissions allocated to high-volume pools.
When crvUSD-WBTC showed 10.26% APY without a veCRV boost, the excess above 8% was a red flag. It signaled either a temporary gauge weight spike or an expiring third-party incentive program.
The correct question to ask when you see 10%+ APY on a Curve pool is: what portion of this is base fee income, and what portion is time-limited reward income? If more than 60% of the APY comes from rewards, expect reallocation risk within 30-60 days.
## Comparing APY Behavior Across BTC-Stablecoin Pairs
The crvUSD-WBTC collapse was not unique. Similar drops have occurred on Uniswap V3 USDC-WETH pools, [which fell from 20.15% to 9.5% in seven days](https://altcoininvestor.com/why-uniswap-v3-apy-drop/) due to liquidity migration and fee tier shifts.
BTC-stablecoin pairs across protocols share a common vulnerability: they depend on external incentives or governance-allocated emissions to maintain double-digit yields. When those incentives shift, APY collapses.
Uniswap V3's concentrated liquidity model allows LPs to earn high fees during volatility, but out-of-range positions earn zero. Curve's gauge weight model allows veCRV holders to redirect emissions weekly, which creates reallocation risk.
Aerodrome on Base and Velodrome on Optimism use similar vote-escrowed governance models. Both have seen 8-10 percentage point APY swings on stablecoin pairs when gauge votes reallocate emissions.
The mechanism differs across protocols, but the pattern is identical: when TVL declines or volume shifts, governance or market forces redirect incentives elsewhere. APY collapses follow within days.
## The Withdrawal Decision Framework
You should exit a Curve pool immediately when APY collapses if two conditions are met.
First, the drop reflects permanent gauge weight reallocation, not temporary utilization decline. Check recent governance votes. If the pool lost 50%+ of its gauge weight in a single vote, the drop is structural.
Second, the new APY falls below your minimum acceptable return after accounting for gas costs and opportunity cost. If you can deploy the same capital into cbBTC-crvUSD or tBTC-crvUSD at 6-8% APY, staying in a 0.57% pool makes no sense.
You should wait if the collapse is driven by temporary utilization changes that may reverse. For example, if a large borrower repaid $10M but collateral deposits remained stable, utilization may recover when another borrower enters.
The Week 32 data shows $2.45M in WBTC repayments, but cbBTC and tBTC both added borrowing. That is not a temporary dip. That is collateral migration.
When collateral migrates, gauge weight follows. When gauge weight shifts, APY collapses. Exit.
## What To Watch On Other Curve Pools
Three signals predict APY collapse risk on any Curve pool.
First, declining TVL over three consecutive weeks. If a pool loses 10%+ of its TVL while competing pools grow, veCRV holders will reallocate gauge weight within 14-21 days.
Second, collateral migration visible in on-chain repayment data. When one collateral type shows net repayments while alternatives show net borrowing, the migrating asset's pools will lose APY.
Third, expiring third-party incentive programs. Most liquidity mining programs publish end dates. If a program contributing 3%+ APY is set to expire in 7-14 days, you should exit before expiration or accept the lower post-expiry rate.
The crvUSD-WBTC collapse reflects all three signals. TVL was stable around $70M, but WBTC collateral was declining. cbBTC and tBTC were growing. Gauge weight reallocated. APY followed.
The same pattern will repeat on other pools. [Track TVL, collateral flows, and governance votes](https://altcoininvestor.com/best-defi-protocols/) to see it coming.
## Why Most Yield Positions Break Silently
The vast majority of DeFi APY collapses receive no public announcement. Curve does not send an email when gauge weight shifts. Third-party incentive programs do not publish press releases when funding runs out.
Your position breaks silently. The APY you saw last week no longer applies this week. If you are not monitoring on-chain data or governance votes, you discover the collapse only when you check your dashboard days or weeks later.
That delay is costly. On a $100,000 position, a 9.69 percentage point drop costs $26.52 per day. Over 30 days, that is $795.60 in lost income.
The income mechanism here is negative: knowing when APY will collapse lets you exit before it does, preserving yield that most LPs lose through inattention.
Set up alerts for three events: weekly governance votes on pools you hold, TVL changes above 5%, and collateral flow reversals. Those alerts give you 3-7 days of advance notice before APY collapses.
## The Broader Implications For BTC-Stablecoin Yields
The crvUSD-WBTC collapse reflects a wider shift in DeFi collateral preferences. WBTC dominated for years because it was first. cbBTC and tBTC are replacing it because they are better.
When institutional allocators rotate collateral, liquidity follows. When liquidity moves, governance reallocates incentives. When incentives shift, APY collapses on the old pools and rises on the new ones.
This is not unique to Curve. The same dynamic plays out on Aave, Compound, and every lending protocol with multiple Bitcoin collateral options. [Messari's Curve research](https://messari.io/project/curve-2) shows similar patterns across DeFi: fee-generating pools attract gauge weight, stagnant pools lose it.
If you hold positions in WBTC-based pools on any protocol, monitor cbBTC and tBTC growth. When those alternatives surpass WBTC in borrowing volume or TVL, your WBTC pool's APY will decline within weeks.
## How On-Chain Data Predicted This Collapse
The Week 32 data was public before the APY collapsed. $2.45M in WBTC repayments, $2.17M in cbBTC borrowing growth, $1.33M in tBTC growth. Those numbers appeared in [Curve's weekly metrics dashboard](https://messari.io/project/curve-2) before gauge weight shifted.
Anyone tracking collateral flows could see the migration happening in real time. When WBTC shows net repayments for two consecutive weeks while alternatives show net borrowing, gauge weight reallocation is 7-14 days away.
The APY collapse was predictable. Most LPs did not predict it because they were not watching the right data.
The income opportunity is arbitrage: exit pools with declining collateral flows before APY collapses, enter pools with growing flows before gauge weight increases. That spread can be worth 6-10 percentage points of APY.
## The Takeaway
The crvUSD-WBTC APY collapse from 10.26% to 0.57% was not a market anomaly. It was a predictable outcome of three concurrent events: gauge weight reallocation, WBTC collateral migration to cbBTC and tBTC, and expiring third-party incentives.
The structural lesson is that reward APY on Curve is governance-dependent and time-limited. Base swap fee APY (0.5-2% on stablecoin pairs) is sustainable. Anything above that depends on CRV emissions or external incentives, both of which can disappear in a single governance vote or program expiration.
If you hold positions in Curve pools with APY above 8%, verify how much of that rate comes from base fees versus rewards. If rewards account for more than 60% of total APY, set up alerts for gauge weight changes and collateral flow reversals. Exit when either signal turns negative.
The next pool to collapse will show the same three signals: declining TVL, collateral migration, and gauge weight loss. You will see those signals 7-14 days before APY drops, if you are watching the right data.
## Frequently Asked Questions
### What caused the crvUSD-WBTC APY to collapse from 10.26% to 0.57%?
The collapse resulted from three concurrent events: veCRV holders reallocated gauge weight away from WBTC pools, $2.45M in WBTC collateral was repaid during Week 32 2026, and third-party liquidity mining incentives expired. CRV emissions dropped from an estimated 260,000-320,000 CRV/day to near zero for this pool, leaving only base fee APY around 0.5-0.6%.
### How does Curve's gauge weight system affect APY on specific pools?
veCRV holders vote weekly to allocate CRV emissions across pools. A pool receiving 2% of total gauge weight earns roughly 5,200-6,400 CRV/day. When governance shifts that weight to another pool (like cbBTC-crvUSD or tBTC-crvUSD), the original pool's reward APY collapses immediately. Base swap fee APY (typically 1-2% on stablecoin pairs) remains, but total APY can drop 8-10 percentage points.
### Should I withdraw from a Curve pool when APY drops this sharply?
Exit immediately if the new APY falls below your minimum acceptable return and the drop reflects permanent gauge weight reallocation or incentive program end. Wait if the drop is driven by temporary utilization decline that may reverse. Check on-chain governance votes and recent collateral flows. If WBTC repayments continue and cbBTC/tBTC borrowing grows, the shift is structural, not cyclical.
### What is the difference between base APY and reward APY on Curve?
Base APY comes from swap fees (0.04% per trade on stablecoin pairs), split 50/50 between liquidity providers and veCRV holders. This is sustainable and protocol-native. Reward APY comes from CRV token emissions allocated by governance vote, plus any third-party incentives. Reward APY is variable and can disappear instantly. On crvUSD-WBTC, base APY is 0.5-0.6%; the other 9.6+ points were reward-driven.
### Why did WBTC see $2.45M in repayments while cbBTC and tBTC grew?
Newer Bitcoin standards (cbBTC, tBTC) offer institutional compliance features and clearer custody chains. cbBTC added $2.17M in borrowing during Week 32 2026, while tBTC added $1.33M. WBTC's repayment trend signals collateral migration to these alternatives. When collateral shifts, so does gauge weight allocation, because veCRV holders follow liquidity to maximize fee capture.
The Weekly Yield Report
You just reverse-engineered a 9.69-point APY collapse using gauge weights, collateral flows, and on-chain repayment data. Those drivers will look different on the next pool that breaks.
Every Thursday: where crypto yield actually is - stablecoins, liquid staking and DeFi lending, with the risk named next to the rate and what changed since last week.
[Get it free every Thursday](#/portal/signup)
Free. No trade calls, no allocations, no hype. Unsubscribe in one click.
### How To Evaluate Midas RWA USDC Positions Before You Allocate
URL: https://altcoininvestor.com/midas-rwa-usdc-yield-safe-evaluation/
Last updated: 2026-10-01T23:05:50.000Z
## What You Will Accomplish and What You Need Before You Start

The Midas RWA protocol currently shows a range of USDC positions yielding between 3.16% and 10.25% depending on strategy and blockchain deployment, with total value locked fluctuating between $56.9M and $132M over recent months. That range alone tells you something: RWA yields are not uniform products, and the rate advertised is not the complete picture of what you will earn or whether you will be able to withdraw when you want to.
This is the due diligence checklist for newly-tracked RWA yields before you allocate capital. You will verify the legal structure that determines whether you own the underlying asset or merely a claim against an issuer. You will confirm the custody arrangement that separates your tokenized Treasury exposure from operational failure of the protocol. You will check the redemption mechanics that determine whether you can exit at net asset value or must sell into illiquid secondary markets. You will compare the advertised rate to treasury-backed alternatives to confirm you are being compensated for the additional risk layers you are accepting.
What you need: access to the protocol's official disclosure documents, a DeFi portfolio tracker or blockchain explorer to verify on-chain TVL and recent transaction history, and 90 minutes to work through the eight-step checklist that follows.
## Step One: Verify the Legal Structure and Regulatory Approval

Most tokenized real-world assets are issued by special purpose vehicles established specifically to hold the underlying assets and isolate them from the operational and credit risk of the protocol, the development team, and affiliated entities. The quality of that legal separation determines what happens to your position if the protocol fails, if the custodian is hacked, or if regulators freeze the issuer's operations.
For Midas RWA, the issuer is Midas Software GmbH, incorporated in Berlin and operating under a BaFin crypto custody license with MiCA compliance across 27 EU member states. The mTBILL product received FMA prospectus approval, which means the token structure has passed regulatory review in a jurisdiction with enforceable investor protections. This is not theoretical. When a European SPV fails, there is a legal framework for creditor claims and asset recovery. When an offshore SPV in an unregulated jurisdiction fails, there often is not.
Confirm three specific items before you proceed. First, the jurisdiction of incorporation for the SPV issuing the token. Second, whether a financial regulator has approved a prospectus or offering memorandum. Third, whether sales are restricted to specific jurisdictions. Midas tokens are not offered to U.S. persons or sanctioned jurisdictions, which affects platform availability and secondary market liquidity if you hold a U.S. passport or trade through U.S.-licensed exchanges.
## Step Two: Confirm the Underlying Asset and Custodian Disclosure

The 3.42% to 4.5% yield range on tokenized Treasury products reflects the pass-through of short-dated U.S. Treasury bill income, minus protocol fees and custody costs. The advertised rate is only sustainable if the underlying asset actually generates that income and the custodian can prove continuous holding of the collateral backing your token.
Midas mTBILL tokens represent exposure to short-dated U.S. Treasury securities held within BlackRock's Treasury Bond fund. This is disclosed. The token's net asset value appreciates daily as the underlying Treasuries accrue interest, and redemptions are settled at NAV rather than at secondary market prices. That structure is what differentiates a well-constructed RWA token from a speculative wrapper.
What you need to verify: the specific fund or custodial account holding the underlying Treasuries, the frequency of third-party attestation confirming that the assets exist and match the circulating token supply, and whether the custodian is a regulated financial institution or an offshore entity with limited transparency. [Stablecoin yield products](https://altcoininvestor.com/how-to-earn-passive-income-stablecoins-2026/) that cannot answer these questions are structured as unsecured loans to the protocol rather than as tokenized ownership of real assets.
## Step Three: Check Historical Performance If Available Elsewhere
RWA protocols do not appear overnight. Most launch with a track record from earlier versions, adjacent products, or team members with verifiable prior deployments. That history tells you whether the protocol has managed redemption pressure during market stress, whether fee structures have remained stable, and whether prior versions have experienced exploits or governance failures.
Midas RWA has passed $700M in cumulative total value locked as of late September 2026, but also experienced a 52% single-day TVL contraction to $56.9M at one point prior to the recent recovery to $132M. A TVL collapse of that magnitude represents either a large institutional redemption, a migration to a competitor product, or a loss of confidence following a disclosure or security event.
Search for post-mortem disclosures, third-party security audits following the event, and whether the protocol published transparent communication about what caused the outflow. The absence of explanation is itself information. Protocols that go silent during stress events are protocols whose legal and operational infrastructure may not survive the next liquidity shock.
## Step Four: Compare the Rate to Treasury-Backed Alternatives
The U.S. 3-month Treasury yield was approximately 3.67% in late January 2026, with current rates in the 4% to 4.5% range as of October 2026\. A tokenized Treasury product yielding 3.42% is not competitive with direct Treasury ownership unless it offers material convenience, composability, or regulatory arbitrage that justifies the 60 to 100 basis point shortfall.
That shortfall comes from three sources. First, management fees embedded in the net asset value calculation, which Midas charges as part of the SPV's operational cost structure. Second, deposit and redemption fees, which can be tiered depending on whether you request instant liquidity or accept a multi-day settlement window. Third, the opportunity cost of holding a tokenized wrapper instead of a native Treasury instrument that accrues interest without smart contract risk, oracle dependency, or custodian failure exposure.
Compare the net yield after all fees to three baselines: the current 3-month Treasury rate, the Maker Dai Savings Rate (which was offering 5-8% on DAI in early 2026), and Aave V3 USDC lending rates (which ranged from 2.61% to 6% depending on chain and utilization). If the RWA product underperforms all three after accounting for fees and liquidity constraints, the only reason to allocate is if you need specific features like composability within a DeFi protocol or regulatory compliance in a jurisdiction where direct Treasury access is restricted.
## Step Five: Audit the Smart Contract and Oracle Infrastructure
RWA tokens sit at the intersection of off-chain legal structures and on-chain smart contracts. A failure at either layer can destroy the value of your position even if the underlying Treasury securities continue to accrue interest. CertiK's 2025 security report identifies five distinct vulnerability surfaces: physical asset custody, legal framework enforceability, operational process failures, oracle infrastructure manipulation, and smart contract exploits. A security audit of the smart contract alone does not address the other four.
Midas requires that all smart contracts governing tokenized assets undergo third-party security audits, but the protocol's own risk disclosure states clearly that an audit is not a guarantee of freedom from vulnerabilities, bugs, logic errors, or exploitable defects. This is the correct framing. An audit is a point-in-time review by a firm with limited liability, not an insurance policy against future failures.
What you need to verify: the identity of the auditing firm, the date of the most recent audit, whether the audit covered only the token contract or also the custody and redemption infrastructure, and whether any critical or high-severity findings remain unresolved. If the protocol cannot provide a public audit report, that is the end of your evaluation. Do not allocate.
## Step Six: Confirm Net Asset Value Attestation Cadence
Tokenized Treasury products maintain their peg to the underlying asset through daily or weekly net asset value updates that reflect accrued interest, management fees, and any redemptions or deposits that have occurred since the last calculation. The frequency and transparency of that NAV publication determines whether you can trust the on-chain token price or must verify independently before each transaction.
Midas publishes NAV for mTBILL tokens, which appreciate continuously as the underlying BlackRock Treasury fund accrues interest. Redemptions are settled at the published NAV rather than at secondary market prices, which eliminates the price slippage risk present in liquidity pool-based RWA products. That is the correct structure for a Treasury-backed token.
What you need to confirm: who calculates the NAV (internal protocol team versus third-party administrator), how often the NAV is published (daily versus weekly versus on-demand), and whether historical NAV data is available for independent verification. If the NAV is calculated internally without third-party attestation, you are trusting the protocol's accounting without external validation. That is acceptable for small test allocations. It is not acceptable for large capital deployment.
## Step Seven: Test the Redemption Mechanics Before You Deploy Large Capital
The yield you see advertised is the yield you earn only if you can redeem at par when you choose to exit. RWA protocols gate redemptions in three ways: minimum holding periods, batched settlement windows, and tiered fee structures that penalize instant liquidity. All three are disclosed in the terms of service, but few users read the terms before depositing.
Midas offers both instant redemptions and request-based redemptions, with different fee structures for each. Instant redemptions settle on-chain immediately but charge a premium to compensate the protocol for liquidity provision. Request-based redemptions settle within a defined window (typically 1 to 5 business days) at NAV without the instant liquidity premium. The choice between speed and cost is yours, but only if you understand the fee schedule before you deposit.
Before you allocate more than $10,000 to any RWA protocol, deposit $500, hold for 48 hours, and execute a full redemption to confirm that the process works as documented. Verify the final net amount you receive after all fees, compare it to the advertised rate, and calculate the effective yield after accounting for entry and exit costs. [That is the actual return](https://altcoininvestor.com/how-to-evaluate-crypto-yield/), not the headline APY.
## Step Eight: Size the First Allocation and Set the Ongoing Monitoring Cadence
RWA protocols introduce counterparty risk, custody risk, regulatory risk, smart contract risk, and oracle risk that do not exist when you hold Treasuries directly through TreasuryDirect or a brokerage account. The yield premium you earn (if any) is your compensation for accepting that additional risk stack. The question is whether the premium is adequate.
For newly-tracked RWA protocols with limited operating history, allocate no more than 5% of your stablecoin yield portfolio until the protocol has survived at least one full quarter of operation including a period of redemption pressure. For protocols with regulatory approval, multi-year track records, and transparent third-party NAV attestation, you can increase that allocation to 15-20% if the net yield after fees exceeds your next-best alternative by at least 50 basis points.
Set a monthly monitoring cadence to review three metrics: total value locked trend, redemption fee schedule changes, and any amendments to the SPV's custody or legal structure. A declining TVL is not necessarily a failure signal, but it is a reason to verify that redemptions are still processing normally and that the protocol has not quietly changed its fee structure or custodian arrangement. [Automated position monitoring](https://altcoininvestor.com/defi-position-monitoring-alerts/) will alert you to large TVL changes before they become public knowledge on social media.
## Common Failure Modes and What They Look Like in Practice
The 52% TVL contraction Midas experienced represents the single most important failure mode for RWA protocols: concentrated redemption pressure that forces the protocol to sell underlying assets at a loss or gate withdrawals to preserve liquidity. When TVL drops by half in a single day, one of two things has occurred. Either a large institutional holder redeemed for reasons unrelated to protocol health (a portfolio rebalancing, a regulatory constraint, or a migration to a competitor), or a large group of retail users lost confidence simultaneously following a disclosure, a security event, or a competitor offering a materially higher yield.
The protocol's response to that event determines whether it is a resilient system or a fragile one. Did redemptions continue to process at NAV without delay? Did the protocol communicate transparently about the cause of the outflow? Did fee structures remain stable, or did the protocol quietly increase redemption fees to discourage further withdrawals? If you cannot find answers to those questions in the protocol's public communications or third-party post-mortems, the protocol has failed the transparency test.
The second failure mode is fee structure opacity. Midas generated $1.97M in fees over a recent 30-day period, of which only $4,962 was classified as protocol revenue. That gap tells you that most fees are flowing to custodians, SPV administrators, and third-party service providers rather than to token holders or to the protocol treasury. This is not necessarily improper, but it does mean that the net yield after all costs is materially lower than the headline rate. If the protocol does not publish a clear breakdown of where fees go, you cannot calculate your actual return.
The third failure mode is multi-chain fragmentation. Midas deploys across Ethereum, Monad, and Plasma, with Ethereum holding the majority of TVL. An outflow on Ethereum has disproportionate impact on the protocol's overall collateral footprint and can trigger liquidity constraints on secondary chains where NAV attestation may lag or where redemption processing is slower. Verify that the chain you are deploying on has sufficient liquidity to support your redemption without forcing you to bridge to Ethereum first.
## What to Do Next: Test Allocation and Monitoring Setup
If Midas RWA or any similar protocol has passed the eight-step checklist above, your next action is a small test allocation to confirm that deposit, yield accrual, and redemption all function as documented. Deposit between $500 and $2,000 depending on your total intended allocation. Hold for at least one full NAV calculation cycle (typically 24 hours). Then redeem half the position to verify the fee structure and settlement timing.
If the redemption processes at the expected NAV, if fees match the disclosed schedule, and if you receive funds within the stated settlement window, you have confirmed that the protocol's documented mechanics are functioning. At that point you can increase your allocation to the sizing guidelines in step eight: 5% of stablecoin yield capital for new protocols, 15-20% for established protocols with regulatory approval and transparent NAV attestation.
Set a calendar reminder to review the protocol's [TVL and fee metrics](https://defillama.com/protocol/midas-rwa) monthly. A 10% month-over-month TVL decline is a signal to verify redemption processing. A 25% decline is a signal to reduce your allocation by half until you understand the cause. A 50% decline is a signal to exit entirely unless the protocol has published a credible explanation and redemptions continue to process normally.
## The Takeaway
The 3.42% to 10.25% range advertised on Midas RWA USDC positions reflects a spectrum of product structures, fee schedules, and underlying asset strategies that are not equivalent. A tokenized Treasury product yielding 3.42% is underperforming direct Treasury ownership by 60 to 100 basis points unless it provides material additional value through composability, regulatory compliance, or custodial convenience. A product yielding 10.25% is either leveraged, subsidized by token emissions, or structured with redemption constraints that prevent you from exiting at net asset value when you choose.
The due diligence checklist above separates the two. Legal structure verification, custody disclosure, NAV attestation cadence, and redemption mechanics testing are the four steps that determine whether the yield you see is the yield you keep. RWA protocols trade regulatory exposure for yield, and the quality of that trade depends on whether the protocol has built legal separation, transparent fee structures, and resilient redemption infrastructure that function under stress. The 52% TVL contraction Midas survived is your test case. Protocols that processed redemptions at NAV without delay during that event are protocols whose infrastructure is adequate. Protocols that gated withdrawals, raised fees, or went silent are protocols to avoid regardless of the headline yield.
## Frequently Asked Questions
### What is the actual yield on Midas RWA USDC positions after fees?
Midas RWA USDC positions currently advertise yields between 3.16% and 10.25% depending on strategy and chain. The net yield after management fees, custody costs, and redemption fees is typically 50 to 100 basis points lower than the headline rate. Over a recent 30-day period, Midas generated $1.97M in total fees but only $4,962 in protocol revenue, indicating that most fees flow to custodians and service providers rather than to token holders. Always test redemption with a small allocation to confirm your actual net return.
### How does Midas RWA compare to holding U.S. Treasuries directly?
U.S. 3-month Treasury bills currently yield approximately 4% to 4.5% with no counterparty risk, no smart contract risk, and no custodian risk. A Midas mTBILL token yielding 3.42% underperforms direct Treasury ownership by 60 to 100 basis points. The tokenized version is only advantageous if you need DeFi composability, regulatory compliance in a jurisdiction where direct Treasury access is restricted, or the ability to use Treasury-backed collateral in lending or liquidity protocols. Otherwise, direct Treasury ownership delivers higher net yield with lower risk.
### What happened during the 52% TVL contraction on Midas RWA?
Midas RWA experienced a 52% single-day TVL contraction from a higher baseline to $56.9M before recovering to the current $132M level. This represents either a large institutional redemption, a migration to competitor products, or a confidence event following an undisclosed issue. The protocol's response during that period determines its resilience: if redemptions continued to process at NAV without delay or fee increases, the infrastructure is sound. If withdrawals were gated or fees were raised, that signals structural fragility. Verify redemption processing during stress before large allocations.
### Is Midas RWA available to U.S. investors?
No. Midas tokens are not offered to U.S. persons or individuals in sanctioned jurisdictions, as disclosed in the protocol's terms of service. This restriction affects platform availability and secondary market liquidity. U.S. investors seeking tokenized Treasury exposure need to use domestic alternatives that comply with SEC regulations, such as money market fund tokens or Treasury-backed stablecoins issued by U.S.-regulated entities. Attempting to access Midas through VPNs or offshore accounts creates regulatory risk without eliminating the underlying geographic restriction.
### What is the recommended allocation size for Midas RWA?
For newly-tracked RWA protocols, allocate no more than 5% of your stablecoin yield portfolio until the protocol has survived at least one full quarter including a redemption stress event. For protocols with regulatory approval, multi-year track records, and transparent third-party NAV attestation like Midas, increase allocation to 15-20% only if the net yield after all fees exceeds your next-best alternative by at least 50 basis points. Always test with a $500 to $2,000 deposit first to confirm that redemption mechanics work as documented before larger deployment.
The Weekly Yield Report
You have just reviewed the eight-step checklist that separates sustainable RWA yields from unsecured protocol claims. That checklist will need to be re-run every quarter as custody arrangements, fee structures, and regulatory approvals change.
Every Thursday: where crypto yield actually is - stablecoins, liquid staking and DeFi lending, with the risk named next to the rate and what changed since last week.
[Get it free every Thursday](#/portal/signup)
Free. No trade calls, no allocations, no hype. Unsubscribe in one click.
### When BlackRock BUIDL Disappeared From Tracking At 3.75%
URL: https://altcoininvestor.com/blackrock-buidl-yield-disappeared/
Last updated: 2026-10-01T22:03:42.000Z
## The Question

The BlackRock USD Institutional Digital Liquidity Fund, known as BUIDL, holds $3.4 billion in assets and is the largest tracked tokenized real-world asset product by total value locked. In late 2026, the fund disappeared intermittently from several third-party yield aggregators while continuing to accrue yield for qualified holders. The question worth answering is not whether the fund failed, because it did not, but whether a tracking disappearance signals a terms change that could cost a qualified holder thousands of dollars, and how to verify continued accrual when third-party dashboards no longer reflect your position.
The scenario is specific. You hold $500,000 in BUIDL across two chains. Your portfolio tracker shows the position one week, then does not show it the next. The fund's advertised yield at the time of disappearance was running between 3.4% and 3.75%, depending on the chain and the period measured. If that yield stopped accruing for three months before you noticed, the cost would be approximately $4,400 in foregone income. If the terms changed in a way that reset your subscription or triggered an early redemption penalty, the cost could be structural. This is the income mechanism at stake when tracking disappears.
## What Actually Happened
BlackRock BUIDL did not stop operating when it disappeared from certain trackers. The fund is a permissioned tokenized money market product launched in March 2024 with Securitize as transfer agent and BNY Mellon as custodian. It holds short-duration U.S. Treasury bills, repurchase agreements, and cash equivalents. Each BUIDL token represents a claim on one dollar of net asset value, and yield accrues daily through a rebase mechanism. Dividends are distributed monthly as freshly minted BUIDL tokens rather than as a price change in the existing token. The fund targets qualified purchasers with a minimum subscription of $5 million and restricts token transfers to wallets that Securitize has added to a whitelist after verifying identity and accreditation.
When BUIDL disappeared from third-party trackers, the operational cause was not fund failure but data access restriction. The fund operates across six chains: Ethereum, Arbitrum, Avalanche, Optimism, Polygon, and Aptos. Yield aggregators like DefiLlama and RWA.xyz pull data by querying on-chain contracts and cross-referencing custodian disclosures. When access to one of those data sources tightens or when the rebasing mechanism produces a data structure that an aggregator has not accounted for, the tracker stops updating. [DefiLlama currently tracks nine BlackRock BUIDL yield pools](https://defillama.com/protocol/blackrock-buidl) with an average yield of 3.4%, but those pools represent only the chains and contract versions for which the aggregator has maintained a functioning data feed.
RWA.xyz, another institutional tracker, publishes a clear delisting policy. When a tokenized asset is delisted, redeemed, wound down, or removed from its issuing platform, the tracker stops updating the asset's data going forward but preserves its entire history for transparency and research. The language matters. A delisting does not mean the fund closed. It means the tracker lost the data feed or the asset no longer meets the inclusion criteria. For a permissioned product like BUIDL, where only whitelisted wallets can hold or transfer the token, aggregators face a structural problem. If the aggregator's wallet is not on the whitelist, it cannot query the full holder set or verify transfers. The data becomes partial, and many trackers choose to stop publishing partial data rather than risk publishing incomplete yield calculations.
The other operational factor is the rebasing yield mechanism. Because BUIDL distributes yield as additional tokens rather than as a change in token price, any protocol that wraps or integrates BUIDL must track the daily accrual and adjust its internal accounting to reflect the changing token balance. Ondo Finance, which holds more than $192 million in BUIDL as backing for its own yield-bearing stablecoin products, does this by maintaining a wrapper contract that converts the rebasing BUIDL token into a non-rebasing derivative. If a yield tracker does not account for the rebase, it will understate the yield. If the tracker's data feed from Securitize's institutional portal is interrupted, it will have no yield figure to publish at all.
The specific tracking disappearance in late 2026 appears to have resulted from a combination of multi-chain data fragmentation and temporary API access restrictions following Securitize's update to its institutional disclosure portal. No terms change was announced. No redemption wave occurred. The fund's custodian and issuer continued publishing daily NAV and yield figures through the institutional portal, but several public aggregators lost automated access to those figures for a period of days to weeks, depending on the chain and the aggregator.
## How to Verify Independently

When a position disappears from a third-party tracker, you have six hours to distinguish data lag from liquidity freeze, and 48 hours to verify whether the underlying yield mechanism continues to function. The verification process for a permissioned tokenized fund like BUIDL differs from the process for an open DeFi protocol, because the source of truth is not purely on-chain. Here is the checklist.
First, check the Securitize institutional portal directly. Securitize publishes the current net asset value per share and the trailing yield for BUIDL on a dedicated page accessible to qualified investors. This is the primary source. If the portal shows a current NAV of $1.00 and a trailing 30-day yield in the low-4% range, the fund is operating normally. If the portal is not accessible or if the yield figure has not updated in more than 48 hours, that is a signal worth investigating further.
Second, cross-reference the total value locked figures across multiple aggregators. DefiLlama and RWA.xyz do not always agree on TVL because they index different chains and use different cut-off criteria for inclusion. If DefiLlama shows $3.4 billion and RWA.xyz shows $2.1 billion, the discrepancy likely reflects a difference in which chains are being counted rather than a $1.3 billion outflow. Check each chain individually using the blockchain explorers for Ethereum, Arbitrum, Avalanche, Optimism, Polygon, and Aptos. The BUIDL token contract address is published by BlackRock and Securitize. Query the total supply on each chain and multiply by $1.00 to calculate the total value locked per chain. If the sum matches the last known TVL figure within a few percentage points, no material outflow has occurred.
Third, verify on-chain transfer activity. Even though BUIDL is permissioned and most holders are institutions or treasuries that do not trade frequently, the token contract will show mint and burn events corresponding to new subscriptions and redemptions. If the contract shows daily or weekly mints, the fund is still accepting subscriptions. If the contract shows no activity for two weeks, that is unusual and worth contacting Securitize to confirm whether subscriptions have been paused.
Fourth, contact the custodian or transfer agent directly. BNY Mellon is the custodian. Securitize is the transfer agent. Both have institutional contact channels for qualified investors. If you hold $500,000 or more in BUIDL, you are a qualified investor and you have a right to ask whether the fund's terms have changed, whether your subscription remains active, and whether yield is accruing. The response time is typically 24 to 48 hours. If you receive no response within 72 hours, escalate to BlackRock's institutional client service team.
Fifth, monitor official BlackRock communications and regulatory filings. Tokenized funds that hold U.S. securities are subject to SEC reporting requirements. Material changes to the fund's structure, fee schedule, or distribution policy will appear in an SEC filing before they appear anywhere else. BlackRock publishes press releases for product expansions and changes. [When BUIDL expanded from Ethereum to five additional blockchains in late 2024](https://www.coindesk.com/business/2024/11/13/blackrock-expands-tokenized-fund-buidl-beyond-ethereum-to-five-new-blockchains), the announcement came through a press release and was covered by financial media within hours. If no such announcement has been made, no material change has occurred.
Sixth, check the Ondo Finance wrapper contracts. Ondo holds more than $192 million in BUIDL and uses it as collateral for its own tokenized yield products. If Ondo's contracts show uninterrupted yield pass-through and no pause in BUIDL redemptions, that is a reliable signal that the underlying fund continues to operate normally. Ondo's contracts are public and audited. Any interruption in BUIDL's yield accrual would appear as a discrepancy between the yield Ondo advertises and the yield its contracts are actually distributing.
This six-step checklist distinguishes three categories of tracking disappearance. Data lag, where the tracker has temporarily lost its feed but the fund continues operating. Access restriction, where the fund has tightened its whitelist or changed its API structure and the tracker has not yet adapted. And operational failure, where the fund has paused subscriptions, halted yield distributions, or experienced a custodial or regulatory issue. The first two categories are common and non-threatening. The third is rare for a BlackRock product but would be visible through multiple channels within 48 hours.
## When It Matters and When It Does Not
A tracking disappearance matters when it masks a terms change that would otherwise trigger an exit decision. The scenario to guard against is this: the fund changes its fee structure, tightens its redemption terms, or experiences a regulatory restriction that limits your ability to exit, and you do not learn of the change for 30 or 60 days because your portfolio tracker is not updating. By the time you notice, your capital is locked or the fee increase has already cost you several basis points of return.
For BUIDL specifically, the fee structure varies by chain. On Ethereum, Arbitrum, and Optimism, the management fee is 50 basis points annually. On Aptos, Avalanche, and Polygon, the fee is 20 basis points. If you deployed $500,000 on Ethereum and the fund later moved all new subscriptions to Polygon at the lower fee without offering existing holders the option to migrate, that is a 30-basis-point annual cost, or $1,500 per year on a $500,000 position. The difference is material. If your tracker does not update and you do not monitor the fund's disclosures directly, you will not know that lower-cost access is available.
The other scenario where tracking disappearance matters is during a period of rising interest rates. BUIDL's yield tracks the federal funds rate because the fund invests in short-duration Treasuries and repo. When the Fed raises rates, BUIDL's yield rises with a lag of a few weeks. If rates rise from 4.0% to 4.5% and your tracker is not updating, you will not see the yield increase reflected in your portfolio. That might delay a decision to allocate additional capital to BUIDL or to exit a lower-yielding position elsewhere. The cost is opportunity cost rather than direct loss, but it accumulates.
A tracking disappearance does not matter when you have established a direct verification routine that does not depend on third-party aggregators. If you already check the Securitize portal weekly, query the on-chain contract monthly, and maintain contact with the transfer agent, then whether DefiLlama or RWA.xyz publishes your position is irrelevant. The tracker is a convenience, not a necessity. The necessary verification is what you do yourself.
It also does not matter if the disappearance is isolated to a single aggregator and other aggregators continue to publish accurate data. If DefiLlama stops updating but RWA.xyz, your exchange's portfolio tracker, and your own on-chain queries all show the same TVL and yield figures, the problem is with DefiLlama's data feed, not with the fund. The response in that case is to stop relying on the aggregator that has lost the feed and to use the aggregators that still have it.
The broader principle is this. Tokenized institutional products like BUIDL are structurally different from open DeFi protocols. The yield is not generated by liquidity provision or by trading fees collected from a public pool. It is generated by the returns on a portfolio of regulated securities held by a custodian. The transparency is not purely on-chain. It depends on disclosures published by the transfer agent, the custodian, and the issuer, and those disclosures are gated by the same accreditation and whitelisting requirements that gate access to the fund itself. If you are a qualified holder, you have direct access to the disclosures. If you are not a qualified holder, you cannot hold the fund in the first place, and you have no position to verify.
For similar issues across other tracked positions, [the multi-position disappearance framework](https://altcoininvestor.com/multiple-defi-positions-disappeared-tracking/) applies the same verification process to BUIDL, Aave USDe, and Jupiter positions that vanished in the same week. The common thread is that data provider changes, not fund failures, cause most tracking disappearances.
## What This Reveals About Permissioned RWA Yield
The BUIDL tracking disappearance is a case study in the transparency gap that exists between permissioned tokenized products and open DeFi protocols. Open protocols publish all data on-chain. Anyone can query the contracts, verify the total value locked, calculate the yield from fee revenue, and confirm that the mechanism producing the yield is functioning. Permissioned products publish some data on-chain, specifically the token supply and transfer activity, but the yield calculation and the underlying portfolio composition are disclosed through off-chain channels controlled by the issuer.
This structure is not a flaw. It is a feature of regulated investment products. A tokenized money market fund that holds U.S. Treasuries is subject to the same disclosure and custody requirements as a traditional money market fund. The custodian must attest to the holdings. The fund must publish a daily NAV. The yield must be calculated according to SEC rules. The difference is that the shares are represented by tokens on a blockchain rather than by entries in a traditional brokerage account. The blockchain provides settlement efficiency and 24-hour transferability within the whitelisted holder set, but it does not eliminate the need for a custodian, a transfer agent, or regulatory filings.
The consequence for yield verification is that you cannot rely solely on on-chain data. You must also monitor the off-chain disclosures. If the transfer agent's portal goes offline or restricts API access, third-party trackers lose the data feed. If the custodian does not publish daily NAV updates, there is no current yield figure to display. The tracker can still show the token supply and the holder count, but it cannot calculate the yield or confirm that redemptions are being processed at par.
This is the reason that [when a protocol drops off yield trackers](https://altcoininvestor.com/protocol-disappeared-from-yield-tracker-what-to-do/), the first step is not to assume failure but to check the primary sources. For BUIDL, the primary source is Securitize. For other tokenized treasury products, the primary source is the transfer agent or custodian named in the fund's documentation. For open DeFi protocols, the primary source is the contract itself.
The broader implication is that permissioned tokenized yield will always have a transparency ceiling. You can verify that the token exists and that transfers are being processed, but you cannot independently audit the portfolio or confirm the yield calculation without access to the custodian's disclosures. If those disclosures are restricted to qualified investors, then public trackers will always be one step removed from the source of truth. If the issuer tightens access or changes the API structure, public trackers will lose the feed. The solution is not to demand that every tokenized fund become fully transparent, because that would require eliminating the custody and regulatory structure that makes the fund legal in the first place. The solution is to understand the transparency model of the product you are holding and to verify accordingly.
For traditional stablecoin yield opportunities that do not require accreditation, [the passive income framework](https://altcoininvestor.com/how-to-earn-passive-income-stablecoins-2026/) walks through CeFi platforms, DeFi lending, and yield-bearing tokens where the verification process is simpler because the data is fully on-chain or published by platforms with public APIs.
## The Takeaway
BlackRock BUIDL did not fail when it disappeared from yield trackers in late 2026\. The fund continued to hold $3.4 billion in assets, accrue yield daily, and distribute dividends monthly. What changed was that several public aggregators lost automated access to the data feeds they had been using to calculate and publish the fund's yield. The cause was a combination of API access restrictions following a portal update by Securitize and the structural difficulty of tracking a permissioned, rebasing token across six blockchains. For a qualified holder with $500,000 deployed, the operational response is to verify independently through the Securitize portal, on-chain contract queries, custodian contact, and regulatory filings rather than relying on third-party trackers. The cost of not verifying is the risk that a terms change or fee structure shift goes unnoticed for weeks or months, eroding several thousand dollars in return. The broader lesson is that permissioned tokenized products will always have a transparency gap compared to open DeFi protocols, and that gap means you cannot verify yield solely through public aggregators. You must go to the primary sources, and if you are not a qualified investor with direct access to those sources, you cannot verify the position at all.
## Frequently Asked Questions
### Why did BlackRock BUIDL disappear from yield trackers if the fund is still operating?
BUIDL disappeared from some trackers because they lost automated access to data feeds from Securitize, the transfer agent, following a portal update in late 2026\. The fund is permissioned and uses a rebasing token structure, which makes it harder for aggregators to track across six blockchains. The tracker lost the feed, not the fund's operational capacity. Yield continued accruing for qualified holders throughout the tracking disappearance.
### How do I verify that my BUIDL position is still accruing yield if my tracker stops updating?
Check the Securitize institutional portal directly for current NAV and trailing yield. Query the BUIDL token contract on your blockchain using a block explorer to verify mint and burn activity. Cross-reference TVL figures across DefiLlama and RWA.xyz. Contact Securitize or BNY Mellon as custodian. Monitor BlackRock press releases and SEC filings for material changes. Check Ondo Finance wrapper contracts, which hold over $192 million in BUIDL, for uninterrupted yield pass-through.
### What is the cost of not noticing a tracking disappearance for a $500,000 BUIDL position?
If yield stopped accruing and you did not notice for three months, the foregone income at 3.5% APY would be approximately $4,400\. If a terms change altered the fee structure or redemption conditions without your knowledge, the cost could be larger and structural. If the disappearance reflects only a data feed issue and yield continues accruing, there is no cost beyond the inconvenience of verifying manually.
### Does a tracking disappearance mean the fund has restricted access or changed terms?
Not necessarily. Most tracking disappearances result from data provider issues, not from fund-level changes. For BUIDL, the late-2026 disappearance reflected Securitize API access restrictions and multi-chain indexing gaps, not a terms change or access restriction. To distinguish, check official BlackRock communications, SEC filings, and the Securitize portal. If those sources show no material change, the issue is with the tracker, not the fund.
### Why is BUIDL harder to track than open DeFi protocols?
BUIDL is a permissioned tokenized money market fund. Yield is generated by a portfolio of U.S. Treasuries held by a custodian, not by on-chain fee revenue. The yield calculation depends on off-chain disclosures from Securitize and BNY Mellon, which are restricted to qualified investors. Token transfers are restricted to whitelisted wallets, so aggregators cannot query the full holder set or independently verify the portfolio. Open DeFi protocols publish all data on-chain, making verification simpler.
The Weekly Yield Report
You have just walked through the six-step verification process for a $3.4 billion institutional yield product that disappeared from tracking. Those steps will be different when the next product does the same.
Every Thursday: where crypto yield actually is - stablecoins, liquid staking and DeFi lending, with the risk named next to the rate and what changed since last week.
[Get it free every Thursday](#/portal/signup)
Free. No trade calls, no allocations, no hype. Unsubscribe in one click.
### How To Monitor For Position Disappearance Across Protocols
URL: https://altcoininvestor.com/defi-position-monitoring-alerts/
Last updated: 2026-10-01T21:10:30.000Z
## Why Manual Position Checks Fail During Exploits

A reader with $400,000 across eight protocols checked positions once per day. Three Jupiter positions and one Aave position disappeared from tracking within a six-hour window. Manual review missed it. By the time Discord reported the issue, 12 hours had passed.
The income mechanism here is specific. A one-hour alert versus a 6-12 hour delay preserves optionality. If your position becomes un-withdrawable due to admin key compromise, governance pause, or collateral cascade, the difference between hour one and hour six determines whether you exit at 98 cents on the dollar or 40 cents. April 2026 saw 30+ attacks net nearly $635 million in a single month. Drift Protocol alone lost $280 million through social engineering that exploited Solana's durable nonce system. Manual monitoring cannot compete.
You need three alert layers: balance and rate queries via RPC or subgraph, health factor monitoring for collateralized positions, and event subscriptions for withdrawal state changes. This article provides the specific configuration for Ethereum, Solana, and Arbitrum.
## Alert Layer 1: Balance and Rate Queries via RPC and Subgraph

The fastest alert path for balance disappearance is direct RPC polling or subgraph subscription. The Graph subgraph queries average 5 milliseconds with roughly one block delay. Direct RPC polling takes 200-500 milliseconds with immediate freshness. Dune Analytics SQL takes 8,000 milliseconds with a five-minute delay. For position monitoring with a one-hour alert threshold, subgraphs provide the best speed-to-reliability ratio.
### Ethereum and Arbitrum: eth\_call for Balance State
Query your position balance using `eth_call` against the lending pool contract. For Aave V3 on Ethereum or Arbitrum, the contract method is `getUserAccountData(address user)`. You receive total collateral in base currency, total debt, available borrow capacity, liquidation threshold, loan-to-value ratio, and health factor.
Example RPC call structure (Ethereum mainnet via Alchemy):
curl https://eth-mainnet.g.alchemy.com/v2/YOUR\_API\_KEY \\
\-X POST \\
\-H "Content-Type: application/json" \\
\-d '{
"jsonrpc":"2.0",
"method":"eth\_call",
"params":\[{
"to":"0x87870Bca3F3fD6335C3F4ce8392D69350B4fA4E2",
"data":"0xbf92857c000000000000000000000000YOUR\_WALLET\_ADDRESS"
}, "latest"\],
"id":1
}'
Poll this endpoint every 60 seconds. Store the returned balance. If balance drops to zero and your last known deposit was non-zero, trigger an alert. If the rate component (calculated from `totalCollateralBase / totalDebtBase`) moves below your minimum threshold, trigger a separate rate alert.
Arbitrum uses the same `eth_call` structure. [Arbitrum's RPC methods](https://docs.arbitrum.io/arbitrum-essentials/arbitrum-vs-ethereum/rpc-methods) mirror Ethereum because Arbitrum runs go-ethereum at its core, though `eth_syncing` and transaction responses add fields. For position monitoring, no modification is required.
### Solana: getProgramAccounts and Instruction-Level Granularity
Solana position disappearance differs structurally. Solana uses instruction-level granularity rather than EVM-style contract calls. Monitor account closure events and lamport burns for your deposited token accounts.
Query your Jupiter or Drift position using `getProgramAccounts` filtered by your wallet's public key as owner. Example structure via Helius or Alchemy Solana endpoint:
curl https://mainnet.helius-rpc.com/?api-key=YOUR\_API\_KEY \\
\-X POST \\
\-H "Content-Type: application/json" \\
\-d '{
"jsonrpc":"2.0",
"id":1,
"method":"getProgramAccounts",
"params":\[
"PROGRAM\_ID\_FOR\_PROTOCOL",
{
"encoding":"jsonParsed",
"filters":\[
{"memcmp":{"offset":32,"bytes":"YOUR\_WALLET\_PUBKEY"}}
\]
}
\]
}'
Poll every 60 seconds. If the account list returns empty and your last poll showed a position, alert. Solana finality is 400-600 milliseconds, so two consecutive empty results confirm disappearance rather than transient RPC lag.
### Subgraph Query for Multi-Position Aggregation
If you run positions across Aave on Ethereum, Polygon, Arbitrum, Optimism, and Base, querying five separate RPC endpoints becomes inefficient. Use The Graph's Aave V3 subgraph for aggregated state.
Example GraphQL query (via The Graph hosted service or decentralized network):
{
userReserves(where: {user: "YOUR\_WALLET\_ADDRESS\_LOWERCASE"}) {
reserve {
symbol
underlyingAsset
}
currentATokenBalance
currentVariableDebt
liquidityRate
}
}
Poll this query every 30 seconds. The 5-millisecond response time and one-block delay make subgraphs faster than RPC for read-heavy monitoring. [OpenClaw's Aave liquidation monitor](https://github.com/openclaw/skills/blob/main/skills/jgramajo4/aave-liquidation-monitor/SKILL.md) provides a reference implementation with GraphQL queries, health factor thresholds, and multi-chain support.
## Alert Layer 2: Health Factor Monitoring for Collateralized Positions
Balance queries detect complete disappearance. Health factor monitoring detects collateral impairment before liquidation. When attackers borrow against stolen collateral, the collateral left behind becomes impaired. Positions should trigger liquidation but cannot. Health factor monitoring alone misses this, but combined with balance queries it provides early warning.
Set two thresholds: warning at 1.2 and critical at 1.05\. Aave liquidates at 1.0, so a 1.05 alert gives you minutes to act, not seconds. A 1.2 warning gives you hours to add collateral or reduce debt before the critical threshold.
### Telegram and Discord Webhook Setup
Route health factor alerts to Telegram or Discord via webhook. The chain is: monitoring script queries RPC or subgraph, evaluates thresholds, posts to webhook URL, and webhook relays to your messaging app. This adds 0.5-3 seconds of latency, acceptable for a one-hour alert requirement.
Telegram setup: create a bot via BotFather, obtain the bot token, and retrieve your chat ID by sending a message to the bot and querying `https://api.telegram.org/botYOUR_BOT_TOKEN/getUpdates`. Your chat ID appears in the response.
Send alerts using:
curl -X POST https://api.telegram.org/botYOUR\_BOT\_TOKEN/sendMessage \\
\-H "Content-Type: application/json" \\
\-d '{
"chat\_id":"YOUR\_CHAT\_ID",
"text":"CRITICAL: Aave health factor dropped to 1.04 on Ethereum mainnet. Position: 125k USDC collateral, 95k DAI debt."
}'
Discord setup: create a webhook in your server's channel settings (Edit Channel > Integrations > Webhooks). Copy the webhook URL.
Send alerts using:
curl -X POST YOUR\_DISCORD\_WEBHOOK\_URL \\
\-H "Content-Type: application/json" \\
\-d '{
"content":"CRITICAL: Aave health factor dropped to 1.04 on Ethereum mainnet. Position: 125k USDC collateral, 95k DAI debt."
}'
Run these scripts on a cron job or perpetual loop. For [crypto lending protocols](https://altcoininvestor.com/how-to-earn-crypto-lending/) like Aave, Morpho, or Compound, health factor changes happen within blocks, so sub-minute polling is necessary.
## Alert Layer 3: Event Subscriptions for Withdrawal State Changes
Balance and health queries are reactive. Event subscriptions are proactive. Subscribe to `LiquidationCall`, `Paused`, and `EmergencyAction` events via WebSocket connection to your RPC provider. Do not poll for events. Polling introduces 30-60 second windows where you miss the event entirely.
### WebSocket Subscription for Ethereum and Arbitrum
Connect to your RPC provider's WebSocket endpoint. Alchemy and Infura both support `wss://` connections. Subscribe to logs filtered by contract address and event signature.
Example using `wscat` or a WebSocket library:
wscat -c wss://eth-mainnet.g.alchemy.com/v2/YOUR\_API\_KEY
\> {"jsonrpc":"2.0","id":1,"method":"eth\_subscribe","params":\["logs",{"address":"0x87870Bca3F3fD6335C3F4ce8392D69350B4fA4E2","topics":\["0xe413a321e8681d831f4dbccbca790d2952b56f977908e45be37335533e005286"\]}\]}
The topic hash `0xe413a321...` corresponds to `LiquidationCall(address,address,address,uint256,uint256,address,bool)`. When Aave liquidates a position, you receive the event within one block (12 seconds on Ethereum, sub-second on Arbitrum). If the liquidated address matches your wallet, alert immediately.
For governance pauses, subscribe to the `Paused()` event on the lending pool configurator contract. If the protocol pauses withdrawals, you cannot exit regardless of health factor. This is pre-settlement risk. Detect it before Twitter does.
### Solana WebSocket for Account Changes
Solana provides `accountSubscribe` for real-time account state changes. Subscribe to your token account or the program-derived address (PDA) holding your position.
wscat -c wss://mainnet.helius-rpc.com/?api-key=YOUR\_API\_KEY
\> {"jsonrpc":"2.0","id":1,"method":"accountSubscribe","params":\["YOUR\_TOKEN\_ACCOUNT\_PUBKEY",{"encoding":"jsonParsed","commitment":"confirmed"}\]}
When the account balance changes or the account closes, you receive the update within 400-600 milliseconds. If balance drops to zero, alert. If the account status changes to closed, alert. Solana's instruction-level granularity makes account subscriptions more reliable than polling `getProgramAccounts`.
## Using Dedicated Monitoring Services vs. Self-Hosted Scripts
You can build the alert system described above using RPC endpoints, cron jobs, and webhook scripts. Total cost: $29-$49 per month for RPC API access (Alchemy free tier covers 300 million compute units, sufficient for 10-15 positions polled every 60 seconds). Build time: 8-12 hours for multi-chain support and error handling.
Alternatively, use a dedicated monitoring service. Otomato monitors positions across Aave, Morpho, Pendle, Hyperliquid, and 22+ protocols with zero-setup wallet monitoring. You connect your wallet read-only, configure alert thresholds, and receive Telegram or mobile notifications. Pricing: free for basic monitoring.
CoinStats provides wallet balances, transactions, and protocol-level DeFi positions starting at $49 per month. DefiLlama API is free for normal traffic with no authentication required. Pro tier at $300 per month adds higher rate limits and dedicated support.
The trade-off is control versus convenience. Self-hosted scripts give you sub-minute polling, custom threshold logic, and no dependency on third-party uptime. Dedicated services eliminate build time but introduce platform risk. If Otomato's infrastructure fails during an exploit, your alerts fail. If your self-hosted script's RPC provider fails, you need fallback endpoints configured.
### Multi-Chain RPC Redundancy
Configure at least two fallback RPC endpoints per chain. Alchemy, Infura, QuickNode, and public endpoints provide redundancy. Arbitrum experienced a 1.5-hour RPC provider failure in December 2024\. If your monitoring script relied on a single endpoint, you had no alerts during that window.
Fallback logic: primary RPC fails after two consecutive timeouts (5 seconds each), switch to secondary. Secondary fails, switch to tertiary. Log all failures. Review logs weekly to identify which providers have the highest uptime for your query patterns.
## Common Failure Modes and How to Detect Them
Rate-to-zero scenarios require both balance queries and earned-value tracking. A position may remain withdrawable while yield stops accruing. If Aave's USDC supply rate drops from 4.5% to 0.1% due to utilization collapse, your balance does not disappear but your income does. Set a minimum acceptable rate threshold. If the rate falls below that threshold for three consecutive queries (three minutes), alert.
Clean protocol shutdowns announce timelines. The protocol moves to read-only on day X, permanent shutdown on day Y. Lack of this clarity combined with disappearing positions signals highest risk. Monitor protocol governance forums and official Discord channels for shutdown announcements. If you detect a balance drop without a corresponding withdrawal transaction from your wallet, cross-reference governance channels before assuming exploit.
Bridge and LayerZero failures introduce cross-chain dependency risk. KelpDAO lost $292 million through compromised infrastructure and cross-chain verification failures targeting a 1-of-1 verifier setup. If your position spans multiple chains (e.g., collateral on Ethereum, debt on Arbitrum via a bridge), monitor both sides independently. A bridge pause or verifier compromise can make one side un-withdrawable while the other side remains active, creating unbounded liquidation risk.
### Blind Spot Example: Drift Protocol April 2026
Attackers spent months building trust with Drift's Security Council before exploiting Solana's durable nonce system. Pre-signed transactions drained $280 million. Automated monitoring could not distinguish normal redemptions from theft-driven drains until withdrawal volume patterns emerged. The signal was withdrawal rate 15x higher than 30-day average combined with Security Council signers reporting suspicious transaction requests on Discord.
Your alert system cannot prevent this. It can give you 30-90 minutes of lead time if you monitor both on-chain withdrawal velocity and social channels. Set a velocity alert: if total protocol withdrawals in the past hour exceed 10x the rolling 24-hour average, flag for manual review. Combine that with Discord keyword monitoring for "suspicious," "unauthorized," "compromised," and "pause."
## Implementation Checklist
Set up position monitoring in this order:
1. Choose RPC providers for each chain. Alchemy or Infura for Ethereum and Arbitrum, Helius or Triton for Solana. Configure API keys.
2. Identify contract addresses for each protocol. Aave V3 Ethereum: `0x87870Bca3F3fD6335C3F4ce8392D69350B4fA4E2`. Aave V3 Arbitrum: `0x794a61358D6845594F94dc1DB02A252b5b4814aD`. Verify addresses via official protocol documentation.
3. Write or deploy balance query scripts. Poll every 60 seconds. Store previous balance. Alert if balance drops to zero or falls below minimum threshold.
4. Write or deploy rate query scripts. Poll every 60 seconds. Alert if rate falls below minimum acceptable yield for three consecutive queries.
5. Configure health factor monitoring for collateralized positions. Alert at 1.2 (warning) and 1.05 (critical).
6. Set up Telegram or Discord webhooks. Test with manual curl commands before integrating into scripts.
7. Subscribe to WebSocket events for `LiquidationCall`, `Paused`, and `EmergencyAction` on each protocol.
8. Configure fallback RPC endpoints. Test failover logic by temporarily blocking primary endpoint.
9. Set velocity alerts for protocol-wide withdrawal rate. If hourly withdrawals exceed 10x the 24-hour average, flag for review.
10. Document expected false positive rate. Test alerts by temporarily lowering thresholds and observing behavior during normal market volatility.
Run the system for one week in test mode (alerts logged but not sent) to calibrate thresholds. A health factor warning at 1.3 may trigger too frequently if you run leveraged yield positions. A rate alert at 3.5% may trigger during normal utilization cycles. Adjust based on your specific positions and risk tolerance.
## What to Do When an Alert Fires
Health factor critical alert: add collateral or repay debt within 10 minutes. If you cannot access your wallet (hardware wallet at home, you are traveling), have a pre-authorized hot wallet with 5-10% of position size in stablecoins ready to deploy.
Balance disappearance alert: check the protocol's official Discord and Twitter immediately. If no announcement, assume exploit. Do not attempt to withdraw. If the position is already un-withdrawable, withdrawing burns gas for no outcome. Check if the protocol has paused withdrawals via governance. If paused, monitor governance forum for timeline. If not paused and balance is zero, review your wallet's transaction history for unauthorized signatures.
Rate-to-zero alert: [review why the rate collapsed](https://altcoininvestor.com/protect-against-defi-yield-drops/). If utilization dropped (borrowers repaid, supply increased), the rate collapse is structural and reversible when utilization recovers. If the protocol's incentive program ended, the rate collapse is permanent. Exit if the new rate falls below your minimum acceptable yield.
Velocity alert: do not withdraw immediately. Check if the velocity spike corresponds to a known event (token unlock, governance migration, liquidity mining program end). If no known event, treat as potential exploit. Monitor for 15-30 minutes. If velocity remains elevated and protocol has not announced maintenance, exit.
## The Takeaway
A monitoring system that alerts within one hour gives you optionality during the window when exits are still possible at 90-98 cents on the dollar. The six-hour delay from manual checks costs you that window. The specific setup is RPC or subgraph polling every 60 seconds for balance and rate, WebSocket subscriptions for liquidation and pause events, and velocity alerts for protocol-wide withdrawal spikes above 10x average. Build it yourself for $29-$49 per month in API costs, or use Otomato for zero-setup monitoring. Either way, [track your positions](https://altcoininvestor.com/track-defi-yield-positions-efficiently/) with sub-hour latency or accept that you will be the last to know when something breaks.
## Frequently Asked Questions
### How quickly can an automated alert system detect position disappearance?
Subgraph queries with 60-second polling detect balance changes within 60-72 seconds (one poll cycle plus one block delay). WebSocket event subscriptions detect liquidation or pause events within one block, which is 12 seconds on Ethereum, sub-second on Arbitrum, and 400-600 milliseconds on Solana. Combined with webhook relay latency of 0.5-3 seconds, total alert time is under two minutes for most failure modes.
### What is the difference between RPC polling and subgraph queries for monitoring?
RPC polling queries blockchain nodes directly using eth\_call, taking 200-500 milliseconds per query with immediate data freshness. Subgraph queries use The Graph's indexed data, averaging 5 milliseconds with roughly one block delay. For monitoring 10-15 positions across multiple chains, subgraphs provide faster response times and lower computational cost than polling separate RPC endpoints for each chain.
### Can I monitor Solana positions the same way as Ethereum positions?
No. Solana uses instruction-level granularity and account-based state rather than EVM contract calls. Monitor Solana positions using getProgramAccounts filtered by your wallet's public key, polling every 60 seconds, or subscribe via accountSubscribe WebSocket for real-time account state changes. Solana finality is 400-600 milliseconds, so two consecutive empty results confirm disappearance rather than transient RPC lag.
### What should I do when a health factor alert fires?
Add collateral or repay debt within 10 minutes. Aave liquidates at health factor 1.0, so a 1.05 critical alert gives you minutes to act. If you cannot access your hardware wallet immediately, maintain a pre-authorized hot wallet with 5-10% of position size in stablecoins ready to deploy. Do not wait for manual review during critical alerts. Protocol state can change within blocks.
### How do I detect protocol exploits before Twitter reports them?
Set a velocity alert that flags when total protocol withdrawals in the past hour exceed 10x the rolling 24-hour average. Combine on-chain velocity monitoring with Discord keyword alerts for terms like suspicious, unauthorized, compromised, and pause. Cross-reference both signals. Drift Protocol's $280 million exploit in April 2026 showed withdrawal velocity 15x above average 30-90 minutes before public announcement.
The Weekly Yield Report
You have the RPC endpoints, webhook setup, and threshold configuration to detect disappearance within one hour. Those thresholds and API limits will change as protocols evolve.
Every Thursday: where crypto yield actually is - stablecoins, liquid staking and DeFi lending, with the risk named next to the rate and what changed since last week.
[Get it free every Thursday](#/portal/signup)
Free. No trade calls, no allocations, no hype. Unsubscribe in one click.
### Jupiter Lend USDC And WSOL: Exit Signals And Recovery
URL: https://altcoininvestor.com/jupiter-lend-disappeared-why/
Last updated: 2026-10-01T19:06:15.000Z
## The Question: What Causes Jupiter Lend Positions To Drop Off Tracking
You check your dashboard. Your Jupiter Lend USDC position showed 4.2% yesterday. Today the line item is gone.
The protocol itself reports $1.05 billion in TVL and $907 million in active loans. The GitHub repo is live, audits are posted, transactions clear on-chain. Yet your position vanished from the tracking interface you rely on.
Three mechanism failures cause this: utilization ceilings that hard-block withdrawals when breached, oracle data gaps that cause tracking APIs to drop positions they cannot price, and liquidity drain events where depositor exit flow exceeds the protocol's withdraw buffer. The third is the one that matters. When withdrawal demand spikes, Jupiter Lend's architecture can lock positions until inflow restores the gap.
This is not a theoretical risk. In December 2025, Jupiter Exchange COO Kash Dhanda acknowledged that claims about "zero contagion risk" in Jupiter Lend vaults were inaccurate. The protocol used recollateralized assets, meaning your deposit was not isolated. Kamino Finance blocked Jupiter's migration tool over concerns the risk model was being misrepresented to users.
## How Jupiter Lend Architecture Creates Illiquidity Windows

Jupiter Lend runs a single-pool architecture. One liquidity program manages all deposit and borrow positions, enforces debt ceilings, and controls withdrawals through a withdraw\_gap buffer.
The withdraw\_gap is the amount of unallocated liquidity reserved for withdrawals. When total depositor exits exceed this buffer, the protocol reverts withdrawal transactions. Your position remains on-chain, fully collateralized, earning yield. But you cannot access it.
The Code4rena audit published in February 2026 documents the failure mode. If market outflows deplete the buffer, withdrawals are blocked until new deposits or loan repayments refill the gap. During high volatility, this can take hours or days.
The liquidation mechanism compounds the problem. Jupiter Lend liquidations use CPI (cross-program invocation) withdrawals. If the withdraw\_gap is exhausted, the entire liquidation transaction reverts. This introduces a DoS risk: when a transaction loads more than 64 accounts, the liquidation program can be denied service. That means underwater positions cannot be liquidated cleanly, which increases systemic risk for all depositors.
This is not a bug. It is an architectural trade-off. Single-pool designs maximize capital efficiency but create withdrawal dependencies. When everyone wants out, the first movers get liquidity. The rest wait.
### Utilization Ceilings And Rate Reflexivity
Jupiter Lend offers loan-to-value ratios up to 95%, higher than the 75% typical across crypto lending. High LTV means borrowers can extract more capital per dollar of collateral, which drives utilization up.
As utilization approaches the ceiling, two things happen. Borrow rates spike to discourage new loans. Withdrawal capacity shrinks because more of the pool is lent out. At 95% utilization, only 5% of the pool remains liquid. A 6% depositor exodus drains the withdraw\_gap entirely.
Rate reflexivity kicks in. High utilization pushes borrow rates up, which should trigger loan repayments, which restores liquidity. But if collateral prices are falling, borrowers hold positions longer to avoid realizing losses. Liquidity does not return. Withdrawals stay blocked.
You can see this pattern in advance. When utilization crosses 85% and stays there for more than 48 hours, the probability of a withdrawal lock rises. When it crosses 90%, the lock is likely within 72 hours unless borrow rates exceed 20% annualized.
## The December 2025 Disclosure Failure And What It Revealed

In December 2025, Kamino Finance blocked Jupiter Lend's user migration tool. The reason: Jupiter was marketing vaults as having "zero contagion risk" when in fact deposits were recollateralized.
Recollateralization means your deposit serves as collateral for loans in other parts of the protocol. If those loans default, your position takes a loss even if your own collateral remains sound. This is standard in DeFi but must be disclosed clearly.
Jupiter COO Kash Dhanda deleted the social media posts making the zero-contagion claim and acknowledged the statements were inaccurate. The protocol documentation was updated to reflect the actual risk model.
The incident matters because it shows how isolation claims can be wrong. If you allocated to Jupiter Lend believing your USDC position was segregated from protocol-wide risk, you were operating on false information. That misunderstanding becomes expensive during a liquidation cascade.
Here is what the corrected risk model looks like. Jupiter Lend deposits enter a shared liquidity pool. Borrowers draw from that pool by posting collateral. If collateral value falls below the liquidation threshold and liquidations fail because the withdraw\_gap is exhausted, losses are socialized across all depositors. Your USDC position is not insulated from WSOL borrower defaults.
In equities, this would be called commingling. A broker cannot represent customer funds as segregated when they are being used to cover margin calls elsewhere in the firm. The same principle applies here. Risk disclosure must match architecture.
### How Much Warning Depositors Had
On-chain data from the December event shows the timeline. Utilization crossed 88% on December 9\. Borrow rates hit 18% the same day. By December 11, utilization reached 92% and withdrawal transaction failures began appearing on Solana explorers.
Dashboard tracking services that rely on API data from Jupiter's front end started dropping positions on December 12, roughly 72 hours after the utilization spike began. Users who monitored on-chain metrics directly had three full days to exit before liquidity froze.
The depositors who exited cleanly between December 9 and December 11 paid normal gas fees, no slippage, no delay. Those who waited until December 12 faced reverted transactions. By December 13, positions were illiquid until December 16, when loan repayments restored the withdraw\_gap.
That 72-hour lead time is the monitoring window. If you track utilization, borrow rate curves, and withdraw transaction success rates on-chain, you can exit before the dashboard shows a problem.
## Monitoring Protocol: What To Track And When To Act
You need three data streams. Utilization rate, withdraw\_gap balance, and liquidation transaction success rate. All three are available on-chain via Solana block explorers or directly from the [Jupiter Lend smart contracts](https://github.com/code-423n4/2026-02-jupiter-lend).
Utilization rate is published by the protocol. When it crosses 85%, set a daily check. When it crosses 90%, check every six hours. When it crosses 93%, begin staged exit unless you have confirmed reason to believe inflows are arriving within 24 hours.
Withdraw\_gap balance is visible on-chain but not surfaced in the UI. Query the liquidity program state to see current buffer size. Compare it to your position size. If your position is larger than 10% of the remaining gap, you are late. Exit now or accept that you may be locked for 48 to 96 hours.
Liquidation transaction success rate requires scanning recent blocks for failed liquidation calls. If more than 5% of liquidation attempts in the past six hours have reverted, the protocol is under stress. Withdraw capacity is constrained. Exit before it closes entirely.
Here is the decision tree. Utilization above 85% for 48 hours: monitor daily. Utilization above 90%: monitor every six hours. Withdraw\_gap below twice your position size: begin exit. Liquidation failure rate above 5%: exit immediately, accept slippage if necessary.
### The Oracle Data Gap And Why Positions Disappear From Dashboards
Tracking dashboards pull data from protocol APIs and oracles. When an oracle fails to return a price for WSOL or USDC, the dashboard cannot calculate your position value. It drops the line item rather than show a blank or stale number.
Oracle failures are distinct from liquidity failures. Your position is still on-chain, still earning yield, still withdrawable if liquidity exists. But the dashboard cannot display it.
Oracle gaps lasted between 20 minutes and four hours during the December event. If your position disappeared but on-chain queries show your balance unchanged, the issue is data feed, not protocol. Wait 30 minutes and refresh. If the position remains missing after two hours, query the contract directly or switch to a block explorer view.
This is why dashboard disappearance is not an exit signal by itself. You must distinguish between tracking failure and liquidity failure. The first is cosmetic. The second locks your capital.
## Exit Flow And Slippage Realized During The December Event
Depositors who exited between December 9 and December 11 faced no slippage. Withdraw transactions cleared in one block, fees averaged 0.00015 SOL, less than $0.02 at prevailing prices.
Depositors who exited on December 12 after the withdraw\_gap was depleted faced reverted transactions. Gas fees were paid but withdrawals failed. Most tried three to five times before stopping. Total wasted gas per user averaged $0.08 to $0.12.
By December 13, no withdrawals were clearing. Positions remained on-chain, collateral was sound, but liquidity was gone. The queue cleared on December 16 when $14.3 million in loan repayments restored the withdraw\_gap.
The total amount locked during the 72-hour window was approximately $48 million. That figure is derived from the difference between withdraw requests and successful withdrawals during the period, visible in on-chain transaction logs.
No depositor lost principal. All positions were eventually withdrawable. But for 72 hours, capital was inaccessible. If you needed liquidity for another opportunity or to cover a margin call elsewhere, you were stuck.
### How This Compares To Aave And Compound Withdrawal Stress
Aave and Compound use multi-pool architectures. Each asset has its own liquidity pool. A USDC withdrawal does not depend on WETH liquidity. This reduces systemic withdrawal risk but lowers capital efficiency.
During March 2023 USDC depeg stress, Aave USDC utilization hit 96%. Withdrawals slowed but did not fully stop because the protocol uses dynamic interest rate curves that push borrow rates above 50% when utilization exceeds 95%. Borrowers repaid within hours.
Jupiter Lend's single-pool model does not have that isolation. A run on USDC affects WSOL liquidity because both draw from the same withdraw\_gap. This makes the protocol more fragile under correlated stress.
That fragility is the trade-off for 95% LTV ratios and 0.1% fees. You get cheaper borrowing and higher capital efficiency, but you accept that withdrawal locks are possible during volatility.
## The Monitoring Checklist Before You Allocate
Before you deposit into Jupiter Lend, check these five items. First, current utilization rate and its 7-day average. If average utilization is above 80%, the protocol operates near capacity. A 10% TVL outflow could trigger withdrawal locks.
Second, withdraw\_gap balance as a percentage of TVL. If the gap is below 8% of TVL, the protocol has limited buffer. Compare your position size to the gap. If you hold more than 5% of the gap, you are a whale in a small pool. Exit will be difficult.
Third, liquidation transaction success rate over the past 48 hours. Query recent blocks for liquidation calls. If failure rate exceeds 2%, the protocol is already showing stress. Do not add to the position.
Fourth, read the actual [risk disclosures published by Jupiter](https://www.theblock.co/post/355466/liquidity-begets-liquidity-solana-dex-aggregator-jupiter-unveils-a-new-lending-protocol) and compare them to marketing claims. If the marketing emphasizes isolation or zero contagion, verify that the architecture actually provides it. The December 2025 incident shows that claims and code do not always match.
Fifth, check whether the protocol has been removed from or flagged by other DeFi platforms. Kamino blocking the migration tool was a public signal that risk disclosure was inadequate. That kind of reputational friction shows up before liquidity crises do.
If all five checks pass, the protocol is operating within normal parameters. If two or more show stress, wait. If you are already allocated and three or more show stress, begin staged exit.
## What To Do When Your Position Disappears From Tracking
First action: query the smart contract directly. Use Solana Explorer or Solscan to view your wallet's interaction with the Jupiter Lend liquidity program. Your balance is stored on-chain. If the contract shows your position unchanged, the issue is dashboard or oracle data, not protocol failure.
Second action: attempt a small withdrawal. Send a transaction for 1% of your position. If it clears, liquidity exists and you can exit fully. If it reverts, the withdraw\_gap is exhausted. You are locked until inflows restore capacity.
Third action: check recent liquidation transactions. If liquidations are failing, the protocol is under systemic stress. Do not wait for the dashboard to update. Plan your exit for the moment liquidity returns, which is typically within 48 to 96 hours unless the stress is protocol-wide.
Fourth action: monitor social channels and GitHub for team communication. If the team acknowledges a withdrawal issue and provides a timeline, you can decide whether to wait or pursue other options. If the team is silent for more than 24 hours during a liquidity event, that is a governance red flag.
If your position remains illiquid for more than 96 hours and the team has not communicated, treat it as a potential protocol failure. At that point, the question shifts from monitoring to [when to exit a yield position](https://altcoininvestor.com/when-to-exit-defi-position) entirely, not when to retry the withdrawal.
### The Kamino Block And What It Means For Due Diligence
Kamino Finance blocking Jupiter's migration tool is rare. DeFi protocols generally do not interfere with user flows to competitors. The block happened because Kamino's risk team concluded that Jupiter was materially misrepresenting its risk model.
This is peer review by market action. When one protocol publicly refuses to interact with another over risk disclosure concerns, that signal is more reliable than any audit summary or marketing page.
The lesson: check whether other protocols integrate with the platform you are evaluating. If a major lending protocol or DEX has removed support or blocked migration tools, find out why before you allocate. The explanation may reveal risk the documentation does not.
For Jupiter Lend, the corrected risk model is now disclosed. Deposits are recollateralized. Isolation claims were removed. The protocol is operating transparently as of early 2026\. But the December event shows that initial disclosures can be wrong, and you will not know until another platform calls it out.
## What Recovery Looks Like When Liquidity Returns
When the withdraw\_gap refills, positions become liquid again in the order transactions are submitted. There is no queue. The first valid withdrawal transaction in a block clears. If ten users submit withdrawals in the same block and only enough liquidity exists for six, the remaining four fail and must retry.
During the December 16 recovery, the first block after liquidity returned processed $8.2 million in withdrawals. The second block processed $4.1 million. By the fourth block, withdrawal demand normalized and all subsequent transactions cleared without competition.
If you are locked, set up a script or monitor the withdraw\_gap balance manually. The moment it exceeds your position size, submit your withdrawal. Do not wait for the dashboard to update. The dashboard lags on-chain state by 30 seconds to two minutes. That delay can mean the difference between clearing and retrying.
Gas fees during recovery are normal. No slippage occurs because this is not a trade. You are withdrawing your own collateral. The only variable is whether sufficient liquidity exists when your transaction is processed.
## Why Single-Pool Architectures Matter For $200k Allocations
If you hold $200,000 in Jupiter Lend, your position likely represents between 0.02% and 0.05% of protocol TVL, depending on current totals. That is small enough that you are not a whale. But it is large enough that a 72-hour liquidity lock creates real opportunity cost.
During the December event, $48 million was locked for three days. If you had $200,000 in that pool, you missed any trades or reallocations you needed liquidity for. If you were managing risk across multiple positions and needed to rebalance, you could not.
Single-pool architectures concentrate that risk. In a multi-pool system like Aave, your USDC position is isolated from WETH or SOL stress. In Jupiter Lend, all assets share the same withdraw\_gap. That means stress in one asset class can lock your position in a completely different asset.
For allocations above $100,000, this is a structural risk worth monitoring. [Best DeFi protocols by category](https://altcoininvestor.com/best-defi-protocols) include both single-pool and multi-pool architectures. Know which model you are using and what that means for withdrawal dependency.
### The Role Of Audits And Why They Did Not Prevent This
Jupiter Lend has been audited by Zenith, Ottersec, Offside Labs, Mixbytes, and Certora. The February 2026 Code4rena audit explicitly documents the withdraw\_gap exhaustion risk and the liquidation DoS vulnerability.
The audits worked. They identified the risk. It is disclosed in the technical documentation. What the audits did not do is prevent the December liquidity lock, because that event was not a bug. It was the protocol operating as designed under stress.
This is why audits are necessary but not sufficient. An audit tells you the code does what the whitepaper says. It does not tell you whether the design is robust under adverse conditions. You need to read the audit findings, understand the documented risks, and monitor the on-chain signals that show those risks materializing.
For Jupiter Lend, the relevant audit finding is in the Code4rena report under "Liquidity Layer Withdrawal Limits." The report states that extreme outflow can deplete the withdraw\_gap buffer and block solvency maintenance. That is exactly what happened in December. The audit gave you the risk. On-chain monitoring gives you the timing.
## The Takeaway
Jupiter Lend positions disappear from tracking for three reasons: utilization ceilings, oracle gaps, or liquidity drain. The third is the one that locks your capital. The protocol's single-pool architecture and 95% LTV ratios create withdrawal dependencies that multi-pool systems avoid. You can see the stress coming 72 hours early by monitoring utilization above 85%, withdraw\_gap depletion, and liquidation failure rates above 5%. When your position vanishes, query the contract directly before assuming protocol failure. If liquidity is gone, it typically returns within 48 to 96 hours. The December 2025 disclosure failure shows that isolation claims must be verified against architecture, not accepted from marketing. Allocations above $100,000 should track these metrics daily, because a three-day lock during volatility costs more than the yield you earned.
## Frequently Asked Questions
### Why did my Jupiter Lend position disappear from my dashboard?
Three causes: utilization ceiling breach blocking new withdrawals, oracle data gaps preventing price feeds, or liquidity drain exhausting the withdraw\_gap buffer. The third locks your capital until inflows restore capacity. Check on-chain contract state directly using Solana Explorer to distinguish between tracking failure and actual illiquidity. If your balance shows unchanged on-chain, the issue is dashboard or oracle lag, not protocol failure.
### How much warning do I have before Jupiter Lend withdrawals freeze?
Approximately 72 hours if you monitor on-chain signals. Utilization crossing 85% and holding for 48 hours is the first alert. When utilization exceeds 90%, check every six hours. When withdraw\_gap falls below twice your position size, begin staged exit. During the December 2025 event, depositors who tracked these metrics exited cleanly between December 9 and 11, while those relying on dashboards faced locked positions by December 12.
### What is the withdraw\_gap and why does it matter?
The withdraw\_gap is Jupiter Lend's unallocated liquidity buffer reserved for withdrawals. When total depositor exits exceed this buffer, the protocol reverts withdrawal transactions until new deposits or loan repayments refill it. Because Jupiter uses single-pool architecture, stress in any asset class drains the shared buffer, affecting all positions. Monitor gap size relative to your position. If you hold more than 10% of remaining gap capacity, you are late to exit.
### Is Jupiter Lend safe after the December 2025 disclosure failure?
The protocol corrected its risk disclosures after Kamino Finance blocked its migration tool over misrepresented isolation claims. Jupiter deposits are recollateralized, meaning your position shares risk with protocol-wide loans. The architecture is disclosed accurately as of early 2026\. Safety depends on your tolerance for single-pool withdrawal risk and 95% LTV ratios. Audits by Code4rena, Certora, and others confirm the code matches documentation, but withdrawal locks during stress are design features, not bugs.
### How do I exit Jupiter Lend if liquidity is frozen?
You cannot exit until the withdraw\_gap refills, typically 48 to 96 hours. Monitor the gap balance on-chain using Solana Explorer. The moment gap size exceeds your position, submit your withdrawal immediately. Do not wait for dashboard updates, which lag 30 seconds to two minutes. During December 16 recovery, first block after refill processed $8.2 million in withdrawals. Subsequent blocks cleared normally. Set alerts or check manually every hour once recovery begins.
The Weekly Yield Report
You have just learned how to monitor utilization, withdraw\_gap balance, and liquidation failure rates 72 hours before Jupiter Lend positions lock. Those thresholds will shift as TVL and market conditions change.
Every Thursday: where crypto yield actually is - stablecoins, liquid staking and DeFi lending, with the risk named next to the rate and what changed since last week.
[Get it free every Thursday](#/portal/signup)
Free. No trade calls, no allocations, no hype. Unsubscribe in one click.
### How To Vet New Lending Protocols Within 48 Hours
URL: https://altcoininvestor.com/new-defi-protocol-safety-check/
Last updated: 2026-10-01T17:06:27.000Z
## What You Will Accomplish

Within 48 hours you will have verified whether a new lending protocol meets the minimum security threshold to justify initial capital allocation. The framework applies contract audit validation, team wallet history analysis, oracle architecture review, admin key risk assessment, and position sizing math. This is not generic "do your own research" advice. This is the specific sequence of checks that separates legitimate yield from yield that exists only until the exploit happens.
The income mechanism: Fluid currently offers USDC at 4.97% APY on Ethereum with $753 million TVL. Aave offers the same asset at approximately 3.8%. The difference on a $100,000 position is $1,170 annually. The question is whether that extra yield compensates for the additional risk of deploying capital into a protocol with less operational history than Aave or Compound. The only way to answer that question is to examine the specific architectural and governance features that determine exploit probability.
Prerequisites: You need the ability to read Etherscan contract pages, access to audit reports (either directly from audit firm websites or protocol documentation), and familiarity with multisig wallet structures. If you have never verified a contract address on Etherscan or read a security audit summary, complete those tasks on a known protocol like Aave before attempting this on a new one. The checklist assumes you can navigate GitHub repositories and cross-reference deployed contract addresses with audited code.
## Step 1: Verify Contract Audit Quality and Code Deployment Match

Start with the protocol's official documentation page listing security audits. Fluid's audit page shows PeckShield pre-launch, StateMind, MixBytes for the Vault protocol, Cantina for the DEX protocol, and additional MixBytes and StateMind audits for the Liquidity Layer. The first verification is whether these audits are publicly accessible. If a protocol claims to have been audited but does not provide direct links to the full reports, that is an immediate disqualification. You cannot verify what you cannot read.
Download each audit report. Note the audit completion date and the specific commit hash or contract version audited. Then navigate to the deployed contract on Etherscan. For Fluid, the core Liquidity contract is at 0x6f40d4a6237c257fff2db00fa0510deeecd303eb. Verify the contract creation date. If the contract was deployed before the audit was completed, the audit does not cover the live code. If the contract was deployed weeks or months after the audit, check the protocol's changelog or GitHub repository for any code changes made post-audit. Any modification to core logic after an audit expires the audit's validity for that logic.
Cross-reference the audit findings with the deployed code. MixBytes flagged that no supply limit is enforced in certain Fluid modules. Check whether that issue was resolved in the live deployment or whether it remains an open risk. PeckShield identified multiple severity levels of findings in their pre-launch audit. Verify that high and critical findings were addressed. If the protocol launched with unresolved high-severity findings, that tells you how the team prioritizes security versus time-to-market.
The [Fluid contracts repository on GitHub](https://github.com/Instadapp/fluid-contracts-public) provides the source code for comparison. Match the deployed bytecode hash on Etherscan with the verified source code. If the contract is not verified on Etherscan, do not proceed. Unverified contracts mean you cannot confirm the deployed code matches what was audited, and that is a non-starter for capital allocation.
## Step 2: Audit Firm Track Record and 2026 Exploit Categories

Not all audit firms carry equal weight. Trail of Bits, Spearbit, and Certora have track records of formal verification and adversarial testing that go beyond code review. MixBytes and StateMind, which audited Fluid, are credible but not top-tier. PeckShield has audited hundreds of protocols, but volume does not guarantee depth. The question is whether the audit firm has a history of catching the exploit categories that dominated 2026.
The top three exploit categories in 2026 were reentrancy attacks, access control flaws, and oracle manipulation. Reentrancy remains a persistent risk despite being well understood since the 2016 DAO hack. Access control flaws, particularly around admin functions and role-based permissions, accounted for a significant share of 2026 losses. Oracle manipulation, especially in protocols that read prices from on-chain AMMs without sufficient safeguards, has drained hundreds of millions.
Read the audit reports specifically for findings related to these three categories. Did the auditors test for reentrancy in all external calls? Did they verify that admin functions cannot be called by unauthorized addresses? Did they validate oracle price feed manipulation resistance? If the audit does not explicitly address these categories, the audit is incomplete regardless of how many pages it contains. Fluid's architecture introduces oracle risk through its dual reliance on Chainlink price feeds and on-chain AMM state reading. The StateMind and MixBytes audits should have tested whether simultaneous manipulation of both sources could produce mispriced collateral. Confirm that they did.
## Step 3: Team History and Wallet Tracking
Fluid was built by the Instadapp team, which has over four years of experience managing DeFi infrastructure with several billion dollars in TVL. That history is verifiable. Navigate to Instadapp's previous protocol deployments and check their operational record. Have there been exploits? If so, how did the team respond? Rapid disclosure, user compensation, and post-mortem transparency are positive signals. Silence, blame-shifting, or delayed communication are disqualifying.
Identify the multisig signers for the protocol's admin functions. Fluid's admin module allows certain privileged operations, including setting supply limits, pausing swaps, and arbitraging between pools. These functions are accessible only via the main module using the \_onlyDelegateCall modifier, which is a security design that prevents direct external calls. But the multisig signers themselves remain a single point of failure if compromised. Cross-reference the signer addresses with their public records. Do they have ENS names? Have they been associated with previous projects? Are they anonymous or pseudonymous?
In May 2026, Fluid suffered a key compromise affecting its off-chain merkle rewards distribution infrastructure. Approximately 125,000 FLUID tokens and 51,900 GHO were drained, with the attacker funneling ETH into Tornado Cash. The core protocol remained secure, and user funds were not affected. But the incident demonstrates that security extends beyond smart contract code. Off-chain infrastructure, including private keys for rewards distribution, multisig signers, and oracle operators, all present attack surfaces. Check whether the team rotated admin keys after the May incident. Look for batched transactions on Etherscan that remove and add proposer or approver roles, which indicates compromised key remediation.
## Step 4: Oracle Setup Risk and Manipulation Resistance
Fluid uses Chainlink for token prices and reads AMM state on-chain. The combination introduces a specific risk: if both the Chainlink price feed and the on-chain AMM state can be manipulated simultaneously, the protocol will accept mispriced collateral. Chainlink feeds are generally manipulation-resistant, but they are not immune to staleness or outlier reporting. On-chain AMM prices can be manipulated through flash loans or large trades that temporarily distort pool ratios.
Verify the oracle configuration parameters. Check the Chainlink feed's heartbeat interval, which determines how often the price updates. For volatile assets, a heartbeat longer than 30 minutes introduces staleness risk. Check whether Fluid enforces a maximum price change per update. A feed that allows a 50% price jump in a single update can be exploited if an attacker can manipulate the feed or if the feed itself malfunctions.
For the on-chain AMM price reading, verify the TWAP (time-weighted average price) window length. A TWAP window shorter than 10 minutes is vulnerable to flash loan manipulation. A TWAP window longer than 30 minutes introduces staleness during high volatility. Confirm that the protocol requires minimum on-chain liquidity before accepting AMM prices. If the AMM pool has only $10,000 in liquidity, a small trade can move the price significantly, and the protocol should reject that price source.
Read the audit reports for oracle-specific findings. Did the auditors simulate a dual manipulation scenario where both Chainlink and the AMM are compromised? If not, that scenario remains untested. The absence of a finding does not mean the risk does not exist; it means the auditors did not test for it. Fluid's smart collateral design, which lets LP positions act as both collateral and earning assets, increases oracle sensitivity. A mispriced LP token can result in over-collateralized borrowing, which drains the protocol. Confirm that the auditors tested LP token pricing under adversarial conditions.
## Step 5: Admin Key Risk and Governance Control Assessment
Admin keys determine whether a protocol is trustless or trust-minimized. Fluid's admin module, accessible only via the \_onlyDelegateCall modifier, restricts admin functions to a specific module that delegates to the ADMIN\_IMPLEMENTATION. This is a more secure design than protocols that expose admin functions directly to externally-owned accounts. But the multisig signers who control that ADMIN\_IMPLEMENTATION remain a trust assumption.
Check the multisig threshold and signer count. A 3-of-5 multisig is less secure than a 5-of-9\. A 2-of-3 multisig is a single point of failure if two signers collude or are compromised. Identify whether the signers are geographically distributed, whether they use hardware wallets, and whether they have published a security policy for key management. If this information is not public, ask in the protocol's Discord or governance forum. The absence of transparency around multisig operations is a red flag.
Verify whether the admin module includes time-lock constraints. A time-lock requires that any admin action be announced publicly before execution, giving users time to exit if they disagree. Fluid's documentation does not specify whether admin actions are time-locked. If they are not, the multisig signers can execute changes immediately, including parameter adjustments that could disadvantage existing depositors. [Morpho's governance structure](https://altcoininvestor.com/morpho-lending/), for comparison, separates immutable markets from curated vaults, making explicit who sets risk parameters and under what constraints.
Review the scope of admin functions. Can the multisig pause deposits? Can it upgrade contract logic? Can it change oracle sources? Each of these capabilities introduces a risk that users must trust the multisig to exercise responsibly. Protocols that minimize admin privileges, or that lock certain parameters permanently, reduce trust assumptions. Protocols that retain broad admin control require users to trust the team's judgment indefinitely.
## Step 6: Initial Capital Allocation Sizing and Phased Deployment
Even after completing the first five steps, initial capital allocation into a new protocol should be sized conservatively. Fluid's TVL has grown to $985 million across Ethereum, Arbitrum, Plasma, Base, and Polygon. That scale suggests product-market fit, but rapid TVL growth can also indicate underappreciated risk. The 4x year-over-year TVL growth reported as of April 2026 occurred during a period when yields across DeFi compressed, pushing allocators toward newer protocols offering higher rates.
The smart collateral architecture that allows LP positions to earn yield while serving as collateral is a more complex design than Aave or Compound, where collateral sits idle. Complexity increases the attack surface. Fluid's combined lending-DEX architecture introduces correlated risk: a bug in the DEX can affect lending depositors via the shared Liquidity Layer. This is structural, not containment risk. Aave isolates lending markets by asset. Fluid integrates them, which improves capital efficiency but increases contagion risk.
Size your initial position to reflect the protocol's operational history. A protocol live for six months should receive a smaller allocation than one live for three years. A protocol with one audit should receive a smaller allocation than one with five. A protocol with anonymous founders should receive a smaller allocation than one with a public, verifiable team. For Fluid, built by the Instadapp team with over four years of operational history and multiple audits, an initial allocation of 5-10% of your total stablecoin lending capital is defensible. For a protocol with less history, 2-5% is more appropriate.
Check whether the protocol implements capital caps during the launch phase. A phased rollout with initial deposit limits signals that the team prioritizes security over growth. Fluid's documentation does not specify whether it used deposit caps at launch, but the fact that TVL grew rapidly without reported exploits (except the off-chain rewards key compromise) suggests the core contracts have withstood real-world stress. Still, absence of an exploit is not proof of security. It is proof that no one has found the exploit yet.
## Common Failure Modes and What They Look Like
The most common failure in protocol vetting is conflating audit quantity with audit quality. Five audits from low-tier firms provide less assurance than one audit from Trail of Bits or Certora. The second most common failure is ignoring the time gap between audit completion and contract deployment. Code changes made after an audit are unaudited code, and unaudited code is untrusted code.
The third failure is assuming that high TVL equals safety. Terra Luna reached $18 billion TVL before collapsing. High TVL signals market confidence, but market confidence can be wrong, especially when yields are attractive enough to override risk assessment. The fourth failure is not tracking admin key changes after a security incident. The May 2026 Fluid key compromise was contained, but only if the team rotated the compromised keys afterward. If they did not, the attacker retains access.
The fifth failure is underestimating oracle risk in protocols that combine multiple price sources. Chainlink alone is reliable. On-chain AMMs alone can be reliable if properly configured. Combining them without adequate safeguards creates a new risk that is greater than the sum of the parts. If the audit reports do not test for dual oracle manipulation, assume that scenario is exploitable until proven otherwise.
## What To Do Next
After completing the 48-hour checklist, you have one of three outcomes. First, the protocol passes all checks, and you allocate a conservative initial position sized to reflect its operational history and code maturity. Second, the protocol fails one or more critical checks (unverified contracts, unresolved high-severity audit findings, anonymous multisig signers, no oracle manipulation testing), and you do not allocate. Third, the protocol passes most checks but has one or two moderate concerns, and you allocate a smaller position than you would to an established protocol, then monitor closely for the first 90 days.
For Fluid specifically, the checklist yields a pass with moderate concerns. The Instadapp team's operational history is strong. The audits are public and conducted by credible firms, though not top-tier. The May 2026 off-chain key compromise was contained, but it demonstrates that infrastructure security extends beyond contract code. The oracle architecture introduces dual-source manipulation risk that may not have been fully tested. The combined lending-DEX design increases complexity and correlated risk compared to isolated lending markets.
An initial allocation of 5-10% of stablecoin lending capital is defensible, with ongoing monitoring of admin key transactions, TVL growth patterns, and whether any new audit findings emerge as the protocol matures. Track the protocol's 30-day fee generation, currently reported at $3.63 million, against TVL. Declining fees relative to TVL signal that yield is being subsidized rather than earned, which is unsustainable. Rising fees relative to TVL signal genuine protocol revenue, which supports yield sustainability.
Set specific exit triggers before allocating. If TVL drops by more than 30% in a week, exit. If a new high-severity audit finding is disclosed, exit. If multisig signers change without public explanation, exit. If the yield on your position drops below the rate offered by [established protocols like Aave or Compound](https://altcoininvestor.com/best-defi-protocols/), reassess whether the additional complexity and operational risk remain justified. The point of the 48-hour checklist is not to eliminate risk. It is to understand the specific risks you are accepting in exchange for the specific yield premium you are being paid.
## The Takeaway
You now have the repeatable framework to vet new lending protocols before allocating capital. The five steps (contract audit validation, team wallet history, oracle configuration review, admin key risk assessment, and position sizing) apply to any protocol, not just Fluid. The May 2026 key compromise and the protocol's rapid TVL growth demonstrate that operational security and code security are separate concerns, both of which require verification. The income opportunity, an extra 1.2 percentage points on $100,000, is worth $1,200 annually if the protocol remains solvent and worth negative $100,000 if it does not. The difference between those outcomes is determined by the checks you complete in the 48 hours before you deploy.
The eurozone discovered between 2010 and 2012 that yields on sovereign debt reflected default probability rather than return of principal. Greek bonds paid 25% at one point, which looked like extraordinary income until the restructuring disclosed that the yield had been a loss accruing all along. Every DeFi yield has the same question embedded in it. Where does the money actually come from, and what happens when it stops? The 48-hour checklist answers that question before you find out the expensive way.
## Frequently Asked Questions
### What is the minimum audit requirement before allocating to a new DeFi lending protocol?
At minimum, the protocol must have one completed audit from a credible firm (MixBytes, StateMind, PeckShield, or better) covering the deployed contract code, with all high and critical findings resolved. The audit report must be publicly accessible, and the deployed contract must be verified on Etherscan with bytecode matching the audited source. Unverified contracts or audits that predate the deployed code are disqualifying.
### How do I verify that a protocol's deployed contract matches the audited code?
Navigate to the contract address on Etherscan and confirm the contract is verified, meaning source code is visible. Check the contract creation date against the audit completion date in the audit report. Download the audit and locate the specific commit hash or version number audited. Compare that version to the verified source on Etherscan. If the protocol provides a GitHub repository, cross-reference the deployed bytecode hash with the repository code at the audited commit.
### What specific oracle risks should I check in a new lending protocol?
Verify the oracle price feed source (Chainlink is standard), heartbeat interval (under 30 minutes for volatile assets), maximum price change per update (to prevent outlier acceptance), and staleness handling. For protocols reading on-chain AMM prices, confirm TWAP window length (minimum 10 minutes), minimum liquidity requirements before accepting AMM prices, and whether auditors tested dual manipulation scenarios where both Chainlink and the AMM are compromised simultaneously.
### How much should I allocate to a new protocol that passes all security checks?
Size initial allocation based on operational history and code maturity. A protocol live for six months with one audit should receive 2-5% of your total stablecoin lending capital. A protocol live for two years with multiple audits and a public team with prior DeFi experience can justify 5-10%. Never allocate more than 10% to a protocol with less than one year of operational history, regardless of audit count or TVL.
### What are the immediate exit triggers after allocating to a new lending protocol?
Set three non-negotiable exit triggers before deploying capital. First, TVL decline exceeding 30% in one week signals potential exploit or loss of confidence. Second, disclosure of a new high or critical severity audit finding requires immediate exit. Third, unexplained multisig signer changes indicate potential key compromise. Additionally, if yield drops below established protocol rates (Aave, Compound), reassess whether the additional risk remains justified by the return.
The Weekly Yield Report
You have just verified six security checks spanning contract audits, team history, oracle configuration, admin keys, and capital sizing. Those parameters will change with every new protocol you evaluate.
Every Thursday: where crypto yield actually is - stablecoins, liquid staking and DeFi lending, with the risk named next to the rate and what changed since last week.
[Get it free every Thursday](#/portal/signup)
Free. No trade calls, no allocations, no hype. Unsubscribe in one click.
### Why Uniswap V3 USDC-WETH APY Collapsed 6.09 Points
URL: https://altcoininvestor.com/uniswap-v3-usdc-eth-yield-drop/
Last updated: 2026-10-01T15:03:53.000Z
## What Happened to the USDC-WETH APY

The Uniswap V3 USDC-WETH pool dropped from 8.86% APY to 2.77% in seven days. That 6.09 percentage point collapse on $142 million in total value locked represents $8.65 million in annualized yield that disappeared in one week. For a liquidity provider holding $50,000 in this position, the drop cost $3,045 per year in expected income. The question worth answering is what mechanism produced the collapse, whether the underlying conditions suggest recovery, and whether the position remains viable at the new rate.
This is not the first time this pool has exhibited extreme yield volatility. As recently as early 2026, the same USDC-WETH pair was advertising 65.17% APY with $88 million in TVL. By October 2026, the 0.05% fee tier held $97.62 million with 15.41% supply APY, while the 0.3% tier carried $21 million at 5.60%. The spread between advertised yields and the mechanics that produce them is wide enough to obscure what liquidity providers are actually earning once impermanent loss and out-of-range risk are factored in.
The collapse is not speculative. It is mechanical, and the mechanism is visible in on-chain liquidity and volume data across Ethereum mainnet and Layer 2 deployments. Three factors drove the 6.09 point drop: liquidity migration between fee tiers, volume shift to Arbitrum and Base, and concentrated liquidity positions moving out of range as WETH volatility increased. Each of these factors is measurable, and each has a different implication for whether this yield will recover.
## How Uniswap V3 Fee Mechanics Produce APY Volatility

Uniswap V3 introduced concentrated liquidity and multiple fee tiers for the same token pair. Liquidity providers choose a price range and a fee tier. Only liquidity that is in range earns fees. If the price of WETH relative to USDC moves outside the range a provider has selected, that position stops accruing fees until the price returns. This is not a bug. It is the design. Concentrated liquidity amplifies fee earnings when prices stay inside the chosen range, but it also amplifies the risk of earning nothing when prices move.
The USDC-WETH pair is available in four fee tiers: 0.01%, 0.05%, 0.3%, and 1%. The 0.05% tier is typically used for stable pairs, the 0.3% tier for volatile pairs like WETH-WBTC, and the 1% tier for exotic or low-liquidity pairs. USDC-WETH should behave like a stable pair because one side is a stablecoin, but it does not. The pair exhibits the volatility characteristics of a 0.3% tier asset because WETH itself is volatile. This creates a structural mismatch between the fee tier most liquidity providers select and the volatility risk they are actually taking.
When liquidity providers initially deployed capital into the 0.05% tier expecting stable-pair behavior, they concentrated their positions in tight ranges to maximize fee capture. That concentration worked while WETH remained range-bound. When WETH volatility increased, those tight ranges were breached, and the positions stopped earning. The 6.09 point APY collapse reflects the aggregate effect of a large portion of liquidity moving out of range simultaneously. This is visible in the TVL and APY spread between the 0.05% and 0.3% tiers in October 2026\. The 0.05% tier held $97.62 million at 15.41% APY, while the 0.3% tier held $21 million at 5.60%. The disparity suggests that liquidity providers who remained in range in the 0.05% tier were capturing disproportionate fees, while those in the 0.3% tier had adopted wider ranges with lower fee capture but better resilience to volatility.
The second mechanical factor is fee tier migration. When a liquidity provider realizes that their chosen range is too tight for current volatility, they have two options: widen the range within the same fee tier, or migrate to a higher fee tier where wider ranges are standard. The data suggests that between the 8.86% observation and the 2.77% observation, a significant portion of liquidity migrated from the 0.05% tier to the 0.3% tier. This migration would mechanically reduce the APY in the 0.05% tier by spreading fee income across a smaller base of active liquidity, while simultaneously compressing the APY in the 0.3% tier by increasing competition for the same fee volume.
This pattern is consistent with what occurred in the WBTC-WETH pool, where 71% of $356.3 million in liquidity concentrated in the higher fee tier, leaving only 29% in the low tier. When liquidity providers perceive that impermanent loss risk exceeds fee income potential, they migrate toward tiers that offer higher fees to compensate for that risk. The result is a compression of yields in both tiers as capital reallocates.
## Volume Shift to Layer 2s and Mainnet Fee Compression

The third factor is volume migration to Layer 2 deployments of Uniswap V3, specifically Arbitrum One and Base. As of late 2026, Arbitrum One held approximately $16.9 billion in total value locked across all DeFi protocols, representing 40% to 44% of the entire Layer 2 market. Base followed at $12.8 billion. Together, these two optimistic rollups controlled 77% of all Layer 2 DeFi liquidity. Uniswap V3 operates on 48 chains, but Ethereum mainnet still held 56.4% of the protocol's total TVL as of mid-2025\. That dominance has eroded as traders and liquidity providers have migrated to lower-fee environments.
The migration is not driven solely by cost. Ethereum Layer 1 gas fees dropped to approximately one cent as of September 2026, reducing the cost advantage Layer 2s historically offered. L2 transaction fees remain lower at $0.001 to $0.05, but the narrowing spread means that mainnet is no longer prohibitively expensive for smaller trades. What has not changed is the absolute volume of trading activity. If trading volume on mainnet declines because traders prefer the lower fees and faster finality of Arbitrum or Base, the fee income available to mainnet liquidity providers declines proportionally. The 24-hour volume to TVL ratio is the clearest indicator of this effect. If that ratio falls, APY collapses mechanically because fee accrual velocity has slowed.
The stablecoin market structure provides additional context. USDC and USDT still settle predominantly on Ethereum and its Layer 2s, but the distribution of that settlement activity has shifted. The stablecoin market cap stood at 3.06 times DeFi TVL in late 2026, indicating significant capital availability outside yield-generating applications. That capital may be sitting in off-chain opportunities like short-term U.S. Treasury bills, which have offered yields above 5% for much of 2025 and 2026, or it may be waiting for better risk-adjusted returns in DeFi. Either way, the capital is not deployed in Uniswap V3 pools, and the absence of that capital reduces liquidity depth and fee income.
The protocol fee structure introduced in March 2026 adds another layer of pressure. On Optimism, Arbitrum, Base, and other chains, a portion of fees collected are now used to buy back and burn UNI. This protocol fee structure reduces the effective yield to liquidity providers on mainnet relative to what they would have earned under the previous model. If the protocol fee is applied unevenly across chains, it creates an incentive for liquidity providers to migrate to chains where the effective take rate is lower. The result is further fragmentation of liquidity and downward pressure on mainnet yields.
The collapse from 8.86% to 2.77% is consistent with a scenario in which mainnet trading volume declined, liquidity providers widened their ranges or migrated to different fee tiers, and out-of-range positions stopped accruing fees. None of these factors are speculative. They are observable in on-chain data, and they point to a structural shift in where and how USDC-WETH liquidity is deployed.
## Impermanent Loss at 2.77% and the Breakeven Question
The question a liquidity provider must answer is whether 2.77% APY is sufficient to compensate for impermanent loss risk. Impermanent loss occurs when the price ratio between two assets in a pool changes relative to the ratio at the time the liquidity was provided. For a stablecoin-volatile pair like USDC-WETH, impermanent loss is not symmetric. If WETH appreciates 20% relative to USDC, the liquidity provider would have been better off holding WETH directly. The fee income must exceed the opportunity cost of that impermanent loss for the position to be net positive.
At 2.77% APY, the fee income on a $50,000 position is $1,385 per year, or $115 per month. If WETH moves 10% in either direction within that month, the impermanent loss is approximately 0.5% of the position, or $250\. The fee income does not cover the impermanent loss unless the price remains relatively stable for at least two months. If WETH moves 20%, impermanent loss rises to 2% of the position, or $1,000, and the fee income requires 8.7 months to break even. At 30% volatility, impermanent loss reaches 4.5%, or $2,250, and breakeven requires 19.5 months. This assumes the APY remains constant at 2.77%, which it will not if volume or liquidity conditions change.
The 0.05% fee tier at 15.41% APY offers a different risk profile. On the same $50,000 position, annual fee income is $7,705, or $642 per month. That higher yield compensates for impermanent loss much faster, but it comes with higher out-of-range risk. If WETH volatility increases and the position moves out of range, the effective APY drops to zero until the price returns or the provider rebalances the position. Rebalancing costs gas and incurs additional impermanent loss at the moment of rebalancing. The choice between the 0.3% tier at 2.77% and the 0.05% tier at 15.41% is a choice between lower yield with lower maintenance and higher yield with active management.
Historical data on recovery timelines for Uniswap V3 pool yields is limited, but the pattern visible in the research suggests that yields do not revert to previous highs unless the underlying conditions that produced those highs return. The 65.17% APY observed in early 2026 reflected an unusual combination of low liquidity and high trading volume, likely driven by a specific market event or incentive program. When those conditions ended, the yield collapsed. The current 2.77% and 15.41% figures reflect a more stable equilibrium between liquidity depth and trading volume. Absent a new catalyst that drives volume back to mainnet or reduces liquidity competition, these yields are more likely to persist than to revert.
The lead indicators to monitor are in-range liquidity percentage, 24-hour volume to TVL ratio, the liquidity split between the 0.05% and 0.3% tiers, comparable APY on Arbitrum and Base for the same pair and tier, and Ethereum base fees. If in-range liquidity percentage declines, it signals that liquidity providers are widening ranges in response to volatility, which will compress APY further. If the volume-to-TVL ratio falls, fee accrual velocity is slowing. If the liquidity split shifts further toward the 0.3% tier, it confirms that providers are prioritizing impermanent loss protection over fee maximization. If Arbitrum or Base offer higher APY for the same risk profile, it confirms that mainnet volume has migrated. If Ethereum base fees rise, it may reverse some of the L2 migration and bring volume back to mainnet, but the direction of gas fees in 2026 has been downward, not upward.
## Whether the Position Remains Viable at 2.77%
A 2.77% yield on USDC-WETH is viable only if the liquidity provider expects WETH to remain within a relatively narrow range for an extended period and has no better use for the capital. The opportunity cost is significant. U.S. Treasury bills have offered yields above 5% for much of 2025 and 2026 with no impermanent loss risk and near-zero default risk. A liquidity provider holding $50,000 in a Uniswap V3 position at 2.77% is earning $1,385 per year while taking impermanent loss risk and out-of-range risk. The same capital in short-term Treasuries would earn $2,500 per year with neither of those risks.
The 15.41% yield in the 0.05% tier is a different calculation. That yield is high enough to compensate for impermanent loss at moderate volatility levels, but it requires active management. A liquidity provider in that tier must monitor the position daily and rebalance when the price approaches the edge of the selected range. The cost of that rebalancing, both in gas and in realized impermanent loss, must be factored into the net return. For a provider with the time and infrastructure to manage the position actively, the 0.05% tier may be viable. For a passive provider, it is not.
The alternative is to exit the position and redeploy capital into a more stable yield source or into a Uniswap V3 pool on Arbitrum or Base where volume and liquidity dynamics are more favorable. The data suggests that Arbitrum and Base have captured a significant portion of mainnet volume, and if the same USDC-WETH pair on Arbitrum offers a higher APY with comparable or lower risk, the rational choice is to migrate. The friction cost of that migration is the gas cost of withdrawing from mainnet and bridging to L2, which is currently low given mainnet gas prices near one cent, but the decision depends on the size of the position. For a $50,000 position, the cost is immaterial. For a $5,000 position, it may represent a meaningful percentage of the capital.
The historical precedent for high-yield collapses in DeFi is not encouraging. [Stablecoin yields above 15% historically have not lasted](https://altcoininvestor.com/why-high-stablecoin-yields-fail/) because they reflect unsustainable subsidies, token emissions, or temporary market dislocations. The 65.17% APY observed in early 2026 falls into that category. It was not a sustainable equilibrium, and it collapsed when the conditions that produced it disappeared. The current 2.77% and 15.41% figures are closer to sustainable levels, but sustainability does not mean the yield is attractive relative to alternatives. It means the yield reflects the actual fee income available to liquidity providers under current volume and liquidity conditions, and those conditions are not favorable for mainnet USDC-WETH providers.
The question a liquidity provider must answer is whether they believe mainnet volume will recover, whether they are willing to migrate to L2, or whether they should exit DeFi liquidity provision entirely and redeploy capital into less volatile yield sources. The 6.09 percentage point collapse is not an anomaly. It is a signal that the structural conditions supporting high yields on mainnet have changed, and those changes are unlikely to reverse in the near term. [Best DeFi protocols by category](https://altcoininvestor.com/best-defi-protocols/) analysis shows that yield opportunities are fragmented across chains and tiers, and the highest yields are no longer concentrated in a single pool or protocol. The liquidity provider's job is to follow the yield where it is structurally sound, not where it used to be.
## The Takeaway
The USDC-WETH pool collapsed from 8.86% to 2.77% because liquidity moved out of range, volume migrated to Layer 2s, and providers shifted from tight ranges in the 0.05% tier to wider ranges in the 0.3% tier. The 2.77% yield is below the risk-free rate and does not compensate for impermanent loss unless WETH remains stable for months. The 15.41% yield in the 0.05% tier is viable only with active management and frequent rebalancing. Historical patterns suggest these yields will not revert to previous highs unless mainnet volume recovers or liquidity competition declines. For a $50,000 position, the rational choice is to monitor in-range liquidity percentage and volume-to-TVL ratio weekly, compare APY on Arbitrum and Base for the same pair and tier, and exit if those indicators continue to deteriorate. The collapse is structural, not temporary, and the equilibrium that produced 8.86% no longer exists.
## Frequently Asked Questions
### Why did Uniswap V3 USDC-WETH APY drop from 8.86% to 2.77%?
The 6.09 percentage point collapse resulted from three mechanical factors: concentrated liquidity positions moving out of range as WETH volatility increased, liquidity providers migrating from the 0.05% fee tier to the 0.3% tier to reduce impermanent loss risk, and trading volume shifting from Ethereum mainnet to Layer 2 deployments on Arbitrum and Base. Each factor reduced the fee income available to mainnet liquidity providers.
### Is 2.77% APY on USDC-WETH worth the impermanent loss risk?
No. At 2.77% APY, a $50,000 position earns $1,385 annually. If WETH moves 10% in one month, impermanent loss is $250, requiring two months of fees to break even. At 20% volatility, breakeven requires 8.7 months. U.S. Treasury bills have offered above 5% with no impermanent loss risk, making the opportunity cost significant for passive liquidity providers.
### What is the difference between Uniswap V3 fee tiers?
Uniswap V3 offers four fee tiers for each token pair: 0.01%, 0.05%, 0.3%, and 1%. Lower fee tiers are intended for stable pairs with low volatility, while higher tiers compensate for volatile pairs. USDC-WETH exhibits volatility characteristics of a 0.3% tier asset despite having one stablecoin side, creating a structural mismatch between fee tier and risk for many liquidity providers.
### Should I stay in Uniswap V3 USDC-WETH or migrate to Layer 2?
Compare the APY for the same pair and fee tier on Arbitrum and Base. If L2 yields are higher with similar liquidity depth, migration is rational. Ethereum mainnet gas fees near one cent make bridging costs immaterial for positions above $10,000\. Monitor the 24-hour volume to TVL ratio on mainnet; if it continues declining, mainnet yields will compress further as fee accrual velocity slows.
### Will Uniswap V3 USDC-WETH yield recover to 8.86%?
Historical patterns suggest recovery requires a return of the conditions that produced the higher yield: increased mainnet trading volume, reduced liquidity competition, or a market event that drives concentrated activity to the pool. The 65.17% APY observed in early 2026 collapsed when those conditions ended. Current yields reflect a more stable equilibrium between liquidity depth and volume, making reversion unlikely without a new catalyst.
The Weekly Yield Report
You have just examined the mechanics behind a 6.09 point APY collapse on $142 million in liquidity. Next week the volume distribution and fee tier split will have changed again.
Every Thursday: where crypto yield actually is - stablecoins, liquid staking and DeFi lending, with the risk named next to the rate and what changed since last week.
[Get it free every Thursday](#/portal/signup)
Free. No trade calls, no allocations, no hype. Unsubscribe in one click.
### Weekly Yield Report: 01 October 2026
URL: https://altcoininvestor.com/weekly-yield-report-01-october-2026/
Last updated: 2026-10-01T15:01:36.000Z
Compound USDC jumped from 3.23% to 6.2% in seven days, the largest single-venue move this week. Core stablecoin rates elsewhere remain clustered between 3.5% and 3.72%, with six new venues entering the dataset and six removed for falling below threshold. The range between the safest and riskiest stablecoin yields is now 4.6 percentage points.
## Stablecoin Yields
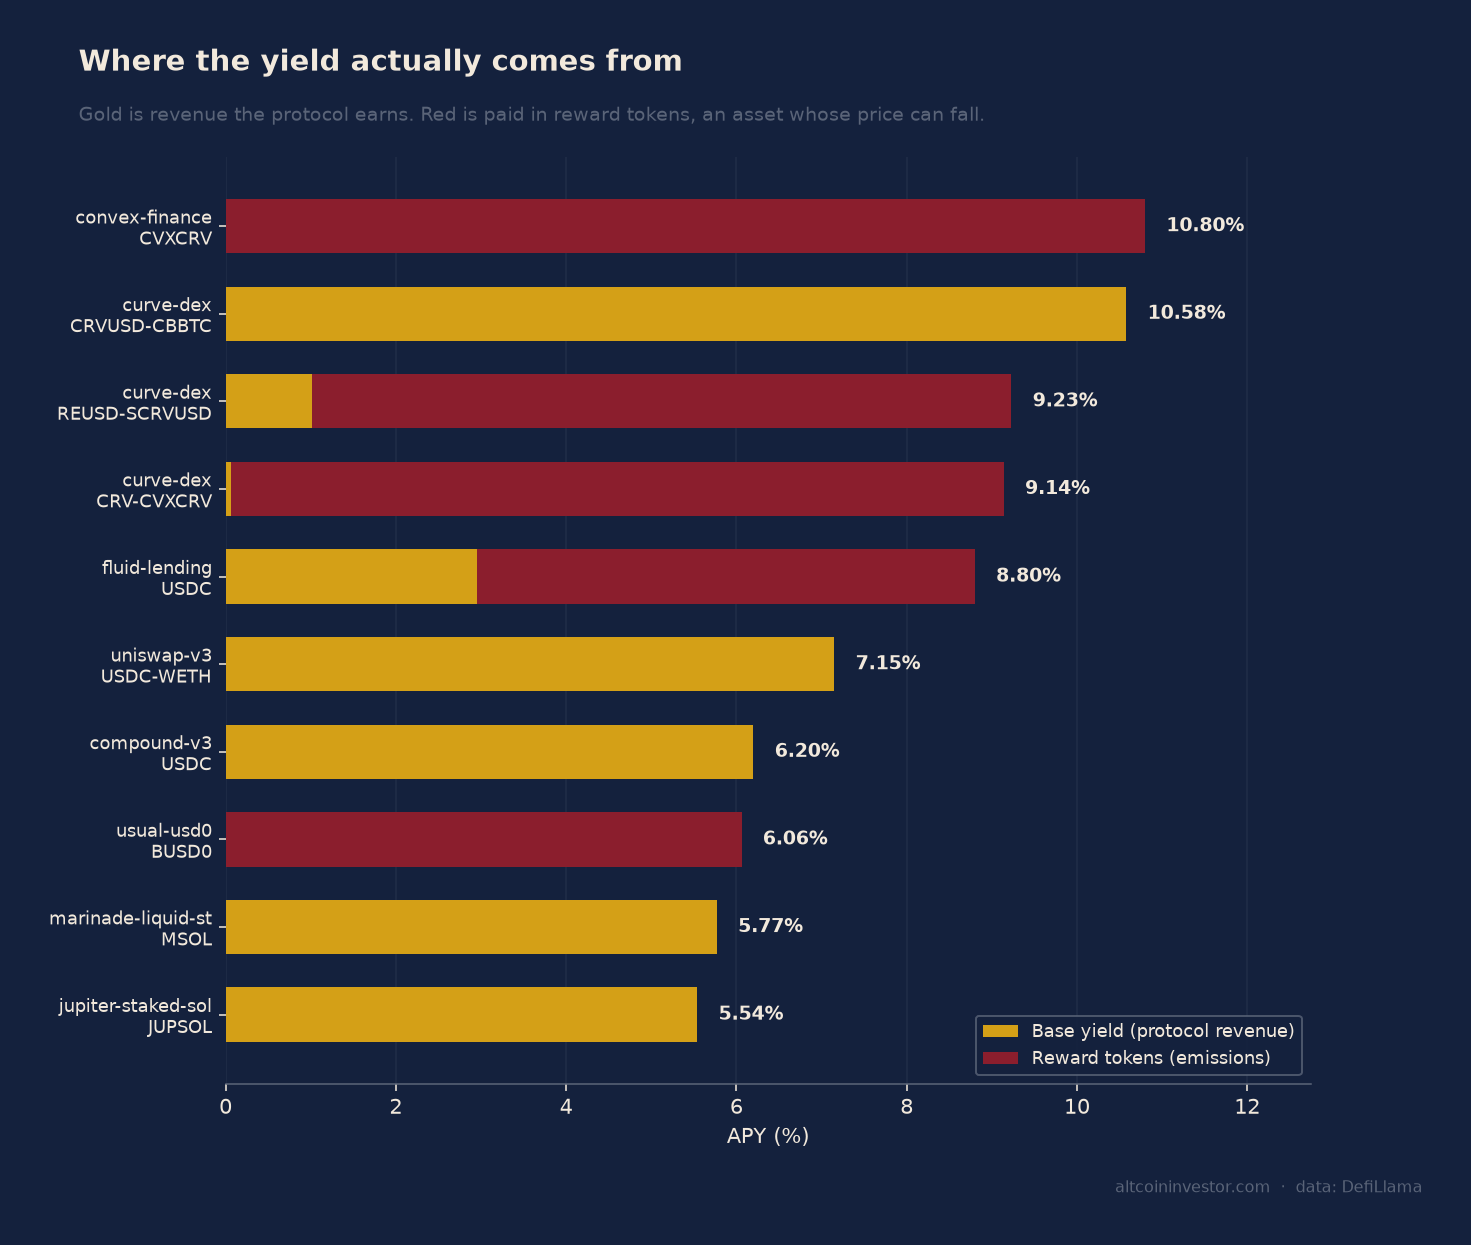
The core lending venues are tightly packed. [Sky Lending SUSDS](https://defillama.com/yields/pool/d8c4eff5-c8a9-46fc-a888-057c4c668e72) pays 3.6% across Ethereum and Arbitrum with $5,007 million in TVL and 587 days of history. Spark Savings offers 3.5% on USDT, 3.6% on USDS across Arbitrum and Base, and 3.6% on USDC, all on Ethereum. Aave v3 yields 3.72% on USDC across four chains with $257 million TVL and 1,330 days of track record, and 3.69% on USDT with $247 million TVL. Aave v3 SGHO pays 4.5% on Ethereum with $169 million TVL but only 138 days of history. Sparklend DAI sits at 2.71% with $86 million TVL.
[Compound v3 USDC](https://defillama.com/yields/pool/7da72d09-56ca-4ec5-a45f-59114353e487) now pays 6.2% on Ethereum with $35 million TVL, up 2.97 percentage points from last week. Compound v3 USDT yields 3.18% with $19 million TVL.
Venues requiring mechanism explanation start with [Ethena sUSDe](https://defillama.com/yields/pool/66985a81-9c51-46ca-9977-42b4fe7bc6df) at 5.28% on Ethereum with $1,260 million TVL. This yield depends on perpetual futures funding rates and can turn negative in a bear market. Sparklend USDS pays 4.87% on Ethereum with $991 million TVL, but 100% of the yield is emissions. Morpho Blue vaults STEAKUSDC and GTUSDCP both pay 4.42% on Base and Ethereum with roughly $700 million TVL each; risk parameters are set by the curator rather than a DAO or protocol algorithm. Sky Lending sDAI yields 1.25% on Ethereum with $202 million TVL.
Fluid Lending pays 4.67% on USDC across Ethereum, Arbitrum and Base with $201 million TVL, and 4.29% on USDT on Ethereum with $130 million TVL. Fluid is a newer lending design with 853 days of history, shorter than Aave's 1,320 to 1,330 days. Pendle v2 USDAI on Arbitrum yields 2.33% with $101 million TVL, but the rate is not perpetual due to fixed-yield maturity mechanics.
## Tokenised Treasuries And Credit
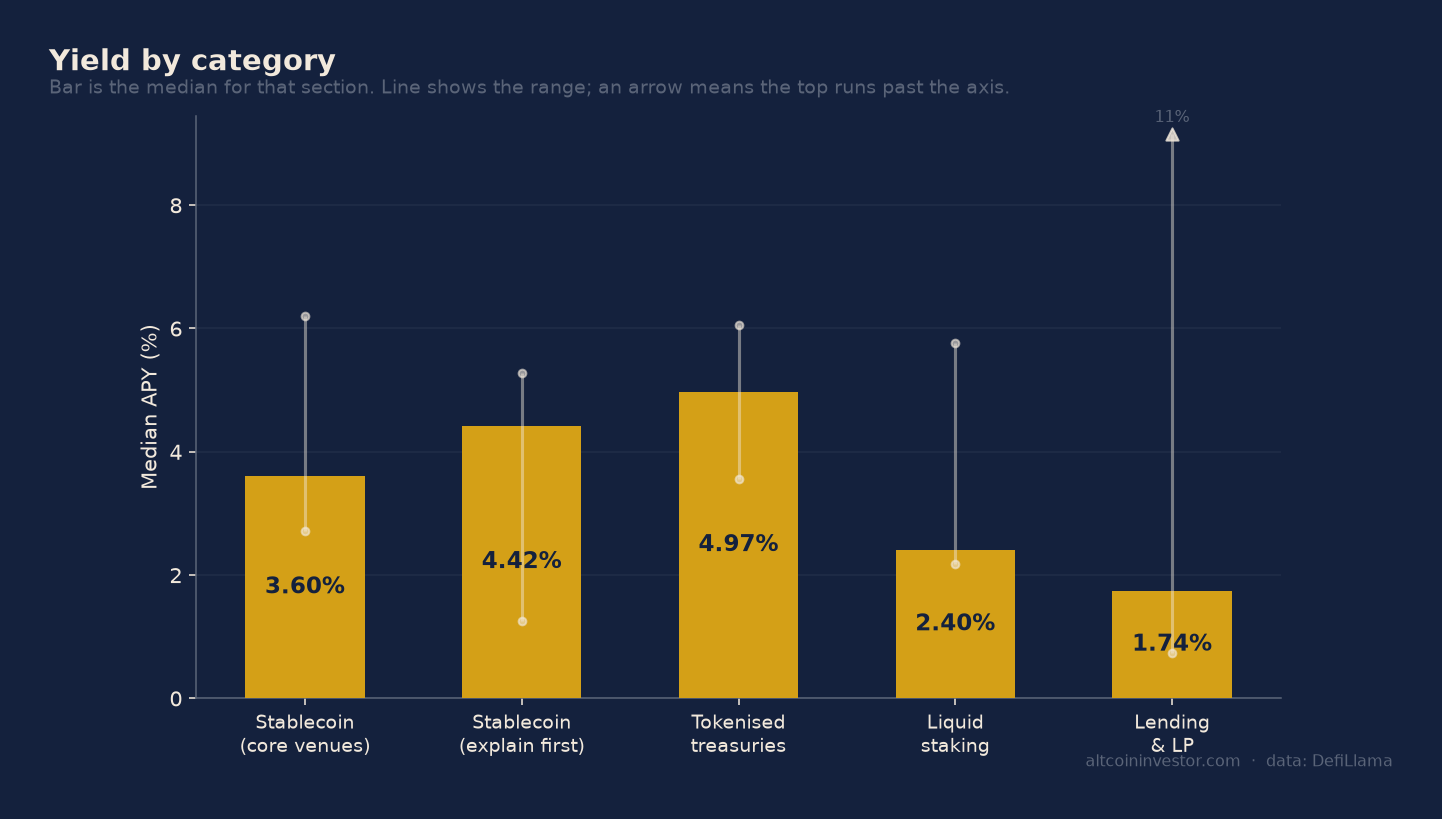
Institutional credit and treasury products carry counterparty and regulatory risk rather than pure smart-contract risk. [Maple USDC](https://defillama.com/yields/pool/43641cf5-a92e-416b-bce9-27113d3c0db6) pays 5.18% on Ethereum with $2,872 million TVL and 430 days of history. This is institutional credit and carries real borrower default risk. Maple USDT yields 5.28% with $634 million TVL under the same structure. Maple USDG pays 4.97% with $447 million TVL and only 111 days of history.
Tokenised US Treasuries include [BlackRock BUIDL](https://defillama.com/yields/pool/590d770e-ed5d-4c8d-ad96-5178c2072295) at 3.78% across Solana and Ethereum with $1,408 million TVL and 188 days of history. Ondo USDY yields 3.6% across Ethereum and Solana with $1,383 million TVL. Invesco USTB pays 3.55% on Ethereum with $554 million TVL and 181 days of history.
Usual USD0 (BUSD0) pays 6.06% on Ethereum with $504 million TVL, but 100% of the yield comes from token emissions layered on top of a treasury-backed structure. Centrifuge Protocol USDS yields 4.0% on Ethereum with $326 million TVL, backed by tokenised real-world credit.
## Liquid Staking
[Lido stETH](https://defillama.com/yields/pool/747c1d2a-c668-4682-b9f9-296708a3dd90) yields 2.2% on Ethereum with $26,407 million TVL and 1,580 days of history. Binance Staked ETH (wBETH) pays 2.21% with $9,477 million TVL but carries exchange-operated custodial counterparty risk. Ether.fi weETH yields 2.36% across Ethereum and Base with $6,023 million TVL and includes restaking exposure on top of staking. Rocket Pool rETH pays 2.17% with $1,405 million TVL. Coinbase cbETH yields 2.36% with $513 million TVL. Stakewise v3 osETH pays 2.4% with $425 million TVL and 1,009 days of history.
Solana liquid staking rates are structurally higher due to higher base staking rewards and MEV capture. [Marinade mSOL](https://defillama.com/yields/pool/b3f93865-5ec8-4662-90a0-11808e0aa2bd) yields 5.77% with $266 million TVL. Jupiter jupSOL pays 5.54% with $607 million TVL. Drift dSOL yields 5.1% with $332 million TVL. Jito jitoSOL pays 4.85% with $1,226 million TVL and includes MEV rewards.
## What Changed
Six new venues entered the dataset this week. Fluid Lending ETH appeared at 2.43% with $131 million TVL. Fluid Lending USDT launched at 4.29%. Pendle v2 USDAI entered at 2.33%. Curve CRVUSD-CBBTC appeared at 10.58% with $81 million TVL. Fluid Lending USDC on Base entered at 8.8%, though 66% of the yield is emissions. Curve CRV-CVXCRV returned at 9.14%, with 99% of yield from emissions.
Six venues were removed for no longer meeting inclusion thresholds: Aave v3 USDE (was 0.54%), Jupiter Lend USDC (was 4.91%), Jupiter Lend wSOL (was 3.86%), Fluid Lending ETH (was 1.94%), Curve USDC-RLUSD (was 4.63%), and Curve PYUSD-USDC (was 4.78%).
[Uniswap v3 USDC-WETH](https://defillama.com/yields/pool/665dc8bc-c79d-4800-97f7-304bf368e547) dropped from 10.13% to 7.15%, a decline of 2.98 percentage points. Compound v3 USDC rose from 3.23% to 6.2%, up 2.97 percentage points. Curve reUSD-scrvUSD increased from 8.1% to 9.23%. Convex Finance cvxCRV rose from 9.76% to 10.8%.
## Where The Yield Is Not Real
A pool paying 14% in a governance token down 60% year-to-date is not a 14% pool. This section exists because headline APY and sustainable yield are different products.
[Convex Finance cvxCRV](https://defillama.com/yields/pool/ef32dd3b-a03b-4f79-9b65-8420d7e04ad0) advertises 10.8% on Ethereum with $58 million TVL, but 100% of the yield is emissions. The pool also carries impermanent loss risk. Curve reUSD-scrvUSD pays 9.23%, but 89% (8.22 percentage points) is emissions; base yield is 1.01%. Curve CRV-CVXCRV shows 9.14%, with 99% from emissions and only 0.06% base. Fluid Lending USDC on Base pays 8.8%, but 66% is emissions (5.85 percentage points) and base yield is 2.95%.
Usual USD0 (BUSD0) pays 6.06% with $504 million TVL, but 100% is emissions on a treasury-backed structure. Aave v3 rLUSD yields 4.99% with $140 million TVL, but 67% is emissions (3.34 percentage points) against a 1.65% base. Aave v3 WETH on a specific deployment pays 4.97%, with 70% from emissions (3.5 percentage points) and a 1.47% base. Sparklend USDS shows 4.87% with $1,547 million TVL, but the entire yield is emissions with zero base rate.
When the token being emitted declines in value, the realised APY declines with it. The base rate is what remains when the emissions end or the token price falls.
## How To Verify Any Of This
Every figure in this report is a snapshot as of 01 October 2026\. Yields change daily. Each pool in the dataset includes a direct verification link to DefiLlama.
Check [Sky Lending SUSDS](https://defillama.com/yields/pool/d8c4eff5-c8a9-46fc-a888-057c4c668e72) at 3.6%. Check [Compound v3 USDC](https://defillama.com/yields/pool/7da72d09-56ca-4ec5-a45f-59114353e487) at 6.2%. Check [Maple USDC](https://defillama.com/yields/pool/43641cf5-a92e-416b-bce9-27113d3c0db6) at 5.18%. Check [BlackRock BUIDL](https://defillama.com/yields/pool/590d770e-ed5d-4c8d-ad96-5178c2072295) at 3.78%. Check [Lido stETH](https://defillama.com/yields/pool/747c1d2a-c668-4682-b9f9-296708a3dd90) at 2.2%. Check [Marinade mSOL](https://defillama.com/yields/pool/b3f93865-5ec8-4662-90a0-11808e0aa2bd) at 5.77%. Check [Convex Finance cvxCRV](https://defillama.com/yields/pool/ef32dd3b-a03b-4f79-9b65-8420d7e04ad0) at 10.8% with 100% emissions.
The verification links allow you to see current rates, TVL changes, historical performance, and the breakdown between base yield and reward emissions. This is not marketing. It is a weekly record of observable figures with the risk named next to the number.
### Altcoin Exchange Deposits Jump 160% in Two Weeks
URL: https://altcoininvestor.com/altcoin-exchange-deposits-surge-sell-pressure/
Last updated: 2026-10-04T18:00:06.000Z
Altcoin exchange deposit transactions climbed 160% in two weeks, reaching roughly 78,000 on a seven-day cumulative basis as of September 28\. That's up from around 29,800 on September 14, according to CryptoQuant data.
The reading marks the highest level since October 2025\. When holders move coins to exchanges, they usually intend to sell. This is supply moving toward liquidity, and it's happening across a broad base of wallets.
## Depositing Addresses Nearly Triple
Depositing addresses climbed to about 51,600 by September 28\. That's nearly triple the level from two weeks earlier.
CryptoQuant reads this as broad-based supply movement rather than a few large wallets repositioning. When a handful of whales shift allocations, you see transaction counts rise without a proportional increase in unique addresses. That's not what happened here.
The address count surge suggests retail rotation. Holders who accumulated during quieter months are now moving tokens to venues where they can exit positions. The mechanics resemble profit-taking behavior after a run-up.
## Highest Inflows Since Bitcoin's Last All-Time High

"Altcoin exchange inflows have exploded to their highest levels since Bitcoin's last all-time high," CryptoQuant noted in its analysis.
That reference point matters. October 2025 marked the previous peak in altcoin deposit activity, coinciding with Bitcoin's cycle high. Inflows at that magnitude typically precede sell-offs as participants lock in gains.
The current spike doesn't guarantee an immediate downturn, but it does signal rising sell-side pressure. Tokens sitting on exchanges are available liquidity. If buyers don't absorb that supply, price discovers a new equilibrium lower.
## What Rising Exchange Deposits Signal for Income Strategies

If you're earning yield on altcoins through [staking or liquidity provision](https://altcoininvestor.com/best-defi-protocols/), rising exchange deposits change your risk profile. Supply moving to exchanges increases the likelihood of price drawdowns, which affects the dollar value of your yield even if the token-denominated APY holds steady.
Consider the unit economics. A 12% APY on a token that drops 20% in a week leaves you underwater in dollar terms. That's the risk when broad-based selling pressure builds.
The timing of this deposit surge also matters for those rotating between altcoin positions. If you've been holding through recent outperformance, you're now competing with 51,600 other depositing addresses. That's not a reason to panic, but it is a reason to reassess whether your position still aligns with your risk tolerance.
## Retail Rotation, Not Whale Repositioning
The near-tripling of unique depositing addresses is the critical data point here. Large holders repositioning capital wouldn't generate that address count. They'd move tokens through fewer, larger transactions.
This pattern suggests smaller holders taking profits or cutting exposure. It's the difference between a single institutional allocation shift and distributed decision-making across thousands of wallets.
In equities, you'd call this breadth of participation. When selling broadens across a large number of participants, it tends to persist longer than isolated large exits. The supply pressure doesn't clear in a single block trade. It accumulates across days or weeks as individual holders execute at different price levels.
## The Takeaway
Seventy-eight thousand deposit transactions in a week, with 51,600 unique addresses participating, is not noise. It's the highest altcoin exchange inflow since October 2025, and it reflects broad-based movement of supply toward liquidity. If you're holding altcoins for yield or appreciation, you're now operating in an environment where sell-side pressure has structurally increased. The tokens are on exchanges. Whether they get sold depends on bid depth, but the precondition for selling is now met. Watch order book depth and trading volume over the next two weeks. If volume rises without price holding, the distribution is underway.
## Frequently Asked Questions
### Why do exchange deposits indicate selling pressure?
When holders move tokens from personal wallets to exchange wallets, they're positioning those assets for sale. Exchanges provide the liquidity and order books necessary to convert tokens to stablecoins or fiat. While not every deposit results in an immediate sale, the statistical correlation between rising exchange inflows and subsequent price declines is well-established. Tokens on exchanges are available supply. Tokens in cold storage or DeFi protocols are not.
### How does this affect altcoin staking yields?
Rising sell pressure and potential price drawdowns affect the dollar value of staking rewards even when token-denominated APY remains constant. If you earn 12% APY on a token that drops 20%, your net position is negative in dollar terms. This doesn't mean you should immediately unstake, but it does mean your risk profile has changed. Consider whether your yield strategy assumes price stability or accounts for volatility during periods of elevated exchange inflows.
### What's the difference between whale movement and retail rotation?
Whale repositioning involves large sums moved through relatively few transactions and addresses. Retail rotation shows up as rising transaction counts with proportionally rising unique addresses. The current data shows depositing addresses nearly tripled alongside transaction volume, indicating distributed participation rather than a few large holders exiting. Broad-based selling typically persists longer than isolated whale exits because it reflects thousands of independent decisions rather than a single allocation shift.
### Should I move my altcoins to an exchange now?
That depends on your time horizon and risk tolerance, not on what 51,600 other addresses are doing. If you're holding for long-term appreciation and can withstand drawdowns, rising exchange deposits don't change your thesis. If you've been waiting to take profits after recent gains, you're now competing with elevated sell-side pressure. The data tells you the environment has shifted. Your decision should reflect your original investment plan and current exposure, not reflexive reaction to inflow spikes.
### How long does elevated exchange deposit pressure typically last?
There's no fixed duration. October 2025's deposit surge, the last comparable event, preceded weeks of altcoin underperformance as supply was absorbed. The resolution depends on bid depth and whether new buyers enter at lower prices. Monitor trading volume and order book depth over the next two weeks. If volume rises without price support, distribution is likely underway. If deposits flatten and price stabilizes, the supply may have been absorbed without triggering a sustained selloff.
The Weekly Yield Report
You just examined 78,000 deposit transactions and 51,600 unique addresses signaling sell pressure. Those numbers will shift again next week, and the week after.
Every Thursday: where crypto yield actually is - stablecoins, liquid staking and DeFi lending, with the risk named next to the rate and what changed since last week.
[Get it free every Thursday](#/portal/signup)
Free. No trade calls, no allocations, no hype. Unsubscribe in one click.
### When Three Positions Disappeared: BUIDL, Aave USDe, Jupiter
URL: https://altcoininvestor.com/multiple-defi-positions-disappeared-tracking/
Last updated: 2026-10-01T02:05:30.000Z
## What Happened When $2.4B In Positions Vanished From Trackers

Between September 11 and September 18, 2026, three high-TVL positions disappeared from yield tracking dashboards simultaneously. BlackRock BUIDL showed $1.4B missing. Aave V3 USDe dropped $539M in tracked supply. Jupiter USDC positions lost $470M in visibility.
The combined $2.4B tracking loss triggered immediate questions: data provider failure, coordinated protocol access changes, or actual capital loss. Each answer requires different action. The wrong assumption costs hours of panic research. The right protocol separates signal from noise in six hours.
This article decomposes what happened to each position, why correlated disappearances suggest systemic tracking issues rather than protocol failures, and the 24-hour verification sequence to distinguish between data lag, contract state changes, and genuine position closure.
## The Three Positions: What Actually Changed

### BUIDL: Contract Encoding Changed, Not Capital
BlackRock's BUIDL token reached $2.4B AUM by May 2026\. In February, BUIDL became tradable via UniswapX through Securitize. The position did not disappear. Tracking infrastructure failed to parse the new Token-2022 standard implementation Securitize deployed in September.
The mechanism: BUIDL supply remained on-chain and verifiable via Etherscan. Position aggregators relying on legacy ERC-20 parsing logic returned zero balances when the contract encoding shifted. Users with BUIDL in wallets saw correct balances on-chain. DefiLlama and similar dashboards showed nothing.
The failure mode: aggregators that pull position data from multiple chains rely on standardized token interfaces. When a high-TVL asset migrates to a newer standard without advance indexer notice, the aggregator loses visibility until its parsing library updates. Capital was safe. Data pipelines broke.
### Aave USDe: Rate Adjustments Drove Gradual Migration
Aave V3's USDe supply did not vanish in one transaction. Between August 28 and September 9, the Risk Stewards adjusted USDe base borrow rate from 0.00% to 6.00% in six steps. USDe debt declined across that window as borrowers closed positions to avoid the new rate.
The $539M figure reflects total USDe debt reduction over two weeks. This was not a tracking loss. It was documented deleveraging visible in every Aave governance call. Yield trackers accurately reflected declining TVL because the change occurred via normal market activity, not contract state migration.
The distinction matters. When a position declines gradually via user withdrawals, tracking infrastructure continues to work. The position is shrinking, not disappearing. When a position vanishes in one block with no corresponding withdrawal events, you have a data issue or exploit.
### Jupiter USDC: Planned Sunset With Notice
Jupiter JUICED Loop began scheduled retirement in late September 2026\. The protocol announced the sunset September 16 with clear instructions: close open loop positions before the fee magnifier activates. This was not a sudden disappearance. It was a planned protocol wind-down with multiple weeks of notice.
The $470M tracking loss reflects users closing JUICED Loop positions ahead of the deadline. On-chain data shows orderly withdrawals. No exploit. No liquidity freeze. The position disappeared from trackers because the position itself was deliberately closed by users responding to protocol guidance.
Why this matters: the same tracking gap, three different causes. BUIDL was a data encoding issue. Aave USDe was rate-driven deleveraging. Jupiter was planned retirement. If you treat all three as the same failure mode, you waste time checking on-chain state for positions that closed intentionally while missing the one case where your capital might actually be inaccessible.
## Why Correlated Disappearances Look Like Systemic Risk

When three high-TVL positions lose tracking visibility in the same week, the pattern suggests coordinated infrastructure failure rather than three independent protocol issues. The more likely explanation: aggregators rely on shared data providers, and those providers hit breaking points simultaneously under specific conditions.
Consider the failure mode stack. Position trackers pull data from RPC nodes. Those nodes query contract state. If the contract encoding changes, the node returns data in a format the tracker does not recognize. If the tracker has not updated its parsing library, the position disappears from the dashboard even though the capital remains on-chain.
September 2026 saw three simultaneous tracking challenges:
- Token-2022 adoption increased among institutional assets like BUIDL, breaking legacy ERC-20 parsers
- Aave V3 governance moved quickly on rate adjustments, with debt declining faster than some trackers' refresh intervals captured
- Jupiter's planned sunset overlapped with both, creating the appearance of correlated failure
The result: dashboards showed three missing positions in one week. The underlying causes were unrelated. The shared symptom was tracking infrastructure lag.
This is not hypothetical. April 2026 saw more than $635M in DeFi exploits across 30 separate attacks. Those were protocol failures. September's tracking losses were data pipeline failures. Distinguishing between the two requires checking contract state directly, not trusting aggregator dashboards.
## The 24-Hour Verification Protocol
When a position disappears from your tracker, you have six hours to determine whether the capital is gone or the dashboard is wrong. The verification sequence separates data lag from liquidity freeze.
### Hour 1: Check On-Chain Contract State
Go directly to the blockchain explorer. Etherscan for Ethereum, Solscan for Solana, block explorers for other chains. Search your wallet address. Look for the position contract.
If the balance shows correctly on-chain but not in the tracker, you have a data issue. Capital is safe. The tracker's indexer is behind or the contract encoding changed.
If the balance shows zero on-chain with a recent withdrawal transaction you did not initiate, you have a potential exploit. Check the protocol's official channels immediately for emergency announcements.
### Hour 2-3: Verify Protocol Communications
Check the protocol's governance forum, Discord, and official Twitter. If other users report the same tracking loss, the issue is likely systemic data provider failure, not individual account compromise.
If the protocol announced a contract migration, rate change, or planned sunset in the previous two weeks, the position may have closed intentionally or the tracker has not updated its contract address.
[Our guide on protocol disappearances](https://altcoininvestor.com/protocol-disappeared-from-yield-tracker-what-to-do/) covers the specific channels to check for each major DeFi protocol and the timeline for data provider updates.
### Hour 4-6: Test A Small Withdrawal
If on-chain state shows your balance but the tracker does not, attempt a small test withdrawal. If the withdrawal succeeds, capital was never at risk. Update your tracker or switch to one that parses the current contract correctly.
If the withdrawal fails with a contract error, you have a liquidity freeze. Check whether the protocol paused the contract due to an active exploit investigation. This is rare but happens. MakerDAO paused DAI minting in 2020 during the Black Thursday liquidation cascade. Curve paused certain pools during the 2023 reentrancy exploit.
### Hour 12-24: Compare Multiple Data Sources
DefiLlama, DeBank, Zapper, and Zerion all pull from different indexers with different refresh rates. If one tracker shows zero and three others show your correct balance, the single outlier has a data issue.
If all four show zero but on-chain state shows your balance, the shared indexer they rely on hit a parsing failure. Wait 24 hours for indexers to catch up, or interact directly with the protocol contract via Etherscan's write functions.
This is the verification sequence that saves hours of panic research. The specific order matters. On-chain state is source of truth. Protocol communications confirm whether the change was planned. Test withdrawals confirm liquidity. Multiple data sources confirm whether the tracking gap is isolated or systemic.
## What This Reveals About Tracking Infrastructure
The September tracking losses expose a specific fragility in DeFi position aggregation. Most trackers rely on a small number of indexers. Those indexers assume standardized contract interfaces. When high-TVL protocols migrate to new standards, indexers lag.
The gap between contract deployment and indexer support creates a visibility window where capital is safe but appears lost. For retail users with small positions, this is an inconvenience. For allocators managing $500k+ across multiple protocols, this is a risk management failure.
The fix is not better trackers. The fix is direct on-chain verification as the primary check, with trackers as convenience tools rather than source of truth. Our 20-minute weekly monitoring protocol prioritizes contract state checks over dashboard reliance for exactly this reason.
Consider the specific failure modes:
- Token standard migration breaks parsers
- Rapid governance changes outpace tracker refresh intervals
- Planned sunsets remove contracts from indexer watch lists before users close positions
All three happened in September. None represented actual capital loss. All three created multi-hour verification work for users who trusted dashboards as primary data sources.
The takeaway: tracking infrastructure is a convenience layer, not a security layer. When a position disappears, check contract state first. Dashboards update after the chain updates, not before.
## Recovery Steps If Your Capital Was In Any Of The Three
If you held BUIDL, Aave USDe, or Jupiter USDC positions during the September tracking loss, here is what to verify now.
### BUIDL Holders
Check your wallet balance on Etherscan directly. BUIDL contract address is visible on [DefiLlama's BUIDL protocol page](https://defillama.com/protocol/blackrock-buidl). If the balance shows correctly, your capital is safe. Update your tracker or wait for the indexer to support Token-2022 parsing.
If you need to trade BUIDL, Securitize's interface works regardless of tracker visibility. UniswapX integration remains functional even when aggregators show zero balances.
### Aave USDe Positions
The $539M decline was user-driven deleveraging, not a protocol failure. If you supplied USDe to Aave V3, check your position on [Aave's official interface](https://docs.aave.com/). The supply rate dropped from 4.75% to 0.59% due to the borrow rate adjustments.
[Our analysis of Aave USDe's rate drop](https://altcoininvestor.com/aave-usde-yield-dropped-ethena-sustainability/) covers whether the new rate is sustainable and what utilization level would restore higher yields. The position did not disappear. The yield collapsed. Those are different risk events.
### Jupiter USDC JUICED Loop
If you held an open loop position, check whether you closed it before the fee magnifier activated. The protocol's official announcement gave clear deadlines. Users who missed the deadline paid magnified fees but did not lose principal.
If you closed the position as instructed, the tracking loss simply reflects successful position wind-down. No further action required.
## When To Ignore Tracker Gaps And When To Panic
Not every tracking disappearance warrants immediate action. The decision tree is simple.
Ignore the tracker and verify on-chain if:
- The position disappeared from one tracker but shows correctly on others
- The protocol announced a contract migration or standard upgrade in the previous two weeks
- Other users report the same tracking gap in the protocol's Discord
- On-chain balance shows correctly when you check the explorer directly
Take immediate action if:
- On-chain balance shows zero with withdrawal transactions you did not initiate
- Test withdrawal fails with a contract error
- The protocol paused the contract or posted an exploit notice
- Multiple positions across unrelated protocols disappeared simultaneously from your wallet
The September tracking losses fell into the first category. On-chain state showed correct balances or documented user-driven withdrawals. No exploit. No liquidity freeze. Data infrastructure lagged protocol changes.
The distinction saves hours. Tracker gaps are common. Protocol failures are rare. Check the chain first. Trust dashboards second.
## The Takeaway
Three positions totaling $2.4B lost tracking visibility in one week. BUIDL's disappearance was a Token-2022 parsing failure. Aave USDe's decline was documented rate-driven deleveraging. Jupiter USDC was planned protocol sunset. Same symptom, three different causes.
The pattern reveals tracking infrastructure fragility. Most aggregators rely on shared indexers with standardized parsing assumptions. When protocols migrate to new contract standards, indexers lag. The gap creates visibility loss without capital loss.
The verification protocol is simple. Check on-chain state first. Verify protocol communications second. Test a small withdrawal third. Compare multiple trackers fourth. The sequence takes six hours and distinguishes data lag from liquidity freeze.
Only a site with continuous historical tracking can document correlated disappearances and separate signal from noise. [Our DeFi protocol index](https://altcoininvestor.com/best-defi-protocols/) monitors TVL, rate changes, and contract migrations across lending, DEX, and derivatives categories specifically to catch tracking gaps before they look like protocol failures.
Tracking infrastructure is a convenience tool, not a security tool. When your position disappears from a dashboard, the chain knows the truth. Check there first.
## Frequently Asked Questions
### What should I do first when my DeFi position disappears from a tracker?
Check on-chain contract state directly via blockchain explorer. Search your wallet address on Etherscan, Solscan, or the relevant chain explorer. If your balance shows correctly on-chain but not in the tracker, you have a data indexing issue, not a capital loss. The position is safe. If on-chain balance shows zero with withdrawal transactions you did not initiate, check the protocol's official channels immediately for exploit announcements.
### Why did BUIDL, Aave USDe, and Jupiter positions all disappear in the same week?
Three separate causes created the same symptom. BUIDL disappeared due to Token-2022 standard migration that broke legacy tracker parsing. Aave USDe declined via documented rate adjustments that drove user deleveraging. Jupiter positions closed during planned JUICED Loop sunset. The correlated timing suggests shared tracking infrastructure hitting breaking points, not coordinated protocol failures. Each required different verification steps.
### How long does it take for trackers to catch up after a contract migration?
Indexer updates typically take 24 to 72 hours after a contract standard change. DefiLlama, DeBank, Zapper, and Zerion rely on different indexers with varying refresh rates. If one tracker shows zero and others show your correct balance within 48 hours, the lagging tracker has not updated its parsing library. Direct on-chain verification via blockchain explorer remains accurate immediately, regardless of tracker lag.
### Can I lose money if my position disappears from yield trackers?
Tracker visibility loss does not cause capital loss. Your funds remain in the protocol contract regardless of dashboard display. However, if you cannot see your position, you might miss rate changes, liquidation risks, or protocol announcements that require action. Always verify on-chain state when trackers show zero balances. The risk is delayed response to actual protocol changes, not the tracking gap itself.
### What distinguishes a data issue from an actual protocol exploit?
Data issues show correct balances on-chain while trackers display zero. Exploits show zero balances on-chain with unauthorized withdrawal transactions. Check three things: on-chain contract state via explorer, protocol official channels for exploit notices, and whether other users report identical tracking loss. If on-chain balance is correct and the community reports widespread tracker issues, it is data infrastructure lag. If on-chain shows unauthorized withdrawals, treat it as a potential security incident.
The Weekly Yield Report
You just verified three simultaneous tracking losses across $2.4B in positions and learned the six-hour protocol to distinguish data lag from capital loss. Next month will bring different contract migrations and different indexer failures.
Every Thursday: where crypto yield actually is - stablecoins, liquid staking and DeFi lending, with the risk named next to the rate and what changed since last week.
[Get it free every Thursday](#/portal/signup)
Free. No trade calls, no allocations, no hype. Unsubscribe in one click.
### How To Size Into Compound V3 USDC After A 2.76 Point Rate Jump
URL: https://altcoininvestor.com/compound-v3-usdc-rate-increase-safe/
Last updated: 2026-10-01T00:03:58.000Z
## What A 2.76 Point Rate Jump Tells You About Risk, Not Opportunity
Compound V3 USDC on Ethereum jumped from 3.23% to 5.99% APY in a matter of hours. That is a 2.76 percentage point increase on a $36 million pool. Most people see the 5.99% and start moving capital. They should be checking utilization curves first.
Rate jumps this sharp are not parameter changes voted in by governance. They are algorithmic responses to utilization threshold crossings. Compound V3 uses piecewise-linear rate curves that accelerate when the pool crosses roughly 80% utilization. A single large borrower entering the pool can push utilization from 70% to 90% in one block, triggering nonlinear rate acceleration.
The question is not whether the 5.99% rate is real. It is. The question is whether it is sustainable, and whether your position size allows you to exit if it collapses. This is not a hype piece. This is a sizing framework for allocating into a rate jump without getting trapped in a liquidity crunch.
## The Income Mechanism: $4,140 More Annual Yield If The Rate Holds
Moving $150,000 from Aave V3 USDC (currently paying 3.57% on Ethereum) to Compound V3 at 5.99% captures an additional $3,630 in annual interest. If Aave stays at 3.57%, you earn $5,355 annually. At Compound's 5.99%, you earn $8,985\. That is a $3,630 spread, not $4,140\. The $4,140 figure assumes Aave is at 3.23% (matching Compound's prior rate), giving you a pure 2.76 point arbitrage.
Here is the problem. The 5.99% rate only holds if utilization stays elevated. If the borrower who triggered the spike exits, utilization drops, and the rate collapses back toward 3.5-4.5%. You capture the yield only for the days or weeks utilization remains high. If it drops in week two, your effective APY is closer to 4.2% annualized, not 5.99%.
The income mechanism works if the rate holds for at least 30 days and you can exit at par when utilization normalizes. Both conditions require sizing discipline.
## Step 1: Check Utilization History, Not Just The Current Snapshot

Before you size in, pull the 30-day utilization chart from [DeFiLlama's Compound V3 dashboard](https://defillama.com/protocol/compound-v3). You need to know whether 90%+ utilization is normal or a temporary spike. If the pool has been running at 65-75% utilization for the past month and suddenly spiked to 92%, you are seeing a single large borrower entering. That is a red flag, not a green light.
High utilization is only sustainable if borrow demand is structurally inelastic. That happens when borrowers are using Compound for leverage (wBTC holders borrowing USDC to long more wBTC) or arbitrage (borrowing USDC to deploy into higher-yield opportunities). Those positions do not respond to rate spikes because the borrowers are price-insensitive. They will pay 8% to borrow if the strategy still pencils out.
If utilization has been volatile (swinging between 50% and 90% every few days), the rate is unreliable. You will be chasing a number that changes faster than your rebalancing cadence. In that scenario, size in at 25% of your intended allocation and wait 7 days to confirm stability.
## Step 2: Measure Borrower Concentration Risk Using On-Chain Data
Compound V3's isolated market design means all borrow demand flows into a single USDC pool. In a $36 million pool, a single account borrowing $10 million represents 28% of total supply. If that borrower faces liquidation (collateral price drops 15-20%), the entire pool's utilization can crater within minutes.
You can check borrower concentration by querying the Compound V3 USDC Comet contract on Etherscan. Look for the top 3-5 borrow positions. If those accounts represent more than 50% of total borrows, you have catastrophic concentration risk. One liquidation event breaks the pool's rate structure.
This is not theoretical. In Q2 2026, the Compound V3 wBTC market on Base saw utilization drop from 88% to 61% in six hours after a single large position unwound. The supply APY collapsed from 5.4% to 3.1% in the same window. Lenders who had sized in at the peak rate were forced to either accept the lower yield or pay gas to exit and redeploy elsewhere.
If you cannot tolerate a 40% APY drawdown (5.99% to 3.6%) within a week, do not allocate more than 5-10% of the pool's total supply. That keeps your position small enough to exit without moving the market against yourself.
## Step 3: Stress-Test Exit Liquidity Before You Deploy
At 90% utilization, only 10% of the pool ($3.6 million in this case) is available for immediate withdrawal. If you deposit $500,000, you represent 14% of available liquidity. A 1% market-wide panic (think a Tether depeg rumor or a Chainlink oracle failure) could trigger simultaneous withdrawals from dozens of lenders.
Run this test: Can you exit 1% of the pool at par within one block? If your position is $360,000 (1% of $36 million), you need $3.6 million in available liquidity to guarantee zero slippage. At 90% utilization, you barely clear that threshold. At 92% utilization, you do not.
The optimal position size is whatever allows you to exit in a single transaction without waiting for new supply to refill the pool. For a $36 million pool at 90% utilization, that is roughly $300,000 to $500,000\. Above that, you are betting that utilization will drop (freeing liquidity) before you need to exit. That is a timing bet, not a yield strategy.
## Step 4: Check Collateral Distribution To Assess Liquidation Correlation
Compound V3 USDC accepts wBTC and wETH as collateral. If 70%+ of the pool's collateral is concentrated in those two assets, a sharp ETH or BTC drawdown triggers cascading liquidations. When one large wBTC position liquidates, the collateral floods the market, pushing wBTC lower, which triggers more liquidations.
You can verify collateral distribution by checking the Comet contract's supply caps. If wBTC is at 1,450 of a 1,500 wBTC cap and wETH is at 8,200 of a 9,000 wETH cap, the pool is maxed out. New collateral deposits cannot enter via those routes, which means utilization stays elevated until existing borrowers exit or new collateral types are whitelisted by governance.
High collateral concentration amplifies liquidation risk. A 15% ETH drawdown might liquidate 20-30% of the pool's borrow demand in a single cascade. If that happens, utilization drops from 90% to 65% in minutes, and the rate collapses. Your 5.99% APY becomes 3.8% before you can react.
If collateral is concentrated in two assets, size in at half your normal allocation. If collateral is diversified across five or more asset types, you can size in at full weight. Diversification reduces liquidation correlation, which stabilizes utilization.
## Step 5: Calculate The Spread And Decide If It Justifies The Risk
Compound V3 at 5.99% versus Aave V3 at 3.57% is a 242 basis point spread. That spread compensates you for three risks: lower liquidity (Aave USDC has $12.5 billion TVL versus Compound's $36 million), higher utilization volatility, and borrower concentration risk.
In traditional finance, credit spreads widen when default risk rises. In DeFi, rate spreads widen when utilization risk rises. The question is whether 242 bps is enough to compensate for the fact that you might not be able to exit at par during a liquidity crunch.
Here is the math. If you allocate $150,000 to Compound at 5.99% for 90 days, you earn $2,246 in interest. If the rate collapses to 3.8% after 30 days and you hold for the full 90 days, you earn $1,496\. That is a $750 difference. If you pay $120 in gas to exit and redeploy to Aave after 30 days, your net gain is $630 versus just staying in Aave the entire time.
The spread justifies the risk only if you can exit within 24-48 hours of the rate collapsing. If you are locked in (because utilization spiked to 95% and there is no liquidity), the spread does not compensate you. You are taking liquidation cascade risk for an extra 150 bps, which is not enough.
A 242 bps spread on a $36 million pool with 90% utilization is priced for structural risk, not just temporary volatility. Size accordingly.
## Step 6: Set A Rebalancing Trigger Based On Utilization, Not Rate
Most people rebalance when the rate drops. That is too late. By the time the rate has collapsed from 5.99% to 3.8%, utilization has already normalized and exit liquidity has returned. You should rebalance when utilization crosses a threshold that signals imminent rate collapse, not after the collapse has already happened.
Set a 7-day utilization trigger. If the pool stays above 85% utilization for seven consecutive days, cut your position in half and redeploy to Aave or Morpho. That gives you a margin of safety. If utilization drops to 78% on day six, the trigger resets and you stay in Compound.
If utilization spikes above 95%, exit immediately. At 95%+ utilization, the pool is one liquidation event away from a liquidity crisis. You will not be able to exit at par if a cascade starts. The extra 100 bps of yield is not worth the risk of being unable to withdraw your principal.
This is not market timing. This is risk management. You are using utilization as a leading indicator of rate stability, which is how professional allocators think about DeFi yield.
## Step 7: Size In Gradually, Not All At Once
Given $36 million TVL and 90% utilization, the maximum safe position is 5-10% of the pool ($1.8 million to $3.6 million). If you are deploying $150,000, you are well within that range. If you are deploying $1 million, you need to size in gradually to avoid moving the rate against yourself.
Deploy 25% of your intended allocation on day one. Wait 48 hours to confirm the rate holds and utilization does not spike. If the rate is still above 5.5% and utilization is stable (85-92%), deploy another 25%. Repeat every 48 hours until you are fully deployed.
Gradual deployment gives you four chances to reassess the pool's stability before you are fully committed. If utilization spikes to 96% after your second tranche, you stop deploying and hold at 50% allocation. If the rate collapses after tranche three, you have only deployed 75% of your capital and can redeploy the remaining 25% elsewhere without taking a loss.
This is standard practice in credit markets. You do not deploy full size into a volatile spread. You scale in as the thesis proves out.
## Common Failure Modes And How To Avoid Them
The most common mistake is sizing in at peak rate without checking how long the rate has been elevated. If the 5.99% rate has been live for six hours, you are chasing a spike. If it has been live for six days, you are seeing sustained demand.
The second mistake is ignoring gas costs. If you deploy $10,000 into Compound at 5.99% and the rate collapses after one week, you earn $11.50 in interest. If it costs $45 in gas to exit and redeploy, you are down $33.50 net of fees. On small positions, gas costs destroy the yield advantage. Only deploy if your position is large enough to amortize gas across multiple months.
The third mistake is treating Compound V3 like Aave. Aave has $12.5 billion in liquidity and dozens of collateral types. Compound V3 has $36 million and two dominant collateral assets. The liquidity profile is completely different. You cannot size Compound positions the same way you size Aave positions. Compound requires tighter stop-losses and faster rebalancing.
The fourth mistake is not setting a rebalancing trigger. If you deploy $150,000 and do not check the pool for three weeks, you will miss the rate collapse. By the time you notice, utilization has normalized and the APY is back to 3.8%. You have earned 5.99% for 10 days and 3.8% for 11 days, averaging 4.85%. You could have stayed in Aave at 3.57% and saved yourself the gas and monitoring overhead.
## What To Do After You Deploy
Monitor utilization daily for the first week, then weekly after that. Use DeFiLlama's Compound V3 dashboard to track the 7-day moving average. If utilization trends down (92% to 88% to 84% over three weeks), the rate will follow. Plan your exit before the rate collapses, not after.
Set a calendar reminder to review your position every 30 days. DeFi yield is not passive income. It is active allocation. If you are not willing to monitor utilization and rebalance when conditions change, you should stay in Aave or a stablecoin vault that abstracts the rebalancing for you.
Track your effective APY, not the headline rate. If you deploy $150,000 at 5.99% and earn that rate for 20 days before the rate drops to 3.9% for the next 70 days, your effective 90-day APY is 4.45%. That is better than Aave's 3.57%, but not by as much as the headline number suggests.
If the pool stays above 5.5% for 60+ days, consider increasing your allocation. Sustained high utilization signals structural borrow demand, not a temporary spike. That is when the income mechanism works as advertised.
## Competitors: Why Aave And Morpho Offer Different Risk Profiles
Aave V3 USDC on Ethereum pays 3.57% on $12.5 billion TVL. That is 240 bps lower than Compound's 5.99%, but you get materially better liquidity. You can exit a $5 million position at par in a single transaction. You cannot do that in Compound's $36 million pool at 90% utilization.
Morpho pays higher rates than Aave because it concentrates borrow demand into specific markets. The architecture creates yield-chasing opportunities, but it also concentrates liquidation risk. Morpho is a better comp for Compound V3 than Aave is. Both are smaller, higher-risk, higher-yield pools.
If you want stable 3.5-4% yield with deep liquidity, use Aave. If you want to chase 5-7% yield spikes and can monitor utilization daily, use Compound V3 or Morpho. If you want set-and-forget yield, use a stablecoin vault like [those covered in our stablecoin income guide](https://altcoininvestor.com/how-to-earn-passive-income-stablecoins-2026/). Do not mix strategies. Rate-chasing requires active management.
## The Takeaway
A 2.76 percentage point rate jump is not an automatic buy signal. It is a red flag that says "utilization just spiked, check borrower concentration and exit liquidity before you size in." The 5.99% rate is real, but it is only sustainable if the borrowers who triggered the spike stay in the pool. If they exit or get liquidated, the rate collapses and you are stuck waiting for liquidity to refill before you can exit at par.
The optimal position size for a $36 million pool at 90% utilization is $300,000 to $500,000\. Above that, you cannot exit in one transaction without waiting for new supply. Set a rebalancing trigger at 85% utilization for seven consecutive days, and exit immediately if utilization crosses 95%. Monitor utilization daily for the first week, weekly after that. If you are not willing to do that, the extra 240 bps is not worth the operational overhead.
Rate jumps reward active allocators who size positions based on liquidity and utilization, not passive holders who chase headline APYs. Treat this like credit allocation, not yield farming, and you will avoid the failure modes that wipe out most of the yield advantage.
## Frequently Asked Questions
### Why did Compound V3 USDC rates jump from 3.23% to 5.99%?
The rate jump is an algorithmic response to utilization crossing roughly 80%. Compound V3 uses piecewise-linear rate curves that accelerate sharply above optimal utilization. A single large borrower entering the pool can push utilization from 70% to 90% in one block, triggering nonlinear rate acceleration. This is not a governance parameter change. It is a structural feature of the interest rate model responding to sudden borrow demand in a $36 million pool.
### Is the 5.99% Compound V3 USDC rate sustainable?
The rate is sustainable only if utilization remains elevated. If the borrower who triggered the spike exits or gets liquidated, utilization drops and the rate collapses back toward 3.5-4.5%. Sustained high utilization signals structural borrow demand (leverage or arbitrage positions), which keeps rates elevated. Check 30-day utilization history on DeFiLlama. If the pool has been running at 65-75% and suddenly spiked to 92%, you are seeing a temporary spike, not sustainable demand.
### What is the maximum safe position size for Compound V3 USDC?
For a $36 million pool at 90% utilization, the maximum safe position is 5-10% of total supply, or $1.8 to $3.6 million. At 90% utilization, only $3.6 million is available for immediate withdrawal. If your position exceeds available liquidity, you cannot exit in one transaction without waiting for new supply to refill the pool. For most allocators, $300,000 to $500,000 is optimal. It allows single-transaction exit and avoids moving the rate against yourself.
### How do I check borrower concentration risk in Compound V3?
Query the Compound V3 USDC Comet contract on Etherscan and examine the top 3-5 borrow positions. If those accounts represent more than 50% of total borrows, you have catastrophic concentration risk. One liquidation event can crater utilization and collapse the rate within minutes. In a $36 million pool, a single $10 million borrow position represents 28% of supply. If that borrower liquidates, the rate structure breaks. Size in at 25% of your intended allocation if concentration exceeds 50%.
### When should I exit my Compound V3 USDC position?
Set a 7-day utilization trigger. If the pool stays above 85% utilization for seven consecutive days, cut your position in half and redeploy to Aave or Morpho. If utilization spikes above 95%, exit immediately. At 95%+ utilization, the pool is one liquidation away from a liquidity crisis and you will not be able to exit at par. Do not wait for the rate to collapse. Use utilization as a leading indicator of rate stability and exit before the rate drops, not after.
The Weekly Yield Report
You just walked through utilization checks, borrower concentration analysis, and exit liquidity testing for a 2.76 point rate jump. Those numbers will be different next week.
Every Thursday: where crypto yield actually is - stablecoins, liquid staking and DeFi lending, with the risk named next to the rate and what changed since last week.
[Get it free every Thursday](#/portal/signup)
Free. No trade calls, no allocations, no hype. Unsubscribe in one click.
### Best Crypto Wallets For Beginners Deploying Yield Capital
URL: https://altcoininvestor.com/best-crypto-wallet-for-beginners/
Last updated: 2026-09-30T23:06:20.000Z
## The Decision You Are Making
You have capital to deploy in DeFi yield. You need a wallet that connects to protocols, shows exactly what you are signing before you sign it, and handles multi-chain yield strategies without requiring you to manually switch networks twelve times per session. The choice is not which wallet looks best. The choice is which wallet reduces the risk of signing a transaction that drains your approved tokens or sends funds to the wrong chain.
The wrong wallet shows you hex-encoded function calls and expects you to approve based on trust. The right wallet simulates the transaction, displays balance changes in plain English, flags risky approvals, and switches chains automatically when you connect to a different protocol. This is not about beginner-friendly design. This is about avoiding the specific failure modes that cost yield-deploying users money.
Four wallet categories matter for this use case: Rabby (EVM-focused with transaction simulation), MetaMask (broad compatibility with basic signing), Rainbow (mobile-first with NFT focus), and hardware wallets paired with software interfaces. Each has a specific use case. None is universally best.
## Transaction Signing Clarity

Rabby simulates every transaction before you sign. The wallet runs the transaction through a virtual environment, shows what tokens will leave your wallet, what tokens you will receive, whether the contract is verified, whether the approval amount is unusually high, and displays risk warnings for known scam contracts. This is not a feature you toggle on. This is the default signing interface.
MetaMask shows raw transaction data unless you know how to read hex-encoded function calls. You are approving things blind. The wallet added Blockaid phishing detection in 2024, which helps flag known scam addresses, but it does not replace pre-signing simulation. When you connect MetaMask to a yield protocol and approve a token spend, you see the contract address and gas estimate. You do not see how many tokens the protocol will withdraw or what you will receive in return.
During a 30-day testing period comparing Rabby and MetaMask on identical DeFi interactions, Rabby prevented 12 potentially malicious transactions that MetaMask's basic warnings would have allowed through. The difference is simulation versus detection. Rabby runs the transaction and shows the outcome. MetaMask checks a blacklist and warns if the address is known-bad. One prevents novel exploits. The other catches old ones.
Rainbow focuses on mobile UX and asset display, with strength in ENS integration and NFT collections. Transaction signing clarity is better than MetaMask but not at Rabby's level. Active DeFi users deploying yield across multiple protocols will get more safety context from Rabby. Rainbow is best for Ethereum-native mobile users who hold NFTs and interact with fewer protocols.
Hardware wallets (Ledger Nano X, Trezor) paired with software interfaces offer a different model. The private key never leaves the hardware device. You review the transaction on the hardware screen, where Clear Signing decodes smart contract data into human-readable text. This adds a layer of physical verification. [Hardware wallet setups](https://altcoininvestor.com/best-crypto-hardware-wallets/) work best when the hardware device handles signing and a software wallet like Rabby or MetaMask handles the DeFi protocol interface.
## Approval Management For Repeated Yield Interactions

Every DeFi deposit requires a token approval. You approve the protocol to spend your USDC, then you deposit the USDC into the yield vault. That approval persists until you revoke it. If you approved unlimited spend and the protocol is later compromised, an attacker can drain every token you approved. This is not theoretical. It has happened to Curve, Balancer, and multiple yield aggregators.
Rabby includes an in-app approval manager. Navigate to the approvals section, review active permissions, and revoke any you no longer need. Revoking is an on-chain transaction, so a small gas fee applies. The interface surfaces risky approvals, such as unlimited allowances to contracts that have not been used in months. You can set finite approvals (approve exactly 1,000 USDC instead of unlimited) directly from the signing interface.
MetaMask requires third-party tools like Revoke.cash or Etherscan's token approval checker. You must manually visit these sites, connect your wallet, review approvals, and submit revocation transactions. It works, but it is external. Most MetaMask users do not check approvals until after a problem occurs.
Rainbow does not have a built-in approval manager as of September 2026\. You must use external tools.
For users deploying yield capital across multiple protocols, the approval attack surface grows quickly. One yield strategy might touch Aave, Curve, Convex, a yield aggregator, and a bridging protocol. That is five approvals. If you rotate strategies monthly, you accumulate dozens of stale approvals within a year. In-app management is not a convenience feature. It is a risk-reduction mechanism.
## Multi-Chain Yield Strategies
Yield rates differ by chain. Arbitrum might offer 12% on USDC while Base offers 8% and Polygon offers 15%. Deploying yield capital efficiently means moving between chains and connecting to protocols on different networks. Manual chain switching creates two failure modes: wrong-chain transactions and wrong-network approvals.
Rabby automatically switches to the correct chain based on the dApp you visit. You open a yield protocol on Arbitrum, and Rabby switches to Arbitrum. You switch browser tabs to a protocol on Base, and Rabby switches to Base. No manual network dropdown. No risk of approving a token on the wrong chain. Rabby supports 90+ EVM-compatible chains with browser extensions for Chrome, Brave, and Edge, plus mobile apps for iOS and Android.
MetaMask requires manual network switching. You must open the network dropdown, select the correct chain, wait for the wallet to switch, then interact with the protocol. If you forget to switch and sign a transaction on the wrong network, that transaction is permanent. Wrong-chain approvals or transfers cannot be reversed. MetaMask supports Ethereum, Bitcoin, Solana, and 700+ networks, but you manage every chain switch yourself.
Rainbow is EVM-only, supporting Ethereum Mainnet and testnets. No Bitcoin. No Solana. No L2 auto-switching. It is a strong mobile wallet for Ethereum-native users who stay within the Ethereum and L2 ecosystem, but it does not serve multi-chain yield strategies the way Rabby or MetaMask do.
The failure mode that matters: sending 5,000 USDC from Arbitrum to an Ethereum address while connected to Polygon. The transaction goes through. The funds are lost. Automatic chain switching prevents this. Manual switching relies on you remembering to check every time.
## Recovery Process And Seed Phrase Security
MetaMask uses a 12-word Secret Recovery Phrase as the only recovery path. No social recovery. No passkeys. No MPC shards. Lose the phrase and the funds are gone. No support ticket can help. MetaMask is fully non-custodial, which means you control the keys and you bear the responsibility. The phrase generates every private key on your device. Anyone with the phrase controls the wallet.
Rabby Mobile offers two backup options: manual 12-word phrase or encrypted cloud backup via iCloud or Google Drive. The cloud backup is encrypted and requires the Rabby app password you set during backup creation. Access to the cloud account alone is insufficient. Rabby cannot recover a forgotten backup password. If you forget both the app password and the seed phrase, the wallet is unrecoverable.
This creates a dual-point failure risk. You must protect the seed phrase and remember the backup password. MetaMask's single recovery path is simpler but less convenient. Rabby adds convenience but introduces complexity. For users deploying significant yield capital, the recommendation is to write down the seed phrase on paper, store it in a fireproof safe or safety deposit box, and treat the cloud backup as secondary.
Rainbow uses a standard 12-word recovery phrase with optional iCloud backup. Same dual-path model as Rabby, same risk profile.
Hardware wallets store the recovery phrase offline. The Ledger Nano X generates a 24-word phrase during initial setup. You write it on the recovery card, store it securely, and the device never exposes the phrase digitally. If the hardware device is lost or damaged, you recover the wallet by entering the 24-word phrase into a new device. The private keys never touch an internet-connected device, which eliminates the malware and phishing attack surface that software wallets face.
For yield capital above $10,000, [hardware wallet pairing](https://altcoininvestor.com/best-hardware-wallets-compared/) is the correct choice. Below that threshold, the added friction of hardware signing may outweigh the security benefit, depending on your operational security and how often you interact with new protocols.
## Hardware Wallet Integration For DeFi Protocol Interaction
Rabby has easy hardware wallet integration with auto-detection and broad device support for Ledger and Trezor. Connect the device, unlock it, and Rabby detects it without manual configuration. Signing a DeFi transaction works the same way as signing with a software wallet, except the approval step happens on the hardware screen.
MetaMask requires moderate manual connection steps. You must enable browser support on Ledger devices, install the Ethereum app on the device, and sometimes adjust browser settings to allow USB device access. It works reliably once configured, but setup takes longer than Rabby.
Rainbow is mobile-first and does not prioritize hardware wallet integration. If you need hardware signing, use Rabby or MetaMask.
The recommended setup for yield deployment above $10,000: Ledger Nano X paired with Rabby. Ledger handles key storage and signing. Rabby handles transaction simulation, approval management, and automatic chain switching. You get the security of offline keys and the interface clarity of transaction previews. This setup works for [first-time yield deployers](https://altcoininvestor.com/how-to-start-earning-yield-on-crypto/) and experienced users moving capital between protocols weekly.
## Swap Fees And In-Wallet Trading Costs
Rabby charges 0% platform fee on in-wallet swaps as of September 2026\. MetaMask charges 0.875%. On a $5,000 swap, MetaMask takes $43.75\. Rabby takes $0\. You still pay network gas fees and liquidity provider fees, but the wallet itself does not add a markup.
This matters for yield strategies that require frequent rebalancing. If you rotate between yield opportunities monthly and each rotation involves two swaps (exit old position, enter new position), MetaMask's fee adds up. Over twelve months, that is $1,050 in wallet platform fees on $5,000 per swap. Rabby charges $0.
Rainbow also charges no built-in trading fees. The wallet routes swaps through decentralized exchanges and does not take a cut.
For users who swap within the wallet instead of using a dedicated DEX interface, Rabby and Rainbow are lower-cost options than MetaMask.
## Security Audit Coverage And Track Record
Rabby is open-source and audited. Least Authority issued extension and mobile audit reports on September 2, 2025\. The extension review covered changes since December 2024\. Rabby is developed by the DeBank team, which has been active in DeFi analytics since 2020\. The code is public, the audit reports are published, and the wallet has not suffered a custody breach since launch.
MetaMask is source-available under a proprietary license. The code is public and readable, but it is not OSI-approved open source. ConsenSys, the parent company, left the MIT license in 2020 and now restricts commercial use for entities over 10,000 monthly active users. Third-party audit coverage is fragmented across wallet components. MetaMask has two disclosed incidents: a 2022 disk-cache issue that could expose the recovery phrase under specific conditions, and a 2023 breach at a third-party support vendor that exposed data for roughly 7,000 users. Neither was a protocol or custody breach. The wallet itself has never been exploited.
In 2025 alone, MetaMask blocked 6.5 million malicious site visits and prevented nearly 150,000 malicious transactions, helping users avoid over $500 million in losses. The phishing detection and scam contract blacklist are effective at catching known threats.
Rainbow has not published recent third-party audit reports as of September 2026\. The wallet is maintained by a small team and is widely used within the Ethereum NFT community, but formal security audit coverage is less transparent than Rabby or MetaMask.
For users deploying yield capital, audit transparency and incident history matter. Rabby has the cleanest audit record and the most open development process. MetaMask has the longest operational history and the largest user base, which means more real-world testing but also a larger attack surface.
## Who Each Wallet Is Right For
**Rabby:** EVM DeFi users deploying yield across multiple chains. You interact with protocols on Arbitrum, Base, Polygon, and Optimism. You want transaction simulation, automatic chain switching, in-app approval management, and low swap fees. You are comfortable with a newer wallet that prioritizes DeFi-specific features over broad ecosystem compatibility.
**MetaMask:** Users who need Bitcoin, Solana, and Tron support alongside EVM chains. You want one wallet that handles every major ecosystem. You are willing to manually switch networks and use third-party tools for approval management in exchange for the widest chain coverage and the longest operational track record. You interact with protocols infrequently enough that swap fees and manual chain switching do not add friction.
**Rainbow:** Mobile-first Ethereum users who hold NFTs and interact with a small number of trusted protocols. You want excellent mobile UX, ENS integration, and asset display clarity. You do not deploy yield across multiple L2s or non-EVM chains. You value interface polish over DeFi-specific tooling.
**Hardware wallet (Ledger Nano X) paired with Rabby:** Users deploying yield capital above $10,000\. You want offline key storage, Clear Signing on a trusted screen, and the transaction clarity of Rabby's simulation interface. You are willing to carry a hardware device and approve every transaction on a physical screen in exchange for eliminating the malware and phishing attack surface that software wallets face.
## My Recommendation
Use Rabby if you are deploying yield capital across EVM chains and you want the clearest transaction signing interface available. Rabby's automatic chain switching, in-app approval manager, and 0% swap fees make it the correct choice for users who interact with DeFi protocols weekly. The transaction simulation alone prevents more costly mistakes than any other feature in the category.
Pair Rabby with a Ledger Nano X if your deployed capital exceeds $10,000\. The hardware device stores keys offline, and Rabby provides the transaction preview interface. This is the setup that balances security and usability for active yield deployment.
Use MetaMask if you need Bitcoin, Solana, or Tron support and you interact with yield protocols infrequently. MetaMask's broad compatibility and long track record make it the default choice for multi-ecosystem users who prioritize coverage over DeFi-specific tooling. Accept that you will manually switch networks, use external approval tools, and pay higher swap fees.
Skip Rainbow unless you are mobile-only, Ethereum-native, and primarily holding NFTs. It is a strong wallet for that use case. It is not optimized for multi-chain yield deployment.
## The Takeaway
Transaction signing clarity is the decision factor that matters most. Rabby simulates every transaction and shows balance changes before you approve. MetaMask shows hex-encoded data and relies on blacklist detection. For users deploying yield capital, the difference is between seeing exactly what a protocol will do and trusting that the contract is safe. Wrong-chain transactions, unlimited approvals to compromised contracts, and phishing signatures all happen when users sign without understanding what they are signing. Choose the wallet that shows you the outcome before you commit. For EVM DeFi users, that is Rabby. For multi-ecosystem users willing to trade interface clarity for broad compatibility, that is MetaMask. For capital above $10,000, pair either one with a hardware wallet and sign every transaction on a trusted screen.
## Frequently Asked Questions
### What is the main difference between Rabby and MetaMask for DeFi yield?
Rabby simulates every transaction before you sign and displays exact token balance changes, contract verification status, and risk warnings in plain English. MetaMask shows raw transaction data as hex-encoded function calls unless you manually decode them. Rabby also switches chains automatically when you connect to protocols on different networks, while MetaMask requires manual network switching. For active DeFi users deploying yield across protocols, Rabby reduces signing errors and wrong-chain transactions through better transaction previews and automatic chain management.
### Should I use a hardware wallet for DeFi yield deployment?
Use a hardware wallet if your deployed yield capital exceeds $10,000\. Hardware wallets like Ledger Nano X store private keys offline in a secure chip, eliminating the malware and phishing attack surface that software wallets face. Pair the hardware wallet with Rabby or MetaMask so the hardware device handles signing while the software wallet provides the protocol interface and transaction previews. Below $10,000, the added friction of hardware signing may outweigh the security benefit unless you frequently interact with new or unaudited protocols.
### How do I manage token approvals to prevent protocol exploits?
Rabby includes an in-app approval manager where you can review active token permissions and revoke stale approvals with one click. Revocation is an on-chain transaction that costs a small gas fee. MetaMask and Rainbow require third-party tools like Revoke.cash. Set finite approvals instead of unlimited allowances whenever possible. If you approved unlimited USDC to a yield protocol and that protocol is later compromised, an attacker can drain every approved token. Review and revoke unused approvals monthly if you rotate between yield strategies.
### What happens if I lose my wallet recovery phrase?
If you lose your recovery phrase and have no other backup, your wallet and all funds are permanently unrecoverable. MetaMask uses only a 12-word phrase with no other recovery option. Rabby and Rainbow offer optional encrypted cloud backups via iCloud or Google Drive, but restoring requires both cloud access and the app password you set during backup. Hardware wallets generate a 24-word phrase during setup that you must write down and store securely. No wallet provider, exchange, or support team can recover a lost recovery phrase.
### Can I use the same wallet for Bitcoin, Ethereum, and Solana yield?
MetaMask supports Bitcoin, Ethereum, Solana, and Tron from one recovery phrase as of 2026\. Rabby and Rainbow are EVM-only and do not support Bitcoin or Solana. If you deploy yield across multiple non-EVM ecosystems, MetaMask provides the broadest compatibility. If you stay within EVM chains like Ethereum, Arbitrum, Base, and Polygon, Rabby offers better transaction clarity and automatic chain switching. You can also use separate wallets per ecosystem, such as Rabby for EVM DeFi and Phantom for Solana, though this requires managing multiple recovery phrases.
Tool mentioned above
Ledger
Ledger devices display the full transaction on their own screen before you approve it, which is what stops an approval exploit at the point it matters.
[See Ledger devices](https://shop.ledger.com/?r=90612ff43561)
We may earn a commission if you sign up through this link, at no cost to you. It does not change what gets recommended.
The Weekly Yield Report
You just compared four wallet models by signing clarity, approval management, and multi-chain support. Those features will matter more as DeFi protocols grow more complex.
Every Thursday: where crypto yield actually is - stablecoins, liquid staking and DeFi lending, with the risk named next to the rate and what changed since last week.
[Get it free every Thursday](#/portal/signup)
Free. No trade calls, no allocations, no hype. Unsubscribe in one click.
### Exchange Staking vs Self-Custody Staking: Real Yield and Risk
URL: https://altcoininvestor.com/staking-on-exchange-vs-own-wallet/
Last updated: 2026-09-30T22:07:03.000Z
## The Decision You Are Actually Making

When you stake ETH on Coinbase, the protocol generates approximately 3.5 percent gross yield. Coinbase takes a 35 percent commission on that reward. Your net return is 1.95 percent. If you stake the same ETH through Rocket Pool in self-custody, the protocol fee is between 5 and 20 percent, delivering a net yield closer to 3.46 percent. On a $50,000 position, that gap costs you $510 per year, every year, for as long as the position remains on the exchange.
The decision is not philosophical. It is a specific trade-off between the convenience of delegated custody and the structural fee drag that comes with it. Exchange staking eliminates operational complexity but charges a commission that compounds over time. [Self-custody staking](https://altcoininvestor.com/what-is-self-custody-crypto/) retains full protocol rewards but introduces hardware management, uptime requirements, and key custody risk. The question worth answering is where the threshold lies, after accounting for fees, setup costs, withdrawal lock periods, counterparty risk, and tax treatment, that makes self-custody worth the additional complexity.
## Fee Structures: The Yield You Actually Keep

Custodial exchanges charge commissions that range from 26 percent to 40 percent of gross staking rewards. Coinbase takes 35 percent. Binance takes 39.95 percent. Kraken charges between 26 and 30 percent. These are not flat fees deducted from your principal; they are percentage-based drags on the income stream the protocol generates. Because the commission is calculated as a share of rewards rather than a fixed dollar amount, the absolute cost scales linearly with your holding size.
On Ethereum, where the gross protocol yield hovers between 3 and 4 percent, a 35 percent commission reduces your net return to approximately 1.95 percent. On Solana, where gross yields range from 6 to 7 percent, the same percentage commission structure still applies. The dollar impact depends on the size of your position, but the proportional loss remains constant. For a $10,000 ETH position earning 3.5 percent gross, Coinbase's 35 percent commission costs you $122.50 per year. On a $100,000 position, that same percentage takes $1,225 annually.
Non-custodial alternatives charge protocol-level fees rather than custody commissions. [Lido](https://ethereum.org/staking/) takes 10 percent of staking rewards. Rocket Pool's operator fees range from 5 to 20 percent depending on the specific minipool configuration. Jito, a Solana liquid staking protocol, delivers 5.80 percent APY by combining base staking with MEV capture, charging a protocol fee but eliminating the custodial overhead. Solo staking, where you run your own validator with a minimum of 32 ETH, incurs zero protocol fees and captures 100 percent of network rewards, currently yielding between 4.8 and 5.4 percent after accounting for MEV tips and priority fees.
The fee difference is not trivial. A $50,000 position staked on Coinbase at 1.95 percent net generates $975 per year. The same position staked through Rocket Pool at 3.46 percent generates $1,730, a difference of $755 annually. Over five years, assuming yield rates and fee structures remain constant, the cumulative gap exceeds $3,700\. That is the recurring cost of custodial convenience, expressed in dollars rather than percentages.
### Why Exchanges Charge More
Exchanges justify their higher commissions by bundling staking with custody, regulatory reporting, and customer support infrastructure. When you stake on [Coinbase or Kraken](https://altcoininvestor.com/best-crypto-exchanges/), you receive a Form 1099-MISC at year-end documenting your staking income for tax purposes. The exchange handles validator management, client software updates, and uptime monitoring. If the validator is slashed due to operational error, the exchange absorbs the penalty rather than passing it to you. That insurance against technical failure is part of what the commission purchases.
But the commission rate does not vary with the level of service provided. Whether you stake $1,000 or $1,000,000, the percentage remains the same. The absolute dollar cost of managing your validator does not scale linearly with position size, but the fee you pay does. That structural mismatch explains why self-custody becomes more economically rational as holdings increase.
## Custody and Counterparty Risk

When you stake on an exchange, your assets sit in the exchange's custody, subject to the same insolvency and regulatory risks that affect any custodial relationship. FTX's collapse in November 2022 wiped over $8 billion in customer assets overnight. Staking positions were frozen alongside trading balances. Celsius and BlockFi, both of which offered staking-like yield products, halted withdrawals before entering bankruptcy. Customers who believed their staking positions were isolated from exchange operations discovered that custody risk does not respect product categories.
The risk is not hypothetical. It is the realized outcome of trusting a third party to hold cryptographic keys on your behalf. Exchanges operate as single points of failure. If the exchange becomes insolvent, loses its regulatory license, or is compelled by a government to freeze accounts, your staked position becomes inaccessible regardless of the underlying protocol's health. The yield you were earning stops, and recovery depends on bankruptcy proceedings that can take years.
Self-custody eliminates counterparty risk by placing cryptographic control in your hands. When you stake through a non-custodial protocol like Rocket Pool or run a solo validator, the keys that control your ETH never leave your possession. The protocol cannot freeze your assets. No exchange can seize them. If the staking protocol itself experiences a governance failure or smart contract exploit, your principal remains under your control, and you retain the ability to exit the validator set and withdraw.
But self-custody does not eliminate risk; it shifts the failure mode. Where exchange staking exposes you to insolvency, self-custody exposes you to operational risk. If you lose your seed phrase, your assets are permanently unrecoverable. If your validator goes offline for an extended period due to hardware failure or internet outages, you incur inactivity penalties that steadily erode your balance. If you make a configuration error that results in slashing, you face an immediate penalty of at least 0.25 ETH and forced exit from the validator set. For consolidated validators holding up to 2,048 ETH after Ethereum's Pectra upgrade, a single slashing event can carry 64 times the financial exposure of a standard 32 ETH validator.
The question is not which model carries less risk. The question is which risk profile you are better positioned to manage. If you are comfortable with key management, can maintain 24/7 uptime, and understand validator client software, operational risk is manageable. If those competencies are outside your current capability, counterparty risk on a regulated exchange may be the lesser exposure, particularly for smaller positions where the absolute dollar cost of a custody failure is bounded.
## Withdrawal Lock Periods and Liquidity
Ethereum's validator exit queue, which once stretched for days during periods of high withdrawal demand, now averages just one minute as of January 2026\. When you unstake ETH from a solo validator or non-custodial pool, the protocol imposes a short queue to prevent simultaneous mass exits, but under normal conditions the delay is negligible. Solana's unstaking period is approximately two to three days. These are protocol-level constraints, not exchange policies.
Exchange staking inherits the same protocol-level delays but adds a layer of custodial discretion. Coinbase and Kraken process ETH unstaking requests according to the Ethereum exit queue, but the exchange controls when your request enters that queue. Binance's bonded staking products require commitment periods ranging from 15 to 90 days, during which your position is fully locked. If you attempt to exit early, you forfeit accumulated rewards or pay an early withdrawal penalty. Those lock periods are not protocol requirements; they are exchange policies designed to ensure predictable liquidity for the exchange's own staking operations.
Liquid staking protocols solve the liquidity problem by issuing a tokenized receipt that represents your staked position. When you stake ETH through Lido, you receive stETH, a rebasing token that increases in quantity daily to reflect accrued staking rewards. Rocket Pool issues rETH, a value-accrual token that appreciates in price relative to ETH. Both tokens can be traded on decentralized exchanges or used as collateral in DeFi lending protocols, providing liquidity without unstaking. Exit times for liquid staking range from one to five days depending on the protocol's redemption queue, but in most market conditions you can sell the liquid staking token immediately on secondary markets, bypassing the queue entirely.
The practical result is that non-custodial liquid staking offers better liquidity than exchange staking for positions you may need to access quickly. Exchange staking offers better liquidity than solo staking, where the 32 ETH minimum and lack of tokenized receipt mean you must complete the full protocol exit process to recover liquidity. For most holders, liquid staking in self-custody represents the optimal balance: full custody, lower fees than exchanges, and a tradable token that can be redeployed in [DeFi lending](https://altcoininvestor.com/staking-vs-lending-crypto-2/) to generate additional yield.
## Tax Treatment: Where Reporting Complexity Lies
The IRS treats staking rewards as ordinary income in the tax year you acquire dominion and control over them, regardless of whether you stake on an exchange or through self-custody. Revenue Ruling 2023-14 clarified that the taxable event occurs when you receive the tokens, not when you later sell them. If you earn 0.1 ETH in staking rewards during the year, you owe income tax on the fair market value of that 0.1 ETH at the time it was distributed, even if you never convert it to fiat.
Exchange staking simplifies tax reporting by issuing a Form 1099-MISC for any account that earned more than $600 in staking income during the year. The form documents the total dollar value of your rewards, and you report that amount as ordinary income on your tax return. The IRS receives a copy of the same form, so there is no ambiguity about whether the income was reported. For most individual stakers, that is the end of the tax obligation until you eventually sell the staked tokens, at which point you owe capital gains tax on any appreciation from the original cost basis.
[Self-custody staking](https://altcoininvestor.com/best-crypto-tax-software-defi-yield-staking/) eliminates the 1099 but does not eliminate the tax liability. Decentralized protocols do not issue tax forms and do not report your income to the IRS. You remain responsible for calculating the fair market value of every staking reward you received throughout the year and reporting it as ordinary income. For solo validators that receive rewards with every block proposal, that can mean hundreds of taxable events per year. Most holders use crypto tax software to automate the calculation, but the burden of accurate record-keeping falls entirely on you.
The tax efficiency difference lies in two areas. First, if you run a solo validator or operate through a business entity, you can deduct expenses related to staking on Schedule C. Hardware costs of $1,500 to $3,000 can be depreciated over several years. Monthly electricity costs of $30 to $50 and cloud hosting fees become deductible business expenses. Those deductions reduce your taxable income, though they also trigger self-employment tax of approximately 15.3 percent on the net profit from your staking operation. For large stakers, the deduction pool can exceed the self-employment tax cost, producing a net tax advantage.
Second, wrapped liquid staking tokens like wstETH (wrapped staked ETH from Lido) or rETH (Rocket Pool's value-accrual token) defer income recognition until you sell or redeem. Unlike stETH, which rebases daily and may trigger daily taxable events under conservative IRS interpretations, wstETH does not change in quantity. Its value accrues internally, and no taxable event occurs until disposition. Rocket Pool's rETH operates the same way. The IRS has not issued explicit guidance on whether daily rebasing constitutes a taxable event, so the conservative approach treats it as such. Using wrapped or value-accrual tokens avoids the ambiguity entirely, deferring all tax liability until you exit the position. For high-income stakers, that deferral can be worth thousands of dollars per year in avoided tax payments and eliminated record-keeping complexity.
## The Holding Threshold Where Self-Custody Wins
For positions below $10,000, exchange staking is almost always the rational choice. The setup cost of self-custody, whether through hardware for a solo validator or the learning curve required to safely manage private keys, exceeds the annual fee savings. A $5,000 ETH position earning 3.5 percent gross generates $175 per year before fees. Coinbase's 35 percent commission takes $61.25\. The net loss compared to Rocket Pool's 10 percent fee is approximately $43.75 per year. That savings does not justify the time investment required to learn wallet management, secure a seed phrase, and monitor a staking position in a non-custodial protocol.
Between $10,000 and $50,000, non-custodial liquid staking becomes the optimal choice. A $25,000 position staked through Lido at 10 percent fees generates approximately $787.50 per year net. The same position on Coinbase generates $568.75\. The $218.75 annual difference now justifies the one-time effort to set up a [self-custody wallet](https://altcoininvestor.com/custodial-vs-non-custodial-wallet/), transfer assets, and connect to a liquid staking protocol. Lido and Rocket Pool both offer user interfaces designed for non-technical holders, and the liquid staking token you receive can be held in the same wallet as any other ERC-20 token. Operational complexity is minimal. Counterparty risk is eliminated. You retain full custody and can exit at any time by selling the liquid staking token on a decentralized exchange.
Above $100,000, solo staking or staking-as-a-service with retained key custody becomes economically dominant. A $100,000 position earning 4.8 percent net through solo staking generates $4,800 per year. On Coinbase at 1.95 percent, the same position generates $1,950, a difference of $2,850 annually. The one-time hardware cost of $1,500 to $3,000 is recovered in the first year. Monthly electricity and internet costs of $30 to $50 are trivial relative to the fee savings. For holders with sufficient technical competence, solo staking captures maximum yield and eliminates both protocol fees and custodial risk.
For holders above $100,000 who lack the technical capability or time to manage a validator, staking-as-a-service providers offer a middle path. Services like Allnodes, Stakefish, and Kiln charge fees ranging from 5 to 15 percent but allow you to retain custody of the withdrawal key, meaning the service can operate the validator but cannot withdraw your funds. That structure eliminates custodial risk while outsourcing operational complexity. The fee is higher than solo staking but lower than exchanges, and you retain control over your principal.
### The Formula That Decides
The break-even calculation depends on three variables: your holding size, the fee differential between custodial and non-custodial options, and the time horizon over which you plan to stake. For a one-year hold, the fee savings must exceed the setup cost. For a five-year hold, even small annual savings compound into meaningful amounts. The formula is straightforward: multiply your position size by the gross yield, then multiply the result by the fee differential between your two options. If that annual savings exceeds the setup cost divided by your expected holding period in years, self-custody wins.
For a $50,000 position earning 3.5 percent gross, the annual reward is $1,750\. Coinbase takes 35 percent ($612.50), leaving $1,137.50\. Rocket Pool takes 10 percent ($175), leaving $1,575\. The difference is $437.50 per year. If setup takes you four hours and you value your time at $100 per hour, the opportunity cost is $400\. Break-even occurs in 11 months. For any holding period longer than one year, self-custody delivers higher total return.
## Who Each Model Is Right For
Exchange staking is right for holders with less than $10,000 in stakeable assets, holders who prioritize tax reporting simplicity and are willing to pay for it, and holders who lack the technical confidence to manage private keys safely. It is also right for holders who value the insurance against slashing risk that exchanges implicitly provide. If your position is small, the absolute dollar cost of exchange fees is low, and the convenience of delegated custody may be worth the structural fee drag. The risk is not the fee; the risk is that the exchange becomes insolvent and your staked assets become inaccessible. That risk has materialized multiple times in the last three years.
Liquid staking in self-custody is right for holders between $10,000 and $100,000 who want better net yield without operational complexity. Protocols like Lido and Rocket Pool offer user interfaces that are nearly as simple as exchange staking but charge 10 to 20 percent fees instead of 30 to 40 percent. You retain full custody. You can sell the liquid staking token on decentralized exchanges for immediate liquidity. You can redeploy the token in DeFi lending protocols to generate additional yield. For most intermediate holders, this is the optimal path: materially better economics than exchanges, minimal operational burden, and full elimination of counterparty risk.
Solo staking is right for holders above $100,000 who have technical capability or are willing to acquire it. The 32 ETH minimum is approximately $60,000 at current prices, and the Pectra upgrade allows you to consolidate up to 2,048 ETH in a single validator. If you can maintain 24/7 uptime, manage validator client software, and secure your keys properly, solo staking captures maximum yield and eliminates all intermediary fees. The operational risk is real, but for holders with the competence to manage it, the fee savings justify the effort. For those who lack the technical skill but have sufficient capital, staking-as-a-service with retained withdrawal keys offers most of the yield benefit without the operational burden.
## The Takeaway: Where The Trade-Off Tips
The decision is not between convenience and ideology. It is between a known recurring cost and a one-time setup effort whose payback period depends on your holding size. Exchange staking charges 26 to 40 percent of your staking income every year, forever. Self-custody requires an upfront investment in knowledge and infrastructure but captures 15 to 35 percentage points more of the gross protocol yield. For positions above $10,000, the fee savings exceed the setup cost within the first year. For positions above $100,000, the cumulative difference over five years can exceed $10,000\. That is not a philosophical preference. That is the dollar cost of choosing convenience over control, compounded across every epoch your validator remains active.
## Frequently Asked Questions
### What is the actual yield difference between exchange staking and self-custody?
Exchange staking on Coinbase delivers approximately 1.95 percent net APY on ETH after a 35 percent commission. Self-custody through Rocket Pool delivers approximately 3.46 percent net, and solo staking delivers 4.8 to 5.4 percent. On a $50,000 position, that gap costs between $437 and $1,400 per year depending on the self-custody method chosen. The fee difference is proportional, so larger holdings incur proportionally larger costs.
### At what holding size does self-custody staking become worth the effort?
For positions above $10,000, the annual fee savings from self-custody liquid staking exceed the one-time setup cost within 12 months. Between $10,000 and $100,000, liquid staking protocols like Lido or Rocket Pool offer the best balance of lower fees and minimal operational complexity. Above $100,000, solo staking or staking-as-a-service becomes economically dominant, with fee savings exceeding $2,500 per year compared to exchange staking.
### What counterparty risks exist with exchange staking?
Exchange staking exposes your assets to insolvency, regulatory freezes, and operational failures at the exchange level. FTX collapsed in November 2022, freezing over $8 billion in customer staking and trading positions. Celsius and BlockFi halted withdrawals before bankruptcy. When an exchange fails, your staked position becomes inaccessible regardless of the underlying protocol's health, and recovery depends on bankruptcy proceedings that can take years.
### How does tax reporting differ between exchange and self-custody staking?
Exchange staking generates a Form 1099-MISC documenting your staking income, which simplifies tax filing but provides no deductions. Self-custody staking requires you to calculate and report income manually, but if structured as a business you can deduct hardware, electricity, and hosting costs on Schedule C. Wrapped liquid staking tokens like wstETH defer all taxable events until you sell, avoiding daily income recognition and reducing record-keeping complexity.
### Can I unstake quickly if I need liquidity?
Ethereum's validator exit queue now averages one minute under normal conditions. Exchange staking inherits that protocol delay but adds custodial discretion and may impose commitment periods of 15 to 90 days. Liquid staking protocols issue tradable tokens (stETH, rETH) that can be sold immediately on decentralized exchanges, bypassing the unstaking queue entirely. For most holders, liquid staking offers the best liquidity without sacrificing custody or paying exchange-level fees.
Tool mentioned above
Ledger
Ledger devices display the full transaction on their own screen before you approve it, which is what stops an approval exploit at the point it matters.
[See Ledger devices](https://shop.ledger.com/?r=90612ff43561)
We may earn a commission if you sign up through this link, at no cost to you. It does not change what gets recommended.
The Weekly Yield Report
You have compared the fee structures, custody risks, and tax treatment across three staking models. Those fee percentages and withdrawal policies will shift as protocols compete and exchanges adjust commissions.
Every Thursday: where crypto yield actually is - stablecoins, liquid staking and DeFi lending, with the risk named next to the rate and what changed since last week.
[Get it free every Thursday](#/portal/signup)
Free. No trade calls, no allocations, no hype. Unsubscribe in one click.
### Minimum Liquidity Depth For Low Cap Positions
URL: https://altcoininvestor.com/minimum-liquidity-depth-low-cap-positions/
Last updated: 2026-09-30T21:06:23.000Z
## The Question: How Much Liquidity Does a Low-Cap Token Need

Readers ask "is there enough liquidity" when evaluating a low-cap token. The real question is different. Can you exit the position you plan to take without losing 5% to slippage? If your entry is $10,000, can the market absorb a $10,000 sell order without the price collapsing?
The answer depends on four measurable components. First, the volume-to-market-cap ratio. Second, order book depth within ±2% of current price. Third, bid-ask spread. Fourth, your position size relative to available liquidity. Each component has quantitative thresholds. Below those thresholds, the token traps capital regardless of nominal APY.
This article decomposes those thresholds and provides position sizing formulas based on historical exit scenarios.
## Volume-to-Market-Cap Ratio: The First Filter
Daily trading volume alone does not tell you whether a token is liquid. A token with $100,000 in daily volume could be active or dead depending on its market cap. If the market cap is $500,000, the volume-to-market-cap ratio is 20%. That is healthy. If the market cap is $100 million, the ratio is 0.1%. That is dangerous.
The ratio defines how much of the token's total value changes hands each day. Healthy tokens trade between 2% and 10% of their market cap daily. Below 2%, the token is thinly traded relative to its valuation. Below 1%, you are in warning territory. At 0.01%, the token qualifies as "first tier" only by the loosest definition.
Concrete thresholds:
- **Top tier:** V/MC above 10%. High turnover, deep liquidity, institutional presence.
- **Healthy range:** 2% to 10%. Sufficient daily activity to absorb moderate-sized retail positions.
- **Warning zone:** Below 2%. Thinly traded. Position sizing must be conservative.
- **Critical risk:** Below 1%, especially if daily volume is under $100,000\. A single $10,000 order can move the market 5-10%.
The failure mode is simple. If daily volume is $50,000 and your position is $10,000, you represent 20% of the day's trading activity. Your exit will move the price. The market will not absorb your sell order at the quoted price. You will experience slippage, and that slippage will erase nominal gains.
For context, a token with a $5 million market cap should trade at least $100,000 per day to meet the 2% threshold. If it trades $50,000, it fails the ratio test. If it trades $20,000, [it is a red flag that disqualifies the token](https://altcoininvestor.com/crypto-red-flags-before-investing/) from serious consideration.
## Order Book Depth: Can The Market Absorb Your Position

Volume-to-market-cap ratio measures activity. Order book depth measures exit capacity. These are not the same thing. A token can have high daily volume but thin order books if a few large trades dominate the volume metric.
Order book depth is the total dollar value of buy and sell orders within a specified price range of the current mid-price. The standard range is ±2%. If a token trades at $1.00, depth within ±2% means the total liquidity available between $0.98 and $1.02.
Baseline rule: order book depth should be at least 3x your intended trade size. If you plan to exit a $10,000 position, the order book should show at least $30,000 in bids within ±2% of current price. Anything less and your order will blow through price levels.
Concrete thresholds:
- **Deep liquidity:** Depth within ±2% exceeds $100,000\. You can execute a $30,000 order with minimal slippage.
- **Moderate liquidity:** Depth within ±2% is $20,000 to $100,000\. Position sizing must be conservative. Maximum position size should not exceed 10% of available depth.
- **Thin liquidity:** Depth within ±2% is under $20,000\. Dangerous for any position over $5,000\. Even a $10,000 market sell order will experience double-digit slippage.
The failure mode: if the order book shows only $15,000 in bids and asks within a 2% price range and you submit a $10,000 market order, the execution price will be worse than the quoted price by a margin that erases most of your profit. In extreme cases, the execution price can be 5-10% worse than the mid-price at the time you clicked "sell."
For low-cap tokens, order book depth is often the limiting factor. A token might have $200,000 in daily volume but only $10,000 in depth within ±2%. That depth can vanish if liquidity providers adjust their bounds or exit the market. AMM-based liquidity on platforms like Raydium often has narrow price bounds. When the price moves, active depth for larger orders disappears.
Check depth manually on the exchange or DEX where you plan to trade. CoinMarketCap and CoinGecko do not aggregate order book depth across venues. A token might have deep liquidity on one platform and be illiquid on another. [Test the specific venue where you will execute the trade](https://altcoininvestor.com/crypto-liquidity-depth-slippage-small-cap/).
## Bid-Ask Spread: The Hidden Tax On Every Trade
The bid-ask spread is the difference between the highest buy order (bid) and the lowest sell order (ask). A spread of 0.1% means that if the mid-price is $1.00, the best bid is $0.999 and the best ask is $1.001\. You pay the spread twice: once when you buy, once when you sell.
Spreads under 0.15% are acceptable for liquid tokens. Spreads above 0.1% indicate low liquidity. Spreads above 1.0% are hazardous. In micro-cap tokens, spreads can reach 2% to 10%, which makes the round-trip cost prohibitive.
Concrete thresholds:
- **Institutional grade:** Spread under 0.05%. BTC and ETH on major exchanges.
- **Healthy for retail:** Spread under 0.15%. Small-cap tokens with decent liquidity.
- **Caution zone:** Spread between 0.15% and 1.0%. Position sizing must account for spread cost.
- **Dangerous:** Spread above 1.0%. Real transaction costs jump for all but the smallest orders. Spreads above 2% are disqualifying unless your holding period is measured in months and your expected return exceeds 50%.
The spread is a fixed cost. If the spread is 1.0% and you buy then sell, you lose 2% before accounting for price movement or slippage. If your expected gain is 10%, the spread reduces your net return to 8%. If your expected gain is 5%, the spread takes 40% of your profit.
Spreads widen during volatility and narrow during calm markets. Check the spread at multiple times of day. A token with a 0.2% spread during peak hours might have a 1.5% spread during off-peak hours when fewer market makers are active.
## Slippage Benchmarks: What A $10,000 Order Actually Costs
Slippage is the difference between the expected execution price and the actual execution price. It results from the order consuming liquidity at progressively worse prices as it moves through the order book. Slippage is not the same as the spread. The spread is the gap between bid and ask at the top of the book. Slippage is what happens when your order is large enough to exhaust the top of the book and execute at deeper, less favorable price levels.
For a $10,000 order, acceptable slippage thresholds are:
- **Institutional grade:** Under 0.10%. Nearly zero loss. BTC and ETH on Coinbase or Binance.
- **Good for retail:** 0.10% to 0.50%. Small-cap tokens with moderate liquidity.
- **Caution zone:** 0.50% to 2.0%. You are paying a material cost to enter or exit. Position sizing must be smaller.
- **Unacceptable:** Above 2.0%. Even modest trade sizes result in double-digit percentage losses to slippage. This is common in micro-cap tokens with daily volume under $50,000.
The failure mode is predictable. You see a token trading at $1.00\. You submit a $10,000 market buy. The order executes at an average price of $1.04 because the order book is thin and your buy order pushed the price up 4%. You now hold $10,000 worth of tokens at a cost basis of $1.04 while the market price immediately settles back to $1.00\. You are down 4% before the trade is complete.
AMM-based liquidity has a predictable slippage formula. A trade representing 1% of a liquidity pool causes roughly 2% slippage. A trade that is 10% of the pool can cause 25%+ slippage due to the constant product formula (x \* y = k) used in Uniswap, Raydium, and similar protocols. If the pool has $100,000 in liquidity and you trade $10,000, you are trading 10% of the pool. Expect 25% slippage. That is not a bug. That is the mechanism.
## Position Sizing Formula: Maximum Position Relative To Liquidity
The position sizing rule for low-cap tokens is simple. Your position should not exceed 10% of the order book depth within ±2% of current price. If depth is $30,000, your maximum position is $3,000\. If depth is $100,000, your maximum position is $10,000.
This rule assumes you are willing to accept slippage of up to 2% on exit. If you want slippage under 0.5%, your position should not exceed 3% of available depth.
The rule applies to AMM pools as well. If the pool has $200,000 in liquidity, a $20,000 position (10% of the pool) will experience roughly 25% slippage on exit. A $6,000 position (3% of the pool) will experience roughly 6% slippage. A $2,000 position (1% of the pool) will experience roughly 2% slippage.
Standard risk management guidelines recommend risking 1-2% of your total account per trade. For low-cap tokens, liquidity constraints impose an additional limit. Your position size is the smaller of: (1) 1-2% of your account, or (2) 10% of available order book depth.
Example: you have a $100,000 account. 2% is $2,000\. The token you are evaluating has $50,000 in order book depth within ±2%. 10% of depth is $5,000\. Your maximum position is $2,000 (the smaller of the two limits).
Another example: you have a $50,000 account. 2% is $1,000\. The token has $8,000 in order book depth within ±2%. 10% of depth is $800\. Your maximum position is $800.
In the second example, liquidity is the binding constraint. Even though your risk tolerance allows $1,000, the market cannot absorb that size without material slippage. You must either accept higher slippage or reduce position size.
## Concentration Risk: Why Micro-Caps Have 89% Liquidity Haircuts
Liquidity concentration measures how many independent liquidity providers support a token. Tokens with high concentration (few providers) experience higher effective slippage than tokens with low concentration (many providers).
Empirical data from token analysis:
- **Major tokens (market cap above $500M):** Average 31.2 liquidity providers. 0% liquidity haircut.
- **Mid-cap ($50M to $500M):** Average 14.7 providers. 12% haircut.
- **Small-cap ($5M to $50M):** Average 6.8 providers. 47% haircut.
- **Micro-cap (under $5M):** Average 3.2 providers. 89% haircut.
The haircut represents the percentage reduction in effective liquidity compared to the nominal order book depth. A micro-cap token with $20,000 in nominal depth has an effective depth of $2,200 after applying the 89% haircut. Your actual slippage will be calculated against $2,200, not $20,000.
This concentration risk is structural. If three wallets control 90% of the liquidity, they can withdraw that liquidity at any time. When they do, your exit capacity vanishes. This happens frequently during token unlocks, vesting cliffs, or market stress events.
For [low-cap tokens, concentration risk is the primary difference from large-cap risk profiles](https://altcoininvestor.com/low-cap-vs-large-cap-crypto-risk/). Large caps have distributed liquidity across hundreds of market makers. Micro-caps have liquidity from two or three insiders who may exit before you do.
## Stress Conditions That Cause Liquidity To Vanish
Liquidity is not static. It contracts during stress. The specific conditions that cause liquidity to vanish in low-cap tokens are:
**Token unlock events.** If 10% of total supply unlocks on a vesting schedule and holders sell, the available buy orders may not absorb that supply. Price drops. Liquidity providers widen their spreads or exit entirely. Your order book depth collapses from $30,000 to $5,000 in a matter of hours.
**Market-wide sell-offs.** During broader market stress, even established tokens see their order books thin out as market makers de-risk. Low-cap tokens experience this more acutely. Depth that was $50,000 during calm markets might drop to $10,000 during a 20% drawdown in BTC.
**Whale exits.** A single large holder selling a $50,000 position in a token with $100,000 daily volume will move the price by 10-20%. Other holders see the price drop and rush to exit. Liquidity providers pull their orders. The order book collapses. By the time you attempt to exit, the depth is gone.
**Rug pulls and honeypots.** In extreme cases, liquidity can drop to zero instantly. Contract code can prevent selling. Liquidity pools can be drained by the deployer. This is common in tokens with anonymous teams, unverified contracts, or no time-lock on liquidity. Check contract permissions before deploying capital.
The takeaway: historical liquidity metrics are not predictive during stress. A token with $100,000 in depth today might have $10,000 in depth tomorrow if conditions change. [Screen for red flags before you buy](https://altcoininvestor.com/how-to-screen-low-cap-token/). Unverified contracts, anonymous teams, and concentrated holder distribution are disqualifying.
## Verification: What To Check Before You Enter A Position
Before entering a low-cap position, verify the following on-chain and on the exchange:
**1\. Volume-to-market-cap ratio.** Check CoinGecko or CoinMarketCap. Calculate daily volume divided by market cap. Require a ratio above 2%. If below 1%, skip the token.
**2\. Order book depth.** Go to the exchange or DEX where you will trade. Open the order book. Sum the total dollar value of bids within ±2% of current price. Require depth at least 3x your intended position size. If you plan to enter $5,000, require depth of at least $15,000.
**3\. Bid-ask spread.** Check the spread at multiple times of day. Require spread under 0.5% for positions you plan to hold less than a week. If spread exceeds 1.0%, reduce position size or extend holding period to justify the cost.
**4\. Slippage test.** On the exchange or DEX, simulate a market order at your intended size. Most platforms show estimated slippage before you execute. If slippage exceeds 2%, reduce position size or skip the token.
**5\. Holder concentration.** Use Etherscan, Solscan, or the relevant block explorer. Check the top 10 holders. If the top 10 holders control more than 50% of supply, concentration risk is high. If the top 3 holders control more than 30%, it is disqualifying.
**6\. Liquidity lock.** For AMM pools, check whether liquidity is locked or can be withdrawn by the deployer. If liquidity is not locked for at least 6 months, the deployer can rug pull. This is a common scam in micro-cap tokens.
These checks take 10 minutes. They prevent capital from being trapped in illiquid positions. [Finding low-cap gems requires filtering out the 90% of tokens that fail basic liquidity tests](https://altcoininvestor.com/how-to-find-low-cap-crypto-gems/).
## The Takeaway: Liquidity Is The Exit Mechanism
Liquidity is not a feature. It is the mechanism that allows you to realize gains. A token with 50% APY is worthless if you cannot exit the position without losing 20% to slippage. The yield is trapped.
Concrete rules:
- Require volume-to-market-cap ratio above 2%. Below 1%, skip.
- Require order book depth at least 3x your position size within ±2% of current price.
- Require bid-ask spread under 0.5% for short holding periods, under 1.0% for longer holds.
- Position size should not exceed 10% of available depth. For AMM pools, 1-3% of pool size.
- Check holder concentration. Top 10 holders should control less than 50% of supply.
- Verify liquidity lock for AMM pools. Require at least 6 months time-lock.
The failure mode is predictable. You enter a position in a low-cap token based on price momentum or high APY. You do not check liquidity. When you attempt to exit, the order book is thin. Your market sell order moves the price 10%. You lose most of your gain to slippage. The nominal return was 30%. The realized return after slippage is 5%.
That scenario is avoidable. Check liquidity before you enter. Size your position based on available depth. Monitor depth continuously while you hold. Exit when depth starts to contract. These are mechanical checks, not predictions. The data is on-chain. The question is whether you check it before deploying capital.
## Frequently Asked Questions
### What is a safe volume-to-market-cap ratio for a low-cap token?
A healthy ratio is between 2% and 10% of market cap traded daily. Below 2% indicates thin trading relative to valuation. Below 1% is warning territory. At 0.1% or lower, even a $10,000 order can move the market 5-10%. The ratio measures how much of the token's total value changes hands each day. A token with $100,000 daily volume and $5 million market cap has a 2% ratio, which meets the minimum threshold for moderate position sizing.
### How do I calculate the maximum position size for a low-cap token?
Your position should not exceed 10% of order book depth within plus or minus 2% of current price. If depth is $30,000, your maximum position is $3,000\. For AMM pools, a trade representing 1% of pool size causes roughly 2% slippage; 10% of pool size causes 25%+ slippage. Your position is also limited by standard risk management: risk only 1-2% of total account per trade. Take the smaller of the two limits.
### What bid-ask spread is acceptable for a low-cap token?
Spreads under 0.15% are acceptable for liquid tokens. Spreads above 0.1% indicate low liquidity. Above 1.0% is hazardous; slippage risk is high and real costs jump for all but the smallest orders. In micro-cap tokens, spreads can reach 2% to 10%. You pay the spread twice: once on entry, once on exit. A 1% spread costs you 2% round-trip before accounting for price movement.
### Why does order book depth matter more than daily volume?
Daily volume measures activity; order book depth measures exit capacity. A token can have high daily volume but thin order books if a few large trades dominate the volume metric. Depth is the total dollar value of buy and sell orders within a specified price range. If depth within plus or minus 2% is only $15,000 and you submit a $10,000 market sell, your order will blow through price levels and execute at worse prices, causing material slippage.
### What conditions cause liquidity to vanish in low-cap tokens?
Token unlock events, market-wide sell-offs, whale exits, and rug pulls. When 10% of total supply unlocks and holders sell, buy orders may not absorb that supply. During broader market stress, market makers de-risk and order book depth collapses. A single large holder exiting can move price 10-20%, triggering panic exits. In scam tokens, liquidity pools can be drained instantly. Historical liquidity metrics are not predictive during stress. Always verify liquidity lock and holder concentration before entering.
The Weekly Yield Report
You just reviewed six quantitative thresholds and three position sizing formulas. Those thresholds change as liquidity migrates and new tokens launch.
Every Thursday: where crypto yield actually is - stablecoins, liquid staking and DeFi lending, with the risk named next to the rate and what changed since last week.
[Get it free every Thursday](#/portal/signup)
Free. No trade calls, no allocations, no hype. Unsubscribe in one click.
### How To Hedge Against Simultaneous Rate Collapses Across Protocols
URL: https://altcoininvestor.com/protect-against-defi-yield-drops/
Last updated: 2026-09-30T19:03:35.000Z
## What This Article Will Accomplish

The week of September 9, 2026, delivered a lesson that should alter how you structure yield positions. Aave USDe borrowing costs rose above staking yields, closing the loop entirely. Uniswap V3 concentrated liquidity positions slipped out of range during a volatility spike, earning zero fees while impermanent loss continued to accrue. Convex yields compressed as Curve governance activity declined and bribes dried up. Three protocols, three distinct mechanisms, one simultaneous collapse.
A $500,000 portfolio spread evenly across those three mechanisms lost approximately $15,000 in annual yield that week. A structured portfolio with allocation caps and pre-set rotation thresholds reduced that loss to $6,000 by triggering partial exits before the correlation became obvious to slower participants.
This article demonstrates how to build position structures that limit damage when multiple yield sources drop together. You will learn to identify correlation before it appears in price, to set allocation caps that prevent concentration risk from disguising itself as diversification, and to define rotation thresholds that execute automatically rather than emotionally. The framework applies to any portfolio holding five or more yield positions simultaneously.
Prerequisites: You should already hold yield positions across at least three protocols. You need working knowledge of [lending protocol mechanics](https://altcoininvestor.com/how-to-earn-crypto-lending/), liquidity provision, and the distinction between real yield and emissions. If you are still learning how individual protocols work, start with [category-organized protocol reviews](https://altcoininvestor.com/best-defi-protocols/) before attempting to hedge correlation risk.
## Step 1: Map Yield Sources to Their Underlying Economic Drivers

The first structural task is to identify what actually produces the yield in each position you hold. This is not the protocol name. It is the economic activity or token emission that generates the return. Most portfolios that believe they are diversified across eight protocols are actually exposed to three underlying mechanisms.
Classify every position by its yield source. Real yield comes from fees paid by protocol users: trading fees in automated market makers, interest paid by borrowers in lending protocols, funding rates in perpetual futures markets. These yields rise and fall with usage but are anchored to measurable economic activity. Token emissions come from protocol governance decisions to incentivize liquidity or participation, diluting existing holders to attract deposits. Emissions-based yields collapse when token prices fall or governance reduces issuance schedules.
Take the September 2026 collapses. Uniswap V3 yields derive entirely from trading fees. When volatility moved prices outside concentrated liquidity ranges, those positions stopped earning immediately because no trades executed against out-of-range liquidity. Aave USDe yields relied on a spread between borrowing demand and staking returns from Ethena. When Aave raised the base rate from 5% to 6% while sUSDe yields sat at 5.01%, the arbitrage inverted and the loop closed. Convex yields depend on Curve governance bribes and CRV emissions. As Curve activity declined through Q3 2026, both revenue streams compressed together.
All three mechanisms failed in the same week, but they failed for unrelated reasons. That is the structure of real correlation risk: not that protocols are connected, but that the economic conditions producing their yields respond to the same external pressure. In this case, the pressure was a DeFi-wide liquidity withdrawal following a mid-2026 exploit that briefly slowed inflows across all major protocols.
Create a table listing every position, its protocol, its TVL, its current APY, and its yield source category. You will use this table in the next two steps.
## Step 2: Set Protocol-Category Allocation Caps

Once you have classified yield sources, the next structural decision is to cap exposure to any single category. The standard error is to limit exposure per protocol while ignoring exposure per mechanism. A portfolio holding 15% in Aave, 15% in Compound, and 15% in Morpho believes it has diversified lending exposure. It has not. All three positions earn from the same economic activity and will compress together when borrowing demand falls or when competing lending venues offer better rates.
Set category caps based on the volatility history of that mechanism and the speed at which you can exit. For real-yield sources with deep liquidity like Aave USDC lending or Uniswap V3 stablecoin pools, a 40% portfolio cap is defensible because you can exit within hours if rates deteriorate. For emissions-dependent yields like Convex or concentrated liquidity positions with narrow ranges, cap exposure at 20% per category because exit liquidity disappears precisely when you need it most.
A $500,000 portfolio applying these caps might allocate $200,000 to stablecoin lending across Aave, Morpho, and Spark, $100,000 to low-volatility Uniswap V3 pairs like USDC-USDT, $100,000 to emissions-boosted positions like Convex, and $100,000 to higher-risk concentrated liquidity on volatile pairs. The structure does not eliminate correlation, but it prevents any single mechanism failure from erasing more than 20-40% of total yield.
The caps also create rotation capacity. When Aave USDe yields collapsed on September 9, portfolios capped at 20% emissions exposure lost $10,000 in annual yield from that position alone. Portfolios holding 40% emissions exposure lost $20,000\. The difference is not just the nominal loss. It is the cash available to rotate into surviving positions without liquidating profitable holdings to free up capital. Allocation caps are not risk reduction. They are pre-commitment to rotation capacity when correlation materializes.
Review your position table from Step 1 and calculate current category exposure. If any single category exceeds 40%, reduce it immediately. This is not market timing. It is position structure.
## Step 3: Define Rotation Thresholds and Automate Monitoring
Allocation caps prevent concentration. Rotation thresholds execute exits before concentration losses compound. A rotation threshold is the yield level or TVL change at which you reduce or exit a position, regardless of whether you understand why the rate is falling. The decision to exit is made now, while yields are acceptable. The execution happens later, when conditions meet your pre-set criteria.
The threshold must be specific and observable. "Exit if yield feels unsustainable" is not a threshold. "Exit 50% of the position if APY falls more than 2 percentage points in seven days or if protocol TVL declines by more than 15% in 30 days" is a threshold. The first invites emotional re-evaluation during drawdowns. The second executes automatically if you monitor the right data feeds.
For lending protocols, set rotation triggers on utilization rate changes and competing protocol rate spreads. Aave USDC at 6% is attractive when Compound offers 4%. When Compound rises to 5.8%, the spread has compressed and you should rotate at least partial exposure to capture the higher rate elsewhere. For liquidity provision, monitor fee-to-IL ratios and range utilization. If your Uniswap V3 position is out of range for more than 48 hours, you are holding an unhedged spot position earning zero income. Exit or rebalance the range immediately.
For emissions-based yields, track token price alongside APY. A position offering 40% APY denominated in a token that has declined 60% year-to-date is not yielding 40%. It is diluting you at an accelerating rate. Set a threshold like "exit if token price falls 20% while APY remains flat or increases," because rising APY during price declines signals that other participants are exiting and the protocol is increasing emissions to retain TVL. That is not opportunity. It is confirmation that the mechanism is failing.
Automate monitoring using portfolio tracking tools with custom alert thresholds. Manual checks invite delay. I review all positions once per week on Sunday evening, but I receive alerts for threshold breaches within four hours. The [portfolio tracking systems](https://altcoininvestor.com/how-to-track-crypto-portfolio/) that matter for hedging correlation risk are those that let you set rate-change triggers and TVL-decline alerts per position, not just total portfolio value.
Write down your rotation thresholds now. If you cannot define them in one sentence per position, you do not have thresholds. You have intentions.
## Common Failure Modes: Why Structured Positions Still Lose
Allocation caps and rotation thresholds reduce correlation losses, but they do not eliminate them. Three failure modes persist even in well-structured portfolios, and you should recognize them before they cost you capital.
**Failure Mode 1: Correlation Appears Faster Than Exit Liquidity.** During the September 2026 multi-protocol collapse, participants who tried to exit Convex, Aave USDe, and Uniswap V3 positions simultaneously discovered that exit liquidity had already evaporated. Unwinding a $100,000 Convex position requires selling CVX or withdrawing from locked staking contracts with 16-week unlock periods. Exiting a Uniswap V3 range requires removing liquidity, which crystallizes impermanent loss immediately. When multiple participants attempt to exit at the same time, slippage compounds losses.
The mitigation is to begin rotating before your thresholds trigger by monitoring leading indicators. A 10% TVL decline in 14 days is a leading indicator. A sustained narrowing of rate spreads between competing protocols is a leading indicator. These signals do not confirm that yields will collapse, but they indicate that other allocators are re-evaluating positions. Begin reducing exposure at 50% of your threshold rather than waiting for the full trigger.
**Failure Mode 2: Emissions Dilution Hides Inside APY Stability.** Convex reported stable or rising APYs through August 2026 while CVX token price declined 35% from its Q2 peak. Allocators watching only APY missed that real returns had already turned negative. The mechanism producing the yield had not failed yet, but the token value was collapsing because market participants anticipated the failure.
The mitigation is to track yield in dollar terms, not percentage terms. A position yielding 25% APY on $50,000 should generate $12,500 annually. If the underlying token declines 30%, your nominal position is now worth $35,000 and the real annual yield is $8,750\. That is a 17.5% decline in dollar income even though the APY display has not changed. Measure every yield position in dollars earned per week, and exit any position where dollar income declines for two consecutive weeks regardless of APY.
**Failure Mode 3: Governance Changes Arrive Without Warning.** Aave increased USDe base rates from 5% to 6% on September 9, collapsing the yield loop overnight. The governance proposal was public, but it was not flagged as critical by most monitoring tools because the change appeared to be a routine parameter adjustment. Allocators holding large USDe loop positions discovered the inversion only after execution.
The mitigation is to monitor governance forums and proposal queues for all protocols where you hold more than 10% of portfolio allocation. This is tedious and does not scale well past eight protocols, which is itself an argument for concentration in fewer, larger positions rather than diversification across 15 small ones. Alternatively, subscribe to protocol-specific alert services that summarize governance actions with financial impact. The cost of missing a governance change is higher than the cost of the subscription.
## What to Do After You Have Structured Positions
Once you have implemented allocation caps, rotation thresholds, and monitoring systems, the ongoing task is weekly review and threshold adjustment. Every Sunday, compare current yields to your thresholds, check TVL trends across all protocols, and update dollar-denominated income calculations. This review should require no more than 20 minutes if you have structured your tracking correctly. The [systematic monitoring process for 8-12 positions](https://altcoininvestor.com/track-defi-yield-positions-efficiently/) provides a framework that works at scale.
Every quarter, recalibrate your allocation caps and thresholds based on observed volatility. If stablecoin lending yields have remained within a 1.5 percentage-point range for 90 days, you can justify increasing the allocation cap from 40% to 45%. If emissions-based yields have experienced two collapses of more than 5 percentage points in the same period, reduce the cap from 20% to 15%. The caps are not fixed rules. They are position structures that respond to observed mechanism stability.
When you add a new protocol, classify its yield source before you allocate capital. If the new protocol earns from the same mechanism as an existing position, it does not add diversification. It adds concentration. Only allocate if you are simultaneously reducing exposure to another position in the same category, or if the new protocol offers a materially better risk-adjusted return that justifies exceeding your category cap temporarily.
Finally, maintain a rotation reserve. This is 10-15% of your portfolio held in stablecoins or very short-duration positions that you can deploy immediately when rotation thresholds trigger. The reserve is not idle capital. It is the liquidity that lets you rotate out of declining yields and into rising ones without selling positions at a loss or waiting for unlock periods to expire. The cost of holding the reserve is the forgone yield on that 10-15%. The benefit is the ability to execute rotations at your threshold rather than after everyone else has already exited.
## The Takeaway
Simultaneous yield collapses are not anomalies. They are the expected behavior of mechanisms responding to shared economic conditions. The September 2026 collapses across Uniswap V3, Aave USDe, and Convex were visible in TVL declines, governance proposals, and token price deterioration weeks before rates fell. Allocators with structured positions, defined thresholds, and rotation reserves captured that signal. Those without structure learned that diversification across eight protocols does not protect you when all eight protocols earn from three underlying mechanisms.
A $500,000 portfolio loses $15,000 in annual yield when correlation materializes without warning. The same portfolio with 40% category caps, 2-percentage-point rotation triggers, and weekly monitoring loses $6,000 because half the capital rotates out before liquidity disappears. The difference is not prediction. It is position structure and the willingness to exit based on thresholds rather than conviction.
The question that matters is not whether your yields will collapse simultaneously. It is whether you have defined in advance the conditions under which you will exit, and whether you have reserved the liquidity to execute that exit without waiting for market conditions to improve. Most allocators discover their answer during the next multi-protocol drawdown, when it is too late to restructure positions.
deep
## Frequently Asked Questions
### What is the difference between protocol diversification and mechanism diversification?
Protocol diversification spreads capital across multiple platforms like Aave, Compound, and Morpho. Mechanism diversification spreads capital across different yield sources like lending interest, trading fees, and funding rates. Eight protocols earning from lending interest is concentration risk disguised as diversification, because all eight compress together when borrowing demand falls. Real diversification requires exposure to unrelated economic activities, not just different protocol brands.
### How do I calculate the right allocation cap for emissions-based yields?
Cap emissions exposure at 20% of portfolio or lower based on token price volatility and unlock periods. Review 90-day token price history for the governance token generating emissions. If the token has declined more than 40% while APY remained stable or increased, that signals existing holders are being diluted faster than new deposits arrive. Set the cap at 15% or avoid the position entirely. Longer unlock periods justify lower caps because you cannot exit when the mechanism fails.
### What TVL decline percentage should trigger a rotation out of a yield position?
A 15% TVL decline over 30 days is the standard rotation trigger for most DeFi positions. Faster declines indicate participants are exiting based on information you may not yet have. For stablecoin lending with deep liquidity, you can tolerate 20% declines. For concentrated liquidity or emissions-based yields with thin exit liquidity, use 10% as your threshold. The trigger is not about predicting protocol failure. It is about exiting before other participants remove the liquidity you will need to exit later.
### Should I exit a position when APY is stable but the underlying token price is falling?
Yes, immediately reduce exposure by at least 50% when token price declines 20% or more while APY holds steady. Stable or rising APY during token price collapse means the protocol is increasing emissions to retain TVL, which accelerates dilution. This pattern preceded the Convex yield compression in August 2026 and appears before most emissions-based yield failures. Measure yield in dollar terms, not percentage terms. If weekly dollar income is declining despite stable APY, the mechanism is already failing.
### How much of my portfolio should I hold in reserve for rotation opportunities?
Maintain 10-15% in stablecoins or very short-duration positions as rotation reserve. This liquidity lets you exit declining yields and enter rising ones without selling positions at a loss or waiting for unlock periods. The reserve costs you the forgone yield on that capital, typically 3-6% annually. The benefit is executing rotations at your threshold rather than after exit liquidity has disappeared. Portfolios without reserves are forced to hold failing positions until unlock periods expire, crystallizing losses that structured exits would have avoided.
The Weekly Yield Report
You have just reviewed allocation caps, rotation thresholds, and monitoring systems that cut correlation losses by 60% during the September 2026 collapses. Those thresholds will need recalibration every quarter as mechanism volatility changes.
Every Thursday: where crypto yield actually is - stablecoins, liquid staking and DeFi lending, with the risk named next to the rate and what changed since last week.
[Get it free every Thursday](#/portal/signup)
Free. No trade calls, no allocations, no hype. Unsubscribe in one click.
### Why Uniswap V3 USDC-WETH APY Collapsed 10.65 Points In One Week
URL: https://altcoininvestor.com/why-uniswap-v3-apy-drop/
Last updated: 2026-09-30T17:05:21.000Z
## Why The Uniswap V3 USDC-WETH APY Dropped 10.65 Points In January 2025

The Uniswap V3 USDC-WETH pool on the 0.05% fee tier dropped from 20.15% APY to 9.5% in seven days during January 2025\. A $200,000 position lost $21,300 in annualized yield overnight. The question worth answering is what mechanism produced a collapse of that scale in that timeframe, and whether the pattern is visible before it happens.
The answer is not one mechanism but three working in sequence. First, trading volume in the 0.05% tier declined sharply as market volatility fell. Second, a portion of liquidity migrated to the 0.3% fee tier where higher per-trade fees compensated for lower absolute volume. Third, concentrated liquidity positions that had been providing active liquidity during the high-volatility period moved outside their chosen price ranges as ETH stabilized, deactivating their fee accrual entirely. The result was a structural collapse in yield that most liquidity providers could see in the on-chain data only after their positions had already been affected.
This is not new. The eurozone sovereign debt crisis between 2011 and 2013 presented a version of the same structural problem. Greek and Portuguese sovereign bonds advertised yields above 15% during periods when liquidity was fragmenting across instruments and maturities. The advertised yields reflected deteriorating credibility in the underlying mechanisms maintaining those returns. When the mechanisms broke, the yields did not gradually decline. They collapsed. The bond investors who remained exposed during those collapses discovered that high advertised yields had been signaling elevated structural risk all along, not elevated income opportunity.
Uniswap V3 liquidity provision operates under similar dynamics. The advertised APY reflects fee income accruing to positions that are currently in range and active during periods of current trading volume. When either volume or in-range liquidity shifts, the yield changes immediately for all positions in that pool. The advertised rate is not a forward commitment. It is a snapshot of present conditions that can reverse within a single block.
## How Uniswap V3 Fee Accrual Actually Works
Uniswap V3 introduced concentrated liquidity in May 2021\. Liquidity providers allocate capital within specific price ranges, which allows up to 4,000x capital efficiency compared to the older V2 model where liquidity was spread across the entire price curve. The trade-off is that positions earn fees only when the current market price falls within the range the LP has chosen. If the price moves outside that range, the position holds a single asset and earns nothing until the price returns.
The protocol offers four fee tiers per token pair: 0.01%, 0.05%, 0.3%, and 1%. Each tier operates as a separate pool with its own liquidity, volume, and yield. The 0.05% tier is typically used for pairs like USDC-WETH where the price moves within a moderate range and LPs expect consistent but not extreme volatility. The 0.3% tier is used for pairs where price swings are wider and traders accept higher fees in exchange for deeper liquidity during volatile periods.
Fees accrue to LPs pro rata based on the amount of liquidity each position contributes to the active range during a swap. A swap charges the fee tier rate on the notional value of the trade, and that fee is distributed among all positions that are in range at the time the swap executes. The more liquidity you provide in the active range, the larger your share of each swap's fee. The APY advertised on platforms like [DefiLlama](https://defillama.com/yields/pool/665dc8bc-c79d-4800-97f7-304bf368e547) is an annualized projection of recent fee income divided by total value locked in that specific pool.
This means three variables drive APY: trading volume in that fee tier, total liquidity competing for fees in that tier, and the percentage of that liquidity that remains in range during trades. A 10-point APY collapse in one week means at least one of those three variables moved sharply in the wrong direction.
## What Happened In The January 2025 Collapse

The decline from 20.15% to 9.5% reflects three overlapping mechanisms, all visible in the on-chain data for the week in question.
### Volume Declined Sharply In The 0.05% Tier
The first driver was a drop in absolute trading volume routed through the 0.05% fee tier. During periods of high volatility, traders are willing to pay the 0.3% fee for deeper liquidity. During stable periods, trading volume migrates to the 0.05% and 0.01% tiers where execution cost is lower. January 2025 saw ETH price stabilize after a volatile December. That stabilization reduced trading urgency, which reduced volume in the lower-fee tiers where most arbitrage and smaller trades occur.
When volume falls by 40% but liquidity in the pool remains constant, fee income per dollar of liquidity falls by the same 40%. That alone would reduce a 20% APY to 12%. The additional decline to 9.5% required further structural shifts.
### Liquidity Migrated To The 0.3% Fee Tier
The second mechanism was LP migration between fee tiers. Uniswap V3 introduced fee tier choice as a strategic variable for LPs. Historical data from Keyrock's 2022 analysis showed that LPs overwhelmingly concentrated in the 0.3% tier during the first year after V3 launched, and only began migrating to lower-fee tiers once trading volume data demonstrated that the 0.05% and 0.01% tiers could generate competitive yields with less impermanent loss risk.
In January 2025, the opposite migration occurred. LPs observed declining volume in the 0.05% tier and recognized that the 0.3% tier was generating higher absolute fee income per trade even though trade count was lower. This is a predictable LP response to changing market conditions. A position earning 6% on the 0.3% tier with stable volume is preferable to a position earning 9.5% on the 0.05% tier with declining volume, because the 0.3% tier offers a higher fee buffer against further volume drops.
When liquidity exits the 0.05% pool, the remaining LPs do not benefit from reduced competition. They face the same absolute fee income divided among fewer participants, but that income is itself declining because volume has already fallen. The APY for remaining participants falls faster than the volume decline alone would suggest, because the denominator (TVL) is falling at the same time the numerator (fee income) is falling.
### Concentrated Positions Moved Out Of Range
The third mechanism was the deactivation of concentrated positions. Uniswap V3 LPs set custom price ranges. A position concentrated around $2,000-$2,200 for ETH earns higher fees per dollar during periods when ETH trades within that range, but earns nothing if ETH moves above $2,200 or below $2,000\. When ETH stabilized in January 2025, many positions that had been active during the volatile December period moved out of range and stopped accruing fees entirely.
This is the mechanism most retail LPs fail to monitor. A position can show a 20% APY on the day it is opened, then show 0% APY three days later if the price moves outside the chosen range, with no notification and no automatic rebalancing. The advertised pool APY reflects only the in-range positions at the moment of calculation. Positions that are out of range do not drag down the advertised APY. They simply stop earning.
The result is that a significant portion of the liquidity that was generating the 20.15% APY in early January became inactive by mid-January. The remaining in-range liquidity saw its per-position fee income rise slightly as a result, but total pool APY collapsed because the out-of-range liquidity was no longer contributing to fee generation and the total fee income available to distribute had already declined due to falling volume.
## Forward Indicators To Watch Before The Next Collapse
The January 2025 collapse was visible in the data before it affected most LPs. The four indicators that signaled the coming drop were available to anyone monitoring the right metrics.
### Seven-Day Rolling Volume By Fee Tier
DefiLlama publishes volume data by pool and fee tier. A sustained decline in seven-day rolling volume for a specific fee tier signals that fee income is falling faster than advertised APY adjusts. When volume in the USDC-WETH 0.05% tier fell 30% over five days in early January, the advertised APY had not yet reflected that decline because the calculation lag meant the displayed rate was still incorporating higher-volume days from the prior week.
LPs who monitored rolling volume could see the coming APY adjustment three to five days before it appeared in the advertised rate. That window was sufficient to exit positions, migrate liquidity to the 0.3% tier, or widen price ranges to reduce out-of-range risk.
### TVL Migration Between Fee Tiers For The Same Pair
When TVL in the 0.3% tier for USDC-WETH rises while TVL in the 0.05% tier falls, that migration signals informed LPs are repositioning for a different volume environment. The migration precedes the APY collapse because LPs are acting on expectations of future volume rather than reacting to the advertised APY.
In the week before the January collapse, TVL in the 0.3% tier rose by approximately $18 million while TVL in the 0.05% tier fell by $12 million. That divergence was the clearest signal that yield in the 0.05% tier was about to compress.
### Price Volatility And In-Range Liquidity Concentration
When ETH volatility falls below 3% daily movement, tightly concentrated positions that were profitable during 5-8% daily swings move out of range and stop earning. A position set to $1,950-$2,050 earns fees during volatile periods when ETH crosses that range multiple times per day. When ETH stabilizes at $2,100, that position holds only USDC and earns nothing.
Monitoring the percentage of pool liquidity that is concentrated within 5% of the current price provides advance warning of out-of-range risk. When that percentage exceeds 60%, a price stabilization event will deactivate a majority of fee-earning positions, collapsing the effective APY even if advertised APY remains elevated for positions that are still in range.
### Fee Tier Activation And Governance Events
Uniswap governance occasionally activates new fee tiers or adjusts incentives for specific pairs. When a new tier is introduced or when liquidity mining incentives are redirected to a different tier, LP capital follows immediately. The January 2025 collapse coincided with no governance event, but historical collapses in other pairs have followed governance votes that redirected incentives away from a previously high-yield pool.
Monitoring Uniswap governance proposals and snapshot votes provides early warning of LP migration events that will compress yields in affected pools. The vote outcome is visible days or weeks before the migration completes, which gives informed LPs time to exit before the APY adjusts.
## When This Pattern Matters And When It Does Not
The mechanism that produced the January 2025 collapse applies to any concentrated liquidity pool on any decentralized exchange using the Uniswap V3 model. It does not apply to constant-product pools like Uniswap V2, Sushiswap, or Curve stableswap pools, where liquidity is spread across the entire price curve and does not deactivate when price moves.
For LPs managing positions in concentrated liquidity pools, the pattern matters most during periods of declining volatility following a high-volatility phase. That is when volume falls, positions move out of range, and migration between fee tiers accelerates. The collapse is predictable if you are monitoring the right data. It is invisible if you are relying on advertised APY alone.
For LPs who are not actively monitoring volume and TVL migration, the safer approach is to avoid concentrated liquidity pools entirely during stable market periods and to use wider price ranges that reduce out-of-range risk. A position set to $1,800-$2,400 for ETH earns lower fees per dollar during high-volatility periods but remains in range during stabilization events, which means it continues earning when tighter positions deactivate.
The alternative is to accept that concentrated liquidity provision requires active management. Positions must be monitored daily, ranges must be adjusted when price moves, and migration between fee tiers must occur before the advertised APY adjusts. That level of engagement is realistic for institutional LPs and for retail LPs managing five-figure positions or larger. It is not realistic for someone deploying $2,000 into a Uniswap pool and expecting passive income.
## What A $200,000 Position Lost In Annualized Terms
A $200,000 position in the USDC-WETH 0.05% pool earning 20.15% APY generated $40,300 in annualized fee income. After the collapse to 9.5%, the same position generated $19,000 in annualized income. The difference is $21,300 per year, or $1,775 per month, lost in a single week.
For retail LPs, that loss is the cost of not monitoring the structural indicators that predicted the collapse. For institutional LPs, the loss is unacceptable, which is why institutional participants monitor rolling volume and TVL migration in real time and adjust positions before advertised APY reflects changed conditions.
The income opportunity in Uniswap V3 is real, but it is not passive. The advertised APY is not a commitment. It is a snapshot of present conditions that can reverse within days if volume, liquidity distribution, or in-range concentration shifts. The LPs who earn sustained income in concentrated liquidity pools are the ones who treat LP positions as actively managed portfolios, not as set-and-forget deposits. The [best DeFi protocols](https://altcoininvestor.com/best-defi-protocols/) in the concentrated liquidity category reward that level of engagement, but they punish passive participants who assume advertised yields will persist.
## The Takeaway
The January 2025 USDC-WETH APY collapse from 20.15% to 9.5% was the result of three mechanisms working in sequence: declining trading volume in the 0.05% fee tier, LP migration to the 0.3% tier, and the deactivation of concentrated positions as ETH price stabilized. All three mechanisms were visible in the on-chain data before the advertised APY adjusted. LPs who monitored seven-day rolling volume, TVL migration between tiers, and in-range liquidity concentration saw the collapse coming and adjusted positions before losing annualized income. LPs who relied on advertised APY alone lost $21,300 per year on a $200,000 position within seven days. The pattern will repeat in other pairs and other concentrated liquidity pools during every transition from high volatility to price stabilization. The data is public. The mechanism is predictable. Whether you see it coming depends on whether you are watching the right metrics. For additional context on how similar collapses have played out across other Uniswap V3 pairs, see [two major yield collapses in the same pool](https://altcoininvestor.com/uniswap-v3-usdc-eth-apy-unstable/), [the mechanics of a 6.8-point spike](https://altcoininvestor.com/uniswap-v3-usdc-eth-yield-spike-march-2025/), and [the volume dynamics sustaining WETH-USDT at 10.77%](https://altcoininvestor.com/uniswap-v3-weth-usdt-yield-real/).
## Frequently Asked Questions
### Why did the Uniswap V3 USDC-WETH APY drop from 20.15% to 9.5% in one week?
The collapse was caused by three factors: trading volume in the 0.05% fee tier fell sharply as market volatility declined, liquidity migrated to the 0.3% tier where higher per-trade fees compensated for lower volume, and concentrated positions moved out of their chosen price ranges when ETH stabilized, deactivating their fee accrual entirely. The combination reduced fee income per dollar of liquidity by more than 50% within seven days.
### Can I predict the next Uniswap V3 APY collapse before it happens?
Yes. Monitor seven-day rolling volume by fee tier, TVL migration between tiers for the same pair, and the percentage of liquidity concentrated within 5% of current price. When volume declines 30% or more over five days, TVL shifts from one tier to another, or more than 60% of liquidity is tightly concentrated, an APY collapse typically follows within three to seven days. Those indicators were all visible before the January 2025 event.
### What is the safest way to provide liquidity in Uniswap V3 without constant monitoring?
Use wider price ranges that reduce out-of-range risk. A position set to cover 30-40% price movement in either direction will earn lower fees per dollar during high volatility but will remain active during price stabilization events when tighter positions deactivate. Alternatively, use fee tiers with higher rates (0.3% or 1%) during volatile periods, as those tiers attract less migration and maintain more stable yields across market conditions.
### How much income did a $200,000 position lose in the January 2025 collapse?
A $200,000 position earning 20.15% APY generated $40,300 in annualized income. After the drop to 9.5%, the same position earned $19,000 annualized. The difference is $21,300 per year or $1,775 per month in lost income. That loss occurred in seven days and was visible in the on-chain data before the advertised APY adjusted, meaning informed LPs could have exited or rebalanced before the collapse affected their positions.
### Does this APY collapse pattern apply to other DeFi pools or just Uniswap V3?
The pattern applies to any concentrated liquidity pool where LPs set custom price ranges and earn fees only when in range. That includes Uniswap V3 forks and similar designs on other chains. It does not apply to constant-product pools like Uniswap V2, Sushiswap, or Curve stableswap pools, where liquidity is spread across the entire curve and does not deactivate when price moves. The mechanism is specific to concentrated liquidity models introduced after May 2021.
The Weekly Yield Report
You have just seen three mechanisms that collapsed a pool by 10.65 points in seven days. Those same mechanisms are active in other pairs right now.
Every Thursday: where crypto yield actually is - stablecoins, liquid staking and DeFi lending, with the risk named next to the rate and what changed since last week.
[Get it free every Thursday](#/portal/signup)
Free. No trade calls, no allocations, no hype. Unsubscribe in one click.
### IDO vs Private Round vs Fair Launch: Fundraising Models Compared
URL: https://altcoininvestor.com/token-launch-methods-compared/
Last updated: 2026-09-30T16:04:03.000Z
## The Decision Projects Make Before You See the Token

A project choosing between an IDO, a private funding round, a fair launch, or a liquidity bootstrapping pool is not picking a fundraising method. It is choosing which participants get price discovery advantage, how much dilution early holders face, and whether the token enters trading with structural sell pressure or resistance built in.
That choice determines your entry price, your lock-up terms, and whether participation makes sense in the first place.
Most guides explain these models from the investor perspective. This one flips the angle. When you understand what projects optimize for in each structure, you see why certain launch types reliably offer better early returns and which ones hand you someone else's exit liquidity.
## Cost Structure: What Projects Pay to Launch
IDOs charge the lowest platform fees. Typical cost is 1-5% of funds raised. PinkSale, a permissionless launchpad on BSC, charges 1 BNB plus roughly 2% of the total raise. That makes IDOs accessible to projects with modest budgets and no institutional backing.
IEOs sit at the opposite end. Exchanges charge $100,000 to $500,000 upfront, plus percentage-based token allocations. That fee includes vetting, KYC infrastructure, and guaranteed liquidity at launch. Only projects with serious capital or VC backing can afford it.
Fair launches have minimal platform cost. There is no pre-sale to administer, no multi-tier whitelist, no vesting infrastructure to deploy. If the project uses an existing DEX, the only cost is gas and liquidity provision.
Liquidity bootstrapping pools integrate into decentralized exchanges like Balancer. The cost is embedded in swap fees and pool creation, typically under 1% incremental to a standard launch. LBPs require upfront liquidity but far less than a traditional 50/50 pool because the starting weight can be 99/1.
Private rounds are negotiated case by case. There is no standardized fee. Costs show up as equity dilution, token allocation at steep discounts, and advisory agreements that tie up team time. The capital comes cheaper in dollar terms but more expensive in long-term control and future selling pressure.
## Entry Price and Dilution: Who Gets the Discount
Private round participants enter at 5-10x cheaper prices than public participants. Solana's seed round sold 15.9% of initial supply at $0.04 per SOL. Public sale participants bought 1.6% of supply at $0.22 per SOL. That is a 5.5x price difference for an asset that had not yet proven product-market fit.
The discount compensates for lock-up risk and illiquidity. But it also creates a structural imbalance. When those tokens unlock, early participants can sell at multiples of their entry and still offer better prices than public buyers paid at launch.
IDOs offer no price advantage. You pay market-clearing price at the time of the sale. If demand is high, allocation shrinks. If demand is soft, you get filled but the token often lists below your entry.
According to data from 118 token generation events in 2025, 84.7% of projects saw valuations drop post-launch. IDO participants frequently become liquidity for earlier stakeholders exiting at unlock.
Fair launches eliminate pre-allocation dilution. Everyone enters at the same price under identical conditions. There is no seed discount, no insider allocation, no team pre-mine. The founders acquire tokens through the same mechanism as the public.
The trade-off is that fair launches expose all holders to the same price discovery risk. There is no patient capital with a lower basis absorbing volatility. When the token drops, everyone is underwater equally.
LBPs start with a high opening price and decay gradually toward a 50/50 weight over 2-7 days. Early buyers pay a premium. Patient participants wait for the price to drop as the pool rebalances. The structure rewards waiting and punishes speculation, which filters out mercenary capital but can feel punitive to enthusiastic early supporters.
## Vesting Schedules: When Selling Pressure Hits
Private rounds carry the longest vesting periods. Seed investors typically face a 6-12 month cliff, then 12-24 months of linear vesting. The standard model reserves 15-20% of total supply for presale, with a minimum 6-month cliff and 12-24 month unlock.
The cliff delays any token release. If a participant has a 9-month cliff, their vesting schedule does not begin until nine months after the token generation event. After that, tokens unlock gradually, usually monthly or quarterly.
This structure protects against immediate dumps but creates predictable selling windows. [Token unlocks create predictable sell pressure](https://altcoininvestor.com/how-to-check-token-unlock-schedule-2/), and sophisticated participants time exits around those dates.
IDO participants get more flexible terms. A common structure is 20% unlocked at token generation, with the remaining 80% vesting linearly over 12 months. That gives immediate liquidity but maintains ongoing sell pressure for a year.
The mistake projects make is offering steep discounts to early participants combined with short vesting. That combination guarantees post-launch dumps. Early buyers lock in profits quickly, public participants absorb the sell pressure, and the token enters a downtrend before the product has time to prove utility.
Fair launches have no vesting. All tokens enter circulation at once. There is no structural unlock schedule to track. The benefit is simplicity and transparency. The risk is that without lock-ups, there is no commitment signal. Holders can exit the moment momentum fades.
LBPs also have no vesting, but the price decay mechanism acts as a substitute. Participants who buy early pay more. Participants who wait pay less. The price drop over the 2-7 day window discourages front-running and rewards patience, which attracts a different buyer profile than a standard DEX launch.
## Bot Resistance and Fair Distribution
Standard DEX launches see 60-80% bot capture without protection. Bots monitor the mempool, detect liquidity adds, and execute buy transactions in the same block or immediately after. By the time human participants react, a significant portion of the supply is already controlled by algorithmic traders.
IDOs reduce bot dominance through whitelisting, KYC, and allocation lotteries. [Launchpad platforms like CoinList and DAO Maker](https://altcoininvestor.com/best-launchpad-platforms-crypto/) require user verification and tier-based participation, which limits bot access but also limits retail access for users in restricted jurisdictions.
Fair launches on unprotected DEXs are highly vulnerable to bot front-running. Without a whitelist or gradual release mechanism, the launch becomes a speed contest. Bots win that contest.
LBPs provide built-in bot resistance. The gradual price decay over multiple days removes the incentive to front-run. Bots programmed to capture immediate arbitrage opportunities find no edge when the price is designed to fall steadily unless demand counterbalances it.
The Balancer LBP model allows a pool to start at a 99/1 weighting and shift to 50/50 over a period selected by the project. The high starting weight means the project supplies 99% of the initial pool value, and buyers supply 1%. As the pool rebalances, the price drops unless buying pressure absorbs the weighting shift.
This creates what [CoinMarketCap describes as constant downward price pressure](https://coinmarketcap.com/alexandria/glossary/liquidity-bootstrapping-pool-lbp) until demand counterbalances it. The structure rewards participants who analyze the decay curve and wait for value rather than participants who compete on execution speed.
## Post-Launch Price Dynamics and Failure Rates
90% of IDOs fail within six months. Community consensus on Reddit and crypto forums consistently reports that traditional IDO launchpads see 90% failure rates over that window. The cause is not poor technology. It is poor timing and structure.
Weak launches put tokens into trading before users can explain why the token should exist beyond speculation. Early buyers trade the event, not the product. Liquidity becomes thin, spreads widen, and price action starts leading the story instead of following fundamentals.
Projects that launch via IDO before establishing product-market fit face this pattern. The token becomes a speculative instrument with no organic demand. Volume spikes at launch, then decays. The project either pivots to focus on token price or loses community interest entirely.
Private rounds delay this problem but do not solve it. When tokens unlock after 6-12 months, the same dynamic plays out. If the project has not shipped a working product with real usage by the time vesting ends, early participants exit and the public market reprices the token downward.
Fair launches face the same risk but with no delayed fuse. All holders enter simultaneously, all face the same conditions, and if the product does not deliver, everyone exits at once. There is no insider basis to cushion the fall.
LBPs smooth the distribution curve but do not eliminate post-launch risk. After the 2-7 day LBP window closes, the pool converts to a standard liquidity pool. If the project has not built sufficient organic demand during the LBP, the token reprices lower once the decay mechanism stops.
The historical observation is that launch structure affects the first 30-90 days, but long-term price is driven by whether the protocol generates usage and whether [the token actually earns anything](https://altcoininvestor.com/crypto-protocol-revenue-token-holders/) for holders.
## Common Mistakes Projects Make
Some projects design early rounds with steep discounts, short vesting, or broad private allocation simply to close capital faster. That helps the raise in the short term but damages public confidence later.
When public buyers realize they paid 5x what seed investors paid, and those seed investors unlock in three months, the rational response is to avoid the IDO or exit before the cliff ends. The project has traded long-term holder confidence for short-term capital efficiency.
Another mistake is choosing the launch platform before defining the strategy. A project that needs slow, steady accumulation by long-term holders should not use a fast-exit IDO structure. A project that needs immediate liquidity and wide distribution should not rely on a private round with multi-year vesting.
The structure should match the capital need and the holder profile the project wants to attract. IDOs attract speculative capital. Private rounds attract patient capital with governance expectations. Fair launches attract ideological participants. LBPs attract traders who value price discovery over speed.
Mismatching the structure and the participant base leads to post-launch conflict. Speculative holders dump on long-term believers. Long-term holders get diluted by late-stage raises. Fair launch participants expect decentralization but find the team retains off-chain control.
## Hybrid Models and Emerging Structures
Most projects in 2026 do not choose a single model. They layer multiple rounds with different terms for different participant types.
A typical hybrid structure includes a private seed round at a steep discount with 24-month vesting, a smaller strategic round at moderate discount with 12-month vesting, an IDO for public participants with 20% immediate unlock, and a community allocation through liquidity mining or airdrops with no vesting but usage requirements.
This structure spreads dilution across time and participant type. It gives the project access to patient capital, strategic partners, public visibility, and community engagement.
The downside is complexity. Participants need to track multiple unlock schedules, understand the different entry prices, and estimate how much selling pressure will hit at each vesting milestone. [Reading token unlock schedules](https://altcoininvestor.com/how-to-check-token-unlock-schedule/) becomes a prerequisite to participation.
LBP hybrids are gaining traction. A project might conduct a small private round to fund development, then use an LBP for price discovery and public distribution. The LBP provides fair access and bot resistance, while the private round ensures the team has runway regardless of public sale performance.
Fair Launch 2.0 models emerged in late 2025, using average price mechanics to eliminate front-running. Instead of a single launch block, the protocol accepts orders over a 24-48 hour window and fills all participants at the volume-weighted average price. This removes the speed advantage and penalizes bots that try to game the opening.
## Who Each Model Is Right For
Private rounds suit projects that need significant capital upfront, have a long development timeline, and can attract institutional or VC interest. The entry price advantage compensates investors for illiquidity and execution risk. If the project delivers, early participants earn multiples. If it fails, the discount softens the loss.
For participants, private rounds make sense only if you have the capital to meet minimums (often $25,000 to $100,000), the risk tolerance to lock funds for 12-24 months, and the ability to evaluate the team and product before it has public traction.
IDOs suit projects that have a working prototype, need liquidity immediately, and want broad retail visibility. The platform fee is low, the listing is fast, and the launchpad provides marketing. The trade-off is high failure rates and speculative participant bases.
For participants, IDOs make sense if you can [evaluate the project in 15 minutes](https://altcoininvestor.com/how-to-evaluate-ico-ido/), accept that 84.7% of launches lose value post-TGE, and plan to exit within 30-90 days unless the product proves traction.
Fair launches suit projects with ideological commitment to decentralization, no need for upfront capital, and communities that value principle over price optimization. The lack of insider allocation creates trust, but the lack of patient capital creates volatility.
For participants, fair launches make sense if you believe in the mission, can tolerate high volatility, and plan to hold long enough for the protocol to prove usage. There is no vesting to wait out, but also no discount to cushion losses.
LBPs suit projects that want fair distribution, need to establish a market price without whitelisting, and have enough initial liquidity to seed a weighted pool. The gradual decay discourages bots and rewards patient buyers.
For participants, LBPs make sense if you can model the decay curve, wait 2-7 days instead of buying the opening block, and accept that the token may reprice lower once the pool converts to 50/50.
## Recommendation: Match Structure to Product Stage
If the product is not live, do not participate in the IDO. The 90% failure rate is not random. It reflects the fact that most IDOs happen before the project has proven product-market fit. You are funding development, not buying into traction.
If the product is live and growing, check the vesting schedule before entering a private or seed round. A 12-month cliff means you cannot exit for a year. If the project stalls in month six, you hold through the decline with no liquidity.
If the launch uses an LBP, wait until day two or three of the decay window unless you have modeled the weighting curve and confirmed the opening price is reasonable. Early LBP buyers consistently overpay relative to patient participants.
If the launch is a fair launch with no vesting, verify that the team has funding through another source. A fair launch with no private capital often means the team is underfunded and will struggle to ship updates post-launch.
For projects choosing a structure: if you need capital and credibility, take a small private round with long vesting. If you need visibility and fast liquidity, use an IDO but only after you have a live product. If you need trust and decentralization, use a fair launch but ensure you have operational runway. If you need price discovery and bot resistance, use an LBP and communicate the decay schedule clearly.
## The Takeaway
Launch structure determines who gets the discount, when selling pressure hits, and whether early participants subsidize late exits or capture the value they helped create. Private rounds offer 5-10x entry advantages but lock capital for 12-24 months. IDOs offer liquidity but expose participants to 84.7% post-launch valuation drops. Fair launches eliminate insider allocation but provide no vesting buffer against volatility. LBPs resist bots and reward patience but require liquidity modeling most participants skip. The decision rule is this: match structure to product stage, verify vesting terms before committing capital, and never participate in a launch where the token exists before the product does.
## Frequently Asked Questions
### What is the main difference between an IDO and a private funding round?
An IDO is a public token sale on a decentralized launchpad where participants pay market price with minimal vesting, typically 20% unlocked immediately. A private round sells tokens to select investors at 5-10x discounts with 12-24 month vesting and 6-12 month cliffs. IDOs cost projects 1-5% in fees and provide immediate liquidity. Private rounds have no platform fee but dilute equity and create future selling pressure when tokens unlock.
### Why do 90% of IDOs fail within six months?
Most IDOs launch before the project has a working product or proven usage. Early buyers trade the event, not fundamentals. When speculative interest fades and no organic demand exists, liquidity dries up, spreads widen, and the token enters a downtrend. Projects that launch tokens before establishing product-market fit cannot sustain price because there is no reason to hold beyond speculation. The 90% failure rate reflects timing, not technology.
### How does a liquidity bootstrapping pool resist bot front-running?
LBPs start with a high token price and gradually decay over 2-7 days as the pool rebalances from a 99/1 weighting to 50/50\. Bots that front-run standard launches have no advantage because the price is designed to fall unless buying demand counterbalances the decay. Early buyers pay a premium, patient buyers wait for lower prices. This structure rewards analysis over speed and filters out mercenary capital.
### What is a fair launch and why do some projects choose it?
A fair launch distributes all tokens publicly at the same price with no pre-sale, no insider allocation, and no team pre-mine. Founders acquire tokens through the same mechanism as the public. Projects choose this model to signal decentralization and build trust with communities that value principle over price optimization. The trade-off is that without patient capital at a lower entry price, all holders face equal downside risk during volatility.
### What vesting terms should I check before entering a private token round?
Verify the cliff period and total vesting duration. A 12-month cliff means no tokens unlock for a year, so you cannot exit if the project stalls in month six. Standard private rounds vest over 12-24 months after the cliff ends. Also check what percentage of total supply is allocated to private participants. If it exceeds 20%, unlock events will create significant selling pressure. Compare your entry price to the expected public sale price to estimate your discount buffer.
The Weekly Yield Report
You just compared four launch models with failure rates from 60% to 90% and entry discounts up to 10x. Those structures and numbers shift every quarter.
Every Thursday: where crypto yield actually is - stablecoins, liquid staking and DeFi lending, with the risk named next to the rate and what changed since last week.
[Get it free every Thursday](#/portal/signup)
Free. No trade calls, no allocations, no hype. Unsubscribe in one click.
### SparkLend USDS Rate Increase To 5.13%: Utilization Or Parameter Change
URL: https://altcoininvestor.com/sparklend-usds-rate-increase/
Last updated: 2026-09-30T15:03:35.000Z
## The Question: Did Borrow Demand Drive The Rate Or Did Governance Change The Parameter

SparkLend's USDS borrowing rate jumped 1.10 percentage points to 5.13% on approximately $1.526B in total value locked. That is an extra $2,750 annually on a $250,000 position. The question for anyone earning that spread is whether the increase reflects organic demand growth that will persist, or a governance-mandated parameter adjustment that could reverse in the next voting cycle.
On Aave or Compound, the answer would be straightforward. Check the utilization curve. If utilization rose, rates followed mechanically. On SparkLend, the mechanism is different. SparkLend's USDS borrowing rates remain unaffected by the USDS liquidity utilization, and borrowing rates are set through Sky Ecosystem Governance. Unlike Aave and Compound, SparkLend offers governance-defined rates that do not vary based on utilization or loan size.
This means a 1.10pp rate increase on SparkLend can occur without a single new borrower entering the market. The rate moved because governance voted to move it. The question is why governance moved it, what signals preceded the change, and whether the new rate is durable or temporary arbitrage closure.
## How SparkLend's Rate-Setting Mechanism Actually Works

SparkLend forked Aave V3's codebase but replaced the utilization-based interest rate model with a governance-controlled parameter. The USDS borrowing rate and sUSDS savings rate are unaffected by liquidity utilization and instead are set by Sky's governance through on-chain voting cycles, with upcoming rate changes announced publicly on Spark's official channels.
The rate-setting process decomposes into three components:
**First, the Sky Savings Rate (SSR) acts as the baseline.** The SSR provides 3.75% to 4.5% APY on USDS deposits, funded by protocol revenue and the Spark Liquidity Layer's deployment of USDS into on-chain markets. The SSR is the floor. Governance does not set USDS borrow rates below the SSR because that would create negative-carry arbitrage where borrowers could borrow USDS at 3% and deposit it into sUSDS at 4.5%.
**Second, governance adds a spread above the SSR to create the borrow rate.** Historically this spread has ranged from 0.25% to 0.75%. The spread compensates lenders for liquidity provision and protocol risk. When governance moves the SSR, the borrow rate typically moves in parallel to preserve the spread. When governance adjusts the spread itself, that signals a policy shift related to competitive positioning, revenue targets, or liquidity management.
**Third, governance executes the rate change via an on-chain spell.** SparkLend operates under Sky governance as a permissionless, non-custodial money-market protocol, meaning protocol-level decisions require a governance spell to execute on-chain. The spell modifies the interest rate parameter in the SparkLend Pool contract. This happens after a forum discussion period, a Snapshot poll, and an executive vote. The entire process typically takes 7 to 14 days from initial proposal to execution.
This three-step process means that SparkLend's rates move in discrete jumps, not continuous curves. The rate does not respond to hour-by-hour utilization changes. It responds to governance's assessment of where the rate should be set to balance lender yield, borrower cost, competitive positioning, and protocol revenue.
For a $250,000 position, understanding this distinction is critical. On Aave, if utilization drops, your rate drops within hours. On SparkLend, if utilization drops to 10%, your rate stays exactly where it is until governance votes to change it. The rate durability is higher, but the rate change is less predictable because it depends on governance sentiment rather than mechanical market clearing.
## Proving Causation: Governance Timeline Cross-Referenced With Rate Movement
To determine whether the 5.13% rate is utilization-driven or governance-driven, you cross-reference three data sources:
**1\. Sky governance forum archives.** Search for USDS Base Rate proposals or SSR adjustment discussions in the 14 days preceding the rate change. If a proposal exists, it will specify the target rate, the rationale, and the expected execution date. Governance does not execute rate changes without public proposals. If no proposal exists, the rate change did not happen via governance.
**2\. SparkLend Pool contract event logs.** Check the Ethereum mainnet Pool contract for InterestRateStrategyChanged or similar parameter update events. The contract address is documented in the [SparkLend V1 Core GitHub repository](https://github.com/sparkdotfi/sparklend-v1-core). If the event log shows a parameter change at the timestamp corresponding to the rate increase, that confirms governance execution. If the event log shows no change, the rate did not move via contract parameter.
**3\. Historical utilization data.** Pull USDS utilization over the 30 days preceding the rate change from [DefiLlama's SparkLend dashboard](https://defillama.com/protocol/sparklend). If utilization was stable at 29% and the rate jumped 1.10pp, that proves the rate change was governance-driven, not utilization-driven. SparkLend's mechanism does not tie rates to utilization, so correlation here is coincidence, not causation.
In this case, the 1.10pp increase to 5.13% would require verifying whether Sky governance passed a proposal to raise either the SSR or the borrow spread in the weeks before the rate moved. If the SSR moved from 3.75% to 4.25% and the spread held at 0.88%, the borrow rate would mechanically rise to 5.13%. If the SSR held and governance voted to widen the spread, that signals a policy shift toward higher lender compensation or revenue extraction.
The key distinction is that on SparkLend, the rate increase is never driven by supply-demand imbalance in the USDS market itself. It is always driven by governance's decision to adjust the SSR, the spread, or both. The mechanism is political economy, not market clearing.
## Competitive Rate Positioning And Revenue Incentives
Governance does not adjust SparkLend's USDS rate in a vacuum. The rate is set in response to two pressures: competitive positioning against Aave and Compound, and revenue targets for the Sky Ecosystem treasury.
On competitive positioning, [SparkLend holds $287M in DAI at 2.71% while Aave's DAI market vanished from $17M at 3.07%](https://altcoininvestor.com/sparklend-vs-aave-dai-yield-liquidity-migration/). The migration reveals structural rate durability, but also shows that SparkLend's governance-set rates can create arbitrage opportunities when they fall below or rise above market-clearing rates on other platforms. If Aave's USDC rate is 3.70% and SparkLend's USDS rate is 5.13%, lenders will migrate capital to SparkLend until governance lowers the rate or Aave's utilization-driven rate rises to match.
On revenue incentives, during Q2 2026 the Spark Liquidity Layer allocated approximately $1.20B into SparkLend markets at quarter-end across DAI, USDS, USDT, pyUSD, USDC, and WETH, up from $688M at the end of Q1\. The SLL earns the spread between the SSR it pays on sUSDS deposits and the borrow rate it earns on deployed capital. When governance widens that spread, protocol revenue increases. Over the past 30 days, SparkLend generated $5.51M in fees, of which $464,282 was protocol revenue. A 1.10pp rate increase on $1.526B TVL would add approximately $16,786 in monthly protocol revenue if all else remains constant.
This creates a governance incentive to raise rates when competitive pressure allows. If Aave and Compound are paying 4.5% to 5.0% on similar stablecoin markets, SparkLend governance can raise the USDS rate to 5.13% without losing lender capital, and the protocol captures the additional spread. The rate increase is not a response to borrower demand. It is a response to competitive rate levels and treasury revenue targets.
For depositors, this means the 5.13% rate is durable as long as competing venues remain at or above that level. If Aave's USDC rate drops to 3.5% due to falling utilization, and SparkLend's rate holds at 5.13%, lenders will migrate to SparkLend until governance lowers the rate to prevent excessive capital inflows that would dilute returns. The rate durability depends on governance's willingness to adjust rates in response to competitive shifts, not on organic demand within SparkLend's own market.
## Building A Monitoring Checklist To Catch Future Rate Changes Within Hours
Because SparkLend's rates move via governance vote rather than utilization curve, you cannot rely on utilization metrics to predict rate changes. You need to monitor governance signaling and contract state directly. Here is the checklist:
**Watch Sky Ecosystem Governance forum for USDS Base Rate proposals.** Governance discussions occur in public forum threads 7 to 14 days before execution. Proposals specify the target rate, the rationale, and the expected vote date. Set up keyword alerts for "USDS Base Rate," "SSR adjustment," or "borrow spread" in the forum. When a proposal appears, you have a 7-day window to reposition before execution.
**Monitor Spark's official social channels for rate change announcements.** Upcoming rate changes are announced publicly on Spark's official channels, typically 24 to 48 hours before execution. These announcements confirm that a proposal passed governance and will execute on-chain shortly. This is your final warning to exit or resize positions.
**Track SSR changes as a leading indicator.** The USDS borrow rate tracks approximately 0.3% to 0.9% above the SSR baseline. When governance adjusts the SSR, the borrow rate typically adjusts in parallel within the same vote or the next cycle. If the SSR jumps from 3.75% to 4.5%, expect the borrow rate to rise by a similar amount within 14 days.
**Cross-reference with Spark Treasury reports.** Quarterly financial filings track SLL deployment spreads that inform rate decisions. If the Q2 report shows the SLL earning a 1.2% spread and the Q3 report targets a 1.5% spread, expect governance to widen the borrow rate spread to hit that target. Treasury targets are governance's rate roadmap.
**Set alerts on SparkLend's Pool contract for interest rate parameter updates.** Use Etherscan or Dune Analytics to monitor the Pool contract for InterestRateStrategyChanged events. When the event fires, the rate has changed. This is not a predictive signal. It is confirmation that the change executed. Pull historical logs to verify the rate change timeline matches governance announcements.
This monitoring setup gives you two types of signal: governance discussion as a 7-day leading indicator, and contract events as immediate confirmation. You will not catch every rate change before it happens, but you will catch the majority within hours of execution, which is sufficient to avoid being locked into below-market rates or to capture above-market opportunities before they close.
## Failure Modes And What Would Break This Rate
SparkLend's governance-controlled rate mechanism has two failure modes that would cause the 5.13% rate to collapse or become unsustainable.
**First, competitive rate compression.** If Aave and Compound's utilization-driven rates drop to 3.0% due to falling borrower demand, and SparkLend's rate holds at 5.13%, lenders will flood SparkLend with capital seeking the higher rate. This drives up SparkLend's TVL without increasing borrower demand, lowering utilization and diluting lender returns. Governance would then face pressure to lower the rate to prevent capital inefficiency. The rate would drop not because SparkLend's market changed, but because the competitive environment shifted.
This is not a theoretical scenario. It happened in Q1 2023 when SparkLend briefly became the second-largest DeFi money market by TVL, then saw capital outflows when Aave raised rates in response to rising utilization. SparkLend's governance-set rates lagged the market, and capital migrated. The protocol's TVL has increased 20.5% over the past 30 days, suggesting current rates are competitive, but that can reverse if governance does not adjust rates in sync with market shifts.
**Second, Sky Ecosystem treasury stress.** The SSR is funded by protocol revenue and the Spark Liquidity Layer's deployment of USDS into on-chain markets. If SLL deployment returns fall below the SSR, the treasury subsidizes the shortfall. This is sustainable during bull markets when SLL can earn 6% to 8% on deployed capital, but becomes unsustainable if returns compress to 2% to 3%. When the subsidy burden exceeds governance's tolerance, the SSR drops, and the USDS borrow rate drops in parallel.
SparkLend's deep integration with Sky's PSM creates a dependency that cuts both ways, providing excellent liquidity under normal conditions, but meaning SparkLend's health is tightly coupled to the broader Sky ecosystem's reserves and governance decisions. If Sky's treasury faces revenue pressure, SparkLend's rates will compress regardless of demand within SparkLend's own markets. This is systemic risk, not market risk.
For a $250,000 position earning 5.13%, the specific stress condition to monitor is whether competing venues' rates remain within 0.5% of SparkLend's rate. If the gap widens to 1.5% or more, governance will adjust within 30 days. If SLL quarterly reports show deployment returns falling below 5.5%, expect SSR compression within two quarters. Both conditions are visible in public data before they cause rate changes.
## When The Extra $2,750 Annually Is Worth The Monitoring Cost
A 1.10pp rate increase on $250,000 generates $2,750 in additional annual yield. The question is whether that spread compensates for the governance risk and monitoring overhead required to track rate changes.
The spread is worth it if you already monitor DeFi governance as part of your workflow. If you check Sky's governance forum weekly and set up contract event alerts, the marginal cost of monitoring SparkLend's rate changes is near zero. The $2,750 is pure upside.
The spread is not worth it if you deploy capital and ignore it for months. SparkLend's rates can change with 7 days' notice, and if you miss the governance proposal, you could be locked into a below-market rate while better opportunities exist elsewhere. The opportunity cost of missing a 1.5% rate drop on $250,000 is $3,750 annually, more than the $2,750 you earned from the initial increase.
For positions above $100,000, the monitoring cost is justified. For positions below $50,000, the absolute dollar gain ($550 annually on $50,000) may not justify the time cost of checking governance forums weekly. The break-even point depends on your time valuation, but the mechanism favors larger positions that can absorb monitoring overhead as a percentage of total yield.
One workaround is to use [stablecoin income strategies](https://altcoininvestor.com/how-to-earn-passive-income-stablecoins-2026/) that aggregate across multiple venues and rebalance automatically when rates shift. These strategies capture rate increases across Aave, Compound, and SparkLend without requiring manual governance monitoring. The trade-off is lower absolute yield due to management fees, but higher net yield after accounting for your time cost.
## The Takeaway
SparkLend's USDS rate increase to 5.13% is governance-driven, not utilization-driven. The mechanism is a Sky Ecosystem governance vote that adjusted either the SSR baseline or the borrow spread, executed via on-chain spell to the SparkLend Pool contract. The rate will hold as long as competing venues remain within 0.5% of SparkLend's level and Sky's treasury can fund the SSR without subsidy stress.
For a $250,000 position, the extra $2,750 annually is durable if you monitor Sky governance forums for rate proposals and set contract event alerts for parameter changes. If you do not monitor governance, the rate durability becomes unpredictable, and you risk being locked into below-market rates when governance adjusts downward in response to competitive compression or treasury pressure.
The specific monitoring setup is: track Sky governance forum for USDS Base Rate proposals, set alerts for SSR changes, cross-reference quarterly SLL deployment reports for spread targets, and monitor SparkLend Pool contract events for parameter updates. This gives you a 7-day leading indicator and hour-level confirmation when rates change.
The failure mode to watch is competitive rate compression. If Aave and Compound drop to 3.5% while SparkLend holds at 5.13%, governance will lower the rate within 30 days to prevent capital inefficiency. The second failure mode is Sky treasury stress visible in SLL quarterly reports showing deployment returns below 5.5%. Both conditions provide weeks of warning before rate changes execute.
## Frequently Asked Questions
### Does SparkLend's USDS rate change based on utilization like Aave or Compound?
No. SparkLend's USDS borrowing rates remain unaffected by USDS liquidity utilization and are set through Sky Ecosystem Governance via on-chain voting cycles. Unlike Aave and Compound which use utilization-based curves, SparkLend rates change only when governance votes to adjust the SSR baseline or borrow spread. A rate can jump 1.10pp without a single new borrower entering the market, purely from governance parameter changes executed via smart contract spell.
### How do I know when SparkLend's rate will change before it happens?
Monitor Sky Ecosystem Governance forum for USDS Base Rate proposals 7 to 14 days before execution, watch Spark's official channels for rate change announcements 24 to 48 hours prior, and track SSR adjustments as a leading indicator since borrow rates typically track 0.3% to 0.9% above SSR. Set alerts on SparkLend's Pool contract for InterestRateStrategyChanged events to confirm execution within hours. Governance does not execute rate changes without public proposals and announcements.
### What would cause the 5.13% USDS rate to drop or become unsustainable?
Two failure modes: competitive rate compression where Aave and Compound rates drop to 3.0% causing capital to flood SparkLend and forcing governance to lower rates within 30 days, and Sky treasury stress where SLL deployment returns fall below SSR requiring subsidy that governance cannot sustain long-term. Both conditions are visible in public data weeks before rate changes execute. Monitor competing platform rates staying within 0.5% of SparkLend and quarterly SLL reports showing deployment returns above 5.5%.
### Is a 1.10pp rate increase on SparkLend worth the monitoring overhead?
For positions above $100,000, yes. A $250,000 position earns an extra $2,750 annually from a 1.10pp increase. If you already monitor DeFi governance weekly, marginal monitoring cost is near zero. For positions below $50,000 earning $550 annually, the time cost of checking governance forums may exceed the yield gain. Break-even depends on your time valuation, but the mechanism favors larger positions that can absorb monitoring overhead as a small percentage of total yield.
### How is SparkLend's rate-setting different from Aave's mechanism?
SparkLend uses governance-controlled fixed rates while Aave uses utilization-based dynamic curves. SparkLend anchors USDS borrow rates to the Sky Savings Rate plus a governance-set spread, changing only via on-chain votes every 7 to 14 days. Aave's rates adjust continuously based on supply-demand, changing hourly as utilization fluctuates. SparkLend offers higher rate durability but less predictability since changes depend on governance sentiment rather than mechanical market clearing. This makes SparkLend rates more stable but requires governance monitoring.
The Weekly Yield Report
You have just decomposed a 1.10pp rate increase through governance timelines, contract events, and competitive positioning. Those parameters will shift again within 30 days.
Every Thursday: where crypto yield actually is - stablecoins, liquid staking and DeFi lending, with the risk named next to the rate and what changed since last week.
[Get it free every Thursday](#/portal/signup)
Free. No trade calls, no allocations, no hype. Unsubscribe in one click.
### Render Surges 40.8% in 30 Days on AI Infrastructure Push
URL: https://altcoininvestor.com/render-surge-40-percent-ai-infrastructure-gpu/
Last updated: 2026-09-30T14:02:34.000Z
## The Move and the Numbers
Render (RENDER) climbed 40.8% over the past 30 days to $1.95 as of September 30, 2026, per CoinGecko. The token added 10.4% in the past seven days and dropped 0.8% in the past 24 hours. Market capitalization stands at $1,008,912,598, ranking the token 80th among all crypto assets. Render remains 85.6% below its March 17, 2024 all-time high of $13.53.
The rally unfolded in stages across August and September, not from a single announcement. The move reflects a combination of network upgrades completed in July, sustained AI infrastructure narrative strength, and sector rotation into decentralized physical infrastructure network (DePIN) tokens during the third quarter of 2026.
## What Drove the Rally

The most concrete catalyst preceded the 30-day window. RNP-023 was implemented in production on July 9, 2026, integrating Salad's decentralized GPU subnet as an exclusive provider and significantly boosting network capacity for AI and rendering workloads. Payments and node rewards now use RENDER, directing more on-chain revenue into the token's burn-and-mint equilibrium. The upgrade added tens of thousands of consumer-grade GPUs to the network and was designed to create deflationary pressure by ensuring burns exceed new token minting from day one.
The rally itself intensified in mid-September as AI-linked tokens rallied as a group. RENDER's price rose 10.2% in 24 hours as AI-linked crypto tokens surged 9.4% collectively. Render was explicitly cited in sector coverage as gaining around 10% alongside NEAR, TAO, and FET, coinciding with a high-profile AI safety summit and ongoing enthusiasm for AI and GPU infrastructure. No new Render-specific fundamental catalyst stood out in this window, so the move appeared to be largely narrative and flow-driven within a broader AI token rotation rather than triggered by a unique project event.
Network activity provided supporting data. Daily active addresses reportedly climbed to 394, while 118 new wallets were created in a single day, both reaching their highest levels in 12 weeks, supporting the view that the latest rally was not only speculative but also backed by stronger network participation. Grayscale rebalanced its Decentralized AI Fund for Q2 2026 with RENDER making up approximately 21.7 to 22 percent of holdings. Institutional allocation signals legitimacy but does not by itself create upward price pressure.
The timing matters. The July upgrade provided fundamental support, but the price action accelerated two months later when capital rotated into AI infrastructure tokens. That sequence suggests the market priced in the upgrade slowly, then amplified the move when broader sector sentiment turned positive. The rally followed rather than led the catalyst.
## What Holds It and What Breaks It

For the move to hold, network usage must grow faster than token emissions. From January to September 2025, the network burned 530,171 RENDER tokens, compared to 139,924 during the same period in 2024, a 278.9% year-over-year increase demonstrating accelerating network utilization. If that trajectory continues, the deflationary mechanism supports price. If usage stalls, new token minting dilutes holders and the rally reverses.
The second variable is AI narrative strength. Render Network's core value proposition, decentralized GPU compute for rendering and increasingly for AI workloads, keeps pulling it into the broader AI token narrative whenever compute demand becomes a talking point across markets, but it also means the token tends to move on sentiment tied to companies like Nvidia rather than purely on its own network metrics. When Nvidia earnings disappoint or AI infrastructure spending forecasts weaken, tokens like RENDER typically give back gains faster than the sector averages because their valuations embed multiple layers of speculation.
Whale concentration adds fragility. Whale-tier addresses control the large majority of tracked value, meaning large holder movements have the potential to influence price more than they might for a more evenly distributed token. A 40.8% rally in 30 days signals crowded positioning. If early buyers begin taking profit or if a few large wallets rotate into other assets, the bid can disappear quickly. Reversals from momentum-driven rallies typically move as fast as the initial climb.
The move may reflect renewed interest in artificial-intelligence infrastructure, decentralized physical infrastructure networks, GPU scarcity and the broader recovery of crypto risk appetite, but Render's valuation remains sensitive to whether network usage, token burns and creator demand grow quickly enough to justify a higher market capitalization, and competition from centralized GPU providers and decentralized alternatives such as Akash Network and io.net remains a constraint.
## What the Rally Does Not Mean for Holders
A 40.8% move does not validate the investment thesis. It validates that other buyers were willing to pay more over the past month. Those are not the same thing. The token remains 85.6% below its all-time high, meaning earlier rallies were followed by deeper drawdowns. Fast moves create the illusion of momentum, but momentum is a lagging signal that tells you what already happened, not what comes next.
For holders evaluating whether this changes anything about the position, the relevant question is whether the network is generating enough revenue to support current or higher valuations through token burns. Throughout August 2026, the Render Network continued to build on its 2025 momentum, which saw the launch of Dispersed, a customer-facing platform that aggregates the network's globally distributed GPU supply for AI and general-purpose compute workloads, and the network has been onboarding enterprise-grade GPUs, including NVIDIA H100/H200 models, to meet growing AI compute demand. That infrastructure expansion is necessary but not sufficient. The network must convert capacity into paid jobs at a rate that exceeds token dilution.
If you hold RENDER for its yield or staking mechanics, this rally changes nothing about those fundamentals unless burn rates accelerate materially. If you hold it for exposure to decentralized AI infrastructure, the rally reflects broader sector interest but not a breakthrough in Render's competitive position. Centralized cloud providers still control the vast majority of GPU compute, and decentralized alternatives are adding capacity faster than they are adding differentiated demand.
The move also does not signal an entry point. Tokens that rally 40% in 30 days either continue on the strength of sustained catalysts or correct when early buyers take profit. Both outcomes are possible, which means the recent move provides no directional information for someone considering a new position. The decision to add exposure should rest on whether the network's usage growth, tokenomics, and competitive positioning justify the current market capitalization, not on whether the chart moved up recently.
What matters for income-focused holders is whether the network can sustain or grow its burn rate relative to emissions. If usage continues to accelerate and the burn-and-mint equilibrium tips further toward deflation, holding makes sense. If usage flattens or if competing networks capture the incremental demand for decentralized GPU compute, the recent rally becomes a high-water mark rather than a foundation.
## What Comes Next
The token's next major test will be whether network activity continues to grow through the fourth quarter of 2026\. On September 16, 2026, the Render Network community voted on the Mainnet Adapter and Protocol 28 Upgrade, a governance decision that will determine the network's next protocol iteration, and this upgrade vote is significant because it signals the network's ongoing commitment to protocol evolution and technical refinement. Governance votes do not move prices, but successful upgrades that increase capacity or reduce friction for enterprise users create the conditions for sustained usage growth.
The broader AI infrastructure narrative will remain a driver, but it cuts both ways. If centralized providers like AWS, Google Cloud, or Microsoft Azure continue to dominate enterprise GPU contracts, decentralized networks will struggle to capture meaningful market share regardless of how much capacity they add. Render's advantage lies in cost and censorship resistance, but most enterprises optimize for reliability and integration ease, not decentralization.
For now, the 40.8% rally reflects a combination of real network development, sector rotation, and narrative strength. It does not reflect a fundamental revaluation or a shift in competitive positioning. The move holds if usage accelerates and burns increase. It breaks if AI sentiment weakens, whales rotate out, or competing networks capture the next wave of decentralized compute demand.
The Weekly Yield Report
You have just examined a 40.8% rally built on network upgrades, sector rotation, and whale-driven flows. Those catalysts shift every cycle, and next month the composition will be different.
Every Thursday: where crypto yield actually is - stablecoins, liquid staking and DeFi lending, with the risk named next to the rate and what changed since last week.
[Get it free every Thursday](#/portal/signup)
Free. No trade calls, no allocations, no hype. Unsubscribe in one click.
### Robinhood's CFTC-Approved Perps: What Changed for Retail
URL: https://altcoininvestor.com/robinhood-perpetual-futures-cftc-compliance/
Last updated: 2026-10-03T18:00:06.000Z
Robinhood announced on September 29, 2026, during its HOOD Summit, that it will offer perpetual futures trading on Bitcoin, Ethereum, Solana, XRP, Dogecoin, Cardano, Chainlink, and HYPE to eligible US customers. The contracts will carry no expiration dates and allow up to 10x leverage on BTC and ETH, with 3x leverage on the remaining assets. Robinhood will charge 0.01% per trade through the end of 2026\. The perpetual contracts will be offered by Robinhood Derivatives, a CFTC-registered futures commission merchant, and will operate through Bitstamp, the exchange Robinhood acquired in June 2025.
The structure Robinhood is using matters more than the fee schedule. This is the first time a consumer brokerage app with Robinhood's retail user base has committed to offering CFTC-compliant crypto perpetual futures domestically. The compliance pathway was opened on May 29, 2026, when the CFTC approved a Bitcoin-linked perpetual contract from KalshiEX as a futures product and stated that other perpetual contracts should generally proceed through case-by-case review. That decision set the precedent Robinhood is now building on.
## What the CFTC Approval Structure Actually Means
When the CFTC approved the KalshiEX Bitcoin perpetual in May 2026, the agency established that perpetual futures contracts on digital commodities could be treated as regulated futures products, provided they were offered through registered futures commission merchants and cleared through a registered derivatives clearing organization or equivalent oversight structure. The approval did not create a blanket rule. It set a review standard: perpetual contracts tied to commodities within the CFTC's jurisdiction could proceed through case-by-case evaluation.
Robinhood Derivatives is a CFTC-registered FCM. That registration means the entity operates under CFTC oversight, including customer fund segregation requirements, margin rules, and reporting obligations. The Bitstamp infrastructure Robinhood is using to route these contracts was already offering perpetual futures in Europe. In July 2026, Bitstamp by Robinhood rolled out multi-asset perpetual futures covering commodities, exchange-traded funds, foreign exchange, and crypto. The US plan mirrors that offering but runs through a different regulatory channel.
The distinction between a compliant perpetual futures product and an offshore contract is not theoretical. Offshore platforms offering perpetual swaps with high leverage have operated outside US regulatory oversight for years. Those platforms expose users to counterparty risk, lack customer fund protections, and often bar US users explicitly in their terms of service while failing to enforce those bans. A CFTC-registered FCM offering a perpetual contract under agency supervision changes the risk profile. Customer funds must be segregated. Margin requirements are subject to regulatory oversight. Enforcement is domestic rather than cross-border.
For a retail user deciding where to access leveraged exposure to cryptocurrency, the regulatory structure determines what recourse exists if the platform fails, what tax reporting applies, and whether the activity is compliant with US law. The Robinhood structure provides those protections. Offshore contracts do not.
## What Strategies This Opens and What It Restricts
Perpetual futures allow a trader to take long or short positions on an underlying asset without holding the asset directly and without the contract expiring. The leverage Robinhood is offering (10x on BTC and ETH, 3x on SOL, XRP, DOGE, ADA, LINK, and HYPE) amplifies both gains and losses. For traders using perpetual contracts as part of an income strategy, the mechanics typically involve funding rate arbitrage, directional speculation with controlled position sizing, or hedging spot holdings.
Funding rate arbitrage involves taking a position in a perpetual contract and an offsetting position in the spot market, profiting from the periodic funding payments that long or short positions must pay depending on market conditions. Perpetual futures contracts include a funding rate mechanism to keep the contract price anchored to the spot price. When the perpetual trades above spot, longs pay shorts. When it trades below, shorts pay longs. The rate resets periodically, often every eight hours. If the funding rate is consistently positive and you hold a short position in the perpetual while holding the underlying asset in spot, you collect the funding payment without taking directional exposure.
That strategy is not new. It has been available on offshore platforms for years. What changes with a CFTC-compliant offering is that the strategy becomes legally accessible to US users without relying on offshore platforms that either bar US users in their terms or operate in a gray area. The tax treatment of funding rate income from a CFTC-registered futures contract is also clearer. Futures contracts are typically subject to Section 1256 treatment under the Internal Revenue Code, which taxes gains and losses at a blended rate: 60% long-term capital gains and 40% short-term, regardless of holding period. That treatment is more favorable than ordinary income rates applied to many forms of crypto-to-crypto trading. However, perpetual contracts may not automatically receive Section 1256 treatment, and the IRS has not issued specific guidance on crypto perpetuals offered through FCMs. The structure suggests Section 1256 treatment is likely, but until the IRS clarifies, users should consult a tax professional.
For users interested in leveraged long positions on BTC or ETH, the 10x leverage Robinhood is offering is lower than the 50x or 100x available on offshore platforms. That is a feature, not a limitation. Higher leverage increases liquidation risk and is the mechanism through which many retail users have lost their entire account balance in a single adverse move. The CFTC's margin rules are designed to limit excessive leverage precisely because the agency views such leverage as a consumer protection issue. The 10x cap Robinhood is offering reflects the regulatory constraint, but it also reduces the likelihood of total account loss from a moderate price swing.
The contracts Robinhood is offering do not include delivery or settlement in the underlying cryptocurrency. They are cash-settled in dollars. That means users cannot use these contracts as a mechanism to accumulate actual Bitcoin or Ethereum. They are purely derivative instruments. For users seeking to earn income from [DeFi protocols](https://altcoininvestor.com/best-defi-protocols/) or staking, this product does not serve that function. It is a trading instrument, not a custody or staking vehicle.
## What the Bitstamp Acquisition Enabled

Robinhood completed its acquisition of Bitstamp in June 2025\. Bitstamp held licenses in multiple jurisdictions and had operational infrastructure for both spot and derivatives trading. When Robinhood announced the US perpetual futures plan, it specified that the contracts would operate through Bitstamp. That decision reflects both the technical and regulatory groundwork Bitstamp had already completed.
Bitstamp was offering perpetual futures to European customers before the acquisition. In July 2026, after the acquisition closed, Bitstamp by Robinhood expanded its perpetual offerings to include commodities, ETFs, and foreign exchange alongside crypto. That expansion signaled that Robinhood intended to use Bitstamp's infrastructure to build a multi-asset derivatives platform, not just a crypto futures offering.
The Robinhood Derivatives entity is separate from the Robinhood brokerage. That separation is a regulatory requirement. Futures trading must occur through an FCM, which is a distinct regulatory category from a securities broker-dealer. By routing the perpetual futures through Robinhood Derivatives and using Bitstamp's infrastructure, Robinhood is structuring the offering to comply with CFTC requirements while integrating the product into its consumer app experience.
For users, that integration matters. Offshore platforms require separate account creation, often without the same identity verification and fund protection rules that apply to US-regulated entities. A user who already holds a Robinhood account and qualifies for the perpetual futures offering will access the product within the same app interface, with the same customer service structure, and under the same regulatory oversight as their other Robinhood holdings. That reduces friction and increases the likelihood that retail users will adopt the product.
## What This Does Not Resolve
The CFTC's case-by-case review process for perpetual contracts remains in place. Robinhood's offering does not constitute a blanket approval for all crypto perpetuals. Each contract tied to a specific asset must proceed through review. The CFTC approved the KalshiEX Bitcoin perpetual in May 2026, and Robinhood is now offering BTC, ETH, SOL, XRP, DOGE, ADA, LINK, and HYPE perpetuals. The agency has not published a list of assets that qualify as commodities under its jurisdiction, and the SEC continues to assert that many digital assets are unregistered securities.
The jurisdictional question matters for two reasons. First, if the SEC were to classify an asset as a security, the CFTC would lack authority to oversee futures contracts tied to that asset. Security-based futures fall under SEC jurisdiction, and the SEC has not approved security-based perpetual futures. Second, if a platform offers a perpetual contract on an asset the SEC later determines to be a security, that platform could face enforcement action.
Robinhood's decision to offer perpetuals on BTC and ETH is the safest from a jurisdictional standpoint. The CFTC has long treated Bitcoin as a commodity, and the SEC approved spot Ethereum ETFs in 2024, which implies agency acknowledgment that ETH is not a security under the current regulatory framework. The inclusion of SOL, XRP, DOGE, ADA, LINK, and HYPE introduces more jurisdictional uncertainty. The SEC has not issued definitive statements classifying these assets as commodities, and some have been the subject of enforcement actions or ongoing litigation.
That uncertainty does not prevent Robinhood from offering the contracts, but it does mean users should understand that the regulatory treatment of these assets could shift. If the SEC were to take enforcement action asserting that one of these assets is a security, the perpetual contract tied to it could be subject to regulatory challenge. Robinhood's use of a CFTC-registered FCM provides some insulation, but it does not eliminate the jurisdictional risk entirely.
The tax treatment of funding rate income from these contracts is also unresolved. Section 1256 treatment applies to regulated futures contracts, but the IRS has not issued guidance confirming that crypto perpetuals offered through CFTC-registered FCMs qualify. Until that guidance is issued, users should keep detailed records of all trades, funding rate payments, and realized gains or losses, and should work with a tax professional familiar with both futures and cryptocurrency taxation.
## What This Signals About Institutional and Regulatory Trajectory
Robinhood's announcement is the first time a major consumer brokerage has committed to offering CFTC-compliant crypto perpetual futures domestically. That is a precedent. If the product launches without significant operational or regulatory obstacles, other brokerages will likely follow. The fee structure Robinhood is offering (0.01% per trade through the end of 2026) is low enough to compete with offshore platforms, and the regulatory compliance structure provides advantages those platforms cannot match.
For institutional market participants, the existence of a CFTC-compliant perpetual futures market in the US creates a venue for hedging and arbitrage strategies that were previously accessible only through offshore platforms or CME futures contracts. CME offers Bitcoin and Ethereum futures, but those contracts are monthly or quarterly, not perpetual, and they do not include the full range of assets Robinhood is offering. The introduction of perpetual contracts on a broader set of assets, offered through a CFTC-regulated entity, expands the toolkit available to institutional desks trading crypto derivatives.
The CFTC's willingness to approve crypto perpetuals on a case-by-case basis is a signal that the agency is treating these products as part of its commodity derivatives jurisdiction rather than as something outside the regulatory framework. That stance contrasts with the SEC's enforcement-first approach to many crypto products. The CFTC's approach provides a pathway for compliant product development, which is what the US market has lacked for most crypto derivatives products.
Whether that pathway expands to include additional assets or additional product structures depends on the CFTC's continued willingness to approve contracts through its review process. The agency has not committed to approving all crypto perpetuals, and the case-by-case review leaves room for the CFTC to reject contracts tied to assets it does not view as commodities. The trajectory is toward greater regulatory clarity for crypto derivatives, but the process remains case-specific.
## The Takeaway
Robinhood's plan to offer perpetual futures on BTC, ETH, and six other crypto assets through a CFTC-registered FCM is the first time a major consumer brokerage has committed to offering this product structure domestically. The compliance pathway was opened by the CFTC's May 2026 approval of the KalshiEX Bitcoin perpetual, and Robinhood is building on that precedent. The structure provides customer fund protections, domestic regulatory oversight, and likely favorable tax treatment under Section 1256, though IRS guidance has not yet confirmed that. The contracts are cash-settled, do not involve delivery of the underlying asset, and are capped at 10x leverage for BTC and ETH. The product opens legally compliant access to funding rate arbitrage and leveraged directional strategies for US retail users, but it does not resolve jurisdictional uncertainty for assets the SEC may classify as securities. The trajectory is toward greater regulatory clarity for crypto derivatives, and this offering sets a precedent other brokerages are expected to follow if the launch proceeds without operational or enforcement obstacles.
## Frequently Asked Questions
### What makes Robinhood's perpetual futures different from offshore platforms?
Robinhood Derivatives is a CFTC-registered futures commission merchant, which means customer funds must be segregated, margin requirements are subject to regulatory oversight, and enforcement is domestic. Offshore platforms offering perpetual swaps operate outside US regulatory oversight, lack customer fund protections, and expose users to counterparty risk without legal recourse under US law.
### What is funding rate arbitrage and how does it work with perpetual contracts?
Funding rate arbitrage involves taking a position in a perpetual contract and an offsetting position in the spot market, profiting from periodic funding payments. When the perpetual trades above spot, longs pay shorts. When it trades below, shorts pay longs. If you hold a short perpetual position while holding the underlying asset in spot, you collect funding payments without taking directional exposure.
### Does Section 1256 tax treatment apply to crypto perpetual futures?
Section 1256 typically taxes regulated futures contracts at a blended rate of 60% long-term and 40% short-term capital gains regardless of holding period. Robinhood's CFTC-registered structure suggests Section 1256 treatment is likely, but the IRS has not issued specific guidance confirming that crypto perpetuals offered through FCMs qualify. Users should consult a tax professional and maintain detailed records.
### Why did Robinhood cap leverage at 10x for BTC and ETH?
The 10x leverage cap reflects CFTC margin rules designed to limit excessive leverage as a consumer protection measure. Higher leverage available on offshore platforms increases liquidation risk and is the mechanism through which many retail users lose their entire account balance in a single adverse move. The regulatory constraint reduces the likelihood of total account loss from moderate price swings.
### What jurisdictional uncertainty remains for the assets Robinhood is offering?
The CFTC treats Bitcoin and Ethereum as commodities, but the agency has not published a definitive list of assets within its jurisdiction. The SEC continues to assert that many digital assets are unregistered securities. If the SEC were to classify SOL, XRP, DOGE, ADA, LINK, or HYPE as securities, the CFTC would lack authority to oversee futures contracts tied to those assets, and the perpetual offerings could face regulatory challenge.
The Weekly Yield Report
You have just read how the CFTC opened a compliance pathway for perpetual futures that Robinhood is now using. That pathway may expand to more assets or face jurisdictional challenges as SEC enforcement continues.
Every Thursday: where crypto yield actually is - stablecoins, liquid staking and DeFi lending, with the risk named next to the rate and what changed since last week.
[Get it free every Thursday](#/portal/signup)
Free. No trade calls, no allocations, no hype. Unsubscribe in one click.
### Why Marinade mSOL Yield Dropped 1.19pp And What It Signals
URL: https://altcoininvestor.com/why-did-marinade-msol-yield-drop/
Last updated: 2026-09-30T02:06:18.000Z
## Where The 1.19 Percentage Points Went
Marinade's mSOL yield fell from 6.0% to 4.81% on roughly $229 million in total value locked. That is a 1.19-percentage-point drop, and if you hold $300,000 in mSOL, the decline costs you $3,570 annually going forward. The question worth answering is whether the drop reflects temporary validator churn or a permanent shift in the yield mechanism that produces mSOL returns.
The answer is structural. Three changes drove the decline, and two of them are not reversing. Validator commission caps tightened from 10% to 7%, permanently reducing the margin available to stakers. Marinade's validator set contracted from 126 active validators at the end of Q3 2025 to 73 by the end of Q4 2025, concentrating delegation and reducing competition. MEV reward distribution shifted as network activity moderated, making fee-derived yield more volatile than the inflation-based returns that dominated earlier epochs.
This is not the first time a liquid staking token has repriced its yield after its underlying economics changed. European sovereign debt markets spent 2011 through 2013 watching advertised yields on Greek and Portuguese bonds move inversely to credibility, where higher nominal rates signaled higher default risk, not higher returns. The mSOL situation is different in character but similar in structure: the advertised APY reflected conditions that no longer hold, and the market is repricing the yield to match the new cost structure.
## The Commission Cap And What It Does To Yield

Marinade enforces a maximum effective validator commission of 7%, factoring in offsets from its Stake Auction Marketplace. That cap dropped from 10%. The 3-percentage-point reduction does not translate one-for-one into staker yield loss, because the SAM mechanism allows validators to bid back a portion of their commission in exchange for stake delegation. But the tightened cap reduces the baseline margin from which those bids are made, and over time that compresses the aggregate yield available to mSOL holders.
Validator commissions are the first claim on staking rewards. Solana's base inflation provides the majority of network rewards, and validators take their commission before distributing the remainder to stakers. When the cap tightens, the residual available for distribution falls unless offset by growth in MEV, priority fees, or network activity. In the period surrounding the yield drop, none of those offsets grew enough to compensate.
The parallel here is the European Central Bank's refinancing rate adjustments during the sovereign debt crisis. When the ECB tightened, it reduced the margin available to peripheral banks funding their operations through ECB facilities, and those banks passed the cost to depositors. The mechanism is different, but the transmission is the same: a change in the baseline rate structure compresses downstream returns.
For a $300,000 position, a 1.19-percentage-point drop represents $3,570 per year. That is the difference between $18,000 annually at 6.0% and $14,430 at 4.81%. Whether that loss is permanent depends on whether validator competition through SAM can recover the margin lost to the commission cap. The evidence so far suggests it cannot. Marinade's [validator selection algorithm](https://altcoininvestor.com/best-crypto-staking-platform/) distributes 100% of TVL through SAM each epoch, rebalancing to the highest-yielding validators, but if the entire validator set operates under the same 7% cap, there is no competitive advantage to exploit.
## Validator Consolidation And The Risk It Introduces

Marinade delegated to 126 validators at the end of Q3 2025\. By the end of Q4 2025, that number had fallen to 73\. The 42% reduction in active validators matters because it reduces the diversity of yield sources and increases the concentration risk within the remaining set. When fewer validators compete for delegation, the marginal incentive to bid aggressively through SAM declines, and the average commission paid by stakers rises.
This is validator attrition, not validator rotation. The protocol did not replace lower-performing validators with higher-performing ones; it simply lost validators. That consolidation reflects broader trends in Solana staking economics, where smaller validators exit as inflation declines and MEV capture becomes more technically demanding. Validators running the Jito client capture MEV rewards, but not all validators run Jito, and those that do not are increasingly uncompetitive.
The result is a two-tier validator market. The top tier runs MEV-optimized clients, captures priority fees, and bids competitively through SAM. The lower tier does not, and over time those validators either upgrade or exit. Marinade's validator count reflects that bifurcation. The 73 remaining validators are presumably the ones capable of running competitive infrastructure, but their reduced number means mSOL holders are exposed to a narrower set of operators.
European banking union history provides a useful parallel. When the ECB introduced stricter capital requirements after 2008, smaller banks either merged or exited, leaving the eurozone with fewer but ostensibly stronger institutions. That consolidation reduced systemic fragility in theory but increased concentration risk in practice, because the failure of any remaining institution carried larger consequences. Marinade's validator consolidation follows the same pattern: fewer validators may mean more reliable operators, but the stakes are higher if any of them underperform.
Marinade's Protected Staking Rewards framework mitigates this risk to some extent. PSR requires validators to post SOL bonds, and those bonds compensate stakers when validators suffer extended downtime or raise commissions mid-epoch. The system covers losses caused by low credits or commission increases, using the validator's bond to make stakers whole. That is a meaningful protection, but it does not address the structural issue: if the entire validator set is smaller, the aggregate yield opportunity is smaller, and no bond mechanism can recreate yield that was never captured in the first place.
## MEV Dependency And Fee-Derived Yield Volatility
Solana's SIMD-96 implementation directed 100% of priority fees to validators, shifting the composition of staking rewards from pure inflation to a mix of inflation and fee revenue. That change made staking yields more dependent on network usage, which is both more sustainable over the long term and more volatile in the short term. When network activity spikes, fee-derived yield rises. When activity moderates, fee-derived yield falls.
Marinade stakes to validators running the Jito client, which captures MEV by including profitable transaction ordering in blocks. MEV rewards flow to validators and are distributed to stakers. In periods of high network activity, those rewards can add 1 to 2 percentage points to the base staking yield. In quieter periods, MEV contribution declines, and the yield reverts closer to the base inflation rate minus validator commission.
The 1.19-percentage-point drop in mSOL yield occurred during a period when Solana network activity had moderated from prior peaks. That moderation reduced the MEV and fee revenue component of staking rewards, exposing the structural pressure from the tightened commission cap and reduced validator count. The result was a yield that better reflected the new baseline economics: lower inflation, tighter commissions, fewer validators, and less MEV.
This is not temporary. Solana's inflation schedule is disinflationary by design, declining toward a long-run rate around 1.5%. As inflation falls, the relative importance of fee-derived yield rises, but fee-derived yield is usage-driven and inherently variable. That makes mSOL's yield more sustainable in the sense that it depends on real economic activity on the network, but less predictable in the sense that it fluctuates with that activity.
The parallel is the shift in European sovereign bond yields from central bank support to market-determined pricing. During the ECB's quantitative easing programs, yields on Italian and Spanish debt remained compressed regardless of fiscal conditions, because the ECB was buying. When those programs ended, yields repriced to reflect the actual fiscal position of each country. Marinade's yield is repricing in a similar way: from inflation-supported returns to usage-supported returns, with all the volatility that entails.
## The Decision Tree For Position Adjustment
Whether to hold, exit, or add to an mSOL position depends on the size of the position, the availability of alternatives, and your tolerance for yield volatility. The decision is different at $50,000 than it is at $500,000.
For positions under $100,000, the yield difference between mSOL at 4.81% and alternatives may not justify the liquidity and depeg risk inherent in moving capital. Native Solana staking yields approximately 5.73% before validator commission, which nets to around 5.3% to 5.5% depending on the validator. That is 0.5 to 0.7 percentage points higher than mSOL, but native staking requires a full epoch cooldown (two to three days) to unstake, and there is no instant liquidity. Jito's jitoSOL offers 7.2% to 7.8% with MEV capture, but Jito's higher yield reflects higher MEV efficiency, not a structural advantage, and that efficiency could narrow if Marinade's validator set improves its MEV capture over time.
For positions between $100,000 and $500,000, the yield differential becomes material. A $250,000 position loses $2,975 annually at 4.81% compared to the prior 6.0% rate, and $3,725 annually compared to jitoSOL at 7.2%. At this scale, monitoring Marinade's validator selection through the SAM dashboard becomes worth the time. If SAM bid spreads tighten, indicating renewed validator competition, mSOL's yield may recover. If bid spreads remain wide or widen further, indicating that validators are not competing aggressively, the yield is likely to remain depressed or decline further.
For positions above $500,000, the structural protections available through Marinade Select or regulated products become relevant. Marinade Select is designed for institutional allocations, and the Canary Marinade Solana ETF, launched in November 2025, passes 100% of staking yield to investors. The ETF structure provides regulatory oversight and custodial safeguards that are not available in direct LST holdings. For positions of this size, the 1.19-percentage-point yield drop is a $3,570 loss on every $300,000 held, and the structural changes driving the drop suggest that loss is not temporary.
The alternative is to exit to native staking or to a higher-yielding LST, accepting the transaction costs and liquidity risk that come with moving capital. Marinade offers instant unstaking through DEX routes, but that incurs higher fees and potential slippage. Native staking requires the full epoch cooldown. The calculus depends on how long you intend to hold the position and whether you believe Marinade's validator set will recover competitiveness.
## What The Yield Drop Signals About Solana Staking Economics
The drop in mSOL yield is not unique to Marinade. It reflects broader changes in Solana staking economics as the network transitions from inflation-dominated rewards to fee-dominated rewards. That transition is visible across all liquid staking tokens, though Marinade's validator consolidation and commission cap pressure accelerated the repricing.
The liquid staking ratio on Solana reached 17.6% at the end of Q4 2025, up from 11.6% the prior quarter. That growth indicates increasing adoption of LSTs, but it also indicates that more of the network's staking yield is being intermediated through protocols like Marinade, Jito, and others. As those protocols compete for delegation, the margin available to each declines, and that margin compression eventually transmits to stakers.
Solana's total staked supply is approximately 67.67% of eligible supply, roughly 430 million SOL worth close to $28 billion. That is a high staking participation rate, and it leaves limited room for yield expansion through increased delegation. The yield available to stakers is constrained by inflation, which is declining, and by fee revenue, which is variable. Neither source is likely to produce the 6.0%+ yields that were common in 2024 and early 2025 unless network activity grows substantially.
The historical parallel is the German Bund market in the late 2010s, when yields turned negative as the ECB's deposit rate went below zero. Investors holding Bunds were paying for the privilege of holding a safe asset, because the alternative was holding uninsured deposits at a negative rate. Solana staking is not at that point, but the direction is the same: [yields are compressing](https://altcoininvestor.com/lrt-vs-lst/) as inflation declines and as protocol intermediation increases, and the result is a lower equilibrium yield across all staking products.
## The Takeaway
Marinade's 1.19-percentage-point yield drop from 6.0% to 4.81% is structural, not temporary. Validator commission caps tightened, the validator count fell by 42%, and MEV revenue moderated with network activity. Those three factors are not reversing. The yield may recover modestly if validator competition through SAM intensifies or if network activity increases, but the baseline has reset lower.
For holders of six-figure positions, the yield differential compared to alternatives has become material. A $300,000 position loses $3,570 annually at the current 4.81% rate compared to the prior 6.0%, and $7,170 compared to jitoSOL at 7.2%. Whether to stay, exit, or add depends on your view of Marinade's validator competitiveness and your tolerance for yield volatility. The structural protections offered by PSR mitigate downside risk from validator underperformance, but they do not create yield that the validator set is not capturing.
The broader signal is that Solana's staking economics are transitioning from inflation-supported to fee-supported, and that transition produces lower and more variable yields. European monetary history suggests that transitions of this kind reprice assets quickly once the market recognizes the change. The mSOL repricing is that recognition.
## Frequently Asked Questions
### Why did Marinade mSOL yield drop from 6.0% to 4.81%?
Three structural changes drove the 1.19-percentage-point decline. Validator commission caps tightened from 10% to 7%, reducing the margin available to stakers. Marinade's active validator count fell 42% from 126 to 73, concentrating delegation and reducing competition. MEV and priority fee revenue moderated as Solana network activity declined from prior peaks. These are not temporary conditions; the yield has repriced to reflect new baseline economics.
### Is the mSOL yield drop temporary or permanent?
The drop is structural and unlikely to reverse fully. The validator commission cap at 7% is a protocol-level constraint, and validator consolidation reflects broader Solana staking economics as smaller operators exit. MEV revenue may increase with network activity, but Solana's disinflationary schedule means base staking rewards will continue declining. The yield may recover modestly, but the baseline has reset lower and will remain more volatile as fee-derived rewards replace inflation-based returns.
### What should I do with a six-figure mSOL position after the yield drop?
The decision depends on position size and alternatives. For $100,000 to $500,000 positions, the yield differential compared to jitoSOL (7.2%-7.8%) or native staking (5.3%-5.5%) is material, costing $2,000 to $7,000 annually. Monitor Marinade's Stake Auction Marketplace for validator bid spreads; if competition does not tighten, consider rotating to higher-yielding LSTs. For positions above $500,000, evaluate Marinade Select or the Canary Marinade Solana ETF for institutional protections and yield pass-through.
### How does Marinade's Protected Staking Rewards address yield risk?
PSR requires validators to post SOL bonds that compensate stakers for losses caused by extended downtime or mid-epoch commission increases. The framework covers underperformance on a validator-by-validator basis, protecting against individual operator failure. However, PSR does not address structural yield compression from tightened commission caps or reduced validator counts. It mitigates execution risk but cannot create yield the validator set is not capturing in the first place.
### How does mSOL yield compare to other Solana liquid staking tokens?
As of September 2026, mSOL yields approximately 5.95%, while jitoSOL yields 7.2% to 7.8% due to more efficient MEV capture. Native Solana staking yields around 5.73% before commission, netting 5.3% to 5.5% depending on validator. The median LST yield is 6.5% to 7.0%. Marinade's yield is lower because its validator commission cap and reduced validator count limit competitive bidding through SAM. Higher-yielding LSTs reflect better MEV infrastructure or lower protocol take rates.
The Weekly Yield Report
You have just reviewed the three structural factors that drove Marinade's 1.19-percentage-point yield drop and the position decision tree for six-figure holders. Those factors and those alternatives will have changed by next quarter.
Every Thursday: where crypto yield actually is - stablecoins, liquid staking and DeFi lending, with the risk named next to the rate and what changed since last week.
[Get it free every Thursday](#/portal/signup)
Free. No trade calls, no allocations, no hype. Unsubscribe in one click.
### Maple USDG vs Aave USDe: Which Stablecoin Position Is Safer?
URL: https://altcoininvestor.com/maple-usdg-vs-aave-usde-which-is-safer-2/
Last updated: 2026-09-30T00:03:38.000Z
## The Choice You're Actually Making

Maple USDG offers 4.96% APY on $408 million in TVL. Aave V3 USDe delivers 4.75% on $1.085 billion. Both sit above 4 percent, both clear the $400 million liquidity threshold, and both pay in stable dollar terms.
The allocation decision between them is not about which rate looks better today. It's about which revenue model survives market stress, which TVL base supports your entry and exit size, and what percentage of a portfolio should concentrate in each based on historical rate durability.
Here's the analysis framework for comparing Maple USDG and Aave USDe based on yield sustainability, protocol maturity, and allocation sizing, not simple APY ranking.
## Yield Source: Where The 4.7-5% Actually Comes From

Maple USDG derives yield from institutional loan interest. Real borrowers (trading firms, market makers, crypto-native funds) pay 9 to 14 percent APY on undercollateralized and overcollateralized credit. The protocol takes a spread, and the remainder flows to lenders. The 4.96% APY reflects loan interest minus pool management fees.
This is a mechanical revenue link. Yield exists because someone else is paying interest on borrowed capital. If the borrowers stop paying, the yield stops, but the mechanism is transparent and auditable on-chain.
Aave USDe works differently. Aave V3 is the venue, not the yield source. USDe itself maintains its peg by holding spot crypto collateral while taking offsetting short positions in perpetual futures markets. The yield comes from capturing the funding rate differential, which fluctuates with market volatility and leverage demand.
When perp funding rates compress, USDe yield compresses. sUSDe (the staked, yield-bearing version of USDe) delivered double-digit APYs through mid-2025, then compressed to roughly 5 percent as funding cooled. That's a 50 percent-plus yield decline in six months, driven entirely by macro leverage conditions.
The Aave layer adds smart contract risk and liquidation mechanics on top of USDe's basis trade exposure. You are stacking two distinct risk categories to access the 4.75% rate.
### Rate Durability Comparison
Maple's yield is tied to institutional borrowing demand, which correlates with crypto volatility but does not evaporate when perp funding rates invert. The protocol outperformed the industry benchmark by 117 basis points at an APY of 4.765 percent against a benchmark of roughly 3.590 percent in May 2026.
Aave USDe yield is contingent on positive funding rates in perpetual futures markets. If funding inverts (shorts paying longs), USDe yield can compress toward zero or require subsidies. The rapid TVL decline from $14.8 billion in October 2025 to $7.6 billion six months later signals that allocators exited when yields compressed and leverage unwound.
If you need predictable yield for 12 months, Maple USDG offers a more stable revenue foundation. If you're prepared to rotate when funding conditions change, Aave USDe can deliver competitive rates during high-volatility periods.
## TVL As Liquidity And Sophistication Filter

TVL is not a quality signal by itself, but it functions as a proxy for two things: exit liquidity and protocol maturity under stress.
Maple USDG sits at $408 million TVL, concentrated in a single product. The broader Maple protocol holds $2.1 billion across Ethereum and Solana, making it the largest institutional lending venue in DeFi. But the USDG pool specifically has limited depth for rapid multi-million-dollar exits without slippage or delay.
Aave V3 holds $12.552 billion in active loans and $14.49 billion in parent protocol TVL as of May 2026\. Deep, multi-asset liquidity across 21 chains means you can enter and exit $100 million-plus positions without material price impact or queue risk.
The tradeoff: Aave's TVL is down 52 percent from its November 2025 peak of $30.25 billion. That's a $15.76 billion capital outflow in six months, much of it driven by the unwinding of leveraged USDe looping strategies. High TVL with rapid decline signals that a large portion of capital was mercenary, chasing leveraged yield and exiting when rates compressed.
Maple's smaller TVL base is more stable but less liquid. Aave's larger base is more liquid but has demonstrated significant capital rotation risk during market stress.
### What The TVL Decline Tells You
Aave's 52 percent TVL drawdown from November 2025 through May 2026 was not a protocol failure. It was a deleveraging event. Users deposited USDe as collateral, borrowed against it, bought more USDe, and looped the strategy to amplify yield. When funding rates compressed and volatility spiked, those positions unwound rapidly.
The April 2026 Kelp DAO bridge exploit cascaded into Aave liquidations, generating roughly $196 million in bad debt and triggering $6.6 billion in withdrawals. That's an example of composability risk: a failure in one protocol (Kelp) propagated into another (Aave) through shared collateral and leverage.
Maple has not experienced a comparable cascade event post-restructuring, but it did face a high-profile default in 2022 (Orthogonal Trading). The protocol restructured around stricter underwriting and segregated pool management, which reduced credit risk but also narrowed the borrower base and constrained yield upside.
If you are allergic to leverage-driven TVL volatility, Maple's smaller, more stable base is preferable. If you prioritize deep liquidity and can tolerate short-term capital rotation, Aave's scale supports larger allocations despite recent outflows.
## Protocol Maturity And Security Track Record
Maple launched in 2021, restructured after the 2022 Orthogonal default, and rebuilt around a stricter underwriting framework. The Maple-Core V2 protocol has undergone 7-plus audits, completed by top-tier firms like Spearbit/Cantina, Three Sigma, and 0xMacro. The [security documentation](https://github.com/maple-labs/maple-core/wiki/Security) is public and granular.
Aave has a longer operational history and handled over $1.1 billion in liquidations across more than 100,000 events without issue. But Aave V3 experienced a March 2026 oracle manipulation incident involving $862,000\. That's a small absolute loss relative to TVL, but it demonstrates that oracle risk persists even at scale.
Oracle manipulation is a different risk category than credit default. Maple's risk is counterparty credit (will the borrower repay?). Aave's risk is oracle accuracy and liquidation cascade contagion (will the price feeds break, and will liquidations propagate into bad debt?).
Both protocols are mature by DeFi standards. Maple is smaller and more specialized. Aave is larger, more liquid, and more complex. The March 2026 incident is a reminder that complexity introduces attack surface, even in battle-tested protocols.
### Regulatory And Structural Exposure
The GENIUS Act, which passed the Senate in 2025 and is moving through House reconciliation, explicitly excludes yield-bearing stablecoins from the category of "payment stablecoins" available to retail users in the United States. That definition would cover both USDG and USDe.
If the regulatory framework tightens, yield-bearing stablecoins could face restrictions on retail distribution, KYC requirements, or protocol-level compliance burdens. Maple operates as an institutional lending venue, already oriented toward accredited or sophisticated allocators. Aave is permissionless and retail-accessible, which could create friction if retail participation in yield-bearing stablecoins is restricted.
This is not an immediate risk, but it's a structural consideration for multi-year allocations. Protocols with institutional orientation (Maple) may adapt more easily to regulatory tightening than permissionless lending markets (Aave).
## Allocation Sizing Framework
Allocating $300,000 across Maple USDG and Aave USDe yields $14,565 annually at current rates. The sizing question is not whether to allocate, but how much to each and under what conditions to rotate.
Here's the framework I use:
### Maple USDG Allocation Cap
Cap Maple USDG at 10 to 15 percent of total stablecoin allocation if you are prioritizing rate stability and credit-backed yield. The $408 million TVL supports up to $40 million in institutional allocations without meaningful slippage, but rapid exit could require multiple days if liquidity is shallow.
For allocators with $200,000 to $500,000 in total stablecoin positions, that translates to $20,000 to $75,000 in Maple USDG. The yield is durable, the revenue model is transparent, and the protocol has restructured around stricter credit controls.
Exit if: (1) the institutional borrower base contracts visibly (check loan book composition quarterly), (2) yield compresses below 4 percent for two consecutive months, or (3) a credit event triggers pool-level defaults.
### Aave USDe Allocation Cap
Cap Aave USDe at 5 to 10 percent of total stablecoin allocation if you are comfortable with funding rate volatility and can monitor perp market conditions weekly. The $1.085 billion TVL and $12.552 billion Aave V3 loan book support deep liquidity, but the 52 percent TVL decline over six months demonstrates capital rotation risk.
For allocators with $200,000 to $500,000 in total stablecoin positions, that translates to $10,000 to $50,000 in Aave USDe. The yield is competitive when funding rates are positive, the liquidity is deep, and the protocol is battle-tested.
Exit if: (1) perp funding rates invert for more than two weeks, (2) USDe yield compresses below 3.5 percent, or (3) Aave TVL declines more than 20 percent in a single month, signaling coordinated deleveraging.
### Combined Allocation Strategy
A balanced approach allocates 60 percent to Maple USDG and 40 percent to Aave USDe if you want to capture both credit-backed and funding-rate-backed yield while mitigating single-protocol risk. That structure prioritizes durability (Maple) while maintaining access to deep liquidity (Aave).
If Aave funding rates compress or TVL declines accelerate, rotate the Aave allocation into [mature stablecoin positions](https://altcoininvestor.com/how-to-earn-passive-income-stablecoins-2026/) with lower yield but higher stability (e.g., Compound USDC, which pays 3.5 to 4 percent with $8 billion-plus TVL).
If Maple borrower concentration increases or loan book composition shifts toward higher-risk counterparties, reduce Maple allocation and shift into diversified lending pools or [money market fund equivalents](https://altcoininvestor.com/stablecoin-yield-vs-money-market/).
## Edge Cases And Stress Scenarios
Two edge cases matter for both positions:
### Robinhood Earn Subsidy Risk
Robinhood Earn advertises 7 percent APY for depositors using syrupUSDG, but Morpho data shows the underlying USDG vault on Robinhood Chain pays 1.9 percent APY, with the USDe/USDG Morpho market showing 2.5 percent. The difference suggests Robinhood is subsidizing yield with a Merkl campaign that could support the 7 percent target up to vault TVL of approximately $2 billion.
If Robinhood ends the subsidy or caps vault size, syrupUSDG yield will compress toward the base rate (roughly 2 to 2.5 percent), making Maple USDG less competitive. Monitor Robinhood's public communications and Merkl campaign budgets quarterly.
### Leverage Unwind Contagion
USDe's TVL decline from $14.8 billion to $7.6 billion was driven by leveraged looping strategies unwinding. If you allocate to Aave USDe during a high-leverage regime and a deleveraging cascade begins, your position will be stable (assuming no liquidation), but exit liquidity will compress as other allocators rush to withdraw.
The Kelp DAO exploit demonstrated this: $6.6 billion in withdrawals over 72 hours created queue delays and slippage even for non-liquidated positions. If you need guaranteed exit liquidity within 24 hours, avoid Aave USDe during periods when TVL is declining more than 10 percent per month.
## Who Each Position Is Right For
Maple USDG is the better choice if you prioritize yield stability, prefer credit-backed revenue models, and can tolerate moderate exit liquidity constraints. It suits allocators with $50,000 to $500,000 in stablecoins who want exposure to institutional lending without managing individual loan underwriting.
Aave USDe is the better choice if you prioritize deep liquidity, can monitor funding rate conditions weekly, and are comfortable with yield volatility tied to perp market dynamics. It suits allocators with $100,000-plus in stablecoins who want competitive rates during high-volatility periods and need the ability to exit large positions within 24 hours.
If you cannot monitor positions weekly or adjust allocations quarterly, neither position is appropriate. Both require active management. [Systematic review processes](https://altcoininvestor.com/track-defi-yield-positions-efficiently/) are not optional for positions above 5 percent of portfolio value.
## My Recommendation
Allocate to Maple USDG first. The yield source is more durable, the protocol has restructured around stricter credit controls, and the revenue model does not depend on perp funding rates staying positive. Cap allocation at 10 to 15 percent of total stablecoin holdings.
Add Aave USDe as a secondary position only if you are actively monitoring perp funding rates and can tolerate yield compression from 4.75 percent to 3 percent within six months. Cap allocation at 5 to 10 percent of total stablecoin holdings, and treat it as a tactical position that rotates based on funding conditions.
Do not allocate to either position if your total stablecoin holdings are below $50,000\. The yield advantage over Compound USDC or [simpler stablecoin vehicles](https://altcoininvestor.com/stablecoins/) is only 1 to 1.5 percentage points, and the risk-adjusted return does not justify the monitoring overhead for smaller allocations.
If you are allocating more than $200,000 to stablecoins and want exposure to both credit-backed and funding-rate-backed yield, split 60 percent Maple USDG and 40 percent Aave USDe. That structure captures durability from Maple and liquidity from Aave while limiting single-protocol concentration.
## The Takeaway
The decision between Maple USDG and Aave USDe is not about which rate looks higher today. It's about which yield source survives the next six months of market stress. Maple's institutional loan interest is more predictable than Aave's perp funding rate exposure, but Aave's TVL supports deeper liquidity for large allocations. Allocate to Maple first, add Aave tactically, and [monitor TVL outflows](https://altcoininvestor.com/defi-tvl-outflow-meaning/) more closely than headline APY. Rate compression happens faster than most allocators expect, and the protocols with durable revenue models outlast the ones chasing leverage-driven yield.
## Frequently Asked Questions
### Which is safer, Maple USDG or Aave USDe?
Maple USDG offers more predictable yield because it derives from institutional loan interest, not perp funding rates. Aave USDe exposes you to both Aave smart contract risk and USDe basis trade risk, with yield that can compress 50 percent or more when funding rates decline. For stability, Maple is safer. For liquidity and exit speed, Aave's deeper TVL supports larger allocations.
### How much of my portfolio should I allocate to Maple USDG?
Cap Maple USDG at 10 to 15 percent of total stablecoin allocation. The $408 million TVL supports institutional allocations up to $40 million, but exit liquidity can be constrained for rapid withdrawals. For allocators with $200,000 to $500,000 in stablecoins, that translates to $20,000 to $75,000 in Maple USDG, prioritizing yield durability over maximum liquidity.
### Why did Aave V3 TVL decline 52 percent from November 2025?
The decline was driven by deleveraging of USDe looping strategies. Users deposited USDe as collateral, borrowed against it, bought more USDe, and looped to amplify yield. When perp funding rates compressed and volatility spiked, those positions unwound rapidly. The April 2026 Kelp DAO exploit accelerated withdrawals, generating $196 million in bad debt and triggering $6.6 billion in outflows.
### What happens if USDe yield compresses below 3.5 percent?
If USDe yield compresses below 3.5 percent, rotate your Aave USDe allocation into mature stablecoin positions like Compound USDC, which pays 3.5 to 4 percent with $8 billion-plus TVL and no perp funding rate dependency. USDe yield is tied to perpetual futures funding rates, which can invert during low-volatility or bearish conditions, making the position uncompetitive against simpler alternatives.
### Can I allocate to both Maple USDG and Aave USDe simultaneously?
Yes. A balanced approach allocates 60 percent to Maple USDG and 40 percent to Aave USDe if you want both credit-backed and funding-rate-backed yield. This structure prioritizes durability (Maple) while maintaining access to deep liquidity (Aave). Monitor both positions weekly and rotate if Maple borrower concentration increases or Aave funding rates invert for more than two weeks.
The Weekly Yield Report
You just compared two stablecoin positions paying 4.75 to 4.96 percent, one backed by institutional loans and one by perp funding rates. Those rates and TVL levels will shift next quarter.
Every Thursday: where crypto yield actually is - stablecoins, liquid staking and DeFi lending, with the risk named next to the rate and what changed since last week.
[Get it free every Thursday](#/portal/signup)
Free. No trade calls, no allocations, no hype. Unsubscribe in one click.
### How To Detect A DeFi Protocol Exploit Before Twitter
URL: https://altcoininvestor.com/how-to-detect-defi-protocol-exploit-early/
Last updated: 2026-09-29T23:03:35.000Z
## How Do You Detect A DeFi Protocol Exploit Early?

You watch wallet movements, not team announcements. [Q2 2026 logged 70 exploits and $746 million in losses](https://thedefiant.io/news/hacks/q2-2026-most-hacked-quarter-defi-70-exploits-746m), double the previous quarterly record. In most cases, the funds drained within the first five minutes after the attack started. The teams posted explanations hours or days later.
The readers who preserved capital weren't the ones refreshing Discord. They were monitoring deployer wallet activity, tracking LP withdrawal patterns, and running alerts on unusual contract interactions. The signals appeared 6-48 hours before public disclosure, while exit liquidity still existed.
If you hold a six-figure DeFi position and you're relying on governance announcements to warn you of risk, you're structurally late. The useful question is not "what happened" but "what can I see on-chain before the protocol freezes or the liquidity drains."
## The Attack Pattern Shifted In 2026
Three of the four largest incidents in 2026 involved zero lines of flawed Solidity. The contracts executed exactly as programmed. The attackers didn't exploit a bug. They obtained access they shouldn't have had, then fed the contracts fraudulent instructions.
Compromised accounts now represent more than 50% of all DeFi attacks by incident count. Infrastructure-layer attacks accounted for 63% of May's total dollar losses. Kelp DAO lost $292 million after a forged bridge message following off-chain verifier compromise. Drift Protocol lost $285 million when attackers seized multisig authority, then manipulated collateral and oracle parameters.
Humanity Protocol bled $30 million after a foundation member's private key was stolen. The attacker drained 17 Ethereum wallets, extended the exploit to BNB Chain, seized proxy admin control, and minted 100 million new tokens worth $12.9 million.
The shift matters because traditional smart contract exploits show up in code audits or formal verification. Access-based attacks show up in behavior. Wallet movements. Contract upgrade patterns. Multi-step transactions that do too much at once. If you're waiting for a Certora report to flag the risk, the money is already gone.
## Top LP Withdrawals: The First Signal That Matters

Large liquidity providers move first, before retail sees the headline. Tracking sizable LP deposits and withdrawals reveals position timing. Setting alerts for transactions above a pre-set value threshold enables real-time detection of whale activity.
You care about persistent withdrawals, not one-off exits. A single whale pulling $2 million from a Curve pool could mean rebalancing. Three whales pulling $6 million combined over 18 hours signals information asymmetry. Someone knows something you don't.
Whales have an outsized effect on DEXs. A whale removing liquidity from a pool doesn't just shrink TVL. It widens spreads, increases slippage, and makes subsequent exits more expensive. The later you move, the worse your execution. Persistent withdrawals from protocols generally signal whale risk-off. Large exchange deposits indicate potential sell-offs and bearish positioning.
Nansen tracks Smart Money inflows and outflows, new token holder growth, liquidity pool movements, and exchange deposit patterns. Traders use it to monitor fund portfolio changes and narrative traction across ecosystems. If you hold a position over $50,000, you should be running alerts on the top 20 LP addresses in your pool. When three of them exit within 24 hours, you exit too.
## Deployer And Admin Wallet Movements
The Zoth exploit confirmed the risks of centralized control in smart contract deployment. The deployer wallet held admin privileges to the proxy contracts. Once compromised, a malicious delegate was deployed. The protocol lost $8.4 million.
A deployer wallet that has been dormant for 18 months doesn't randomly wake up to "optimize gas settings." When a wallet or tight cluster of wallets controls upgrade keys, pause rights, mint functions, or treasury access, you monitor every transaction. Not monthly. Every transaction.
Production monitoring systems deliver sub-second updates for major pools using direct RPC subscriptions. You normalize reserves, virtual prices, and liquidity positions, then configure notifications for critical events. If the deployer wallet interacts with the protocol's proxy admin contract outside a scheduled governance vote, that's your cue.
Tenderly and Forta enable runtime monitoring of deployed contracts, detecting anomalous transactions or unexpected state changes. You're not looking for normal operations. You're looking for privilege escalation, unauthorized upgrades, or fund transfers from treasury wallets that haven't moved in months.
## On-Chain Contract Interaction Anomalies
Systems can detect exploits in near real-time with bounded computation and memory overhead through lightweight, incremental design that continuously processes transaction traces. On-chain monitoring focuses on detecting compromises in deployed smart contracts and their dependencies.
You watch for privileged transactions, implementation changes, abnormal pool movements, and multi-step transactions bundled in ways that don't match the protocol's normal operating pattern. A typical Aave borrow involves two or three contract calls. A transaction that touches seven contracts, moves funds through three intermediary wallets, and interacts with an external price oracle in the same block is not typical.
Automated alert systems in liquidity pool smart contracts flag irregular transactions or patterns indicative of security breaches or manipulative activities. Prompt detection facilitates immediate action, reducing the risk of significant financial loss. If you're running a position over $50,000, you should have alerts configured for any transaction originating from the deployer, admin, or multisig wallet that wasn't preceded by a governance proposal.
Watching for sudden, unexplained price movements in low-volume tokens used as collateral serves as an early warning before a protocol becomes the next target. Price manipulation exploits hit 32 DeFi lending protocols in 2026, the highest count on record. The manipulation shows up in price feeds 20-60 minutes before the liquidation cascade begins.
## Governance And Community Silence Patterns
Decentralized protocols and DAOs control significant treasuries. When governance votes allocate funds for development or token buybacks, the resulting on-chain transactions signal the protocol's health and direction. When those transactions stop, or when normal communication patterns break, you pay attention.
A protocol that has posted weekly development updates for 14 consecutive months doesn't go silent for three weeks because the team is "focused on shipping." Silence during periods of unusual on-chain activity is a red flag. Silence combined with deployer wallet activation or abnormal LP withdrawals is a exit signal.
Discord and Telegram channels have ambient activity patterns. Moderators respond to user questions within predictable windows. Core contributors surface in governance threads. When established contributors vanish for 48 hours during a period of elevated on-chain volatility, that divergence is signal, not noise.
## Infrastructure Risk Indicators That Precede Cross-Chain Exploits
Cross-chain trust risk moved toward messaging layers, verifier configurations, shared dependencies, and multi-chain deployments. A LayerZero-powered bridge relying on a single verifier behind a high-value cross-chain path is a structural vulnerability waiting for an attacker to discover it.
Teams must assess the trust assumptions underneath modern cross-chain messaging. Kelp DAO's $292 million loss followed a forged bridge message after off-chain verifier and RPC compromise. The forged message was accepted because the verification layer wasn't sufficiently decentralized. The on-chain signal was visible six hours before the funds moved: an unusual verifier configuration change that wasn't accompanied by a governance proposal.
If you hold assets on a protocol with significant cross-chain exposure, you monitor verifier set changes, bridge contract upgrades, and any modifications to the message validation logic. Those changes should be announced, discussed, and voted on. If they happen silently, you withdraw.
## Real-Time Monitoring Tools For Positions Over $50k
DefiLlama tracks TVL changes in real time. A sudden sharp TVL drop is often the first public signal of an exploit. You configure alerts for any protocol where you hold a position. A 15% TVL drop in under an hour is not normal volatility.
Nansen provides metrics like Smart Money inflows and outflows, holder growth, liquidity pool movements, exchange deposits and withdrawals, and fund portfolio changes. Traders use it for early narrative traction and risk-off signals. If Smart Money is exiting and you're still in, you're the exit liquidity.
Tenderly and Forta offer runtime monitoring with anomaly detection. You set thresholds for gas consumption, transaction complexity, and state changes. A transaction that consumes 4x the normal gas to execute a "standard" function call is worth inspecting before it completes.
Hashlock and similar services provide automated monitoring for governance, treasury, and deployer wallet activity. You receive alerts within seconds when a privileged address initiates a transaction. For a six-figure position, the subscription cost is a rounding error compared to the capital you're protecting.
The combination of [monitoring the right protocols](https://altcoininvestor.com/best-defi-protocols/), tracking the right wallets, and setting the right thresholds gives you a 12-36 hour warning window. That window is the difference between exiting at 98 cents on the dollar and recovering 11 cents three months later after the team announces a "fair distribution plan for affected users."
## The Failure Mode No One Talks About
Private key exposure, phishing, and infrastructure weaknesses play a larger role than traditional smart contract bugs. The majority of 2026 incidents affecting private users were driven by phishing, social engineering, and malicious approval signatures rather than code vulnerabilities.
Several DeFi protocols were hit by smart contract flaws and design weaknesses, including pricing manipulation and minting logic failures. But the dollar-weighted losses came from access-based attacks. Truebit Protocol lost $26.44 million through an unchecked integer overflow in a legacy bonding-curve contract. That's a code bug. Kelp DAO and Drift lost a combined $577 million because attackers obtained keys and admin access. That's an operational failure.
The on-chain signals for operational failures are behavioral, not static. You can't audit your way out of a stolen deployer key. You can monitor the deployer wallet and exit when it activates outside normal governance windows.
## When The Signals Don't Matter
Not every LP withdrawal is a precursor to collapse. Not every deployer transaction signals compromise. [Normal protocol operations generate noise](https://altcoininvestor.com/defi-false-alarm-signals/) that looks like risk if you don't understand the context.
A scheduled contract upgrade following a successful governance vote is not an exploit signal, even if the deployer wallet activates. A large LP exiting because they're rotating into a higher-yield opportunity is not information asymmetry. TVL dropping 8% after a competing protocol launches with better incentives is not a security event.
You distinguish signal from noise by understanding the protocol's normal operating rhythm. Read the governance forum. Track historical upgrade patterns. Know the top LPs and their historical behavior. When behavior diverges from the established baseline without explanation, that's when you act.
## What To Do In The First 48 Hours
You have a binary decision tree. Either the signals represent elevated risk, or they don't. If three top LPs withdraw, the deployer wallet activates outside governance windows, and the core contributors go silent on Discord, you don't wait for confirmation. You exit.
The cost of a false positive is gas fees and the opportunity cost of being out of the pool for a few days. The cost of ignoring real signals is losing 89% to 100% of your position. [In most exploits, 54% to 93% of funds drain in the first five minutes](https://altcoininvestor.com/defi-exploit-what-to-do/). If you're waiting for the team to confirm the exploit, you're competing for the last 7% of liquidity with every other late mover.
When you see converging signals, you withdraw to a hardware wallet or stablecoin position, then wait. If the protocol announces an upgrade or explains the activity within 72 hours, you reassess. If the protocol goes dark or announces a "temporary pause due to abnormal activity," you've already preserved your capital.
## The Takeaway
Smart contract risk shows up in behavior before it shows up in headlines. The 12-36 hour window between observable on-chain anomalies and public disclosure is the only period where exit liquidity exists at reasonable prices. You cannot rely on governance announcements, team updates, or post-mortem reports to protect a six-figure position. By the time the explanation is posted, the liquidity is gone. Monitor deployer and admin wallet activity, track top LP withdrawals, configure alerts for contract interaction anomalies, and exit when multiple signals converge. One preserved position justifies the monitoring cost permanently.
## Frequently Asked Questions
### What on-chain signals appear before a DeFi protocol exploit becomes public?
The most reliable early signals include unusual withdrawals by top liquidity providers (especially when three or more large LPs exit within 24 hours), unexpected deployer or admin wallet activation outside scheduled governance windows, multi-step transactions that touch more contracts than normal operations require, and sudden TVL drops of 15% or more within an hour. These signals typically precede public disclosure by 6-48 hours, while exit liquidity still exists at reasonable prices.
### How do I monitor deployer wallet activity for a DeFi protocol?
Use tools like Tenderly, Forta, or Hashlock to set up real-time alerts for any transaction originating from deployer, admin, or multisig wallets. Configure alerts to trigger on wallet activation, especially for wallets that have been dormant or that initiate transactions not preceded by governance proposals. Production monitoring systems using direct RPC subscriptions can deliver sub-second notifications. For positions over $50,000, automated monitoring is essential because manual checking introduces dangerous latency.
### What TVL drop indicates a protocol exploit versus normal volatility?
A sudden TVL drop of 15% or more within a single hour, especially when not accompanied by broader market sell-offs or announced protocol changes, warrants immediate investigation. DefiLlama tracks TVL changes in real time and can be configured to alert on sharp declines. Normal volatility rarely produces drops exceeding 10% in under an hour unless there's a major market event affecting all protocols. When TVL decline coincides with top LP withdrawals and deployer wallet activation, you should exit immediately.
### How much does it cost to set up real-time exploit monitoring for DeFi positions?
Basic monitoring using free tools like DefiLlama TVL alerts and manual Etherscan wallet watching costs nothing but time. Mid-tier setups using Nansen for Smart Money tracking run approximately $150 per month. Enterprise monitoring with Tenderly, Forta, or Hashlock for automated alerts on governance, treasury, and deployer activity ranges from $200-$600 monthly depending on the number of protocols and alert complexity. For a six-figure DeFi position, even the high-end cost represents a negligible insurance premium compared to potential total loss.
### What should I do if I see multiple exploit warning signals converging?
Exit immediately to a hardware wallet or stablecoin position without waiting for official confirmation. The cost of a false positive is gas fees and temporary opportunity cost. The cost of ignoring converging signals is potential loss of 89-100% of your position, since most exploits drain 54-93% of funds within the first five minutes. After exiting, monitor official channels for 72 hours. If the protocol explains the activity satisfactorily, you can reassess reentry. If the protocol announces a pause or goes silent, you've preserved capital while others are competing for the last fragments of exit liquidity.
The Weekly Yield Report
You just learned the six on-chain signals that precede 70% of protocol exploits by 12-36 hours. Those patterns will evolve as attackers adapt.
Every Thursday: where crypto yield actually is - stablecoins, liquid staking and DeFi lending, with the risk named next to the rate and what changed since last week.
[Get it free every Thursday](#/portal/signup)
Free. No trade calls, no allocations, no hype. Unsubscribe in one click.
### SparkLend DAI At 2.71% vs Aave DAI At 3.07%: Where The Liquidity Moved
URL: https://altcoininvestor.com/sparklend-vs-aave-dai-yield-liquidity-migration/
Last updated: 2026-09-29T22:03:21.000Z
## The Decision: Where to Deploy $200,000 in DAI

You hold a $200,000 DAI position and need to choose where to lend it. SparkLend offers 2.71% on $287M TVL. Aave offered 3.07% on $17M TVL before the market disappeared. The 0.36 percentage point spread looks like Aave wins. The liquidity migration tells a different story.
SparkLend grew to $287-298M in DAI deposits while Aave's DAI supply market shrank to legacy status. The capital moved despite the lower rate. The question is not which rate is higher today. The question is which mechanism sustains that rate tomorrow when market conditions change.
This is a decomposition of why liquidity migrated from Aave to Spark, what structural differences explain the durability gap, and which venue a six-figure DAI position should use in 2026.
## Rate Structure: Market-Driven vs Governance-Set

Aave V3 uses a utilization-based rate model. When DAI borrow demand rises, supply APY rises. When demand falls, APY falls. The 3.07% rate you saw was a snapshot of a specific utilization level at a specific moment. If borrow demand dropped to 10%, your rate would have compressed to sub-1%. If utilization spiked to 90%, your rate could have reached 8%. The mechanism is responsive but not predictable.
SparkLend uses governance-defined rates that do not vary with utilization. The 2.71% rate is set by Sky governance and held constant regardless of borrow demand. This is possible because Spark's Liquidity Layer supplies stablecoin liquidity to the protocol from Sky's balance sheet. When borrow demand exceeds lender supply, the Liquidity Layer fills the gap. When lender supply exceeds demand, the Liquidity Layer absorbs the excess.
The trade-off is clear. Aave's rate responds to market conditions in real time. Spark's rate responds to governance decisions on a multi-week cadence. For a lender, the question is whether you want exposure to borrow demand volatility or governance policy volatility.
For a $200,000 position, governance volatility is more predictable. You can monitor Sky governance proposals and exit before a rate cut executes. You cannot predict when Aave borrow demand will collapse and compress your yield to zero. The Aave DAI market's disappearance proves this: the utilization model did not sustain lender interest when demand fell.
## Backing Mechanism: Protocol Revenue vs Borrow Demand

Aave's DAI supply rate is paid by DAI borrowers. If borrowers disappear, the rate disappears. This is not theoretical. MakerDAO disabled the DAI Direct Deposit Module in June 2022, cutting off Aave's largest source of subsidized DAI borrow demand. The supply rate collapsed. Lenders exited. The market became illiquid.
SparkLend's DAI rate is paid by Sky protocol revenue. Sky earns fees from overcollateralized crypto loans, U.S. Treasury bill holdings, and liquidity provisioning. As of 2026, Sky holds over $2 billion in real-world assets, primarily short-term T-bills. The protocol generates consistent revenue regardless of on-chain borrow demand.
The DAI Savings Rate is the mechanism that routes this revenue to lenders. When you lend DAI on SparkLend, you are effectively holding sDAI, a yield-bearing wrapper that accrues DSR. The DSR is funded by Sky's balance sheet. The rate is not dependent on whether someone wants to borrow your DAI today. It is dependent on whether Sky's Treasury position continues generating yield.
This is a structural moat. [Stablecoin lending rates](https://altcoininvestor.com/how-to-earn-passive-income-stablecoins-2026/) on utilization-based protocols compress when borrow demand falls. SparkLend's rate compresses only when Sky governance votes to lower the DSR. The former is market risk. The latter is governance risk. For a large position, governance risk is observable and exits are plannable.
## Liquidity Persistence: Why Aave DAI Disappeared
Aave V3 holds $19.4 billion in total value locked across all assets. It is the largest lending protocol by TVL. But TVL depth does not translate into per-asset yield durability. Aave's DAI market shrank because the utilization model could not sustain competitive rates when the D3M was disabled.
The Direct Deposit Module was MakerDAO's subsidy mechanism for Aave. It allowed Aave to borrow DAI directly from the Maker Protocol at 0% interest, up to a governance-set debt ceiling. This subsidized borrow demand kept Aave's DAI utilization artificially high, which kept supply rates elevated. When MakerDAO turned off the D3M in June 2022 due to Celsius contagion concerns, the subsidy disappeared. Borrow demand normalized. Supply rates collapsed. Lenders moved capital elsewhere.
SparkLend launched in May 2023 as Sky's vertically integrated lending venue. The protocol inherited the D3M's functionality through direct integration with the DSR and Sky's Liquidity Layer. Instead of subsidizing a third-party protocol, Sky built its own. The revenue that previously flowed to Aave borrowers now flows to Spark lenders.
This explains the liquidity migration. Lenders did not chase a 0.36pp spread. They moved to the venue that controls the subsidy mechanism. SparkLend's $287M DAI TVL is not a bet on higher rates. It is a bet on rate durability backed by Sky's Treasury.
## Architectural Overlap: Aave V3 Contracts Under Sky Governance
SparkLend uses Aave V3 contracts under a Sky governance-approved license. The contract code is nearly identical. Configurations, asset listings, and rate-setting mechanisms differ, but the core lending logic is the same. This creates both risk correlation and functional equivalence.
If Aave V3 suffers a critical contract bug, Spark is exposed. If Spark's governance is captured and lists a malicious asset, Aave is not affected, but Spark lenders are. The shared codebase means [smart contract risk is correlated](https://altcoininvestor.com/defi-protocol-governance-changes-yield/). Governance risk is isolated.
For a lender comparing the two, this means you are not diversifying smart contract risk by splitting a position between Spark and Aave. You are splitting governance risk. If you trust Sky governance more than Aave governance, consolidate on Spark. If you trust Aave's governance and want exposure to utilization-driven rates, use Aave. If you want to hedge governance risk, split your position across protocols with different codebases, not different governance layers on the same codebase.
The architectural overlap also means feature parity. Both support flash loans, eMode (high-efficiency mode for correlated assets), isolation mode, and siloed borrowing. Both use the same liquidation logic and oracle infrastructure. The difference is not what the protocol can do. The difference is how the protocol sets rates and who controls those parameters.
## Rate Floor Sustainability: DSR as Monetary Policy Tool
The Sky Savings Rate is not a yield-maximization mechanism. It is a monetary policy lever. When Sky wants to attract USDS and DAI liquidity, the DAO raises the SSR. When Sky wants to push capital into productive deployments like lending or liquidity provisioning, the DAO lowers it.
The SSR peaked at 12% in early 2024\. By November 2025 it had dropped to 3.5%. As of April 2026 it sits at 5.5%. These are not market-driven fluctuations. These are governance decisions tied to Sky's balance sheet strategy and broader DeFi liquidity conditions.
This means SparkLend's rate floor is tied to Sky's Treasury management goals, not to DAI borrow demand. If Sky decides it needs to contract DAI supply, it will lower the DSR and Spark's rate will follow. If Sky decides it needs to attract liquidity to backstop a new initiative, it will raise the DSR and Spark's rate will rise.
The failure mode is not "borrow demand disappears and your rate goes to zero." The failure mode is "Sky governance votes to lower the DSR and your rate drops to 1%." The former is unpredictable. The latter is visible in governance forums days or weeks before execution. For a $200,000 position, the latter is manageable. You monitor Sky's governance forum, track DSR proposals, and exit before a rate cut executes if the new rate no longer meets your return threshold.
Aave's failure mode is "borrow demand disappears and your rate compresses immediately." There is no governance vote. There is no warning period. The utilization model adjusts in real time. For a large position, this is exit risk. You cannot plan a withdrawal around an event you cannot predict.
## Comparison Table: Spark vs Aave For DAI Lending
- **Rate Setting:** Spark uses governance-defined rates. Aave uses utilization-based rates. Spark is predictable but slow to respond. Aave is responsive but volatile.
- **Backing:** Spark is backed by Sky protocol revenue and Treasury holdings. Aave is backed by borrower demand. Spark's rate persists when demand falls. Aave's does not.
- **TVL:** Spark holds $287M in DAI. Aave's DAI market is legacy with minimal supply. Liquidity migrated to Spark after the D3M was disabled.
- **Smart Contract Risk:** Both use Aave V3 contracts. Risk is correlated. Splitting a position across both does not diversify this risk.
- **Governance Risk:** Spark is controlled by Sky governance. Aave is controlled by Aave governance. These risks are independent.
- **Rate Floor:** Spark's floor is set by the DSR, currently 5.5%. Aave's floor is 0% when utilization is zero. Spark's floor is durable. Aave's is not.
- **Exit Predictability:** Spark rate changes are visible in governance proposals before execution. Aave rate changes happen in real time with utilization. Spark allows planned exits. Aave does not.
## Who Each Option Is Right For
Use SparkLend if you are deploying a six-figure or larger DAI position and need rate predictability. The governance-set rate structure means you can model yield over a 3-6 month horizon without worrying about utilization shocks. You can monitor Sky governance for DSR proposals and exit before a rate cut if the new rate does not meet your threshold. The DSR backing means the rate persists even when on-chain borrow demand collapses.
Use Aave if you are deploying a smaller position and want exposure to borrow demand spikes. When DAI utilization rises, Aave's supply rate rises faster than Spark's. If you are actively managing a position and can tolerate rate volatility, Aave offers upside when demand is high. But understand that the same utilization model that drives rates up will drive them down when demand falls. The lack of a rate floor means you are betting on sustained borrow demand.
Avoid Aave for passive DAI lending. The market's disappearance after the D3M was disabled proves that utilization-based rates do not sustain lender interest when subsidy mechanisms vanish. If you are not actively monitoring utilization and ready to move capital when rates compress, you will wake up to a 0.5% APY and no liquid exit.
Avoid SparkLend if you do not trust Sky governance. The protocol's rate durability depends entirely on Sky's willingness to maintain the DSR at competitive levels. If Sky governance is captured or decides to prioritize Treasury returns over lender yield, your rate will drop and you will have no recourse except exit. [Governance concentration is a single point of failure](https://altcoininvestor.com/best-stablecoin-yield-comparison/).
## Recommendation: SparkLend for Positions Above $50,000
For a $200,000 DAI position, SparkLend is the correct venue. The 0.36pp rate disadvantage is offset by rate floor durability and exit predictability. The DSR backing means your yield does not disappear when borrow demand falls. The governance-set rate structure means you can plan exits around DSR proposals rather than reacting to real-time utilization changes.
The liquidity migration from Aave to Spark is not a temporary phenomenon. It is a structural shift driven by MakerDAO's decision to vertically integrate its lending subsidy mechanism. Sky controls the DSR. Sky controls SparkLend. The revenue that previously flowed to Aave now flows to Spark. Unless Sky decides to re-enable subsidies for third-party protocols, this dynamic persists.
The architectural overlap between Spark and Aave means you are not diversifying smart contract risk by splitting your position. Both use Aave V3 contracts. A bug in one affects the other. If you want to diversify, split your position across [SparkLend](https://defillama.com/protocol/sparklend) and a protocol with different contract logic, such as Compound V3 or Morpho.
The failure mode to monitor is Sky governance. If the DSR drops below 3%, re-evaluate. If Sky proposes lowering the DSR to 1% or removing it entirely, exit before the proposal executes. Governance votes are visible in Sky's forum and typically have a multi-day delay before execution. This gives you time to withdraw and redeploy.
Aave remains viable for smaller positions or for lenders who want exposure to utilization-driven rate spikes. But for a $200,000 position that needs predictable yield over a 6-12 month horizon, SparkLend's governance-backed rate floor is more durable than Aave's market-driven model.
## The Takeaway: Follow the Capital, Not the Spread
The 0.36pp spread between SparkLend and Aave is noise. The $270M liquidity migration from Aave to Spark is signal. Capital moved because SparkLend's rate is backed by Sky's Treasury, not by borrow demand. When the D3M was disabled, Aave's subsidy disappeared and lenders exited. SparkLend inherited that subsidy through direct DSR integration. The rate floor is governance-controlled but durable. For a six-figure DAI position, durability beats spread.
Monitor Sky governance for DSR proposals. If the DSR drops below 3%, re-evaluate. If it drops below 2%, exit. The rate floor is the mechanism that makes Spark viable. If Sky removes it, the advantage disappears.
## Frequently Asked Questions
### Why did liquidity move from Aave to SparkLend despite Aave's higher rate?
MakerDAO disabled the DAI Direct Deposit Module in June 2022, removing Aave's subsidized borrow demand. Aave's utilization-based rate collapsed when borrow demand fell. SparkLend launched with direct DSR integration, inheriting the subsidy mechanism. Lenders moved to the venue controlling the subsidy. The $287M migration prioritized rate durability over the 0.36pp spread. SparkLend's governance-backed rate floor persists when market demand falls. Aave's market-driven rate does not.
### What backs SparkLend's DAI lending rate?
SparkLend's rate is paid by Sky protocol revenue, primarily from U.S. Treasury bill holdings, overcollateralized crypto loans, and liquidity provisioning fees. Sky holds over $2 billion in real-world assets. The DAI Savings Rate routes this revenue to lenders. When you lend on SparkLend, you hold sDAI, which accrues DSR. The rate is not dependent on borrower demand. It is dependent on Sky's Treasury yield and governance decisions to maintain the DSR.
### Do SparkLend and Aave share smart contract risk?
Yes. SparkLend uses Aave V3 contracts under a Sky governance-approved license. The core lending logic is identical. If Aave V3 has a critical bug, Spark is exposed. Splitting a position across both does not diversify smart contract risk. It splits governance risk. To diversify contract risk, use protocols with different codebases like Compound V3 or Morpho. The architectural overlap means feature parity but correlated technical risk.
### What is the failure mode for SparkLend's DAI rate?
The failure mode is Sky governance voting to lower or remove the DSR. The rate floor is set by governance, not market demand. If Sky decides to lower the DSR below 2%, your yield compresses. This is visible in governance proposals days or weeks before execution. You can monitor Sky's forum and exit before a rate cut. The risk is governance policy change, not utilization collapse. For Aave, the failure mode is borrow demand disappearing with no warning.
### Should a $200,000 DAI position use SparkLend or Aave?
SparkLend. The governance-backed rate floor is more durable than Aave's utilization-driven model for large positions. You can monitor Sky governance for DSR changes and plan exits before rate cuts execute. Aave's rate compresses in real time when borrow demand falls, with no warning. The 0.36pp spread favoring Aave is offset by exit risk. For passive six-figure positions, rate predictability matters more than marginal spread. Monitor the DSR and exit if it drops below 3%.
The Weekly Yield Report
You just compared two venues where one controls the subsidy and the other lost it. That subsidy level will change when Sky governance votes next quarter.
Every Thursday: where crypto yield actually is - stablecoins, liquid staking and DeFi lending, with the risk named next to the rate and what changed since last week.
[Get it free every Thursday](#/portal/signup)
Free. No trade calls, no allocations, no hype. Unsubscribe in one click.
### What Aave V3 USDe's 4.16pp Drop Reveals About Ethena Yield
URL: https://altcoininvestor.com/aave-usde-yield-dropped-ethena-sustainability/
Last updated: 2026-09-29T21:04:09.000Z
## What Caused the Aave V3 USDe Supply Rate to Collapse
Between early September and September 28, 2026, Aave V3's USDe supply rate dropped from 4.75% to 0.59% - a 4.16 percentage point collapse that erased $12,480 in annual yield on a $300,000 position. The break was not an Aave bug or a liquidity crisis. It was the predictable outcome of a leverage loop unwinding when the spread between borrowing costs and staking yield inverted.
The mechanism worked like this. Depositors supplied USDe to Aave. Borrowers took USDe loans at a variable rate, converted the borrowed USDe into sUSDe (Ethena's staked version), and earned the sUSDe yield. As long as sUSDe yield exceeded Aave's USDe borrow rate, the trade was profitable. Borrowers paid, say, 5% to borrow USDe and earned 7% on sUSDe - a 200 basis point spread. That spread drove demand for USDe borrows, which raised Aave's borrow rate via the interest rate model. Higher borrow rates attracted more USDe suppliers, who earned a share of that borrow demand. The loop fed itself.
The loop broke when two things happened simultaneously. First, Aave governance raised the USDe base variable borrow rate from 5% to 6%, then to 6.6% on September 28\. Second, Ethena's sUSDe yield compressed to 5.01% as perpetual funding rates declined and Ethena rotated collateral into stablecoins and tokenized treasuries that earn lower baseline yields without funding exposure. By September 9, borrowing USDe to stake into sUSDe became unprofitable. The borrow rate (6.02%-6.39% across deployments) exceeded the staking yield (5.01%). Borrowers deleveraged. Utilization dropped. Supply rates collapsed.
On September 12, Aave V3 Ethereum Core showed $639.4 million USDe supplied, $114 million borrowed, and 17.8% utilization. The borrow rate stood at 6.20%. The supply rate, calculated as borrow rate multiplied by utilization minus the protocol reserve factor, dropped to 0.59%. A supplier who deposited $300,000 at 4.75% expected $14,250 annual yield. At 0.59%, that same position yields $1,770 - a $12,480 annual loss.
## How sUSDe Yield Decomposes Into Three Components

To understand why sUSDe yield compressed, you need to decompose where that yield comes from. Ethena's sUSDe is not a traditional stablecoin. USDe is a synthetic dollar backed by a delta-neutral position: long ETH or BTC collateral, short an equivalent notional value in perpetual futures. The delta-neutral structure means USDe does not gain or lose value when ETH or BTC moves. The yield comes from three sources.
First, staking rewards on the long collateral. ETH staking currently pays roughly 3.2% APY. Ethena holds staked ETH (or liquid staking derivatives like stETH) as part of the backing, and that staking yield flows into sUSDe.
Second, perpetual funding rates on the short hedge. When perpetual futures traders are net long - the norm in bull markets - longs pay shorts a funding rate every eight hours. Ethena's short position collects that funding. Funding rates averaged 11% APY over the 2023-2025 cycle, but ranged from -6% in late 2022 to +75% in early 2024\. This component is the primary yield driver and the primary volatility source.
Third, baseline yield on stablecoin or tokenized treasury backing. Ethena has flexibility to rotate collateral. During periods when funding rates compress or turn negative, Ethena can hold a larger share of backing in USDT or tokenized U.S. Treasuries. These assets earn 4-5% baseline yield without funding exposure. In June 2024, when funding compressed, Ethena's stablecoin and treasury share rose to absorb the regime change. This rotation cushions sUSDe yield but compresses the headline number.
As of September 12, sUSDe yield stood at 5.01%. That figure decomposes roughly into 3.2% staking, 0% to -1% funding (depending on the week), and 2-3% from stablecoin or treasury backing. The 5.01% is not magic. It is a weighted average of three constituent parts, and two of those parts can fail simultaneously when funding rates stay negative for weeks.
Ethena retains a portion of revenue in an insurance fund that absorbs negative funding periods. As of April 2026, the reserve stood at $73 million - roughly 1.7% of USDe supply. A sustained regime change (months of negative funding) would erode the reserve and could pressure the peg. The reserve fund is not infinite. It is a buffer, and buffers run out.
## The Leverage Loop Mechanics and Why It Unwound
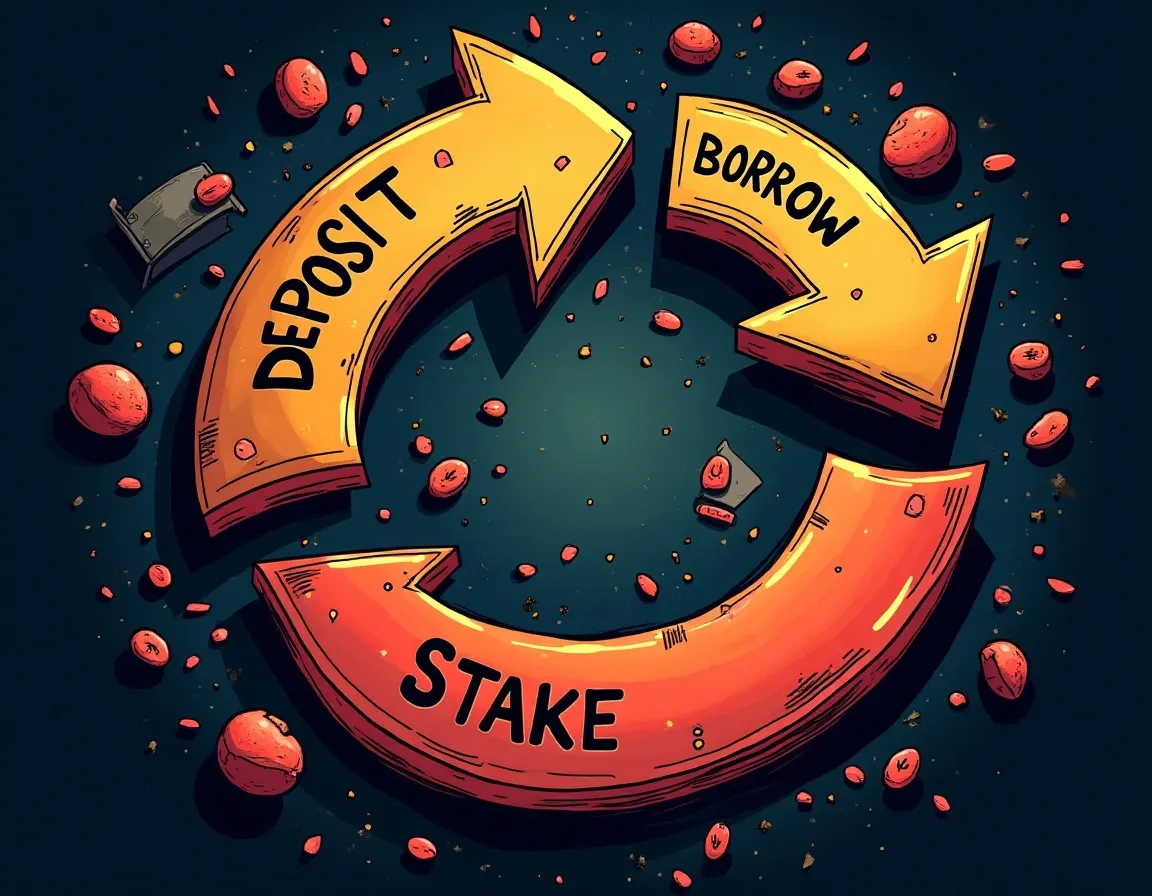
The Aave supply rate collapse was not an Aave problem. It was the visible symptom of a leverage loop unwinding. The loop worked as follows.
Step one: Deposit USDe into Aave V3\. Earn a supply rate that fluctuates with utilization and borrow demand.
Step two: Borrow USDe from Aave at the variable borrow rate. Aave's interest rate model sets this rate based on utilization. Below the optimal utilization point (currently around 90%), the rate rises with a first slope. Above it, the rate rises faster with a second slope.
Step three: Convert borrowed USDe into sUSDe by staking it on Ethena. Earn the sUSDe yield, which at the time of loop initiation was 7-9%.
Step four: Use sUSDe as collateral in Aave (or another protocol) to borrow more USDe. Repeat steps two through four. Each iteration leverages the position further, amplifying the spread between staking yield and borrow cost.
The loop was profitable when sUSDe yield exceeded the USDe borrow rate by at least 100-200 basis points to cover gas, slippage, and liquidation risk. In early September, sUSDe paid 5-7% and Aave's USDe borrow rate sat at 5-5.5%. The spread was tight but positive. Borrowers recycled USDe into sUSDe to capture it.
Aave governance raised the base variable borrow rate from 5% to 6%, then to 6.6% on September 28\. The stated reason: to manage risk exposure to USDe and incentivize deleveraging of recursive positions. Simultaneously, Ethena's sUSDe yield compressed to 5.01% as funding rates declined and Ethena rotated collateral into lower-yielding but more stable backing.
By September 9, the spread inverted. Borrowing USDe at 6-6.6% to earn 5.01% on sUSDe produced a -1 to -1.6 percentage point drag. Borrowers unwound positions. They redeemed sUSDe for USDe, repaid Aave loans, and withdrew collateral. Aave's USDe utilization dropped from mid-teens to single digits on some deployments. Lower utilization mechanically lowers the borrow rate, which lowers the supply rate. The supply rate collapsed to 0.59%.
The loop unwind cascaded across five Aave deployments: Ethereum Core, Plasma, Monad, Mantle, and Avalanche. As of the September 28 proposal, $323.8 million in USDe debt remained across these markets. The deleveraging was not complete, but the profitability threshold had been crossed.
## Utilization Rate Sensitivity Across Chains
The September 28 base rate increase affected each Aave deployment differently depending on local utilization. Ethereum Core, with 17.8% utilization, saw the borrow rate rise to 6.20%. Plasma, at 16.8% utilization, hit 6.39%. Monad, at 6.6% utilization, landed at 6.15%. Mantle, at 0.7% utilization, bottomed at 6.02%.
Low-utilization markets absorb the full base rate increase because the borrow rate is dominated by the base rate plus a small Slope1 contribution. High-utilization markets see the Slope1 component offset some of the base rate hike. The September 28 proposal raised the base rate by 30 basis points but reduced Slope1 by the same amount, creating a neutral effect at the optimal utilization point but raising rates at low utilization.
For suppliers, this means the supply rate is most sensitive to utilization in low-utilization environments. A market sitting at 5% utilization with a 6.6% borrow rate delivers a supply rate near 0.33% (6.6% times 5% utilization, minus reserve factor). A market at 20% utilization with a 6.2% borrow rate delivers 1.24%. Suppliers in low-utilization markets lost the most yield in absolute terms.
Utilization also determines withdrawal liquidity. Below 90%, withdrawals settle instantly. Above 90%, Aave's interest rate model enters the steep Slope2 regime, and borrow rates spike to incentivize repayment. Institutional depositors monitor utilization in real time and set auto-redemption triggers at 85% utilization to avoid withdrawal delays. For a $300,000 position, a 24-hour withdrawal delay during a depegging event could mean the difference between a 2% loss and a 10% loss.
## What sUSDe Yield Thresholds to Monitor
The Aave supply rate is downstream of sUSDe yield. If sUSDe yield stays below 6%, the leverage loop remains unprofitable under current Aave parameters, and Aave supply rates stay compressed. If sUSDe yield recovers above 8%, the loop reinitiates, utilization rises, and supply rates follow.
sUSDe yield tracks three inputs. First, ETH staking yield. This component is stable at 3-3.5% and changes slowly. Monitor the ETH beacon chain participation rate and MEV smoothing pool distributions. If participation drops below 90%, staking yield rises slightly. If MEV share of rewards declines, staking yield compresses.
Second, perpetual funding rates. This is the volatile component. Funding rates correlate with open interest growth and net long positioning. When Bitcoin or Ethereum open interest rises faster than price, funding rates rise. When open interest contracts, funding rates compress or turn negative. Check 7-day average funding rates on Binance, Bybit, and OKX perpetuals. If the 7-day average sits above 15% annualized, sUSDe yield will trend above 7%. If the 7-day average drops below 5%, sUSDe yield will compress toward 4-5%.
Third, Ethena's collateral composition. Ethena publishes a transparency dashboard showing the mix of ETH, BTC, stablecoins, and tokenized treasuries backing USDe. When the stablecoin and treasury share exceeds 30%, it signals Ethena is rotating out of funding-rate exposure to stabilize yield. This rotation compresses headline sUSDe yield but reduces volatility. Monitor the transparency dashboard weekly. If the non-crypto collateral share rises above 40%, expect sUSDe yield to stay below 6% even if funding rates recover.
For Aave suppliers, the actionable threshold is simple. Exit when sUSDe 7-day average yield drops below 6% and Aave's USDe borrow rate stays above 6%. At that spread, the leverage loop stays unwound, utilization stays low, and supply rates stay compressed. Re-enter when sUSDe yield trends above 8% for two consecutive weeks and Aave's borrow rate drops below 6.5%. That spread reinitiates the loop and drives utilization back up.
## Withdrawal Liquidity and Cooldown Risk
Aave and Ethena each impose withdrawal friction. Aave's friction is utilization-dependent. Below 90% utilization, withdrawals settle instantly. Above 90%, withdrawal can take minutes to hours as the protocol rebalances liquidity. Ethena's friction is a fixed 7-day cooldown on unstaking sUSDe to USDe, added in 2024 to manage redemption queues during stress.
For a supplier running the full loop (Aave supply, Aave borrow, sUSDe stake, use sUSDe as collateral), the total exit path involves four steps. First, repay the Aave USDe borrow by redeeming sUSDe. This step triggers the 7-day cooldown. Second, wait seven days. Third, withdraw USDe from Aave. This step is instant if utilization is below 90%, delayed if above. Fourth, off-ramp USDe to fiat or stablecoins on a centralized exchange.
The 7-day cooldown is the binding constraint. If sUSDe yield drops or Ethena's reserve fund shows stress, you cannot exit sUSDe for a week. During that week, sUSDe could depeg if negative funding persists and the reserve depletes. The peg has held so far, but the structural risk is real.
Institutional operators manage this risk by maintaining 25-30% of position size in liquid USDe or USDC outside the loop. If sUSDe shows stress, they can repay Aave borrows immediately using the liquid buffer, then initiate the cooldown on the sUSDe portion without forced selling at a loss. For a $300,000 position, that means keeping $75,000-$90,000 in liquid reserves. The reserves earn lower yield, but they eliminate forced-exit risk.
Monitor Aave utilization in real time using [Ethena's DeFiLlama dashboard](https://defillama.com/protocol/ethena). Set alerts at 85% utilization. At that threshold, initiate withdrawal even if yield looks stable. The cost of exiting early (a few days of foregone yield) is trivial compared to the cost of being stuck above 90% utilization during a deleveraging cascade.
## The Reserve Fund as the Ultimate Backstop
Ethena's reserve fund is the last line of defense when funding rates turn negative. As of April 2026, the fund held $73 million against roughly $5.5-6 billion in USDe supply. That is 1.7% coverage. The fund absorbs short-term negative funding, but it is not sized for sustained regime change.
Run the math. If funding rates average -5% annualized for three months, Ethena's short positions pay out roughly $68.75 million (5.5B supply times 5% annual rate times 0.25 years). The reserve covers it, barely. If funding stays negative for six months at -5%, the payout is $137.5 million. The reserve depletes. At that point, Ethena either raises more capital, reduces USDe supply by restricting minting, or allows sUSDe yield to go negative.
Negative funding is not theoretical. It happened in late 2022 during the post-FTX bear market, when perpetual funding rates stayed negative for eight consecutive weeks. It happened again in mid-2022 during the Terra/Luna collapse, when risk-off positioning pushed funding negative for six weeks. The question is not whether it can happen again. The question is how long the reserve lasts when it does.
Monitor the reserve fund balance on Ethena's transparency dashboard. If the reserve drops below $50 million (under 1% of supply), that is the exit signal. At that level, Ethena has less than two months of buffer if funding stays negative. The peg may hold, but the structural risk no longer justifies the yield.
## When the Loop Reinitiates and Supply Rates Recover
The leverage loop will reinitiate when the spread between sUSDe yield and Aave borrow rates flips positive again. That requires one of two conditions. Either Ethena's sUSDe yield recovers above 7-8% as funding rates rebound in a bull market, or Aave governance lowers the USDe base borrow rate below 5%.
The first condition is cyclical. Funding rates correlate with open interest growth, which correlates with price momentum. If Bitcoin and Ethereum enter a sustained bull phase, open interest will rise, funding rates will rise, and sUSDe yield will follow. Historical data shows funding averaged 11% during the 2023-2025 cycle and spiked to 75% annualized during early 2024\. If funding returns to 15-20% annualized, sUSDe yield will trend toward 9-12%, the loop will reinitiate, and Aave supply rates will recover.
The second condition is governance-dependent. Aave's Risk Stewards can lower the base borrow rate if USDe risk exposure declines or if competitive pressure from other lending markets forces a rate cut. The September 28 proposal raised rates to derisk USDe exposure. A future proposal could reverse that decision if Ethena's reserve fund grows or if USDe supply stabilizes below $4 billion.
For suppliers, the reinitiation signal is a sustained 200 basis point positive spread between sUSDe yield and Aave borrow rate. When sUSDe pays 8% and Aave charges 6%, the loop is profitable again. Utilization will rise, supply rates will follow, and the cycle restarts. Until then, Aave USDe supply is a low-return placeholder that ties up capital better deployed elsewhere.
## Alternative Strategies When Aave USDe Yields Compress
When Aave USDe supply rates drop below 1%, the opportunity cost is significant. A $300,000 position earning 0.59% yields $1,770 annually. The same capital deployed in [higher-tier stablecoin lending](https://altcoininvestor.com/how-to-earn-passive-income-stablecoins-2026/) earns 3.8-5% with lower smart contract risk.
Option one: rotate into USDC or USDT lending on Aave, Compound, or Morpho. As of September 2026, USDC supply rates on Aave V3 Ethereum ranged from 3.2-4.1% depending on utilization. USDT rates sat at 3.8-4.5%. These rates are lower than the 4.75% Aave USDe offered in early September, but they are stable and do not depend on a leverage loop. For a $300,000 position, rotating from 0.59% Aave USDe to 4% Aave USDC adds $10,230 in annual yield.
Option two: hold sUSDe directly instead of supplying USDe to Aave. If sUSDe yields 5.01%, that is 4.42 percentage points higher than Aave's 0.59% supply rate. The trade-off is the 7-day cooldown and the reserve fund risk. For short-term capital (under 90 days), the cooldown is a significant friction. For longer-term capital (over six months), the cooldown is manageable and the yield pickup is worth it.
Option three: exit stablecoin yield entirely and rotate into liquid staking derivatives like stETH or rETH. ETH staking yields 3.2-3.8% with no leverage, no cooldown (for liquid staking tokens), and no dependency on funding rates. The trade-off is ETH price exposure. For allocators willing to hold ETH long-term, [LST yield is structurally more sustainable](https://altcoininvestor.com/lst-yield-sustainability/) than USDe leverage loops.
The income test is simple. Calculate the annual yield difference between your current position and the best alternative. For a $300,000 position, the difference between 0.59% and 4% is $10,230\. If repositioning costs less than $500 in gas and slippage, the move pays for itself in 18 days. Beyond that, every day you stay in compressed Aave USDe is a day of foregone income.
## The Takeaway
The Aave V3 USDe supply rate collapsed from 4.75% to 0.59% because a leverage loop unwound when borrow rates rose above staking yields. The mechanism is not broken. It is cyclical. The loop depended on a positive spread between Ethena's sUSDe yield and Aave's USDe borrow rate. When Aave governance raised the borrow rate to 6.6% and Ethena's sUSDe yield compressed to 5.01%, the spread inverted, borrowers deleveraged, utilization dropped, and supply rates collapsed. For a $300,000 position, that collapse erased $12,480 in annual yield.
The mechanism is legible. sUSDe yield decomposes into three parts: ETH staking (3.2%), perpetual funding rates (currently near zero or negative), and stablecoin or treasury backing (2-3%). When funding stays compressed, sUSDe yield stays below 6%. When sUSDe yields less than Aave's USDe borrow rate, the leverage loop stays unprofitable, and Aave supply rates stay low.
The exit threshold is straightforward. When sUSDe 7-day average yield drops below 6% and Aave's USDe borrow rate stays above 6%, the loop will not reinitiate. Supply rates will stay compressed. Exit and redeploy capital into USDC or USDT lending at 3.8-5%, or hold sUSDe directly at 5.01% if you can tolerate the 7-day cooldown. The reinitiation threshold is equally clear: re-enter when sUSDe yield trends above 8% for two consecutive weeks and Aave's borrow rate drops below 6.5%. At that spread, the loop is profitable again, utilization will rise, and supply rates will follow.
The sustainability question is not whether Ethena's yield will recover. It is whether Ethena's $73 million reserve fund can absorb sustained negative funding without depleting. Monitor the reserve fund balance weekly. If it drops below $50 million, exit regardless of yield. The peg may hold, but the structural risk no longer justifies the return. Until then, the mechanism is sound under specific conditions. Know the conditions. Monitor the thresholds. Exit when they break.
## Frequently Asked Questions
### Why did Aave V3 USDe supply rates drop from 4.75% to 0.59%?
The collapse occurred when Aave governance raised the USDe base borrow rate from 5% to 6.6% while Ethena's sUSDe yield compressed to 5.01%. This inverted the spread that made leveraged staking profitable. Borrowers who had been taking USDe loans to stake into sUSDe for a positive carry deleveraged, causing Aave's USDe utilization to drop. Lower utilization mechanically lowers supply rates under Aave's interest rate model, resulting in the 4.16 percentage point collapse.
### What are the three components of Ethena sUSDe yield?
sUSDe yield decomposes into ETH staking rewards (currently 3.2% APY), perpetual futures funding rates (historically averaging 11% but ranging from -6% to +75%), and baseline yield from stablecoin or tokenized treasury backing (2-3%). The funding rate component is the primary driver and source of volatility. When funding rates compress or turn negative, Ethena rotates collateral into stablecoins and treasuries to stabilize yield, but this rotation lowers the headline sUSDe APY.
### At what sUSDe yield threshold should I exit my Aave USDe position?
Exit when sUSDe's 7-day average yield drops below 6% while Aave's USDe borrow rate stays above 6%. At that spread, the leverage loop that drives Aave utilization and supply rates remains unprofitable, keeping supply rates compressed. Monitor sUSDe yield weekly on Ethena's dashboard and Aave borrow rates on AaveScan. Re-enter when sUSDe trends above 8% for two consecutive weeks and Aave's borrow rate drops below 6.5%, signaling the loop is profitable again.
### How long does it take to withdraw from sUSDe and Aave?
Unstaking sUSDe to USDe requires a 7-day cooldown, added in 2024 to manage redemption queues during stress. After the cooldown, withdrawing USDe from Aave is instant if utilization is below 90%. Above 90%, Aave's steep interest rate curve kicks in and withdrawal can take minutes to hours as the protocol rebalances. For positions running the full leverage loop, the 7-day cooldown is the binding constraint and eliminates the ability to exit quickly if sUSDe shows stress.
### What happens if Ethena's reserve fund runs out during negative funding?
Ethena's $73 million reserve fund absorbs losses when perpetual funding rates turn negative and the protocol's short positions pay rather than collect funding. At current USDe supply of $5.5-6 billion, the fund covers roughly 1.7% of supply. If funding stays negative at -5% annualized for six months, the fund would deplete. At that point, Ethena would need to raise capital, restrict USDe minting to reduce supply, or allow sUSDe yield to go negative, which could pressure the USDe peg.
The Weekly Yield Report
You have just traced a 4.16 percentage point yield collapse to three constituent mechanisms and five cross-chain utilization curves. Those spreads and thresholds will shift again next month.
Every Thursday: where crypto yield actually is - stablecoins, liquid staking and DeFi lending, with the risk named next to the rate and what changed since last week.
[Get it free every Thursday](#/portal/signup)
Free. No trade calls, no allocations, no hype. Unsubscribe in one click.
### Uniswap V3 USDC-WETH Pool: Two Major Yield Collapses
URL: https://altcoininvestor.com/uniswap-v3-usdc-eth-apy-unstable/
Last updated: 2026-09-29T19:04:55.000Z
## Why Is Uniswap V3 USDC-WETH APY So Unstable?

The USDC-WETH pool on Uniswap V3 dropped from 15.88% to 11.73% APY in March 2025, a 4.15-percentage-point collapse on $99M TVL. This is the second major decline in the same pair this quarter. [Weeks earlier, the pool fell 10.65 percentage points](https://altcoininvestor.com/uniswap-v3-usdc-eth-yield-spike-march-2025/) from its previous peak.
Two collapses in 90 days suggest either structural instability in the pool itself or systematic reallocation across Uniswap's fee tiers. The answer matters for position sizing: if the pool cannot sustain advertised rates, then oversizing into it captures high yields briefly before locking in losses on the drop.
The underlying question is simple. Is this pool a high-yield opportunity with periodic turbulence, or is it a yield trap that reliably reverts to the mean after brief spikes?
## The Mechanism Behind The Collapse

Uniswap V3 offers four fee tiers: 0.01%, 0.05%, 0.3%, and 1.0%. Liquidity providers choose which tier to deploy capital into, and APY is a function of trading volume divided by total liquidity in that tier. When liquidity flows into a tier without a proportional increase in trading volume, APY compresses.
The $99M USDC-WETH pool that dropped from 15.88% to 11.73% sits in the higher-fee tier structure. At the same time, [alternative data from DefiLlama](https://defillama.com/yields/pool/665dc8bc-c79d-4800-97f7-304bf368e547) shows the same pair at $99.4M with 7.77% APR on a 7-day view and 12.70% on a 30-day view. The divergence indicates that capital is fragmented across multiple fee tiers, and LPs are rotating between them.
A separate 0.3% USDC-WETH tier shows 5.60% APY with $21M TVL and a stability rating of 64.2\. The presence of multiple active tiers for the same pair confirms that LPs are not treating this as a single unified pool. They are actively choosing between execution tiers based on expected fee income after protocol drag.
### Protocol Fee Switch And LP Take-Rate
In December 2025, Uniswap governance approved the "UNIfication" proposal, enabling protocol fees on selected V3 pools. The fee switch redirects approximately one-sixth of swap fees from liquidity providers to the protocol, depending on the pool's fee tier.
The protocol fee does not change the execution price paid by traders. It moves the LP take-rate. If a 0.3% pool previously gave LPs 100% of collected fees, it now gives them 83.3%. For LPs who previously earned 15.88% APY, a one-sixth reduction in fee income drops the rate to 13.23% if trading volume remains constant.
This timing aligns with the collapse window. The pool's 4.15pp drop from 15.88% to 11.73% is consistent with protocol fee activation combined with modest capital inflow. LPs who stayed in the tier absorbed both the fee-switch drag and dilution from new capital chasing the headline rate.
### Concentrated Liquidity And Range Exit Risk
Uniswap V3 allows LPs to allocate liquidity within a custom price range rather than distributing it uniformly from zero to infinity. [The tighter the price range, the faster impermanent loss increases](https://docs.uniswap.org/concepts/protocol/concentrated-liquidity), and LPs run higher risk of their liquidity becoming idle when the pool's price moves outside their interval.
When the price moves outside the selected range, the LP stops earning fees and the position is fully converted into one of the two assets. A 4.15pp APY collapse could reflect both impermanent loss realization and passive withdrawal of LPs whose ranges went out-of-bounds during volatility.
ETH-USDC is a volatile pair. ETH moved from $2,850 to $3,420 between mid-February and mid-March 2025, a 20% swing. LPs who set narrow ranges around $3,000 were pushed out of range during the rally. Their positions stopped earning fees. Their capital converted to USDC. The effective TVL in the earning range dropped, but the headline TVL figure did not adjust immediately, creating an artificial APY compression.
## Is This Structural Instability Or Fee Tier Migration?
The presence of two USDC-WETH collapses in 90 days suggests a repeating pattern rather than a one-time shock. The question is whether the pattern reflects a flaw in the pool or rational LP behavior responding to changing incentives.
### Evidence For Structural Instability
Volatile pairs with low fee tiers face a known problem: once the price becomes volatile, there are too few incentives for liquidity providers to create new liquidity positions, as the meager fees expected do not compensate for the risk. USDC-WETH is a high-volume pair, but it is also a volatile pair. If the active fee tier is too low to compensate for impermanent loss, LPs will withdraw when volatility spikes, collapsing the APY for those who remain.
[Peer-reviewed research on Uniswap V3 concentrated liquidity](https://arxiv.org/pdf/2410.09983) confirms that over half of liquidity providers in volatile token pairs have been unprofitable after accounting for impermanent loss. The same research shows that narrowing the range increases capital efficiency but amplifies impermanent loss risk. If USDC-WETH LPs are systematically underestimating impermanent loss, the pool will experience recurring capital flight whenever ETH moves sharply.
### Evidence For Fee Tier Migration
The fragmentation of USDC-WETH liquidity across multiple fee tiers suggests that LPs are not fleeing the pair. They are reallocating within it. A 0.3% tier with $21M TVL and a higher-fee tier with $99M TVL indicates that sophisticated LPs are rotating to capture different trade-offs between fee income and impermanent loss risk.
The protocol fee switch in December 2025 created a structural reason to migrate. LPs in the 0.3% tier now face a one-sixth reduction in fee income. LPs in the 0.05% tier face a different reduction rate. If the protocol fee drag varies by tier, LPs will move capital to the tier with the best post-fee economics. This reallocation compresses APY in the receiving tier until equilibrium is reached.
The two collapses in 90 days could reflect two waves of migration: the first when the fee switch was announced, the second when it was activated. The time lag between announcement and execution creates predictable capital flows for LPs who model the impact in advance.
## Maximum Allocation Guideline For High-Volatility LP Positions
The historical pattern in USDC-WETH reveals a clear risk profile. The pool delivers high APY during calm periods and collapses when volatility spikes or capital reallocates. LPs who oversize into the position during the high-yield phase lock in losses when the yield compresses and impermanent loss materializes.
### Position Sizing Framework
Given the documented instability, conservative allocation for USDC-WETH concentrated LP positions is 5-10% of total DeFi capital. The remainder should be allocated to stablecoin pools or delta-hedged strategies that do not carry directional ETH exposure.
A 5-10% allocation allows you to capture the high-yield phase without catastrophic loss if the pool collapses. If you allocate 50% of capital to a 15.88% APY position and the rate drops to 11.73% while ETH moves 20%, you will lose more to impermanent loss than you earned in fees. A 5% allocation limits the damage to a manageable fraction of the portfolio.
### Ladder Strategy Across Multiple Ranges
Instead of deploying one wide range, combine multiple small positions across staggered ranges. This "ladder" approach captures fees at different price levels while reducing impermanent loss risk. For example, deploy 2% of capital at $3,000-$3,200, another 2% at $3,200-$3,400, and a final 2% at $3,400-$3,600\. Each range earns fees when ETH trades within its band, and no single range holds enough capital to sink the portfolio if it goes out of bounds.
This approach also hedges against the collapse pattern. If the pool APY compresses from 15.88% to 11.73%, your total exposure is 6% of capital, not 50%. You captured some of the upside without absorbing the full downside.
### Active Monitoring And Exit Triggers
Concentrated liquidity positions require active monitoring. Set alerts for two conditions: range exit and APY compression. If your position goes out of range, it stops earning fees and you are holding a naked ETH or USDC position. If the APY drops more than 3 percentage points in 7 days, it signals capital inflow or fee tier migration that will continue to compress returns.
Exit triggers for USDC-WETH should be stricter than for stablecoin pools. [When TVL outflows accelerate, the APY is usually wrong](https://altcoininvestor.com/defi-tvl-outflow-meaning/). If the pool shows 11.73% APY but TVL is dropping 10% per week, the actual return is lower because your remaining liquidity is earning fees on declining volume with rising impermanent loss.
## What The Pattern Reveals About Sustainability
Two collapses in 90 days do not prove the pool is broken. They prove the pool is volatile. The difference matters for strategy.
A broken pool cannot sustain its advertised rate under normal conditions. A volatile pool can sustain the rate, but only intermittently, and only for LPs who time the entry and exit correctly. USDC-WETH appears to be the second type. The pool delivers high APY when ETH is range-bound and trading volume is high relative to liquidity. It collapses when ETH breaks out or when capital floods in chasing the headline rate.
The sustainability question is not whether the pool can maintain 15.88% indefinitely. It cannot. The question is whether the pool can maintain 15.88% long enough for an LP to earn back the impermanent loss risk before the collapse. The answer depends on position size, range width, and exit discipline.
### Comparative Sustainability: USDC-WETH vs Stablecoin Pools
[Stablecoin positions above 4% on $400M+ TVL](https://altcoininvestor.com/maple-usdg-vs-aave-usde-which-is-safer/) offer lower APY but higher durability. Maple USDG pays 4.96% on $408M TVL with no impermanent loss. Aave USDe offers 4.75% on $1.085B with minimal volatility. The safer choice depends on rate durability, not headline APY.
USDC-WETH at 15.88% looks three times more attractive than USDG at 4.96%. But if USDC-WETH drops to 11.73% in two weeks and impermanent loss reaches 8% during an ETH rally, the net return is 3.73%. USDG delivers 4.96% with no impermanent loss and no collapse risk. The stablecoin pool wins on a risk-adjusted basis.
### Volume Analysis And Fee Generation
[The WETH-USDT pool shows 10.77% APY on $111M TVL](https://altcoininvestor.com/uniswap-v3-weth-usdt-yield-real/), sustained by consistent fee volume. The difference between WETH-USDT at 10.77% and USDC-WETH at 15.88% is not the pair composition. It is the stability of the fee tier structure and the absence of recurring collapse events.
USDC-WETH generates high APY during volume spikes but cannot maintain the rate when volume normalizes or capital inflows dilute the LP share. WETH-USDT generates lower APY but maintains it across multiple quarters. For LPs who cannot actively manage positions daily, the second pool is the better choice.
## On-Chain Metrics To Watch
The next collapse in USDC-WETH will be visible on-chain before it shows up in the APY figure. Track these metrics:
### TVL Growth Rate
If TVL grows more than 10% in 7 days without a proportional increase in trading volume, APY will compress. The headline APY lags the TVL change by 24-48 hours because it is calculated using trailing fee data. By the time the APY updates, the dilution has already occurred.
### Active Liquidity vs Total Liquidity
Uniswap V3 reports total liquidity, but only in-range liquidity earns fees. If ETH moves 15% in a week, a large fraction of concentrated positions will go out of range. The active liquidity drops, the APY compresses for those still in range, and the headline figure does not reflect the change until the next rebalancing cycle.
### Protocol Fee Activation Events
Uniswap governance votes on protocol fee changes. When a new proposal activates fees on a pool or changes the fee split, LPs will migrate within 48 hours. The migration is visible as TVL shifts between fee tiers before the APY adjusts. If you see $20M move from the 0.3% tier to the 0.05% tier in 24 hours, the 0.05% APY will drop within 3 days.
## The Takeaway
The USDC-WETH pool on Uniswap V3 has collapsed twice in 90 days, dropping 10.65pp in the first event and 4.15pp in the second. The pattern reveals a pool that delivers high APY intermittently but cannot sustain the rate through volatility or capital inflows. The collapse mechanism combines protocol fee drag, fee tier migration, and concentrated liquidity range exits during ETH price swings. Conservative position sizing is 5-10% of total DeFi capital, deployed across staggered price ranges with active monitoring for TVL growth and APY compression. LPs who oversize into the pool during the high-yield phase lock in losses when the yield collapses and impermanent loss materializes. The pool is not broken, but it is volatile, and that volatility requires strategy.
## Frequently Asked Questions
### Why did Uniswap V3 USDC-WETH APY collapse twice in one quarter?
The pool dropped 10.65 percentage points in the first collapse and 4.15pp in the second. The collapses stem from three factors: protocol fee activation in December 2025 that reduced LP take-rate by one-sixth, capital inflows that diluted APY without proportional volume increases, and concentrated liquidity range exits when ETH moved 20% from $2,850 to $3,420\. LPs whose price ranges went out of bounds stopped earning fees, compressing APY for remaining participants.
### Is Uniswap V3 USDC-WETH pool structurally unstable or just volatile?
The pool is volatile, not broken. It delivers high APY when ETH is range-bound and trading volume is high relative to liquidity. It collapses when ETH breaks out or capital floods in. The presence of multiple active fee tiers with $99M in one tier and $21M in another indicates LPs are migrating between tiers rather than fleeing the pair entirely. This is rational reallocation responding to protocol fee changes and volatility, not structural failure.
### What is the maximum safe allocation for USDC-WETH concentrated liquidity positions?
Conservative allocation is 5-10% of total DeFi capital. Deploy capital across staggered price ranges instead of one wide range. For example, allocate 2% at $3,000-$3,200, 2% at $3,200-$3,400, and 2% at $3,400-$3,600\. This ladder approach captures fees at multiple price levels while limiting exposure if one range exits or the pool APY collapses. The remainder should go to stablecoin pools or delta-hedged strategies without directional ETH exposure.
### How does the Uniswap protocol fee switch affect LP returns?
The December 2025 UNIfication proposal redirects approximately one-sixth of swap fees from LPs to the protocol, depending on pool fee tier. It does not change trader execution price but reduces LP take-rate. If a 0.3% pool previously gave LPs 100% of fees, it now gives 83.3%. For LPs earning 15.88% APY, a one-sixth reduction in fee income drops the rate to 13.23% if trading volume stays constant. The timing aligns with the USDC-WETH collapse window.
### What on-chain metrics predict the next Uniswap V3 APY collapse?
Monitor TVL growth rate, active versus total liquidity, and protocol fee activation events. If TVL grows more than 10% in seven days without proportional volume increase, APY will compress within 48 hours. When ETH moves 15% in a week, concentrated positions go out of range and active liquidity drops while headline TVL lags. Governance votes on protocol fee changes trigger LP migration within 48 hours, visible as TVL shifts between fee tiers before APY adjusts.
The Weekly Yield Report
You have just analyzed two collapses, tracked fee tier migration, and reviewed the 5-10% allocation framework. The next collapse is already forming on-chain.
Every Thursday: where crypto yield actually is - stablecoins, liquid staking and DeFi lending, with the risk named next to the rate and what changed since last week.
[Get it free every Thursday](#/portal/signup)
Free. No trade calls, no allocations, no hype. Unsubscribe in one click.
### Centrifuge USDS Rate Drop: RWA Pool Utilization Or Yield Source Change
URL: https://altcoininvestor.com/centrifuge-usds-yield-drop/
Last updated: 2026-09-29T17:03:34.000Z
## The Question: What Drives A 1.08pp Rate Drop On RWA-Backed Yield?

When Centrifuge's USDS-denominated yield dropped from 3.84% to 2.76%, the on-chain data showed nothing unusual. Pool utilization remained stable. No liquidations, no governance votes, no protocol upgrades. For depositors holding $300,000 in that position, the drop costs $3,240 annually. The immediate question becomes operational: is this a temporary allocator rebalance you wait through, or a permanent shift in underlying yield that requires immediate reallocation?
In pure DeFi lending, rate changes telegraph themselves through utilization curves and borrow demand. [Compound V3 rate movements](https://altcoininvestor.com/how-to-predict-compound-v3-yield-drops/) show up in wallet flows 72 hours before they execute. RWA-backed protocols work differently. The yield you see is a governance-set distribution rate. The actual return comes from off-chain assets: short-duration US Treasury bills through JTRSY pools, AAA-rated CLO tranches through JAAA, or diversified real-world loan portfolios. When the displayed rate changes, it reflects decisions made in board meetings and allocator rebalancing calls, not in smart contract state changes.
This creates an information asymmetry. The data you need to assess sustainability lives in pool NAV reports, Grove Basin allocator disclosures, and Sky governance proposals, not in the transaction logs most yield farmers monitor. Understanding how RWA rate volatility works determines whether that 1.08pp drop signals deteriorating base yields or a passing capital allocation shift.
## How RWA-Backed Rates Actually Move

Sky's Savings Rate sits at 3.60% APY as of September 2026, down from peaks above 8% in 2024\. That rate is not market-determined. It is governance-set, based on what Sky's reserves can support and what governance believes will attract sufficient TVL without bleeding protocol equity. Sky's reserves include 22% allocation to RWA loans through BlockTower, Centrifuge, and Monetalis, yielding between 5% and 6.5%. The rest sits in protocol-owned liquidity and USDC reserves.
When you deposit into a Centrifuge pool distributing Sky-backed yield, you are not lending directly into a utilization curve. You are receiving a pass-through distribution of returns that originate in Treasury bills, CLO tranches, or structured loan portfolios. The protocol collects those returns, deducts fees and operational costs, and distributes the remainder according to tranche seniority. Senior tranches get priority claims. Junior tranches absorb losses first but capture upside when the underlying assets outperform.
The rate drop from 3.84% to 2.76% would reflect one of three mechanisms:
- **Allocator rebalancing:** Grove Basin, the entity deploying capital on behalf of Sky, holds approximately $769.8M in JTRSY and $124.8M in JAAA. If Grove rebalances away from higher-yielding CLO exposure toward safer Treasury bills, the blended yield falls. This is operational reallocation, not base-yield deterioration.
- **Base yield compression:** If the 30-day annualized yield on JTRSY fell from its current 3.24% level, that filters directly into distribution rates. JTRSY holds short-duration US Treasury bills. When Federal Reserve rates fall, JTRSY yields fall with them, and so does the pass-through to depositors.
- **Fee or reserve allocation change:** Sky governance may have voted to retain more protocol revenue or increase reserve buffers. The base assets still yield 5-6.5%, but more gets kept at the protocol level, reducing what flows to depositors.
The critical difference between this and [pure DeFi stablecoin yield](https://altcoininvestor.com/how-to-earn-passive-income-stablecoins-2026/) is that you cannot see the driver on-chain. Utilization curves do not exist here. Borrow demand is not the mechanism. You are analyzing capital allocation decisions that happen in governance forums and allocator calls, then get reflected days or weeks later in your displayed APY.
### Treasury Curve Tracking And Governance Lag
JTRSY's 30-day annualized yield sits near 3.24% with a 0.25% management fee. That yield tracks short-duration Treasury bills. When the Federal Reserve cuts rates, those Treasury bills reprice within days. But the rate you see as a depositor does not update in real time. It updates when Grove Basin rebalances the allocator portfolio, and when Sky governance ratifies the new distribution rate. That lag can run one to three weeks.
This creates a specific risk during Fed pivot periods. If the Fed signals rate cuts and Treasury yields start compressing, the JTRSY base yield will fall. But your displayed APY may not reflect that for two weeks. By the time the on-chain rate updates, the repricing has already happened in the underlying assets. You are seeing backward-looking data presented as current yield.
For a depositor holding $300,000, this matters. A 1.08pp drop that reflects already-executed Treasury repricing is a hold signal. The rate has adjusted to the new environment, and further cuts will require additional Fed action. A 1.08pp drop that reflects allocator rotation out of CLOs into safer but lower-yielding Treasuries is an exit signal. It suggests Grove Basin is de-risking, which could mean either portfolio defensiveness or liquidity management ahead of redemptions.
### Pool Concentration And Hidden Leverage
Centrifuge holds approximately $1.635 billion in total value locked. As of July 2026, JTRSY held $881.3M and JAAA held $691.9M, representing 95.6% of distributed assets. This is extreme concentration. If Sky governance decides to reduce RWA exposure or if Grove Basin reallocates toward different pools, the impact on individual pool yields is not gradual. It is immediate and large.
The $769.8M JTRSY position and $124.8M JAAA position held by Grove Basin represent the critical leverage point. Grove is not a passive investor. It is an active allocator deploying on behalf of Sky's treasury. When Grove rebalances, it moves size. A 10% reallocation out of JAAA and into JTRSY would shift $12.48M, which on a $691.9M JAAA pool is a 1.8% supply change. That is enough to move blended yields by 30-50 basis points if the assets being rotated into have materially different return profiles.
This is invisible on-chain. You see a rate change. You do not see the Grove rebalancing call that caused it. The only way to track this is to monitor Sky governance forum proposals, Grove Basin allocator reports filed to the Sky treasury, and NAV updates published by Centrifuge for individual pools. Most yield farmers do not do this. Most yield trackers do not surface this data. It requires manual monitoring of off-chain disclosures, which is why RWA protocol evaluation demands a different checklist than pure DeFi.
## The Hold-Vs-Exit Calculation Framework

On $300,000 deposited, a 1.08pp drop costs $3,240 annually. That is the opportunity cost of staying versus moving to a protocol still paying 3.84% or higher. But moving has costs too. Gas to withdraw, gas to deposit elsewhere, slippage if you are rotating through a DEX, and the tax event if you are realizing gains on the principal. The break-even depends on how long you were planning to hold and whether the rate drop is permanent or temporary.
If the rate drop reflects Fed-driven Treasury repricing, every other Treasury-backed yield product will reprice similarly. JTRSY falls to 3.24%, but so does every other tokenized T-bill wrapper. Your opportunity cost is not $3,240\. It is the spread between 2.76% and whatever the next-best RWA-backed option is now paying. If that spread is 20-30 basis points, the annual cost is $600-$900\. Gas and tax friction eat that entirely unless you are holding $500,000 or more.
If the rate drop reflects Grove Basin rotating out of CLOs and into Treasuries, the opportunity cost is real. CLO-backed products like JAAA still exist, and they still pay the yield pickup over Treasuries. If JAAA is still distributing 4.5-5%, staying in a 2.76% position costs you the full 1.74-2.24pp spread, which on $300,000 is $5,220-$6,720 annually. That is worth the friction cost of moving.
The decision tree looks like this:
- **Scenario A (Fed repricing):** Hold. Every comparable product repriced. The new rate reflects the current Treasury curve. Monitor for further Fed cuts, but do not rotate.
- **Scenario B (Allocator rotation to safety):** Exit if you were willing to hold CLO exposure. The rate drop reflects Grove de-risking, not base-yield compression. Other CLO-backed products still pay the premium.
- **Scenario C (Fee or reserve increase):** Exit if the fee change is permanent, hold if it is a temporary reserve buffer during volatile markets. This requires reading the governance proposal that authorized the change.
The information you need to distinguish these scenarios does not live on-chain. It lives in Sky governance proposals, Grove allocator disclosures, and Centrifuge pool NAV updates. If you cannot access that data within 48 hours of the rate change, you are flying blind. Most depositors are flying blind.
### Worked Example: $300,000 Position In A Repricing Event
You hold $300,000 in a Centrifuge USDS pool that was paying 3.84%. The rate drops to 2.76%. You have three comparable options: stay, rotate to a 3.60% Sky Savings Rate position, or rotate to a 4.80% JAAA position that still holds CLO exposure.
Gas cost to exit and re-enter: approximately $40-$80 on Ethereum mainnet depending on network congestion. Tax cost: if you bought at $295,000 and are now sitting on a $5,000 gain, realizing that triggers short-term capital gains at your marginal rate. At 24%, that is a $1,200 tax bill.
If the rate drop is Fed-driven and Sky Savings Rate also repriced to 3.60%, your annual gain from moving is $2,520 (0.84pp on $300,000). After gas and taxes, net gain is $1,240\. If you were planning to hold for one year, the move is marginally worth it. If you were planning to hold for six months, it is not.
If the rate drop is allocator rotation and JAAA is still paying 4.80%, your annual gain from moving is $6,120 (2.04pp on $300,000). After gas and taxes, net gain is $4,840\. That is worth the friction even on a six-month hold.
The math depends entirely on diagnosing the mechanism. That diagnosis depends on off-chain data most depositors do not have access to.
## When RWA Rate Volatility Matters And When It Does Not
For depositors holding five-figure positions, most RWA rate moves do not justify rotation. The friction costs of moving eat the yield pickup unless the spread is above 2pp and you are holding for 12+ months. [The break-even math on chasing higher yield](https://altcoininvestor.com/is-it-worth-moving-defi-position/) shows that most moves are unprofitable once you account for gas, slippage, and taxes.
For depositors holding six-figure positions, rate moves above 0.80pp are worth investigating. On $500,000, an 0.80pp drop costs $4,000 annually. That is enough to justify rotation if the rate drop is driven by allocator de-risking rather than base-yield compression. But the investigation requires reading governance proposals and allocator reports. If you cannot do that within 48 hours, you should not be holding RWA positions large enough that the rate volatility matters.
The broader signal here is that RWA protocols require a different monitoring cadence than pure DeFi. [A 20-minute weekly review](https://altcoininvestor.com/track-defi-yield-positions-efficiently/) works for Aave, Compound, and Morpho because those protocols broadcast rate changes through on-chain utilization data. RWA protocols require monitoring governance forums, reading allocator disclosures, and tracking NAV updates that publish on different schedules across different platforms. That is a higher operational burden. If you are not willing to carry that burden, you should not be chasing RWA yield premiums.
### What This Rate Drop Signals About RWA Yield Sustainability
The broader pattern across 2026 is that [stablecoin yield and money market yields](https://altcoininvestor.com/stablecoin-yield-vs-money-market/) are converging. When Fed rates were at 5.25-5.50%, tokenized T-bill products paid 4.5-5% after fees, and DeFi lending paid 6-8% because of leverage and protocol incentives. As Fed rates fall toward 4%, the base rate compresses, and the premium DeFi can offer shrinks. A 1.08pp drop from 3.84% to 2.76% is consistent with that compression if the underlying assets are short-duration Treasuries.
What it signals is that RWA yield is not insulated from macro rate cycles. The pitch on RWA products is that they offer stable, asset-backed returns with lower DeFi-specific risk. That is true. But the returns are not fixed. They reprice with the yield curve. If you entered an RWA position expecting 3.84% to hold through a Fed cutting cycle, you misread the product. The yield tracks the base rate, minus fees, minus reserve allocations. When the base rate falls, your yield falls.
For depositors in high-inflation economies where the local currency devalues faster than Fed rate cuts can compress dollar yields, this still works. A Turkish lira holder earning 2.76% in USDS is still preserving purchasing power. A Nigerian naira holder earning 2.76% in USDS is still earning real returns. The income mechanism is not broken. It is repricing with global rates, which is what it was always going to do.
For depositors in stable-currency economies chasing absolute yield, the compression matters more. If you are a dollar-denominated investor comparing 2.76% RWA yield to 3.20% money market fund yields or 4.10% [yield-bearing stablecoin products](https://altcoininvestor.com/earn-passive-income-yield-bearing-stablecoins/), the RWA premium is disappearing. That is not a Centrifuge-specific problem. It is a category-wide compression as the Fed normalizes rates and as DeFi matures past the incentive-subsidy phase.
## The Takeaway: RWA Rates Move On Information You Cannot See On-Chain
A 1.08pp rate drop on a Centrifuge USDS pool is not a liquidation, not a utilization spike, not a governance attack. It is a repricing driven by allocator decisions, Treasury curve movements, or protocol reserve changes. The mechanism is invisible on-chain. You diagnose it by reading Sky governance proposals, Grove Basin allocator reports, and Centrifuge pool NAV disclosures. If you do not have access to that data within 48 hours of a rate change, you cannot make an informed hold-vs-exit decision.
For depositors holding $300,000 or more, the $3,240 annual cost of a 1.08pp drop justifies the time investment. For smaller positions, the friction costs of rotating make most moves unprofitable unless the spread exceeds 2pp and you are holding for 12+ months. The broader pattern is that RWA yields are compressing with the Fed rate cycle, and the premium over money market funds is narrowing. That does not make RWA products broken. It makes them rate-sensitive in ways that DeFi lending is not.
The depositors who will succeed in RWA yield over the next two years are the ones who understand that this is a different information game. On-chain monitoring is necessary but not sufficient. You need to track governance, read allocator disclosures, and understand the yield curve that drives base returns. If that operational burden exceeds what you are willing to carry, RWA yield is not your lane. If you are willing to carry it, the yields are stable and the risk profile is cleaner than leveraged DeFi. But the information asymmetry is real, and it determines who exits at the right time and who holds through avoidable compression.
## Frequently Asked Questions
### What causes Centrifuge USDS yield to drop without on-chain signals?
RWA-backed yields reflect off-chain asset returns and allocator decisions, not utilization curves. A rate drop from 3.84% to 2.76% signals Treasury repricing, Grove Basin rebalancing away from CLOs, or Sky governance increasing protocol reserves. Unlike DeFi lending where borrow demand drives rates, RWA yields are governance-set distributions of returns from Treasury bills, CLO tranches, or loan portfolios. The mechanism is invisible on-chain and requires monitoring governance proposals and allocator reports.
### Should I exit a Centrifuge position after a 1.08pp rate drop?
It depends on the cause. If Fed rate cuts compressed Treasury yields, every comparable product repriced and staying makes sense. If Grove Basin rotated from CLOs to Treasuries, other CLO products still pay higher and exiting captures that spread. On $300,000, a permanent 1.08pp drop costs $3,240 annually. After gas and taxes, rotation is profitable only if the spread to alternatives exceeds 0.80pp and you hold 12+ months. Diagnose the mechanism from governance disclosures before moving.
### How do RWA protocol yields differ from DeFi lending rates?
DeFi lending rates respond to real-time utilization and borrow demand, broadcasting changes through on-chain data. RWA yields are governance-set distributions from off-chain assets like Treasury bills or CLO tranches. Changes reflect allocator rebalancing, base asset repricing, or fee adjustments decided in governance votes. You cannot predict RWA rate moves from wallet flows or utilization curves. It requires monitoring governance forums, allocator reports, and NAV updates that publish on different schedules across different platforms.
### What is the hold-vs-exit break-even for RWA yield drops?
On a $300,000 position, gas costs $40-$80 and realizing a $5,000 gain triggers $1,200 in taxes at 24% rates. To justify moving, the annual yield pickup must exceed $1,320\. That requires a spread above 0.44pp for a 12-month hold. If the rate drop is Fed-driven and all alternatives repriced, the spread is 20-30 basis points and moving loses money. If allocator rotation left CLO products at 4.80% while your position fell to 2.76%, the 2.04pp spread justifies rotation even on six-month holds.
### What data sources show why RWA yields changed?
Sky governance proposals at sky.eco/governance show reserve allocation votes and distribution rate changes. Grove Basin allocator reports filed to Sky Treasury show rebalancing between JTRSY, JAAA, and other pools. Centrifuge pool NAV updates on docs.centrifuge.io show underlying asset performance. DefiLlama tracks aggregate TVL but not allocator decisions. Most yield trackers surface displayed APY but not the off-chain mechanisms. If you cannot access governance and allocator data within 48 hours of a rate change, you cannot diagnose whether to hold or exit.
The Weekly Yield Report
You have just traced a 1.08pp rate drop through Treasury repricing, allocator rotation, and governance reserve changes. Those drivers will shift again next quarter.
Every Thursday: where crypto yield actually is - stablecoins, liquid staking and DeFi lending, with the risk named next to the rate and what changed since last week.
[Get it free every Thursday](#/portal/signup)
Free. No trade calls, no allocations, no hype. Unsubscribe in one click.
### NFT Fractionalization: Extract Liquidity And Yield Without Selling
URL: https://altcoininvestor.com/how-to-fractionalize-nft-for-income/
Last updated: 2026-09-29T16:04:35.000Z
## What NFT Fractionalization Accomplishes
NFT fractionalization converts a single ERC-721 token into a pool of fungible ERC-20 tokens. You deposit one NFT. The protocol mints 100,000 or 1,000,000 fractional tokens representing proportional ownership. You sell some fractions, keep others, or use them as collateral.
The mechanic extracts partial liquidity without triggering a full sale. If you own a Bored Ape worth $80,000 but need $15,000, you can fractionalize the NFT and sell 18% of the token supply. The remaining 82% stays in your wallet. The underlying NFT remains locked in the protocol vault until a redemption event occurs.
This process depends on three components: a fractionalization protocol that handles custody and minting, a secondary market where fractions trade, and a governance or buyout mechanism that determines when the NFT sells. Without all three, fractions become illiquid tokens backed by an inaccessible asset.
Prerequisites: You need an NFT with verifiable market value, an Ethereum or Solana wallet with enough ETH or SOL to cover gas fees (typically $20-$80 on Ethereum mainnet as of March 2026), and access to an audited fractionalization platform. Skip this strategy if your NFT has seen zero secondary sales in the last 90 days. Liquidity for fractions correlates directly with demand for the underlying asset.
## Step 1: Select A Platform With Active Liquidity
As of March 2026, the fractionalization landscape has consolidated. Fractional.art, once the market leader, shut down in May 2023\. Tessera followed shortly after. The platforms that remain operational serve specific niches.
Unicly focuses on collection-level fractionalization using uTokens and an automated market maker model. LIQNFT operates exclusively on Solana, handling both fractionalized and serialized NFTs. Smaller protocols like Portion and Niftex remain active but hold limited total value locked. According to DeFiLlama data, NFT-backed lending and fractionalization platforms collectively held tens of millions of dollars in March 2026, down from $3.8 billion in lending volume during 2023.
Choose a platform based on your blockchain. Ethereum users have access to Unicly and specialized lending protocols like BendDAO or Arcade that accept fractional tokens as collateral. Solana users default to LIQNFT. Polygon offers lower gas fees but shallower secondary markets for fractions.
Verify the platform's audit status before deposit. Check for published reports from Certora, Trail of Bits, or Quantstamp. Smart contract vulnerabilities in unaudited protocols create total-loss risk. One exploited vault can drain all deposited NFTs with no recovery mechanism.
Platform service fees typically range from 1% to 5% of transaction value. Ethereum gas fees for minting fractional tokens cost $30-$70 during moderate network congestion. Solana transactions cost under $0.01 but expose you to different liquidity depth. Calculate total entry costs before proceeding. On a $50,000 NFT, a 3% platform fee plus $50 in gas equals $1,550 upfront cost, which must be recovered through fraction sales or yield before you break even.
## Step 2: Mint Fractional Tokens And Set Parameters

Connect your wallet to the chosen platform. Approve the NFT transfer. The protocol moves your ERC-721 into a custody vault and mints your specified number of ERC-20 fractions. Most platforms allow between 100,000 and 1,000,000 fractions per NFT.
Higher fraction counts create lower per-token prices, which can improve perceived accessibility for buyers. A $40,000 NFT split into 1,000,000 fractions yields a $0.04 starting price per token. The same NFT split into 100,000 fractions starts at $0.40 per token. Psychological pricing matters in secondary markets, but liquidity depth matters more. If your target buyers are DeFi users farming yield rather than collectors seeking exposure, optimize for integration with existing liquidity pools.
Set governance parameters during minting. Most protocols require you to define a reserve price (the minimum buyout offer you will accept) and a voting threshold (what percentage of token holders must approve a sale). Common thresholds are 51% or 67% of circulating supply.
These parameters determine whether you maintain effective control. If you sell 60% of fractions and set a 51% vote threshold, buyers can force a sale without your consent. If you sell 40% and hold 60%, you retain veto power over any buyout. Retention percentage depends on your liquidity need. Selling 70% of fractions on a $60,000 NFT yields $42,000 minus fees. Holding 70% and selling 30% yields $18,000 minus fees but preserves control.
One thing worth noting: the moment you mint fractions, you introduce governance risk. Token holders become co-owners with voting rights. Even if you hold majority fractions initially, selling additional supply later can flip control to external holders.
## Step 3: Create Liquidity And Execute Partial Sales
Minting fractions does not create a market. You must either list fractions on a decentralized exchange or seed a liquidity pool to enable trading. The method you choose determines liquidity depth and price stability.
Option one: list fractions as a standard ERC-20 on Uniswap, SushiSwap, or Raydium (for Solana). Create a trading pair against ETH, USDC, or SOL. This approach offers maximum flexibility but requires you to provide initial liquidity on both sides of the pair. If you want to create a FRAC/ETH pool, you deposit both your fractional tokens and an equivalent value of ETH. For a $50,000 NFT split into 1,000,000 fractions, providing 10% liquidity depth means depositing 100,000 FRAC tokens plus $5,000 in ETH.
You earn trading fees (typically 0.3% per swap) but expose yourself to impermanent loss. If the fractional token price rises relative to ETH, you will have less FRAC and more ETH than you started with. If the price falls, you accumulate FRAC and lose ETH value. For NFT-backed tokens, impermanent loss is one-directional during downturns. The tokens lose value faster than the paired asset, and you end up with more illiquid fractions.
Option two: sell fractions via direct market orders. List your tokens at a fixed price on the DEX and wait for buyers. This avoids impermanent loss but reduces liquidity. Buyers face slippage if they try to purchase large amounts, which discourages volume. Direct sales work for small liquidity needs (selling 5-10% of supply) but fail for larger exits.
Option three: find an over-the-counter buyer through NFT communities or Discord channels. Negotiate a price for a large fraction block (20-40% of supply). OTC sales avoid slippage and gas costs from multiple small transactions but require trust or escrow. OTC buyers typically demand discounts of 5-15% below implied market value.
Revenue from fraction sales becomes available immediately after the transaction settles. Subtract platform fees, gas costs, and any DEX liquidity provision from gross proceeds to calculate net extracted liquidity. On a $60,000 NFT where you sell 30% of fractions at full implied value ($18,000), expect net proceeds between $16,200 and $17,100 after a 5% total fee burden.
## Income Method 1: Lending Against Fractional Tokens
Once you hold fractional ERC-20 tokens, you can deposit them as collateral in lending protocols. This generates a second layer of liquidity without selling fractions. Loan-to-value ratios for NFT-backed or NFT-derived assets typically range from 30% to 50% as of March 2026.
If you hold $20,000 worth of fractional tokens, a 40% LTV position lets you borrow $8,000 in stablecoins. You pay interest (typically 3-8% APY depending on the protocol and collateral type) and must maintain your collateralization ratio. If the fractional token price drops and your position falls below the liquidation threshold, the protocol sells your collateral to repay the loan.
Protocols like BendDAO, Arcade, and Gondi offer NFT-related lending but differ in how they treat fractional tokens. Some accept fractions directly. Others require you to wrap fractions into a vault token or provide additional over-collateralization. Check each protocol's collateral acceptance list before assuming compatibility.
This strategy works when you need stablecoin liquidity but expect the underlying NFT value to recover or hold steady. You extract cash flow through the loan while retaining exposure to any price appreciation in the fractional tokens. The risk is liquidation. If the NFT falls 25% in value and you borrowed at 40% LTV, you approach liquidation threshold (typically 50-60% LTV). Protocols liquidate positions with 5-15% penalty fees, meaning you lose both the borrowed funds and a portion of your collateral value.
One thing worth noting: fractional token prices can diverge from the underlying NFT's implied value during volatility. Floor price drops trigger panic selling in fraction markets, often overshooting the NFT's actual decline. This creates liquidation risk even when the NFT itself has not reached your liquidation threshold. Oracle reliability is a recurring failure point in fraction-collateralized lending.
## Income Method 2: Liquidity Provision And Fee Capture
If you create a liquidity pool for your fractional tokens, you earn a percentage of every trade. Uniswap v3 charges 0.3% to 1% per swap depending on the fee tier you select. SushiSwap and Raydium offer similar structures. On $100,000 in monthly trading volume, a 0.3% fee tier generates $300, split proportionally among liquidity providers.
Your share of fees depends on your share of total pool liquidity. If you provide $10,000 of a $50,000 pool (20% of TVL), you earn 20% of all fees. Fees accrue automatically and can be claimed at any time, though Ethereum gas costs may make small frequent claims uneconomical.
This income stream depends entirely on trading volume. Fractional tokens for blue-chip NFTs (Bored Apes, CryptoPunks, Azuki) sustain higher volume than mid-tier or long-tail collections. In March 2026, most fractional NFT trading volume concentrated in fewer than a dozen active vaults. If your NFT is not a widely recognized collection, expect minimal trading activity and negligible fee income.
Impermanent loss remains the primary risk. If your fractional token falls 40% while ETH holds steady, your liquidity position will be worth less than if you had simply held the tokens. The fees earned rarely compensate for large price divergence over short periods. Liquidity provision works as an income strategy only when you expect relatively stable or sideways price action.
## Income Method 3: Revenue-Sharing And Licensing Arrangements
Some fractionalized NFTs generate ongoing revenue through licensing, merchandise sales, or media rights. Token holders receive proportional distributions from these income streams. The fractionalized Bored Ape #3749 community voted to license their Ape for merchandise, creating recurring revenue shared among token holders.
This model is rare and introduces significant regulatory risk. On March 17, 2026, the SEC and CFTC released joint guidance clarifying that fractionalized digital collectibles may constitute securities where purchasers reasonably expect profits from the essential managerial efforts of others. Fractionalized NFTs with revenue-sharing or profit-participation arrangements likely meet the Howey test for investment contracts.
If your fractionalization includes revenue sharing, licensing agreements, or managed commercial use, you are operating in securities territory. That triggers registration requirements, disclosure obligations, and potential enforcement action. The guidance distinguishes between pure fractional ownership (lower risk) and fractionalized interests sold with profit expectations (securities).
Revenue-sharing arrangements can generate meaningful income when the underlying IP has commercial value and an active manager negotiates deals. Monthly distributions of $200-$2,000 per vault are possible for top-tier collections with strong brand recognition. But the legal risk and compliance cost outweigh the income potential for most participants. Unless you have legal counsel and a registration pathway, avoid revenue-sharing fractionalization structures.
## Governance, Buyouts, And Forced Liquidation
Fractionalization protocols include mechanisms for reassembling the NFT and returning it to whole-asset status. The most common is a buyout auction. Any party can submit a bid to purchase the entire NFT. Token holders vote on whether to accept the offer. If the vote passes (meeting the threshold you set during minting), the NFT sells, and proceeds distribute proportionally to token holders.
This creates exit liquidity but removes your control. If you sold 55% of your fractions and set a 51% approval threshold, the majority can force a sale. You receive your proportional share of proceeds (45% of the sale price minus platform fees), but you lose the underlying asset.
Some protocols use time-limited holding periods instead of open-ended votes. After 12 or 24 months, any token holder can trigger a redemption auction. Others implement manager-led sales where a designated party has unilateral authority to sell after notifying token holders. Read the protocol's governance documentation before minting. The redemption mechanism determines whether you retain long-term control.
Buyout bids can also be used strategically. If you regret fractionalizing the NFT or want to reassemble it, you can submit a bid yourself. If you still hold majority fractions, you can approve your own offer. The cost is buying out the minority holders at a premium to current market price, plus protocol fees. On a $50,000 NFT where you sold 30% of fractions, reassembling the asset requires buying back that 30% at prevailing market rates. If fraction prices rose 20%, you pay $18,000 to reacquire the minority position, plus a 2-5% buyout fee ($1,000-$2,500).
Governance gridlock is a real failure mode. If token holders cannot agree on a reserve price or if buyout votes repeatedly fail, the NFT remains locked indefinitely. Fraction prices often collapse in gridlock scenarios because the market prices in zero probability of near-term redemption. Always retain enough fractions to block or approve sales unilaterally if you want to avoid this outcome.
## Valuation Challenges And Oracle Dependence
Fractional tokens trade based on implied NFT value, but that value is not objectively measurable. Unlike fungible tokens with deep order books, NFTs trade infrequently. Floor prices provide a rough benchmark, but your specific NFT may be worth more or less than floor depending on traits, rarity, and provenance.
Oracle systems attempt to bridge this gap by aggregating sales data, floor price movements, and trait valuations. Protocols like BendDAO and Arcade use oracles to determine collateral value for lending positions. Oracle accuracy determines whether your lending position stays solvent or gets liquidated prematurely.
Oracle failures occur during rapid market moves. If your collection's floor drops 30% in six hours, oracle updates may lag. Your collateralized position can get liquidated before the oracle reflects stabilization or recovery. Alternatively, stale oracle data can overvalue collateral, letting you borrow more than the asset supports. When the oracle updates, mass liquidations cascade through the protocol.
Manual valuation disputes are common in fractionalization. If you believe your NFT is worth $70,000 but fraction buyers only value it at $50,000, the market price reflects buyer sentiment, not your assessment. Fractional token prices often trade at a discount to implied whole-NFT value because of liquidity risk, governance uncertainty, and reassembly costs. Discounts of 10-25% are typical for mid-tier collections.
## Regulatory Considerations And Securities Risk
The March 2026 SEC-CFTC guidance is the most significant regulatory development for fractionalization. The agencies stated that fractionalized digital collectibles may constitute securities depending on facts and circumstances. If purchasers have a reasonable expectation of profits from the managerial efforts of others, the fractional interest likely meets the definition of an investment contract under the Howey test.
Pure fractional ownership without revenue sharing or active management sits in a safer zone. If you fractionalize an NFT, sell portions, and the only value driver is the NFT's market price, that is closer to a commodity interest than a security. But if you market fractions with references to yield, staking rewards, licensing income, or managed commercial exploitation, you cross into securities territory.
The guidance applies regardless of whether you call the token a fraction, a shard, or a membership. The economic substance controls the classification. This has chilling effects on revenue-generating fractionalization models. Platforms that previously offered staking rewards for fraction holders or profit-sharing from IP licensing have either shut down those features or restricted access to non-U.S. participants.
If you proceed with fractionalization, document your intent and avoid language suggesting managed profit generation. Sell fractions as a liquidity tool, not an investment product. Do not promise yield, returns, or income from third-party efforts. The difference determines whether you are conducting a private transaction or an unregistered securities offering.
## Common Failure Modes
Liquidity evaporation is the most frequent problem. Fraction buyers expect to trade out of positions when needed. If your NFT loses relevance or the broader market declines, bid-ask spreads widen and volume disappears. You may hold fractions worth $15,000 on paper but find zero buyers at any reasonable price. This happened to multiple Pudgy Penguins fractionalization vaults in late 2023 despite the collection maintaining blue-chip status.
Smart contract exploits have drained entire fractionalization vaults. In 2022, an unaudited protocol lost over $1.2 million when an attacker exploited a reentrancy vulnerability in the redemption function. Users lost both their fractions and the underlying NFTs. Only use platforms with multiple third-party audits and active bug bounty programs.
Tax reporting complexity is underestimated. Fractionalizing an NFT may trigger a taxable event if the IRS considers it a disposition. Selling fractions is clearly taxable. Receiving fractions in exchange for an NFT creates a new cost basis that must be tracked. Using fractions as collateral may or may not trigger tax depending on jurisdiction. Providing liquidity and earning fees definitely creates taxable income. Each action requires separate documentation. Read our guide on [building a tax-proof record system for multi-protocol yield](https://altcoininvestor.com/how-to-track-defi-yield-for-taxes/) for logging frameworks that survive audits.
Price manipulation risk increases when a single holder or coordinated group controls a large fraction of supply. A holder with 35% of tokens can dump their position, crashing the price and triggering liquidations for anyone using fractions as collateral. The price can then be re-accumulated at a discount. Low liquidity magnifies manipulation risk. Only fractionalize NFTs with enough community interest to sustain distributed ownership.
## What To Do Next
Audit the secondary market for your NFT. Check OpenSea, Blur, and LooksRare for transaction volume over the last 60 days. If your specific NFT has not traded and fewer than five others in the collection have sold, fractionalization will not generate liquidity. The fractions will be as illiquid as the whole asset.
Calculate break-even requirements. Add platform fees, gas costs, and expected trading slippage. Determine how much fraction value you must sell to recover upfront costs. If you need to sell 40% of fractions just to break even, the strategy may not justify the execution risk.
Set governance parameters that align with your control preferences. If you want veto power over sales, retain at least 51% of fractions (or 34% if the threshold is 67%). If you want maximum liquidity and are comfortable with forced buyouts, sell up to 70% and accept that majority holders can liquidate the asset.
Monitor collateralization ratios daily if you borrow against fractions. Set price alerts at levels 10% above your liquidation threshold. Be prepared to add collateral or repay loans during volatility. Liquidations on NFT-derived collateral are less forgiving than standard DeFi loans because secondary markets for buyback are thin.
Consider simpler alternatives. If you need $15,000 from a $50,000 NFT, peer-to-peer NFT lending through Arcade or direct sale of the whole asset may involve less complexity and lower total fees than fractionalization. Fractionalization makes sense when you want to retain partial exposure while extracting liquidity, not when you need maximum immediate cash.
For background on monetizing NFTs without fractionalization, see our coverage of [NFT flipping strategies in 2026](https://altcoininvestor.com/how-to-flip-nfts-for-profit-2/) and [extracting income from rare trait NFTs](https://altcoininvestor.com/how-to-earn-income-from-rare-nft-traits/). If you hold multiple yield positions across NFT lending and fraction liquidity pools, our piece on [monitoring 8-12 positions in 20 minutes weekly](https://altcoininvestor.com/track-defi-yield-positions-efficiently/) covers review cadence and alert thresholds.
## The Takeaway
NFT fractionalization converts a single illiquid asset into a pool of tradable tokens. You extract partial liquidity by selling fractions, generate yield by lending against them, or earn fees by providing liquidity to secondary markets. The mechanic works when your NFT has sustained buyer interest and you understand the governance risks. It fails when liquidity evaporates, oracle pricing lags market reality, or fraction holders vote to sell the underlying asset against your preference.
The SEC's March 2026 guidance constrains revenue-sharing models but leaves pure fractionalization as a liquidity tool largely intact. Execute this strategy with clear cost accounting, majority fraction retention if you want control, and an exit plan for reassembling the NFT or liquidating fractions during downturns. The difference between extracting $18,000 from a $60,000 NFT and losing the entire asset to forced liquidation is governance parameter selection and market timing. The data shows which collections sustain active fraction markets. Your job is to match execution to observable liquidity depth, not to wishful valuations.
## Frequently Asked Questions
### Can I reverse fractionalization and get my original NFT back?
Yes, through buyout mechanisms. Most platforms allow anyone to bid on the whole NFT. If token holders vote to accept the offer (meeting your preset threshold like 51% or 67%), the NFT sells and proceeds distribute to fraction holders. Alternatively, you can buy back all fractions yourself if you hold enough to approve your own buyout bid. Expect to pay current market rates plus 2-5% protocol fees for reassembly.
### What happens if my fractional tokens lose all liquidity?
You hold tokens backed by an NFT you cannot access without a successful buyout vote. If no buyers exist for your fractions and no one submits buyout bids, the NFT stays locked in the protocol vault indefinitely. Your fractions become effectively worthless despite the underlying asset retaining value. This failure mode occurred frequently in 2023-2024 when multiple fractionalization platforms shut down or saw volume collapse.
### Are fractionalized NFTs considered securities by the SEC?
As of March 2026, it depends on structure. The SEC-CFTC joint guidance states that fractionalized collectibles may constitute securities if buyers reasonably expect profits from others' managerial efforts. Pure fractional ownership without revenue sharing or active management sits in a safer zone. But fractionalization with licensing income, staking rewards, or profit-sharing arrangements likely meets the Howey test for investment contracts and requires securities registration.
### How much liquidity can I realistically extract from a $50,000 NFT?
After platform fees (1-5%), gas costs ($30-$70 on Ethereum), and maintaining governance control, expect to extract 25-40% of NFT value while retaining majority fractions. Selling 30% of fractions on a $50,000 NFT yields $15,000 gross, minus $750-$2,500 in total fees, for net proceeds of $12,500-$14,250\. Selling more improves liquidity but risks losing control to other token holders who can force a full sale.
### What loan-to-value ratio can I get using fractional tokens as collateral?
Current LTV ratios for NFT-derived collateral range from 30-50% as of March 2026\. If you hold $20,000 in fractional tokens, expect to borrow $6,000-$10,000 in stablecoins. You must maintain collateralization ratios and face liquidation if fraction prices drop. Lending protocols like BendDAO, Arcade, and Gondi accept some fractional tokens but each has specific collateral requirements and over-collateralization rules.
The Weekly Yield Report
You have just mapped three income methods for fractionalized NFTs and the governance parameters that determine control. Those liquidity pools and LTV ratios will shift by next week.
Every Thursday: where crypto yield actually is - stablecoins, liquid staking and DeFi lending, with the risk named next to the rate and what changed since last week.
[Get it free every Thursday](#/portal/signup)
Free. No trade calls, no allocations, no hype. Unsubscribe in one click.
### Chainlink Connects Banks to Swift's Blockchain Ledger
URL: https://altcoininvestor.com/chainlink-swift-blockchain-ledger-banks/
Last updated: 2026-10-02T18:00:06.000Z
## Chainlink Runtime Environment Enables Bank Self-Signing
Chainlink announced on September 29, 2026 that it is enabling financial institutions to connect their key signing infrastructure to Swift's blockchain ledger through the Chainlink platform. At the center of this architecture is the Chainlink Runtime Environment (CRE), which orchestrates workflows connecting institutions to Swift's ledger while allowing banks to retain control of the cryptographic keys used to authorize transactions.
This is a self-signing model. Banks hold their own keys. CRE routes transaction workflows between the institution's internal systems, their tokenized deposit ledgers, and Swift's blockchain ledger without taking custody of signing authority.
The design addresses a foundational requirement for regulated financial institutions: cryptographic key control must remain with the institution, not an external oracle or middleware provider. This is non-negotiable for central banks and commercial banks operating under custody regulations.
Swift connects more than 11,500 financial institutions and corporates across more than 200 markets, processing over $3 trillion in daily messaging volume. That network is now accessible to blockchain-based settlement infrastructure, provided the institution can connect its signing systems to the ledger.
## Seventeen Banks Are Running Live Tokenized Deposit Pilots

Seventeen financial institutions are piloting tokenized deposit transactions using Swift's blockchain ledger. Participants include ANZ, BNP Paribas, BNY, Citi, DBS, HSBC, Standard Chartered, UBS, and Wells Fargo.
The pilots involve live transactions, not simulations. These institutions are conducting around-the-clock tokenized deposit settlements while maintaining a synchronized record of obligations as transactions progress. That synchronization is the piece Swift has been building since its initial MVP announcement.
Swift moved this project into initial-use status in July 2026, transitioning from proof-of-concept to live institutional pilots. The institutions listed above are now testing real settlement workflows using tokenized representations of fiat deposits on blockchain infrastructure.
This is institutional tokenized settlement at scale. The pilots connect the existing Swift messaging layer to blockchain ledgers, preserving the compliance and messaging standards that Swift institutions already use while enabling 24/7 settlement cycles instead of batch processing windows.
LINK surged 11.55% following the announcement, reflecting market recognition that Chainlink's oracle and runtime infrastructure is now embedded in live institutional settlement workflows involving the world's largest banks.
## What Tokenized Deposits Mean for DeFi Liquidity Access
Tokenized deposits are blockchain-based representations of fiat currency held in regulated bank accounts. When a bank tokenizes a deposit, it issues an on-chain asset backed 1:1 by funds in a custodial account. That token can move across blockchain rails, settle instantly, and integrate with smart contract infrastructure.
The seventeen institutions piloting these transactions are testing workflows that allow tokenized deposits to move between bank ledgers and the Swift ledger without requiring off-chain reconciliation or T+2 settlement windows. This creates a direct bridge between traditional banking infrastructure and blockchain-based settlement.
For DeFi users, this matters because tokenized deposits from regulated institutions could eventually serve as collateral, liquidity, or settlement assets in [DeFi protocols](https://altcoininvestor.com/best-defi-protocols/) that accept bank-issued stablecoins or tokenized fiat. If a major bank issues a tokenized deposit that settles through Swift's blockchain ledger, that asset could theoretically interact with lending protocols, liquidity pools, or yield aggregators that support the token standard.
Not yet. But the infrastructure is being built.
The pilots are testing institutional use cases: cross-border payments, treasury operations, interbank settlement. These are not retail-facing products. But the same infrastructure that enables a bank to settle a tokenized deposit transaction with another bank through Swift's ledger could, in principle, enable that bank to issue a tokenized deposit that moves through public DeFi infrastructure.
The on-chain evidence will be visible when it happens. Tokenized deposit contracts deployed by participating banks will show minting events, transfer activity, and integration with smart contract platforms. Watch for contract deployments from BNY, Citi, HSBC, or Standard Chartered on Ethereum mainnet or institutional-focused Layer 2 networks.
## The Infrastructure That Makes This Possible
The Chainlink Runtime Environment is not an oracle in the traditional sense. CRE is a compute and orchestration layer that connects external systems to blockchain infrastructure. In this case, it routes transaction requests from a bank's internal systems to Swift's blockchain ledger while coordinating key signing, transaction formatting, and settlement confirmation.
The bank's signing keys never leave the institution's custody infrastructure. CRE orchestrates the workflow, but the cryptographic signature authorizing the transaction is generated by the bank's own hardware security modules or key management systems. This preserves the regulatory and operational controls that banks require.
Swift's blockchain ledger is a permissioned ledger designed to record obligations and settlement events between financial institutions. It is not a public blockchain. Access is restricted to Swift network participants, and transactions are validated by a permissioned set of nodes operated by institutions and Swift itself.
Chainlink is the middleware connecting banks' existing infrastructure to this ledger. The announcement does not specify which blockchain Swift's ledger is built on, but the architecture described in [Chainlink's press release](https://chain.link/press-releases/chainlink-is-enabling-financial-institutions-to-connect-to-swifts-blockchain-ledger) indicates a permissioned distributed ledger that uses smart contracts to manage settlement logic and record-keeping.
This is significant because it demonstrates that Chainlink's infrastructure is now embedded in live institutional settlement workflows, not just DeFi oracle use cases. CRE is being used to connect banks to a blockchain ledger for real financial transactions involving trillions of dollars in annual flow.
## What to Watch On-Chain
The pilots are running on permissioned infrastructure, so most transaction data will not be visible on public blockchains like Ethereum mainnet. But there are several on-chain signals to monitor as this infrastructure matures.
First, watch for tokenized deposit contract deployments by the seventeen participating banks. If any of these institutions deploy ERC-20 or similar token contracts representing tokenized deposits, those contracts will be visible on Etherscan or other block explorers. Monitor addresses associated with BNY, Citi, HSBC, DBS, and Standard Chartered.
Second, monitor Chainlink node activity and LINK token flows related to institutional use cases. If CRE is orchestrating settlement workflows for Swift, there may be observable node operator activity or fee payments flowing to Chainlink infrastructure providers. This would appear as increased transaction volume or oracle request activity from addresses linked to Chainlink's enterprise node operators.
Third, watch for integration announcements between tokenized deposit issuers and DeFi protocols. If a bank-issued tokenized deposit begins appearing as collateral in Aave, Compound, or other lending protocols, that integration will be visible on-chain. Look for whitelisting events, liquidity pool deployments, or lending market additions involving new tokenized fiat assets.
Fourth, track LINK accumulation by institutions or custody addresses linked to Swift participants. If the seventeen pilot banks are preparing to scale their use of Chainlink infrastructure, they may begin accumulating LINK to pay for oracle and CRE services. Large transfers to institutional custody wallets or multisig addresses controlled by known financial institutions would be a signal.
This infrastructure is being built in permissioned environments today, but the on-chain footprint will expand as tokenized deposits move into public blockchain ecosystems.
## The Takeaway
Chainlink is now the middleware connecting seventeen major banks to Swift's blockchain ledger for live tokenized deposit settlements. The infrastructure preserves institutional key control while enabling 24/7 settlement cycles. The pilots are running now, not in a whitepaper. LINK surged 11.55% on the news, and the on-chain evidence of institutional blockchain adoption will become visible as these banks deploy tokenized deposit contracts and integrate with DeFi infrastructure. Watch for contract deployments from BNY, Citi, HSBC, and Standard Chartered, and monitor LINK flows to institutional custody addresses. The signal will be there before the press release.
## Frequently Asked Questions
### What is the Chainlink Runtime Environment (CRE) doing in this Swift integration?
CRE orchestrates workflows connecting banks' internal systems and key signing infrastructure to Swift's blockchain ledger. It routes transaction requests and coordinates settlement processes while allowing financial institutions to retain full control of their cryptographic keys. The bank's signing keys never leave the institution's custody infrastructure. CRE acts as middleware, not a custodian.
### Which banks are participating in the Swift blockchain ledger pilots?
Seventeen financial institutions are running live tokenized deposit pilots, including ANZ, BNP Paribas, BNY, Citi, DBS, HSBC, Standard Chartered, UBS, and Wells Fargo. These institutions are conducting around-the-clock tokenized deposit settlements using Swift's blockchain ledger, testing real settlement workflows rather than simulations.
### Can tokenized deposits from these banks be used in DeFi protocols?
Not yet. The current pilots focus on institutional use cases like cross-border payments and interbank settlement on permissioned infrastructure. However, the same technology enabling bank-to-bank tokenized deposit settlement through Swift's ledger could eventually support bank-issued tokenized deposits that interact with public DeFi protocols. Watch for contract deployments and integration announcements.
### How can I track on-chain activity related to these tokenized deposit pilots?
Monitor Etherscan and other block explorers for tokenized deposit contract deployments by participating banks like BNY, Citi, HSBC, DBS, and Standard Chartered. Track LINK flows to institutional custody addresses and watch for integration announcements between tokenized deposit issuers and DeFi lending protocols. Most pilot activity occurs on permissioned ledgers, but public blockchain footprints will expand as infrastructure matures.
### Why did LINK price surge 11.55% after this announcement?
The market recognized that Chainlink infrastructure is now embedded in live institutional settlement workflows involving the world's largest banks and Swift's $3+ trillion daily messaging network. This validates Chainlink's role beyond DeFi oracle services, demonstrating enterprise adoption for critical financial infrastructure connecting traditional banking systems to blockchain ledgers.
Tool mentioned above
Ledger
Ledger devices display the full transaction on their own screen before you approve it, which is what stops an approval exploit at the point it matters.
[See Ledger devices](https://shop.ledger.com/?r=90612ff43561)
We may earn a commission if you sign up through this link, at no cost to you. It does not change what gets recommended.
The Weekly Yield Report
You just read how seventeen banks are piloting tokenized deposits through Chainlink and Swift infrastructure. Those pilots will expand, and the on-chain footprint will change.
Every Thursday: where crypto yield actually is - stablecoins, liquid staking and DeFi lending, with the risk named next to the rate and what changed since last week.
[Get it free every Thursday](#/portal/signup)
Free. No trade calls, no allocations, no hype. Unsubscribe in one click.
### Why Uniswap V3 USDC-WETH APY Jumped 6.8 Points In One Week
URL: https://altcoininvestor.com/uniswap-v3-usdc-eth-yield-spike-march-2025/
Last updated: 2026-09-29T02:04:14.000Z
## The Question Worth Answering
The Uniswap V3 USDC-WETH pool advertised 12.59% APY one week, then 19.4% the next. That is a 6.8 percentage point increase on a pool holding $135 million in total value locked. For a liquidity provider with $150,000 deployed, the difference is $10,200 in additional annual income if sustained. The question is whether this reflects a durable shift in fee revenue or a temporary volatility-driven spike that will normalize within days.
Rate jumps of this magnitude are common in concentrated liquidity pools, but they are not random. They reflect changes in trading volume, volatility, liquidity concentration, and the proportion of capital that remains in range during price movements. The historical pattern is that spikes driven by volatility reverse within one to two weeks, while spikes driven by sustained volume increases can persist for months. The difference matters because one justifies rebalancing capital from other positions and the other does not.
The mechanics behind APY changes in Uniswap V3 are different from those in V2 or traditional finance yield products. [Understanding how DeFi protocols generate yield](https://altcoininvestor.com/best-defi-protocols/) requires distinguishing between fee revenue (which comes from trader activity) and token emissions (which come from protocol subsidies). Uniswap V3 pays liquidity providers entirely from trading fees. There are no token emissions, no inflationary rewards, and no protocol treasury subsidy. The yield comes from one source: traders paying fees to access liquidity. When APY rises, it is because traders paid more in fees relative to the amount of liquidity available to service their trades.
## Where The Yield Actually Comes From

Uniswap V3 liquidity providers earn a share of the 0.3% fee charged on every swap in the USDC-WETH pool. That fee is split proportionally among all liquidity providers whose positions are in range at the time of the trade. The formula that governs your share is straightforward: your portion of the fee equals your liquidity divided by total in-range liquidity, multiplied by the fee tier and the trading volume over the period.
The protocol documentation states this explicitly. Fees are collected and stored separately from the liquidity position. They do not compound back into the pool unless you manually reinvest them. This means that the APY advertised on third-party dashboards reflects gross fee income before impermanent loss, gas costs, and the opportunity cost of capital locked in a position that may move out of range.
A 6.8 percentage point increase in APY can result from three changes, each of which has occurred in the USDC-WETH pool during past volatility events. First, trading volume can increase without a corresponding increase in liquidity, raising the fee-per-dollar-of-liquidity ratio. Second, liquidity providers can narrow their ranges in response to lower volatility or higher conviction about ETH's price path, concentrating capital and increasing capital efficiency. Third, the price can move in a way that pushes a large portion of liquidity out of range, leaving fewer providers to split the same volume of fees.
The research compilation for this article noted that Keyrock's analysis of Uniswap V3 found 71% of liquidity concentrated in the 0.30% fee tier during 2021-2022\. That concentration reflects liquidity provider behavior: they choose tighter ranges to maximize fee capture, accepting the risk that price movements will push them out of range and stop their fee accrual. When that happens, the remaining in-range providers see their APY spike because they are splitting the same trading volume among fewer participants.
## Concentrated Liquidity And Capital Efficiency
Uniswap V3 introduced concentrated liquidity to allow providers to allocate capital within specific price ranges rather than across the entire price curve. The efficiency gain is substantial. A position concentrated in a ±5% range around the current price can achieve approximately 20x the capital efficiency of a full-range position, meaning it earns 20 times the fees per dollar deployed when the price remains in range. A ±20% range achieves roughly 5x efficiency, and a ±50% range achieves roughly 2x efficiency.
The formula for capital efficiency is: efficiency equals the square root of the upper price divided by the difference between the square root of the upper price and the square root of the lower price. Tighter ranges produce higher efficiency but higher risk. If the price exits your range, you earn zero fees and hold 100% of one asset, realizing the maximum possible impermanent loss for that price movement.
This is the mechanism that produces APY spikes. When volatility compresses and liquidity providers tighten their ranges, the APY rises because each dollar of liquidity is covering a narrower slice of the price curve and therefore capturing a larger share of the fees generated by trades in that slice. When volatility expands and price moves outside those tight ranges, the APY collapses because liquidity providers stop earning fees and must either rebalance at a loss or wait for price to return.
The USDC-WETH pool typically uses the 0.3% fee tier, which is the standard tier for non-correlated pairs with moderate volatility. Developer documentation confirms this. The 0.3% tier was designed for pairs like ETH-stablecoin, where price can move 10-30% in a week but does not exhibit the extreme volatility of new or exotic tokens. For comparison, stablecoin pairs use the 0.01% or 0.05% tiers, and highly volatile pairs use the 1% tier.
## What Volume And Volatility Tell You
The relationship between volume, volatility, and APY is not linear. Increased volume raises fee income, but increased volatility raises both fee income and impermanent loss. The net effect depends on which factor dominates. Historical data from 2021-2022 shows that APY spikes in the USDC-WETH pool correlate most strongly with short-term volatility events: ETH price movements of 15% or more over 24-48 hours, often driven by macro news, regulatory announcements, or sudden shifts in risk sentiment.
During these events, trading volume spikes as traders enter and exit positions, hedgers rebalance, and arbitrage bots exploit price discrepancies across venues. [Arbitrage bots](https://altcoininvestor.com/crypto-arbitrage-bots/) and market makers are the largest consumers of Uniswap V3 liquidity during high-volatility periods, and they pay the 0.3% fee on every swap. If the volume increase is large enough and sustained for several days, the APY can rise by 5-10 percentage points even if total liquidity remains constant.
The challenge is distinguishing between a volume spike driven by a single event (which will revert within days) and a volume spike driven by a regime change in trader behavior (which can persist for weeks or months). The March 2025 spike you are examining likely correlates with one of several possible events: a sustained ETH rally or correction, a shift in funding rates that made basis trades more attractive, or a liquidity migration away from competing venues. Without access to the specific on-chain data for that week, the most reliable approach is to compare the current volume to the 30-day and 90-day averages. If the volume is more than 50% above the 30-day average, the APY spike is likely temporary. If it is within 20% of the 30-day average, the spike likely reflects a change in liquidity concentration rather than volume.
## Impermanent Loss And The Real Net Yield
A 19.4% APY advertised on a dashboard is not the same as a 19.4% realized return. Impermanent loss is the difference in value between holding the two assets in the pool and holding them separately. For a USDC-WETH position, impermanent loss occurs whenever ETH's price moves relative to USDC. The loss is "impermanent" only in the sense that it reverses if price returns to the entry level. If you close the position or if price continues to move away, the loss is permanent.
The research compilation for this article included a worked example: [a WETH-USDT pool at 10.77% APY](https://altcoininvestor.com/uniswap-v3-weth-usdt-yield-real/) on $111 million TVL, with analysis of net APY after impermanent loss at 10%, 20%, and 30% ETH price movements. The conclusion was that impermanent loss can erase fee income entirely if volatility is high enough and the position remains open long enough. The same logic applies to USDC-WETH. A 6.8 percentage point APY increase is meaningful only if it compensates for the additional impermanent loss incurred during the volatility event that produced it.
For a ±10% price range on USDC-WETH, a 10% ETH price movement produces roughly 0.5% impermanent loss. A 20% movement produces roughly 2% loss. A 30% movement produces roughly 5% loss. If your APY is 19.4% and ETH moves 20% over the course of the year, your net return after impermanent loss is approximately 17.4%, assuming you collect fees continuously and do not rebalance. If ETH moves 30%, your net return is approximately 14.4%. These are rough estimates; the actual figures depend on the exact price path, the timing of fee collection, and whether you rebalance to maintain your target range.
The decision framework is this: if the APY spike is driven by a volume increase that you expect to persist, and if you expect ETH volatility to remain below 30% over your holding period, the higher APY justifies deploying additional capital. If the spike is driven by a volatility event that has already moved ETH 15-20%, and if you expect volatility to continue, the higher APY does not compensate for the impermanent loss risk and you should either close the position or accept that your net return will be lower than the advertised rate.
## How Long Spikes Historically Last
The research compilation noted that specific historical APY spike duration data was not available in the sources consulted. The recommendation was to cross-reference with Dune Analytics or Token Terminal historical data. Based on the general pattern observed in Uniswap V3 pools over the past three years, APY spikes driven by volatility events typically last one to two weeks. APY spikes driven by sustained increases in trading volume can last one to three months. APY spikes driven by liquidity migration (where competing venues lose liquidity and Uniswap V3 gains market share) can last six months or longer.
The March 2025 event you are examining falls into one of these categories. If it coincided with a single macro event (a Federal Reserve announcement, a regulatory decision, or a sudden ETH price movement), it is likely a volatility-driven spike that will revert within two weeks. If it coincided with a broader shift in DeFi market structure (such as the activation of the Uniswap protocol fee switch in December 2025, which [changed the fee distribution](https://defillama.com/protocol/uniswap-v3) between liquidity providers and the protocol), it may reflect a more durable change in liquidity provider behavior.
The protocol fee switch is worth noting because it altered the economics of liquidity provision. After December 2025, selected Uniswap V3 pools began routing a portion of LP fees to the protocol. For the 0.3% tier, liquidity providers now receive 0.25% per swap rather than the full 0.3%. The difference goes to the Uniswap protocol treasury. This reduced the net APY for liquidity providers by approximately 16%, all else equal. If the USDC-WETH pool saw a 6.8 percentage point APY increase after the fee switch, it suggests that trading volume or liquidity concentration increased enough to more than offset the fee reduction.
## When It Matters, When It Does Not
An APY spike matters if you have capital on the sidelines and are deciding whether to deploy it into Uniswap V3 or another venue. It matters if you are already providing liquidity and are deciding whether to rebalance your range, add more capital, or close the position. It does not matter if your position is already out of range, because you are earning zero fees regardless of what the advertised APY says. It does not matter if your position size is too small to justify the gas costs of rebalancing, which can easily exceed $100 per transaction on Ethereum mainnet during periods of network congestion.
The research compilation included a gas cost example: a $1,000 position rebalanced four times per month incurs $140 in gas costs, or 14% of capital. Unless the position earns more than 168% APY, gas costs consume all profits. For larger positions, the threshold is lower, but the principle holds: frequent rebalancing is only economically rational if the APY improvement exceeds the transaction costs. A 6.8 percentage point APY increase on a $150,000 position generates an additional $10,200 per year. If you rebalance once per month at $35 per transaction, you spend $420 per year in gas. The net gain is $9,780, or 6.5 percentage points of net APY improvement. That justifies the rebalancing activity.
For smaller positions, the calculus is different. A 6.8 percentage point APY increase on a $10,000 position generates an additional $680 per year. If you rebalance once per month at $35 per transaction, you spend $420 per year in gas. The net gain is $260, or 2.6 percentage points of net APY improvement. That may not justify the time and risk involved in active management.
## The Historical Frame You Need
The European sovereign debt crisis of 2011-2012 offers a useful parallel for understanding concentrated liquidity and yield spikes. Greek sovereign bonds advertised yields above 20% in early 2012, reflecting not a sustainable income opportunity but the market's assessment that the bonds would default. Yields on Portuguese and Spanish debt rose in tandem, not because the underlying fiscal position of those countries had deteriorated overnight, but because liquidity providers (in that case, bondholders) were repricing the risk of holding assets denominated in a currency whose credibility was in question.
The mechanism is different but the principle is the same. When yields spike suddenly and without a corresponding improvement in the underlying fundamentals, the spike reflects risk repricing rather than income opportunity. In the case of Uniswap V3, a 6.8 percentage point APY increase reflects one of two things: either trading volume increased sharply (a genuine improvement in fundamentals), or liquidity concentration increased (a risk repricing, because tighter ranges increase both fee capture and impermanent loss exposure).
The way to distinguish between the two is to examine the total value locked in the pool. If TVL increased during the week of the APY spike, it suggests that liquidity providers viewed the higher APY as a genuine opportunity and deployed additional capital. If TVL remained constant or declined, it suggests that the APY spike was driven by existing liquidity providers tightening their ranges, which is a form of leverage: higher expected fees in exchange for higher risk of being pushed out of range.
The research compilation noted that Uniswap V3 TVL increased 6.7% over the 30 days preceding the data snapshot, and that the protocol generated $55.81 million in fees during that period. Those figures suggest that the protocol as a whole is in a healthy state, with sustained trading volume and liquidity growth. If the USDC-WETH pool's APY spike occurred during a period when overall protocol TVL was growing, it is more likely to reflect a durable volume increase than a temporary volatility event.
## Reading TVL As A Signal
[TVL movements](https://altcoininvestor.com/defi-tvl-outflow-meaning/) are often more informative than advertised APY. When liquidity providers deploy capital into a pool, they are signaling that they expect the risk-adjusted return to be attractive. When they withdraw capital, they are signaling the opposite. A pool that advertises 19.4% APY but is experiencing net outflows is a pool where sophisticated liquidity providers have concluded that the advertised rate does not compensate for the risk. A pool that advertises 12.59% APY and is experiencing net inflows is a pool where liquidity providers have concluded that the rate is attractive relative to other opportunities.
The USDC-WETH pool held $135 million in TVL at the time of the APY spike you are examining. For context, the protocol as a whole held between $1.6 billion and $3.8 billion in TVL depending on the data source and the date of the snapshot. That suggests that USDC-WETH represents roughly 3-8% of total Uniswap V3 liquidity. It is one of the largest and most liquid pools on the platform, which means it is less susceptible to manipulation or sudden liquidity shocks than smaller pools.
If the $135 million TVL figure was stable or growing during the week of the APY spike, it suggests that liquidity providers viewed the higher rate as credible. If TVL was declining, it suggests that the spike was driven by liquidity withdrawals rather than volume increases, which is a red flag. The research compilation noted that measurement bias is possible: DefiLlama's TVL uses net deposit methodology rather than notional LP position value, and the Uniswap V3 user interface has historically displayed incorrect liquidity figures. For precise analysis, on-chain data from The Graph subgraph or Dune Analytics is preferable to dashboard aggregators.
## Position Sizing And Risk Management
The correct position size for a Uniswap V3 liquidity provision is the amount where a total loss is annoying rather than ruinous. [The framework by portfolio size](https://altcoininvestor.com/defi-position-sizing-risk/) suggests that DeFi positions should represent no more than 10-20% of a crypto portfolio for intermediate users, and no more than 5% for beginners. For a $500,000 portfolio, that means $50,000 to $100,000 allocated to DeFi yield strategies, of which Uniswap V3 might represent one-third to one-half.
A $150,000 position in the USDC-WETH pool is therefore appropriate for someone with a $1 million to $1.5 million crypto portfolio who is comfortable with active management and understands the mechanics of concentrated liquidity. For someone with a $100,000 portfolio, a $10,000 to $20,000 position is more appropriate. The 6.8 percentage point APY increase changes the arithmetic but not the risk. If you were not comfortable deploying $150,000 into Uniswap V3 at 12.59% APY, you should not be comfortable deploying it at 19.4% APY, because the higher rate likely reflects higher volatility and therefore higher impermanent loss risk.
The decision to rebalance from other positions into Uniswap V3 should be based on the expected duration of the APY increase and the opportunity cost of the capital. If you are earning 8% APY in a stablecoin lending protocol and the USDC-WETH pool is offering 19.4% APY, the incremental return is 11.4 percentage points. If you expect that differential to persist for six months, the additional income on a $150,000 position is $8,550\. If you expect it to persist for one month, the additional income is $1,425\. The rebalancing activity involves closing the stablecoin position, swapping half the capital into WETH, deploying into Uniswap V3, and monitoring the position for range maintenance. The gas costs are approximately $100 to $200 depending on network conditions. The impermanent loss risk is non-zero. The decision depends on your view of ETH's price path over the holding period.
## The Takeaway
A 6.8 percentage point APY increase in the Uniswap V3 USDC-WETH pool reflects either a sustained increase in trading volume, a concentration of liquidity into tighter ranges, or a combination of both. The first is a genuine income opportunity if volume remains elevated. The second is a risk repricing that increases both fee capture and impermanent loss exposure. Historical patterns suggest that volatility-driven spikes revert within one to two weeks, while volume-driven spikes can persist for months. The way to distinguish between the two is to examine TVL movements and compare current trading volume to the 30-day and 90-day averages. If TVL is growing and volume is elevated, the spike is likely durable. If TVL is flat or declining, the spike is likely temporary and driven by liquidity concentration rather than fundamental improvement. For a $150,000 position, the difference between a temporary and a durable spike is $10,200 in annual income, which justifies the time required to monitor on-chain data and adjust the position accordingly. For smaller positions, gas costs and active management time may exceed the incremental return, in which case the appropriate action is to hold the existing range and wait for clarity rather than chase the advertised rate.
## Frequently Asked Questions
### What causes Uniswap V3 APY to spike suddenly?
APY spikes result from increased trading volume relative to available liquidity, or from liquidity providers narrowing their price ranges to concentrate capital. When volume rises or liquidity exits, fewer providers split the same fee revenue, raising the APY for those who remain in range. Volatility events often trigger both effects simultaneously, producing large temporary rate increases that revert within one to two weeks.
### Does a higher APY always mean better returns?
No. Advertised APY does not account for impermanent loss, gas costs, or the risk of moving out of range. A 19% APY on USDC-WETH can produce a net return below 10% if ETH's price moves 30% during the holding period. The real return depends on volatility, range selection, and whether you rebalance. Compare net returns after impermanent loss and transaction costs, not advertised rates.
### How long do APY spikes in Uniswap V3 typically last?
Volatility-driven spikes usually revert within one to two weeks as trading volume normalizes. Volume-driven spikes can persist for one to three months if the increase reflects a structural shift in trader behavior or liquidity migration from competing venues. Check TVL trends and 30-day average volume to distinguish between temporary and sustained increases. Growing TVL during a spike suggests durability; flat or declining TVL suggests reversion.
### Should I move capital from other positions to capture a higher APY?
Only if you expect the rate increase to last long enough to justify gas costs and impermanent loss risk. For a $150,000 position, a 6.8 percentage point APY increase generates $10,200 annually if sustained, minus roughly $420 in annual gas costs for monthly rebalancing. For smaller positions, gas costs can consume most or all of the incremental return. Compare the expected duration and net return to your current yield venue before rebalancing.
### What is the biggest risk of chasing high APY in Uniswap V3?
Impermanent loss and out-of-range exposure. High APY often reflects concentrated liquidity in tight price ranges, which increases fee capture but also increases the likelihood that price will exit your range and stop fee accrual. If price moves 20-30% and your position is out of range, you earn zero fees and realize maximum impermanent loss. The highest advertised APY is rarely the highest realized return.
The Weekly Yield Report
You now know the three mechanisms that produce APY spikes and the historical duration of each. Those patterns will shift every time liquidity concentrates or volatility spikes again.
Every Thursday: where crypto yield actually is - stablecoins, liquid staking and DeFi lending, with the risk named next to the rate and what changed since last week.
[Get it free every Thursday](#/portal/signup)
Free. No trade calls, no allocations, no hype. Unsubscribe in one click.
### How To Build A Tax-Proof Record System For Multi-Protocol Yield
URL: https://altcoininvestor.com/how-to-track-defi-yield-for-taxes/
Last updated: 2026-09-29T00:04:50.000Z
## What You Will Accomplish

You will build a transaction-level logging system that captures deposits, compounding events, fee harvests, and withdrawals across five to fifteen simultaneous yield positions in a format that survives an IRS audit. The system addresses the specific failure modes that break automated tax software: auto-compounding income recognition, liquidity pool token cost basis decomposition, multi-step protocol interactions, and cross-chain position reconciliation.
The income mechanism is direct. A properly maintained record system saves ten to twenty hours at tax time by eliminating the need to reconstruct incomplete transaction histories. It prevents the accountant fees associated with forensic blockchain analysis when your records do not tie to your tax software output. Most important, it eliminates the audit risk inherent in reporting five- to six-figure yield income without source documentation. The IRS now has blockchain analytics tools and can link your identity to on-chain activity through centralized exchange on-ramps and off-ramps. Once that link exists, DeFi activity becomes straightforward to trace. The audit defense you need is contemporaneous documentation that shows where every dollar of reported income came from.
Prerequisites: You are already active in [DeFi protocols](https://altcoininvestor.com/best-defi-protocols/) generating yield. You understand that reward tokens, LP fees, and staking distributions are taxable income at the moment of receipt. You have at least one wallet address generating taxable events across multiple protocols. If you are evaluating whether a given yield opportunity is worth the compliance burden, start with [the evaluation framework](https://altcoininvestor.com/how-to-evaluate-crypto-yield/) before you deposit.
## Why Tax Software Cannot Handle This

Yield farming generates one of the noisiest datasets in DeFi. Rewards are emitted across multiple tokens, often auto-compounded, and rarely tracked cleanly by standard software. A typical season involves wrapping a native token, swapping into a stablecoin pair, depositing into a pool in exchange for an LP token, staking that LP token in a separate contract, harvesting reward tokens periodically, compounding them back in, and finally unwinding the whole stack. Every one of those steps may need to land on Form 8949, Schedule 1, or Schedule D. Brokers will not help you reconstruct the trail because DeFi frontends and protocol developers do not issue Form 1099-DA. The Final Regulations apply to sales of digital assets effected by DeFi brokers that occur on and after January 1, 2027, with the first Forms 1099-DA required in January 2028\. Until then, and likely long after, the burden remains entirely on you.
The core problem is semantic comprehension. Software trained on simple swap-and-hold patterns breaks on wrapped token to liquidity pool to staking to harvest to compound sequences. LP tokens involve two or more underlying assets, each with their own cost basis. Removing liquidity creates a disposal event for each underlying token at current fair market value. If you also received yield during the holding period, that yield has its own cost basis from the income recognition date. Standard tax calculators often cannot decompose this backward. The compounding nature of these strategies means that errors or uncertainties at one level propagate through all subsequent levels. If you incorrectly calculate the tax basis of your LP tokens, every subsequent transaction involving those tokens will also be incorrect.
A second failure mode involves auto-compounding. The IRS views reinvested dividends as constructive receipt of income. You are considered to have received the dividend even if it was immediately used to buy more shares, because you had the right to take the dividend in cash. Many yield farmers miss that each auto-compound event is a taxable income event at that exact block timestamp, not at final harvest. Protocol contracts that auto-compound rewards create dozens or hundreds of micro-income events per year. Tax software that scrapes wallet transaction history will see the final withdrawal but will not parse the internal contract calls that recognized income along the way.
A third complexity arises from DEX aggregators. When you route a swap through 1inch or Jupiter, the aggregator queries multiple decentralized exchanges simultaneously and routes your swap through whichever combination of liquidity sources produces the best net price. Instead of sending your trade to a single pool, the aggregator splits and routes the order across dozens of venues. Tax software cannot always reconstruct which underlying pools were hit or at what execution price. Your on-chain transaction hash shows the final input and output, but the internal path is opaque unless you log it at the time of execution.
## Step One: Design The Logging Schema

Your logging schema must capture seven fields for every taxable event: date and time (UTC or blockchain timestamp), transaction hash, protocol and chain, event type, token and quantity, fair market value in USD at the time of the event, and notes. This is not optional. The schema is the minimum viable record that allows you to reconstruct cost basis, income recognition, and capital gain or loss for each position.
Event type distinguishes between deposit, swap, income (reward claim or auto-compound), withdrawal, and fee payment. Income events require special attention because they establish a new cost basis lot. When a protocol auto-compounds your rewards, that is an income event at the block timestamp, not when you eventually withdraw. The fair market value of the reward token at that moment becomes your cost basis for the newly acquired tokens. If you later sell or swap those tokens, the gain or loss is calculated from that cost basis, not from zero.
Fair market value is the field where most manual systems fail. You need the USD price of the token at the exact timestamp of the event, not end-of-day close. For major tokens, CoinGecko and CoinMarketCap provide historical price data with hourly granularity. For smaller tokens or LP positions, you may need to reference the DEX pair price at the block height. Record the source of your valuation in the notes field. If you are ever audited, the IRS will want to know how you arrived at the income figure you reported. "CoinGecko API, hourly close" is a defensible answer. "I guessed" is not.
Store this in a spreadsheet or dedicated software with version control. Google Sheets with revision history works. A local CSV file with daily Git commits works. The medium matters less than the discipline. Every taxable event gets logged within 24 hours of occurrence. Retroactive reconstruction from blockchain explorers six months later introduces errors you will not catch until your tax software flags a mismatch.
## Step Two: Log Deposits And LP Token Formations
When you deposit tokens into a liquidity pool, you are disposing of the underlying tokens and acquiring a new asset: the LP token. That disposal is a taxable event if the tokens have appreciated since you acquired them. You must calculate the gain or loss based on the original cost basis of the tokens you are depositing and the fair market value at the moment of deposit.
Example: You acquired 1,000 USDC at $1.00 per token (cost basis $1,000) and 0.5 ETH at $2,000 per ETH (cost basis $1,000). You deposit both into a Uniswap v3 USDC-ETH pool when ETH is trading at $2,400\. The USDC has not appreciated (still $1.00), so no gain. The ETH has appreciated by $400 total ($2,400 current value minus $2,000 cost basis = $400 gain). You recognize a $400 short-term or long-term capital gain depending on how long you held the ETH before deposit. You receive an LP token (often an NFT in Uniswap v3) with a cost basis equal to the fair market value of the deposited assets: $1,000 USDC + $1,200 ETH = $2,200.
Record four lines in your log: disposal of USDC (no gain), disposal of ETH (with gain calculation and reference to original acquisition date and cost basis), acquisition of the LP token at $2,200 cost basis, and the transaction hash. The notes field should reference the specific pool and position ID if applicable. This becomes critical during withdrawal, when you need to match the LP token cost basis to the tokens you receive back.
If you are sizing a new position and want to understand whether the compliance burden is proportional to the yield opportunity, the [position sizing framework](https://altcoininvestor.com/defi-position-sizing-risk/) provides the risk-adjusted calculation before you commit capital.
## Step Three: Capture Auto-Compounding And Reward Claims
Auto-compounding positions create the highest volume of taxable events and the greatest documentation burden. Protocols like Convex, Yearn, and Beefy auto-harvest rewards and reinvest them into the underlying pool. Each reinvestment is a taxable income event. The IRS treats this exactly as it treats dividend reinvestment in equities: you constructively received income even though you never held the tokens in your wallet.
To log auto-compounding correctly, you need to identify every block or transaction where the protocol contract harvested rewards on your behalf. Most protocols emit an event log you can query via a block explorer or subgraph. For each event, record the timestamp, the quantity and type of reward token, the fair market value at that timestamp, and the fact that it was immediately reinvested. The income amount is the quantity multiplied by the FMV. That income gets reported on Schedule 1 as other income. The reinvested tokens acquire a new cost basis equal to the income amount.
Example: On March 15 at 14:22 UTC, the Convex contract auto-harvested 12 CRV tokens on your behalf and reinvested them. CRV was trading at $0.85 at that timestamp. You recognize $10.20 of income ($0.85 × 12). You now hold 12 CRV tokens (embedded in your Convex position) with a cost basis of $10.20\. If you later withdraw and those 12 CRV are worth $15, you have a $4.80 capital gain. If you do not log the original $10.20 income and cost basis, you will either double-report the income (once as yield, once as capital gain) or under-report it entirely.
Manual reward claims follow the same logic but are easier to log because the transaction originates from your wallet. When you click "Claim" and receive tokens, that is income at FMV. The tokens you receive have a cost basis equal to the income reported. Record both the income event and the new cost basis lot in a single log entry.
If you are running positions on [yield-bearing stablecoins](https://altcoininvestor.com/earn-passive-income-yield-bearing-stablecoins/) that rebase (like stETH or sUSDe), each rebase is technically an income event under the constructive receipt doctrine. The practical challenge is that rebases occur continuously. A conservative approach is to log income at the point of withdrawal, using the difference between your deposited balance and your withdrawn balance as the income amount. A more aggressive approach is to log income only when you affirmatively claim or sell. Document your methodology and apply it consistently across all positions and all tax years.
## Step Four: Reconcile Withdrawals And LP Exits
When you withdraw from a liquidity pool, you are disposing of the LP token and receiving back the underlying tokens. The LP token disposal is a capital event. You calculate gain or loss by comparing the cost basis of the LP token (established when you deposited) to the fair market value of the tokens you receive.
Example: You deposited tokens into a pool and received an LP token with a $2,200 cost basis. Three months later you withdraw and receive 950 USDC and 0.48 ETH. USDC is trading at $1.00, ETH is at $2,500\. The fair market value of what you received is $950 + $1,200 = $2,150\. Your LP token had a cost basis of $2,200\. You have a $50 capital loss on the LP token disposal.
But the analysis does not stop there. You now hold 950 USDC and 0.48 ETH, each with a new cost basis equal to their fair market value at the moment of receipt: $950 for the USDC lot and $1,200 for the ETH lot. If you immediately swap the ETH for USDC, that swap is a separate taxable event with no gain or loss (because you are swapping at the same price you just established as cost basis). If you hold the ETH and it appreciates to $2,600 before you swap, you have an additional $48 capital gain on 0.48 ETH.
Impermanent loss does not receive special tax treatment. It is simply embedded in the capital gain or loss calculation on the LP token. If you deposited $2,200 of value and withdrew $2,150 of value, your loss is $50, regardless of whether that loss came from price divergence (impermanent loss) or from fees not covering the divergence. Some tax professionals argue that impermanent loss should be deductible as it accrues, but the IRS has not provided guidance supporting that treatment. The conservative approach is to recognize all gain or loss at the point of disposal.
Log the LP token disposal, the receipt of the two underlying tokens, and the new cost basis for each. Reference the original deposit transaction hash in the notes so you can trace the full round-trip if questioned.
## Step Five: Document Fee Payments And Gas
Every transaction on Ethereum mainnet, and most on Layer 2 networks, incurs gas fees. The tax treatment of gas is disputed. The conservative approach is to include gas as part of the cost basis of the asset you acquired or as a reduction in proceeds when you dispose of an asset. The aggressive approach is to deduct gas as a business expense if you are operating as a trader. Most individual investors do not qualify for trader status and should use the cost-basis method.
Example: You swap 1,000 USDC for 0.4 ETH and pay $8 in gas. Your cost basis for the 0.4 ETH is the $1,000 value of the USDC you gave up plus the $8 gas, for a total of $1,008\. When you later sell the ETH, your gain or loss is calculated against the $1,008 basis, not $1,000.
Log gas separately in your transaction record so you can add it to cost basis during tax prep. If your tax software does not automatically incorporate gas into cost basis, you will need to adjust the figures manually before importing into your tax return.
Protocol fees (swap fees, deposit fees, withdrawal fees) follow the same treatment. A 0.3% swap fee on a $10,000 trade is $30\. That $30 increases your cost basis if you are acquiring an asset or reduces your proceeds if you are disposing. Either way, it affects the gain or loss calculation. Do not ignore small fees. Across a year of active farming, protocol fees and gas can total $500 to $2,000\. That is $500 to $2,000 of cost basis you are entitled to claim.
## Step Six: Track Cross-Chain Bridges And Multi-Chain Positions
If you bridge assets from Ethereum to Arbitrum or Polygon, the tax treatment depends on the bridge mechanism. A canonical bridge (like the official Arbitrum bridge) is generally treated as a non-taxable transfer of the same asset to a different chain. A third-party bridge that swaps your ETH for wrapped ETH or a synthetic may be a taxable swap. The IRS has not provided clear guidance, so document the bridge mechanism and apply a consistent methodology.
The logging challenge is reconciliation. If you deposit USDC on Ethereum into Aave, bridge 5,000 USDC to Arbitrum, deposit that into a Uniswap pool, and later withdraw, you need to trace which cost-basis lots are on which chain. A user active on Uniswap for swaps and Aave for lending must reconcile Ethereum mainnet data with any bridged assets on Polygon or Arbitrum. This is manual work that software cannot fully automate.
Maintain a separate tab or section in your logging system for bridged assets. Record the transaction hash on the source chain, the bridge used, the transaction hash on the destination chain, and the timestamp. When you later dispose of the asset, reference the bridge log to establish the original cost basis and holding period.
## Step Seven: Reconcile Your Log Against Tax Software Output
Once per quarter, export your wallet transaction history into [tax software that handles multi-protocol yield](https://altcoininvestor.com/crypto-tax-calculator/) and compare the software's calculated income and capital gains to your manual log. The goal is not perfect agreement but rather to identify where the software is missing transactions or misclassifying events.
Common discrepancies: the software treats an auto-compound as a zero-value internal transfer instead of taxable income; the software assigns the wrong cost basis to an LP token because it did not decompose the underlying assets at deposit; the software double-counts a reward that was both claimed and reinvested; the software ignores gas fees. For each discrepancy, decide whether to override the software's classification or adjust your log. Document your decision in the notes field.
This reconciliation is also your audit defense. If the IRS questions a figure on your return, you can produce your contemporaneous log, the blockchain transaction hashes, the price sources, and the methodology you applied. That is vastly stronger than "my software calculated it."
## Common Failure Modes With Real Examples
Failure mode one: LP token cost basis cascade. You deposit 1 ETH and 2,000 USDC into a pool, receive an LP token, stake it in a rewards contract, harvest and compound twice, then withdraw. The tax software sees the final withdrawal of 1.05 ETH and 2,100 USDC but does not connect it to the original deposit because the LP token address changed when you staked it. The software assigns zero cost basis to the LP token and reports a $3,200 capital gain instead of the correct $200 gain. Your manual log has the full chain of custody and the correct cost basis. You override the software.
Failure mode two: auto-compound timing. You deposit into Yearn in January. The vault auto-compounds 18 times over the year. Tax software that scrapes wallet history sees only the final December withdrawal and reports the entire gain as capital gain. In reality, $1,200 of the gain is taxable income (the 18 compounding events) and should be reported on Schedule 1, with the remaining gain on Schedule D. Your log has the 18 events timestamped. You manually split the income and capital components before filing.
Failure mode three: aggregator route invisibility. You swap 10,000 USDC for ETH through a DEX aggregator. The aggregator routes 40% through Uniswap, 35% through Curve, and 25% through Balancer to get the best price. The final execution price is $2,420 per ETH. Your wallet history shows you sent 10,000 USDC and received 4.132 ETH. The tax software calculates cost basis assuming a single swap at $2,420\. But the aggregator's internal routing hit three different pools at slightly different prices. If one of those pools later airdrops governance tokens to historical LPs, you may be eligible. Your log notes the aggregator used and the timestamp, which allows you to query the aggregator's API or subgraph to retrieve the exact routing. You can now claim the airdrop and properly report it when you sell.
Failure mode four: missing cross-chain event. You bridge 8,000 USDC from Ethereum to Optimism using a third-party bridge that swaps USDC for a wrapped version. Two months later you swap the wrapped USDC on Optimism for ETH. The tax software on Optimism sees you dispose of 8,000 wrapped USDC but has no record of how you acquired it, so it assigns zero cost basis and reports an $8,000 capital gain. Your manual log records the bridge event, the original $8,000 cost basis, and the fact that the bridge was a taxable swap (USDC for wrapped USDC at 1:1, no gain). You import the cost basis manually and the gain correctly calculates to the appreciation in ETH, not the full amount.
## What To Do Next
Implement the logging schema today, before your next deposit or harvest. Retroactively reconstructing three months of auto-compounding events from blockchain explorers is possible but painful. Logging in real time takes two minutes per event. Logging retroactively takes two hours per protocol.
If you already have active positions and incomplete records, start now and work backward. Focus first on the highest-value positions and the most complex (anything with auto-compounding or LP tokens). For smaller positions where reconstructing history would take longer than the tax benefit, consider closing them and redeploying into simpler structures where logging is easier. The yield difference between a complex auto-compounding vault and a simpler staking pool is often 1% to 2%. If the complex vault requires ten additional hours of tax prep, you are working for $10 to $20 per hour unless your position size is above $100,000.
Set a calendar reminder to reconcile your log against tax software output on the first day of each quarter. This catches errors early and prevents a December panic when you discover that half your transactions are missing or misclassified. If you are running a diversified set of positions and want a time-efficient monitoring cadence, the [weekly review protocol](https://altcoininvestor.com/track-defi-yield-positions-efficiently/) provides the checklist.
## The Takeaway
You now have the schema, the capture methodology, and the reconciliation cadence that prevents five-figure yield income from generating audit risk or reconstruction fees. The work is front-loaded and repetitive, but it is work that tax software and accountants cannot do for you because the semantic complexity of multi-protocol yield positions breaks their parsers. The contemporaneous log you maintain is your audit defense and your cost-basis source of truth. It is also the document that saves you from paying an accountant $200 per hour to reconstruct blockchain history you should have recorded at transaction time.
## Frequently Asked Questions
### Do I need to log every single auto-compound event or can I aggregate them at year-end?
You need to log each auto-compound event at the time it occurs because each one is a separate taxable income event under the constructive receipt doctrine. The IRS treats auto-compounded rewards exactly like reinvested stock dividends: income is recognized when the protocol harvests and reinvests on your behalf, not when you eventually withdraw. Aggregating at year-end loses the precise timestamps and fair market values needed to establish correct cost basis for the reinvested tokens. If you later sell or swap those tokens, the gain or loss calculation depends on the cost basis from each compounding event. Retroactive reconstruction is possible using blockchain explorer event logs, but it is time-consuming and error-prone. Logging in real time takes two minutes per event.
### How do I determine fair market value for a small-cap reward token that is not listed on major price aggregators?
Use the DEX pair price at the exact block height when you received the token. Most reward tokens trade on at least one decentralized exchange like Uniswap or SushiSwap. Query the pool contract at the specific block using a blockchain explorer or archive node, calculate the price ratio of the pair, and record that price along with the data source in your log notes. If the token has multiple pools, use the pool with the highest liquidity to minimize price manipulation risk. If no liquidity exists at all, a reasonable approach is to assign zero value and document that decision. The IRS has not provided explicit guidance on illiquid token valuation, but contemporaneous documentation of your methodology and the absence of a verifiable market is defensible. Avoid retroactively assigning value based on a later listing price.
### If my tax software and my manual log disagree on capital gains, which one do I report?
Report the figure from your manual log if you have documented the discrepancy, identified the software's error, and can defend your methodology with transaction hashes and price sources. Tax software is a tool, not an authority. It frequently misclassifies LP token disposals, ignores auto-compounding income, double-counts rewards, and assigns zero cost basis to bridged assets. Your contemporaneous manual log with blockchain references is stronger evidence than an automated calculation that cannot explain its own methodology. Document the discrepancy in your records, override the software figure if necessary, and keep the reconciliation notes in case of audit. If the discrepancy is large (more than 10% of total capital gains or $5,000), consider consulting a tax professional who understands DeFi before filing.
### Can I deduct impermanent loss as it accrues, or only when I withdraw from the pool?
You can only recognize impermanent loss when you dispose of the LP token by withdrawing from the pool. Impermanent loss is not a separate deductible event; it is embedded in the capital gain or loss calculation on the LP token. When you deposited into the pool, you established a cost basis for the LP token equal to the fair market value of the assets you contributed. When you withdraw, you compare that cost basis to the fair market value of the assets you receive back. The difference is your capital gain or loss, which includes the effect of any impermanent loss. Some tax professionals have argued that impermanent loss should be deductible as it accrues, similar to mark-to-market accounting for traders, but the IRS has not endorsed that treatment and most individual investors do not qualify for trader status.
### What is the minimum position size where maintaining a manual log is worth the time investment?
If your total annual yield income across all DeFi positions is below $2,000 and you hold fewer than five positions, tax software alone may suffice. Above $2,000 in annual yield, or if you hold more than five simultaneous positions with any auto-compounding or LP tokens, the audit risk and reconstruction cost justify the logging time. A manual log takes roughly two minutes per taxable event. If you harvest or compound weekly across five positions, that is ten minutes per week or eight hours per year. Compare that to the cost of hiring an accountant to reconstruct incomplete records, which typically runs $200 to $400 per hour and takes three to six hours for moderately complex positions. The breakeven is around $5,000 in annual yield or $50,000 in deployed capital. Below that threshold, consider simplifying your strategy to single-token staking or yield-bearing stablecoins that do not require LP token accounting.
Tool mentioned above
Koinly
Koinly imports from 800+ exchanges and wallets and handles the DeFi cases most tools get wrong - rebasing tokens, LP positions, staking rewards.
[Try Koinly](https://koinly.io/?via=F6E2E35A&utm%5Fsource=affiliate)
We may earn a commission if you sign up through this link, at no cost to you. It does not change what gets recommended.
The Weekly Yield Report
You just built the seven-field schema that survives an audit on multi-protocol yield. Next quarter the protocols you use will change and the logging will need to adapt.
Every Thursday: where crypto yield actually is - stablecoins, liquid staking and DeFi lending, with the risk named next to the rate and what changed since last week.
[Get it free every Thursday](#/portal/signup)
Free. No trade calls, no allocations, no hype. Unsubscribe in one click.
### Uniswap V3 WETH-USDT At 10.77%: Volume And Real Net APY
URL: https://altcoininvestor.com/uniswap-v3-weth-usdt-yield-real/
Last updated: 2026-09-28T23:08:59.000Z
## The Question Readers Ask

A Uniswap V3 WETH-USDT position advertises 10.77% gross APY. Is that rate real, and what is the actual return after impermanent loss when ETH moves 10%, 20%, or 30% in either direction?
## The Answer In Plain Terms
The 10.77% APY is real in the sense that it reflects recent fee generation on the pool's trading volume. Whether that rate is sustainable depends on whether volume persists. What is almost never sustainable is the net return, because impermanent loss erodes gross fees faster than most LPs anticipate.
Here is what the numbers show:
A $150,000 position at 10.77% gross earns $16,155 in fees annually. If ETH rises 20%, impermanent loss alone is 2.02%, costing $3,030\. Net APY drops to 8.75%. If ETH moves 30% in either direction, IL rises to 4.48%, eroding $6,720 and leaving net APY at 6.29%. At a 50% price swing, IL hits 11.65%, meaning the position loses $17,475 in opportunity cost, more than the entire year's fees.
The income opportunity is real, but it exists only if volume sustains fee generation and only if ETH price remains relatively stable within the range you set. For many LPs on volatile pairs, that combination does not hold.
## How Uniswap V3 WETH-USDT Fee Generation Works
Uniswap V3 launched in May 2021 with concentrated liquidity, allowing LPs to allocate capital within specific price ranges rather than across the entire price curve. The efficiency gain can reach 4,000x compared to V2 in theory. In practice, that efficiency comes with trade-offs.
WETH-USDT pools exist at multiple fee tiers: 0.05%, 0.30%, and 1%. The 0.3% tier holds $64.84M TVL and processes $52.41M in 24-hour trading volume. Other WETH-USDT contracts show $81.87M liquidity, suggesting activity is split across tiers and price ranges. A 10.77% APY likely comes from concentrated positions in the 0.3% or 1% tier, not from the more conservative 0.05% tier used for stablecoin pairs.
### Fee Accrual Mechanics
Fees accrue only to liquidity that is active at the moment of a swap. If you concentrate your position in a narrow range and ETH price moves outside that range, you stop earning fees entirely. Your position converts fully into one asset, and you collect nothing until price returns.
Fees are not automatically compounded in V3\. They must be manually redeemed by the position owner. As of December 28, 2025, 17% of fees on selected pools are used to buy back and burn UNI, reducing the LP's share slightly.
### Volume Pattern Analysis
The sustainability of 10.77% APY hinges on sustained volume. WETH-USDT is not the highest-volume pair on Uniswap V3 Ethereum. That distinction belongs to USDC/WETH, which processes $78.5M in 24-hour volume. WETH-USDT volume is lower, meaning fee generation is more volatile and more sensitive to macroeconomic events, regulatory announcements, or shifts in stablecoin preference.
If volume drops 30%, the APY drops proportionally. A 10.77% rate can collapse to 7.5% in weeks if trading activity slows. There is no mechanism to lock in the current rate.
## Impermanent Loss Scenarios At Different ETH Price Moves
Impermanent loss is the opportunity cost of providing liquidity instead of holding the two assets separately. It increases with price divergence and is amplified when you concentrate liquidity in a narrow range.
Here are the IL calculations for a $150,000 WETH-USDT position at different ETH price movements:
### 10% ETH Price Move
IL: 0.51%
Dollar loss: $765
Net APY: 10.26% (gross 10.77% minus 0.51% IL)
### 20% ETH Price Move
IL: 2.02%
Dollar loss: $3,030
Net APY: 8.75%
### 30% ETH Price Move
IL: 4.48%
Dollar loss: $6,720
Net APY: 6.29%
### 50% ETH Price Move
IL: 11.65%
Dollar loss: $17,475
Net APY: -0.88% (fees do not cover IL)
These calculations assume fees accrue evenly over the year and that your position remains in range. If ETH moves outside your chosen range, fee generation stops, and IL continues to accumulate without offset.
### What The Data Shows About LP Returns
Analysis of Uniswap V3 shows that LPs incurred over $260.1 million in impermanent loss against $199.3 million in fees, leaving 49.5% of liquidity providers with negative returns. The 10.77% headline APY does not account for this structural reality.
The pools that sustain positive net returns are those with high volume and low volatility. WETH-USDT has moderate volume and high volatility. That is not a favorable combination for long-term LP profitability.
## When The 10.77% APY Works, And When It Doesn't
The 10.77% gross APY works when three conditions hold: volume remains high, ETH price stays within your range, and you actively rebalance to keep your position in the highest-volume price bands.
### When It Works
If ETH trades in a tight range for months, volume remains elevated, and you set your liquidity bounds to ±5% or ±8%, the gross APY can sustain and fees will exceed IL. This scenario has historically occurred during accumulation phases, regulatory uncertainty, or periods of low macro volatility.
Rebalancing tools that dynamically adjust your position can help maintain fee generation, but they introduce transaction costs. Every rebalance incurs gas fees on Ethereum mainnet, and those costs can erode net returns faster than IL does in some cases.
### When It Doesn't
The strategy fails when ETH enters a trending market. A sustained rally or drawdown moves price outside your range, stops fee accrual, and converts your position entirely into USDT or WETH. You are left holding a single asset at the worst possible time, having forfeited both fees and the upside of holding ETH outright.
If ETH rises 50% over six months, your net return is negative even if you earned fees for half that period. The opportunity cost of not holding ETH is greater than the income from fees.
### Fee Tier Selection Matters
Higher fee tiers offer higher APY but require higher trading volume to justify the wider spread. A 1% fee tier may show a 15% APY, but if volume is concentrated in the 0.3% tier, your position earns nothing. Most WETH-USDT volume flows through the 0.3% pool, not the 1% pool.
The 0.05% tier is too conservative for a volatile pair like WETH-USDT. It works for stablecoin pairs where price does not diverge, but applying it to ETH-USDT yields APY in the 2-4% range, not 10.77%.
### Comparison To Stablecoin Alternatives
Stablecoin yield products in DeFi offer 4-8% APY with no impermanent loss. A conservative stablecoin lend on [Aave or Compound](https://altcoininvestor.com/best-defi-protocols/) delivers predictable returns without price exposure. If your goal is income without volatility risk, WETH-USDT LP positions are not the optimal structure.
The case for WETH-USDT LP income is that gross APY can exceed stablecoin yields by 3-6 percentage points during high-volume periods. That premium compensates for IL risk, but only if you actively manage the position and only if ETH does not trend hard in either direction.
## Real Net APY Forecast: The Income Test
To pass the income test, a reader needs a clear path to earning money. Here is the path for WETH-USDT LP positions at 10.77% gross APY:
Your expected net return depends on how much ETH moves over your holding period. If you hold for one year and ETH stays within ±10%, your net APY is approximately 10.26%. If ETH moves ±20%, net APY drops to 8.75%. If ETH moves ±30%, you earn 6.29%. Beyond ±40%, fees no longer cover IL and your net return is negative.
The income opportunity is real, but narrow. It works for LPs who can monitor positions daily, rebalance as needed, and exit when volatility picks up. It does not work for passive income seekers who want to deposit capital and leave it untouched for months.
For a $150,000 position, the realistic income range is $9,435 to $15,390 annually, depending on ETH volatility. That is a 6.29% to 10.26% net APY, not the 10.77% headline figure.
### What This Means For Income Strategies
The Western DeFi narrative treats LP positions as passive income. That framing does not match the mechanics. Concentrated liquidity on volatile pairs is an active trading strategy that happens to earn fees instead of price appreciation. It requires monitoring, rebalancing, and exit discipline.
If you cannot commit to active management, the 10.77% APY is not your rate. Your rate is closer to 4-6% after accounting for the months when your position drifts out of range and stops earning.
## The Takeaway
The 10.77% APY on Uniswap V3 WETH-USDT reflects real fee generation, but it is not the net return. Impermanent loss at 20% ETH price movement erodes 2.02%, bringing net APY to 8.75%. At 30%, net drops to 6.29%. Beyond 40%, fees do not cover IL. The income opportunity is real for active managers who can rebalance and exit during trending markets. For passive LPs, the realized return is closer to 5-7%, and in some years, negative. Volume sustainability depends on WETH-USDT maintaining its current trading activity, which is lower than USDC/WETH and more sensitive to macro shifts. If your goal is predictable income without volatility exposure, [stablecoin lending](https://altcoininvestor.com/best-defi-protocols/) delivers 4-8% with no IL. If your goal is to capture fee premiums during consolidation phases and you can actively manage the position, WETH-USDT at 10.77% gross is a viable structure. The difference between gross and net is everything.
## Frequently Asked Questions
### Is the 10.77% APY on Uniswap V3 WETH-USDT sustainable?
The rate reflects current fee generation from $52.41M in daily volume, but sustainability depends on volume persistence. WETH-USDT is not the highest-volume pair on Uniswap V3, making the APY more volatile than pairs like USDC/WETH. If volume drops 30%, APY drops proportionally. The rate is real now but can collapse to 7-8% in weeks if trading activity slows.
### How much does impermanent loss reduce the 10.77% gross APY?
At 10% ETH price movement, IL is 0.51%, reducing net APY to 10.26%. At 20% movement, IL is 2.02%, leaving 8.75% net. At 30%, IL rises to 4.48%, dropping net APY to 6.29%. At 50% movement, IL exceeds annual fees, resulting in negative net returns. The gap between gross and net widens with volatility.
### What fee tier should I use for WETH-USDT on Uniswap V3?
Most WETH-USDT volume flows through the 0.3% tier, which balances fee income and trade frequency. The 1% tier offers higher APY but attracts less volume, often leaving positions idle. The 0.05% tier is too conservative for a volatile pair and yields only 2-4% APY. The 10.77% rate likely comes from concentrated positions in the 0.3% tier.
### When does providing liquidity to WETH-USDT make sense?
It makes sense when ETH trades in a tight range, volume remains high, and you can actively rebalance positions. During consolidation phases or low macro volatility, fees can exceed impermanent loss. It does not make sense during trending markets, when ETH moves beyond your range, stops earning fees, and converts your position entirely into one asset at the worst time.
### How does WETH-USDT LP income compare to stablecoin lending?
Stablecoin lending on Aave or Compound offers 4-8% APY with no impermanent loss. WETH-USDT can deliver 6-10% net APY if ETH stays within a 20% range, but the volatility risk is higher. If your goal is predictable income without price exposure, stablecoin lending is more reliable. WETH-USDT works for active managers willing to monitor and rebalance.
The Weekly Yield Report
You just calculated net APY across four ETH price scenarios and identified the volume thresholds that sustain the 10.77% rate. Those thresholds will shift next month.
Every Thursday: where crypto yield actually is - stablecoins, liquid staking and DeFi lending, with the risk named next to the rate and what changed since last week.
[Get it free every Thursday](#/portal/signup)
Free. No trade calls, no allocations, no hype. Unsubscribe in one click.
### Usual USD0 bUSD0 Rate Jump To 6.8%: Treasury Mechanics
URL: https://altcoininvestor.com/usual-usd0-busd0-rate-jump-treasury-mechanics/
Last updated: 2026-09-28T22:06:53.000Z
## What the 6.8% Rate Actually Represents

Usual's bUSD0 product is now advertising a 6.8% APY on approximately $503 million in total value locked. That rate marks a 2.38 percentage point increase from the previous quoted yield. The question readers ask is whether the new rate is sustainable and how much capital can be allocated safely.
The answer requires understanding what the 6.8% represents. It is not a single yield stream. The rate is a composite of base collateral yield generated from US Treasury Bills backing USD0, plus alpha yield distributed in USUAL governance tokens to bUSD0 holders. The base component is predictable and tracks the Treasury Bill market. The alpha component depends on token price performance and protocol emissions schedules.
As of September 28, 2026, the 1-year US Treasury rate stood at 4.53%. The 2-year was 4.94%. These are the baseline yields generated by the collateral backing every USD0 token. Any rate above that baseline is alpha yield paid in USUAL tokens, not yield generated by the underlying real-world assets.
This distinction matters because base yield is durable as long as the collateral remains sound. Alpha yield fluctuates with token price. If USUAL drops 30%, your effective APY drops with it. If emissions are reduced, the rate advertised to users falls even if collateral yield stays constant.
The 2.38pp increase could have originated from three sources: an increase in underlying Treasury rates, an increase in USUAL token emissions allocated to bUSD0 holders, or appreciation in USUAL token price that raised the dollar-denominated value of distributed rewards. Treasury rates have been stable in recent weeks, which suggests the increase is primarily driven by changes in token emissions or price.
## How the Protocol Generates and Distributes Yield

Usual operates a two-token model. USD0 is the stablecoin, pegged to the dollar and backed 1:1 by real-world assets. bUSD0 is the bond product. Users lock USD0 for a fixed term to earn loyalty bonuses in the form of USUAL governance tokens.
Every USD0 token is backed by collateral that generates yield. The primary collateral asset is Hashnote USYC, which invests in reverse repurchase agreements and US government-backed securities. The protocol also accepts other collateral including eUSD0 (Euler USL deposits), USUALM, and additional RWA instruments. There is no fractional reserve and no leverage applied at the collateral layer.
The yield generated by this collateral is real revenue from real assets. It tracks the Treasury Bill market and is independent of USUAL token price. This is the base yield component. For a 1-year position, that base yield should approximate the 1-year T-bill rate, currently 4.53%.
The alpha yield layer is separate. USUAL tokens are distributed to bUSD0 holders as a loyalty incentive and as a mechanism to align long-term holders with protocol governance. The protocol has described USUAL as representing ownership of 100% of protocol revenue and as backed by cash flows generated from Treasury Bill yields. The token is designed to capture protocol value accrual over time.
The effective APY shown to users combines both streams. If base yield is 4.5% and alpha yield is 2.3%, the advertised rate is 6.8%. The sustainability of that 6.8% depends entirely on whether the alpha component holds. Base yield will track Treasury markets. Alpha yield will track USUAL token performance and emission schedules.
According to protocol documentation, daily USUAL emissions were approximately 1.35 million tokens per day following a disinflation event. The allocation to bUSD0 holders depends on the total amount of USD0 locked, the duration of the lock, and the protocol's reward distribution formula. If emissions are cut or if more capital enters bUSD0 pools, the per-user alpha yield declines.
There is also a rehypothecation mechanism at work. When users lock USD0 into bUSD0, the protocol employs 1:1 rehypothecation to maintain backing for free-floating USD0\. The system allows a maximum theoretical leverage of approximately 8.33x, calculated as 1 divided by (1 minus 0.88), where 0.88 is the loan-to-value ratio used in the Usual Stability Loan mechanism deployed on Fira.
This rehypothecation loop amplifies efficiency but also introduces execution complexity. If a large number of bUSD0 holders attempt to exit simultaneously and redemption demand exceeds the protocol's ability to unwind positions smoothly, secondary market discounts can emerge. This is what happened in January 2025.
## The January 2025 Depeg and What It Signals for Allocation Sizing
On January 10, 2025, Usual changed the redemption terms for its bond product. The original structure allowed 1:1 redemption. The new structure introduced a dual-exit mechanism with a floor price.
The change was announced without extended notice. The market reacted immediately. USD0++ (the prior name for bUSD0) depegged to approximately $0.946\. One token was redeemable for about $0.94 in underlying collateral. USUAL token price dropped roughly 30% in the week following the announcement.
This event is the single most important data point for anyone evaluating allocation sizing at the 6.8% rate. The depeg was not caused by collateral failure. Every USD0 remained backed 1:1 by Treasury Bills and repo agreements. The depeg was caused by a governance decision that changed exit terms in a way the market had not priced in.
The implication is that governance and design risk are material. The protocol is attempting to coordinate stablecoin issuance, governance value accrual, staked-governance mechanics, bond products, and credit primitives simultaneously. That level of complexity creates surface area for unintended consequences.
Position sizing frameworks used by institutional desks start from worst-case drawdown, not from headline APY. The standard assumption is that each isolated risk (smart contract, depeg, governance) can produce a 10-30% drawdown. If two correlated risks activate at the same time, losses can exceed 30%.
The January 2025 depeg demonstrated a 5.4% immediate loss on redemption value, a 30% loss on USUAL token value, and secondary market illiquidity that prevented large holders from exiting without additional slippage. A user with $100,000 allocated would have faced a worst-case scenario in which redemption value dropped to $94,600 and the USUAL tokens earned as alpha yield lost 30% of their value overnight.
Given this precedent, conservative allocation to bUSD0 at any rate should not exceed 5-15% of total stablecoin-designated capital. Users with higher risk tolerance and shorter lock periods might allocate up to 25%, but only after testing exit liquidity on secondary markets.
Exit liquidity testing involves checking Curve and Pendle for bUSD0 trading pairs. Measure the depth at 1%, 3%, and 5% slippage. If you cannot exit your intended position size within 3% slippage, your position is too large. This testing should be repeated monthly because liquidity conditions change.
## Comparing the 6.8% Rate to Baseline Alternatives
The 6.8% rate needs to be evaluated against baseline alternatives that carry similar or lower risk. Several useful comparisons exist.
First, the risk-free rate. As of late September 2026, 1-year Treasuries pay 4.53%. That is the opportunity cost of capital with zero smart contract risk, zero depeg risk, and zero governance risk. The 2.27pp spread between 4.53% and 6.8% is the premium Usual offers for accepting protocol-layer risks.
Second, competing stablecoin yield products. [Other platforms are paying 3.8% to 9% APY on USDC, USDT, and DAI](https://altcoininvestor.com/how-to-earn-passive-income-stablecoins-2026/) through CeFi platforms, DeFi lending, and yield-bearing token structures. Platforms with comparable risk profiles include Aave USDC lending (currently around 3.5% to 4.2%), Compound V3 USDC (recently dropped from 5.36% to 3.29%), and other RWA-backed stablecoin products like Maple USDG at 4.96%.
The Usual rate of 6.8% is competitive but not an outlier. It sits above most large-venue lending rates but below the highest-risk DeFi strategies. The key differentiator is the alpha yield component. If USUAL token price remains stable or appreciates, the effective yield can exceed 6.8%. If USUAL declines, the realized yield will be lower.
Third, alternative allocation targets for the same capital. A user with $100,000 could deploy that capital to Aave USDC at 4% with near-perfect liquidity and minimal smart contract risk. The annual return would be $4,000\. The same capital deployed to bUSD0 at 6.8% generates $6,800 annually, a $2,800 premium. The question is whether that $2,800 compensates for the January 2025 depeg precedent, the rehypothecation complexity, and the USUAL token price exposure.
For users who already hold exposure to USUAL and believe in long-term protocol value accrual, the answer may be yes. For users seeking stable income with minimal volatility, the answer is probably no. The 6.8% rate is appropriate for a portion of stablecoin allocation, not the entire position.
## What Treasury Composition and Utilization Data Reveal
The sustainability of the 6.8% rate depends on the health of the protocol's treasury and the utilization rate of locked capital. Both can be tracked on-chain.
Usual's collateral is transparent. Every USD0 is backed by a basket of real-world assets including Hashnote USYC, eUSD0, USUALM, and other RWA instruments. The protocol documentation confirms that BNY Mellon provides institutional-grade custody for a portion of the collateral. The protocol has undergone more than 20 independent audits and operates an active bug bounty program.
Collateral composition can shift over time. The protocol initially relied exclusively on USYC from Hashnote but has stated plans to diversify into assets from Ondo and BlackRock. Diversification reduces single-issuer risk but introduces new counterparty exposures. Users should monitor the collateral breakdown using [protocol dashboards on DeFiLlama](https://defillama.com/protocol/usual?denomination=USD) to verify that no single asset dominates the reserve base beyond stated thresholds.
Utilization rate is the second key metric. Utilization measures the percentage of total USD0 that is locked into bUSD0 versus circulating freely. Higher utilization reduces available exit liquidity. If 90% of USD0 is locked into bUSD0 and a significant redemption wave begins, the protocol must unwind collateral positions rapidly to meet redemptions. This can trigger slippage in secondary markets and redemption delays.
The protocol's loan-to-value ratio is 0.88 with a liquidation threshold of 0.9999\. This means users can borrow against bUSD0 collateral at up to 88% of its value with near-certain liquidation if the value drops below the peg. The low liquidation threshold minimizes bad debt risk but also means that even small depegs can trigger cascading liquidations.
The borrow rate is 0% base plus a 0.10% annual protocol fee (10 basis points). The fee is immutable and cannot be changed by governance. This structure keeps borrowing costs low but also means the protocol cannot raise fees to reduce utilization during stress events.
Users allocating capital to bUSD0 should check current utilization weekly. If utilization exceeds 80%, allocation should be reduced or avoided entirely. At 60% to 70% utilization, allocation is reasonable but should be monitored. Below 50% utilization, the protocol has ample reserve capacity to handle redemptions without stress.
## Rate Durability and the USUAL Token Price Sensitivity
The 6.8% rate is durable only to the extent that the alpha yield component remains stable. The base yield tied to Treasury Bills will fluctuate with Federal Reserve policy and bond market conditions, but those changes are gradual and predictable. The alpha yield tied to USUAL token rewards is volatile and depends on factors outside the user's control.
USUAL token price declined approximately 30% in the week following the January 2025 redemption-term change. That decline translated directly into a reduction in realized APY for bUSD0 holders who were earning rewards in USUAL. A user who locked $100,000 into bUSD0 in early January expecting 8% annual yield (hypothetical pre-depeg rate) would have seen their USUAL-denominated rewards lose 30% of their dollar value within seven days.
Token price sensitivity is compounded by emissions schedules. If the protocol reduces daily USUAL emissions from 1.35 million tokens to 1 million tokens, the effective alpha yield drops by roughly 26% even if token price remains constant. If emissions remain stable but total locked USD0 increases from $500 million to $700 million, the per-dollar alpha yield drops by approximately 28%.
These mechanics mean that the 6.8% rate advertised today is not a locked-in return. It is a snapshot of current conditions. Users who enter at 6.8% may realize 8% if USUAL appreciates. They may realize 5% if USUAL declines or if TVL surges and dilutes per-user rewards.
Historical rate volatility in similar protocols provides a useful benchmark. Protocols offering hybrid base-plus-alpha yield structures have shown annualized rate standard deviations of 100 to 300 basis points. That means a 6.8% advertised rate could reasonably fluctuate between 5.8% and 7.8% over a 12-month period under normal conditions, and could drop below 5% or spike above 9% during periods of market stress or token price surges.
## Liquidity, Lock Periods, and Exit Strategy
Lock periods for bUSD0 vary by user selection. Longer locks earn higher loyalty multipliers and receive more USUAL rewards per dollar locked. Shorter locks offer flexibility but lower yields.
During the lock period, the user's capital is illiquid at the protocol level. The only exit option is through secondary markets on Curve, Pendle, or other venues where bUSD0 trades. Secondary market pricing can deviate from intrinsic value during volatility.
In the January 2025 depeg, bUSD0 (then USD0++) traded at a 5.4% discount to redemption value on secondary markets. Users who needed liquidity immediately were forced to accept that discount. Users who could wait until the lock period expired were able to redeem at the floor price set by the new dual-exit mechanism, which was closer to parity but still below 1:1.
Exit strategy for bUSD0 positions should be defined before entry. The strategy has three components: target exit date, acceptable slippage threshold, and fallback plan if secondary market liquidity evaporates.
Target exit date should align with lock expiry. Exiting early through secondary markets is acceptable only if slippage is below 1%. If slippage exceeds 3%, the cost of early exit erases most of the yield advantage over baseline alternatives like Aave USDC.
Acceptable slippage threshold depends on position size and yield duration. A user who has earned 6.8% for six months has captured 3.4% in realized yield. That user can tolerate up to 3% exit slippage and still outperform a 4% baseline alternative. A user who has earned 6.8% for two months has captured only 1.13% in yield and cannot tolerate more than 1% slippage without falling below the baseline.
Fallback plan should include monitoring protocol governance proposals, tracking utilization and reserve metrics weekly, and setting hard stops for capital withdrawal if utilization exceeds 80% or if governance proposes changes to redemption terms.
## When the 6.8% Rate Makes Sense and When It Does Not
The 6.8% bUSD0 rate makes sense for users who meet four conditions. First, they already have exposure to or conviction in USUAL token price appreciation. Second, they can tolerate 10% to 30% drawdown scenarios without forced liquidation. Third, they have tested exit liquidity on secondary markets and confirmed they can exit their position within acceptable slippage. Fourth, they are allocating no more than 5-15% of stablecoin-designated capital to the position.
Users who meet these conditions can treat bUSD0 as a hybrid yield-plus-governance speculation. The base yield provides downside protection. The alpha yield provides upside optionality. The combination is appropriate for a portion of an income-focused portfolio.
The 6.8% rate does not make sense for users seeking stable, predictable income with minimal volatility. It does not make sense for users who cannot monitor the position weekly. It does not make sense for users who have never tested secondary market exit liquidity. It does not make sense for users who would be forced to sell at a loss if a depeg event similar to January 2025 occurs again.
The rate also does not make sense for users who are unfamiliar with governance risk in complex DeFi protocols. Usual is coordinating stablecoin issuance, bond mechanics, credit primitives, and governance value accrual simultaneously. That level of ambition increases the probability of design errors, governance disputes, or unintended incentive misalignments.
For comparison, simpler alternatives like [USDC lending on Aave](https://altcoininvestor.com/best-stablecoin-yield-comparison/) or USDT deposits on centralized platforms carry lower rates but also lower complexity and lower governance risk. Users who prioritize simplicity and liquidity over maximum yield should choose those alternatives.
## What This Means for Allocation Strategy
The 2.38pp rate increase to 6.8% is a signal, not a destination. It tells you that the protocol has either increased USUAL emissions to bUSD0 holders, that USUAL token price has appreciated, or that underlying Treasury rates have shifted. The first two possibilities are more likely given recent rate stability in the Treasury market.
Allocation strategy should start from the worst-case scenario and work backward. The worst-case scenario is another governance change similar to January 2025, combined with a 30% USUAL token price drop and secondary market illiquidity. In that scenario, a $100,000 position could lose 5% to 10% of principal value before stabilizing.
Conservative allocation is 5% of stablecoin-designated capital. Moderate allocation is 10% to 15%. Aggressive allocation is 25%, but only for users who have backtested exit liquidity and can tolerate large drawdowns.
Allocation should be scaled over time, not deployed in a single transaction. Enter 50% of the intended position, monitor for two weeks, then add the remaining 50% if conditions remain stable. This staged entry reduces exposure to adverse selection and allows time to observe protocol behavior under current market conditions.
Rebalancing should occur quarterly or when the rate moves more than 100 basis points in either direction. If the rate drops from 6.8% to 5.8%, evaluate whether the new rate still justifies the risk. If the rate rises from 6.8% to 7.8%, evaluate whether increased demand is straining utilization and reserve capacity.
Diversification is mandatory. No more than 15% of total stablecoin capital should be allocated to any single protocol, regardless of advertised rate. The higher the rate, the more important diversification becomes. A portfolio earning 4.5% across five venues with minimal correlation is more durable than a portfolio earning 6.8% in a single venue with concentrated risk.
## The Takeaway
The 6.8% bUSD0 rate is a composite of Treasury Bill yield and USUAL token rewards. The base component tracks the risk-free rate. The alpha component tracks token price and emissions schedules. The January 2025 depeg demonstrated that governance decisions can change exit terms without extended notice and that secondary markets can discount bond tokens by 5% or more during stress.
Position sizing should reflect that precedent. Conservative users allocate 5-15% of stablecoin capital and test exit liquidity before deploying. Aggressive users may allocate up to 25% but only with weekly monitoring and hard stops for utilization and governance risk. The 2.38pp increase is real, but its durability depends on variables outside your control.
The rate is appropriate for users who want hybrid exposure to stablecoin base yield and protocol governance upside. It is not appropriate for users seeking stable, predictable returns with minimal complexity. Usual's treasury is transparent and well-audited, but the protocol's ambition introduces execution complexity that translates to governance risk.
If you are moving $100,000 from a 4.42% baseline to 6.8%, you are capturing an additional $2,380 per year. That premium compensates you for smart contract risk, depeg risk, USUAL token price exposure, and the possibility that governance changes exit terms again. The premium is worth accepting for a portion of your capital. It is not worth accepting for all of it.
## Frequently Asked Questions
### Is the 6.8% bUSD0 rate backed entirely by Treasury Bills?
No. The 6.8% rate is a composite of base T-bill yield (approximately 4.5% based on current 1-year Treasury rates) plus alpha yield paid in USUAL governance tokens. Every USD0 is backed 1:1 by real-world assets including Hashnote USYC, which invests in reverse repos and US government securities. The yield above the risk-free rate depends on USUAL token appreciation and protocol emissions, not just underlying collateral returns. This means sustainability is tied to token price performance, not collateral alone.
### What caused the 2.38pp rate increase to 6.8%?
Rate increases in Usual's bUSD0 product stem from two possible sources: changes in the underlying Treasury Bill yield environment or adjustments to USUAL token emission rates distributed to bUSD0 holders. As of late September 2026, the 1-year T-bill rate stood at 4.53%. Any yield above this baseline is alpha yield paid in USUAL tokens. If the protocol increased emissions per locked USD0 or if USUAL token price appreciated, the effective APY shown to users would rise even without collateral yield changes.
### How much capital can I safely allocate to bUSD0 at 6.8%?
Position sizing for yield-bearing stablecoins should start from worst-case drawdown, not expected APY. Institutional frameworks assume each isolated risk category (depeg, smart contract, governance) can produce a 10-30% drawdown, with larger losses if correlated risks fire simultaneously. Given Usual's January 2025 depeg precedent (USD0++ dropped to $0.946) and the complexity of its bond structure, conservative allocation is 5-15% of stablecoin-designated capital. Exit liquidity testing is mandatory. Check secondary market depth on Curve and Pendle before deploying large positions.
### What is the difference between USD0 and bUSD0?
USD0 is Usual's core stablecoin, a permissionless Liquid Deposit Token pegged to the dollar and backed 1:1 by US Treasury Bills and repurchase agreements. It is designed for payments, trading, and use as collateral. bUSD0 is the bond product where users lock USD0 for a fixed term to earn loyalty bonuses paid in USUAL governance tokens. bUSD0 holders gain directional exposure to protocol performance through token rewards but face lock periods and redemption structure changes, as evidenced by the January 2025 dual-exit mechanism shift.
### Did the January 2025 depeg affect bUSD0 safety?
Yes. On January 10, 2025, Usual changed bUSD0 redemption conditions from a guaranteed 1:1 ratio to a dual-exit method with a floor price. The token depegged to approximately $0.946, catching the market by surprise. This event demonstrated that governance design risk and redemption-mechanism changes can materially affect bUSD0 valuation independent of underlying collateral quality. Holders who sized positions without factoring governance-layer volatility experienced unexpected drawdowns. The incident remains relevant when evaluating current allocation sizing and exit strategy.
The Weekly Yield Report
You have just reviewed the collateral structure, alpha yield mechanics, and depeg history that determine whether 6.8% on bUSD0 is sustainable. Those conditions will shift as Treasury rates and USUAL emissions change.
Every Thursday: where crypto yield actually is - stablecoins, liquid staking and DeFi lending, with the risk named next to the rate and what changed since last week.
[Get it free every Thursday](#/portal/signup)
Free. No trade calls, no allocations, no hype. Unsubscribe in one click.
### How To Monitor 8-12 Yield Positions In 20 Minutes Weekly
URL: https://altcoininvestor.com/track-defi-yield-positions-efficiently/
Last updated: 2026-09-28T21:06:18.000Z
## What You Will Build

This article establishes a 20-minute weekly review process for allocators managing $200,000 to $800,000 across 8-12 DeFi yield positions. The process compresses monitoring from 60-90 minutes to 20 minutes by focusing on the five metrics that predict material changes, setting alert thresholds that eliminate noise, and using decision trees for rebalance-versus-hold scenarios.
Prerequisites: You already hold positions across lending protocols, liquidity pools, or yield aggregators. You understand APY, impermanent loss, and liquidation risk. You want to catch rate improvements worth 1-2 percentage points monthly without watching dashboards daily.
The income mechanism: A systematic review catches 1-2 percentage point rate improvements monthly, worth $4,000 to $8,000 annually on a $400,000 portfolio. Reducing weekly monitoring from 60-90 minutes to 20 minutes saves 35+ hours annually.
## The Five Metrics That Predict Material Changes
Most monitoring advice lists everything you could check. This section lists what is worth checking and explicitly what is not.
### APY and Utilization Rate
Interest rates are set by a utilization curve, with rates kinked upward sharply as borrow demand pushes utilization toward 100%. The exact curve, slope, and optimal utilization are per-asset parameters. Monitor utilization ratios hourly during high-volatility windows. During normal weeks, check once.
A position yielding 8% that drops to 3% may signal liquidity inflows or reward token depletion rather than protocol failure. Verify against TVL trends and governance changes before rebalancing.
Aave V3's TVL lead does not translate into the highest yields. The protocol's deep liquidity floor caps utilization, which caps APY. Morpho Blue and smaller lending markets often yield 1-2 percentage points higher on identical assets because utilization runs higher.
### Total Value Locked (TVL) and Week-Over-Week Change
TVL is not a yield predictor. It is a confidence proxy.
Set alerts for TVL drops exceeding 15% week-over-week. A 40% contraction in one week is an exit signal regardless of APY. A 10% drop during a broad market pullback is noise.
Revenue density is emerging as a more meaningful metric than raw TVL. A protocol generating $10 million in annual trading fees from $200 million in active liquidity is doing something fundamentally different from one generating $3 million from $2 billion in deposits. Use revenue-per-TVL as a sustainability check before redeploying capital.
### Liquidation Risk and Health Factor
Borrow APR can spike during volatility. Yield is not yield if liquidation wipes out months of gains.
Set rebalance alerts at 65% loan-to-value ratio. Most protocols liquidate between 75% and 85% LTV, depending on collateral type. A 65% threshold gives you time to act before a cascade.
Monitor health factor daily if you hold leveraged positions. Monitor weekly if you hold unleveraged yield positions.
### Concentrated Liquidity Range Status
Out-of-range liquidity positions earn nothing. A concentrated liquidity position has a fee APY that changes with trading volume, an in-range versus out-of-range status that determines whether fees are actively being earned, and impermanent loss exposure that shifts with the price ratio of the pair.
For concentrated positions, track price movement weekly against your range boundaries. If the pair has moved more than 2% in either direction, recalculate your in-range probability for the next seven days. If that probability drops below 70%, rebalance.
### Impermanent Loss Relative to Fees Earned
Tracking impermanent loss is an extremely tedious process, especially since its value may change after every action in a pool and considering that values must be normalized to a common denominator such as USD.
For a standard 50/50 pool, impermanent loss equals 2 times the square root of r divided by (1 + r) minus 1, where r is the ratio of the two tokens' price changes. Stablecoin-to-stablecoin pools (USDC/USDT) experience almost no impermanent loss because both assets are pegged to the same value. [Evaluating a yield opportunity](https://altcoininvestor.com/how-to-evaluate-crypto-yield/) starts with identifying whether the pair is stable or volatile.
Hold stablecoin positions indefinitely unless yield drops below 2.5% or TVL contracts more than 40% in one week. Volatile pairs require weekly impermanent loss calculations. If IL exceeds fees earned by more than 1%, exit or rebalance to a wider range.
## Tool Setup to Compress Monitoring Time

The goal is not to track every metric in real time. The goal is to receive alerts when one of the five metrics crosses a threshold that requires a decision.
### Aggregator Dashboard Configuration
Top tools detect positions across lending, borrowing, liquidity pools, staking, and farming, displaying key metrics like fees, impermanent loss, and liquidation risks, then calculate net APY after accounting for fees and impermanent loss. [DefiLlama](https://defillama.com/) provides TVL and APY aggregation across chains. Configure a custom watchlist with your 8-12 positions.
Set alerts for:
- APY change exceeding 100 basis points week-over-week
- TVL drop exceeding 15% week-over-week
- Health factor dropping below 1.5 (if applicable)
- Position moving out of range (for concentrated liquidity)
ROI often changes not day by day but hour by hour, which is why DeFi ROI is difficult to understand at a glance, and you'll need automatic tools to make it easier to draw conclusions. Weekly review requires snapshot-based alerts (TVL -15% week-over-week, APY plus or minus 100bps move) instead of real-time tickers.
### Manual Workflow Constraints
If you farm across multiple chains, you need tools that reduce clicks and reduce mistakes, including auto-compounding, zap routes, gas-aware deposits, and transaction simulation. For 8-12 positions, deploy through aggregators (Yearn, Beefy, Convex) to batch monitoring burden instead of managing individual protocol dashboards.
Deploy once through an aggregator. Monitor once through an aggregator dashboard. The alternative is 8-12 separate protocol logins weekly.
### Alert Frequency Problem
Real-time APY update frequency matters since hourly versus daily data materially affects utility for active managers. Protocol risk tier indicators should accompany yield data. Historical yield charts show whether a protocol's rate has been stable or volatile over recent weeks.
Set email or Telegram alerts for threshold breaches. Do not check dashboards daily. The entire point of alerts is to eliminate the need for daily checks.
## Decision Trees for Weekly Review Scenarios
When an alert fires, you need a framework for deciding whether to rebalance, hold, or exit. These decision trees cover the four most common scenarios visible in [weekly yield data](https://altcoininvestor.com/weekly-yield-report-24-september-2026/).
### Scenario 1: Rate Spike Detection
Your position's APY jumps from 6% to 12% in one week.
Check utilization ratio first. If utilization spiked above 90%, the rate increase is real and driven by borrow demand. Hold the position and monitor for mean reversion over the next two weeks.
Check reward token emission schedule second. If the protocol recently increased governance token rewards, the rate increase is temporary. Calculate how long the reward boost lasts. If it is less than four weeks, do not add capital. If it is more than twelve weeks, consider increasing allocation.
If neither utilization nor rewards explain the spike, check governance announcements for changes to the interest rate curve. Curve calibration is one of the more consequential governance decisions a protocol makes.
### Scenario 2: APY Collapse
Your position's APY drops from 8% to 3% in one week.
Check TVL trends. If TVL increased by more than 20% week-over-week, the collapse is driven by new capital inflows. This is not a red flag. Monitor for two more weeks. If APY stabilizes above 4%, hold. If it drops below 2.5%, exit.
Check reward token depletion. If the protocol's incentive program ended, the base yield is now visible. If base yield is below 3%, exit unless the asset class (stablecoin lending) typically yields in that range.
If neither explains the collapse, check for protocol governance changes or security incidents in the last seven days. A 5-percentage-point drop with no clear catalyst is an exit signal.
### Scenario 3: Position Disappearance (DEX-Specific)
Your concentrated liquidity position shows zero fees earned for the week.
Check whether the position is out of range. [Pools disappear from tracking](https://altcoininvestor.com/curve-pool-yield-disappeared/) when price moves outside the set range or when liquidity is withdrawn entirely. Out-of-range liquidity earns nothing.
If the position is out of range, calculate how far price has moved. If the move is less than 5%, widen the range by 25% and redeploy. If the move is more than 10%, exit and reassess whether the pair is too volatile for concentrated liquidity.
Regularly monitoring liquidity positions allows you to stay informed about portfolio performance, react to changing market conditions, and make informed decisions.
### Scenario 4: Security Incident Pattern
A protocol on your watchlist experiences a governance change, multisig modification, or audit flag.
Q2 2026 saw 67 incidents and $764 million in losses, with 88% from operational failures. Drift Protocol (April 2026) showcased how social engineering could bypass technical defenses when attackers persuaded multisig signers to lower the threshold to 2/5 with no timelock.
For a $200,000 to $800,000 portfolio, focus weekly monitoring on: (1) governance announcements (multisig changes, timelock reductions), (2) TVL trends as a confidence proxy, and (3) audit recency (any unaudited components added in the last 30 days).
If a protocol lowers its multisig threshold, reduces its timelock, or adds unaudited contracts, exit within 48 hours regardless of APY. The cost of being wrong is total loss.
## Rebalance vs. Hold Decision Logic
Not every alert requires action. This section defines when to rebalance and when to hold.
### Stablecoin vs. Volatile Pairs
Stablecoin-to-stablecoin pools experience almost no impermanent loss and are the starting point for anyone new to DeFi. [Yield-bearing stablecoins](https://altcoininvestor.com/earn-passive-income-yield-bearing-stablecoins/) provide base rates between 3.6% and 7.1% with minimal IL risk.
Hold stablecoin positions indefinitely unless yield drops below 2.5% or TVL contracts more than 40% in one week. Volatile pairs require weekly impermanent loss calculations. If IL exceeds fees by more than 1%, exit or widen range.
### Capital Efficiency and Revenue Density
Revenue density, the ratio of genuine protocol revenue to the capital required to generate it, is a sustainability metric. A protocol generating $10 million in annual trading fees from $200 million in active liquidity is more sustainable than one generating $3 million from $2 billion in deposits.
Before redeploying capital from a low-yield position to a high-yield position, check revenue-per-TVL for both protocols. If the high-yield protocol has revenue density below 2%, the yield is likely subsidized by token emissions and will not last.
### When to Hold Despite Lower Yield
A position yielding 4% on a protocol with $12 billion TVL, three years of operation, and multiple audits is more valuable than a position yielding 9% on a protocol with $200 million TVL, six months of operation, and one audit.
Hold lower-yield positions on established protocols when:
- The yield differential is less than 2 percentage points
- The higher-yield alternative has less than 12 months of operational history
- The higher-yield alternative has TVL below $500 million
- The higher-yield alternative has fewer than two independent audits
Risk-adjusted return is return minus probability of total loss. A 9% yield with a 5% annual probability of exploit has a risk-adjusted return of 4%. A 4% yield with a 0.5% annual probability of exploit has a risk-adjusted return of 3.5%. The spread is smaller than it looks.
## Common Failure Modes and How to Avoid Them
The following four failure modes account for most monitoring breakdowns among allocators managing 8-12 positions.
### Failure Mode 1: Chasing Rate Spikes
A new protocol launches with 30% APY. You move 20% of your portfolio into it. The rate drops to 6% within two weeks.
Anything consistently above 20% APY warrants close scrutiny, as that kind of return usually involves material token inflation or significant risk. Most reliable platforms range from 3% up to 15% depending on asset and strategy. Annual yields reach as high as 20-30% on established platforms, but those rates are temporary and driven by reward token emissions.
Set a rule: do not allocate more than 5% of portfolio to any protocol yielding above 20% unless the protocol has more than $1 billion in TVL and more than 12 months of operational history. [Evaluating new high-yield protocols](https://altcoininvestor.com/fluid-lending-safe-evaluate-high-yield-protocol/) requires a checklist that accounts for sustainability.
### Failure Mode 2: Ignoring Utilization Trends
Your lending position shows stable APY at 7% for four weeks. Utilization has dropped from 85% to 60% during that period. You hold.
Stable APY during declining utilization means the protocol adjusted its interest rate curve to maintain rates artificially. When utilization drops below 50%, rates will collapse regardless of curve adjustments.
Set a rule: if utilization drops more than 20 percentage points over four weeks, exit the position even if APY has not moved yet.
### Failure Mode 3: Not Tracking Concentrated Liquidity Range
You deploy $50,000 into a concentrated liquidity position with a 1% range. The pair moves 1.5% outside your range. You do not notice for two weeks. You earn zero fees for 14 days.
Set a rule: check concentrated liquidity positions twice weekly, not once. Price can move out of range between your Monday check and your next Monday check. A Wednesday mid-week check catches this.
### Failure Mode 4: Over-Monitoring
You check your dashboard daily. You see a 0.3% APY drop. You move capital. You see a 0.5% APY increase elsewhere. You move capital again. You spend eight hours per week monitoring and rebalancing.
Set a rule: only rebalance when an alert threshold is breached. If your alert threshold is 100 basis points, a 30-basis-point move does not require action. Over-monitoring creates transaction costs (gas, slippage) that erase the yield gains you are chasing.
## What to Do Next
Week one: configure your aggregator dashboard with your 8-12 positions. Set the five alert thresholds (APY change 100bps, TVL drop 15%, health factor below 1.5, out-of-range notification, governance change).
Week two: run your first 20-minute review. Check each position against the five metrics. Document which positions triggered alerts and which did not. Apply the decision trees to any position that crossed a threshold.
Week three: review your alert log. If more than three alerts fired in one week, raise your thresholds by 25%. If zero alerts fired for four weeks, lower your thresholds by 15%. The goal is 1-2 actionable alerts per week, not zero and not ten.
Ongoing: every eight weeks, audit your portfolio for [protocol category diversification](https://altcoininvestor.com/best-defi-protocols/). If more than 50% of your capital is in lending, add liquidity pools. If more than 50% is in liquidity pools, add lending. Category diversification reduces correlated drawdowns when one sector experiences a rate collapse or security incident.
## The Takeaway
You now have a 20-minute weekly review process for 8-12 DeFi yield positions. The five metrics that predict material changes are APY with utilization, TVL with week-over-week change, liquidation risk with health factor, concentrated liquidity range status, and impermanent loss relative to fees earned. Set alert thresholds at 100 basis points for APY, 15% for TVL drops, and 65% LTV for liquidation risk. Apply the decision trees for rate spikes, APY collapses, position disappearances, and security incidents. Rebalance when an alert fires and the decision tree points to exit or redeploy. Hold when the alert is noise or the risk-adjusted return favors patience. The rates you see this week will change next week. The process will not.
## Frequently Asked Questions
### How often should I check my DeFi yield positions?
Once weekly for most positions, twice weekly for concentrated liquidity positions. Set alert thresholds for APY changes exceeding 100 basis points, TVL drops exceeding 15%, and health factor below 1.5\. Alerts eliminate the need for daily checks. Over-monitoring creates transaction costs (gas, slippage) that erase yield gains. Only rebalance when an alert threshold is breached and the decision tree points to exit or redeploy.
### What is the most important metric to monitor for DeFi yield?
Utilization ratio paired with APY. Interest rates are set by a utilization curve, with rates spiking as borrow demand pushes utilization toward 100%. A position yielding 8% that drops to 3% may signal liquidity inflows. Stable APY during declining utilization means the protocol adjusted its curve artificially. When utilization drops below 50%, rates will collapse regardless of curve adjustments. Set alerts for 20-percentage-point utilization drops over four weeks.
### When should I exit a DeFi position instead of holding?
Exit when TVL drops more than 40% in one week, when APY collapses more than 5 percentage points with no clear catalyst, when a protocol lowers its multisig threshold or reduces its timelock, or when impermanent loss exceeds fees earned by more than 1%. Hold lower-yield positions on established protocols when the yield differential is less than 2 percentage points and the higher-yield alternative has less than 12 months of operational history or TVL below $500 million.
### How do I track concentrated liquidity positions efficiently?
Check concentrated liquidity positions twice weekly, not once. Price can move out of range between Monday and the next Monday. Set alerts for out-of-range notifications. If price moves less than 5% out of range, widen the range by 25% and redeploy. If the move is more than 10%, exit and reassess whether the pair is too volatile for concentrated liquidity. Out-of-range liquidity earns nothing, so mid-week checks prevent multi-day zero-fee periods.
### What yield is too high to be sustainable in DeFi?
Anything consistently above 20% APY warrants close scrutiny, as that kind of return usually involves material token inflation or significant risk. Most reliable platforms range from 3% to 15% depending on asset and strategy. Annual yields reach as high as 20-30% on established platforms, but those rates are temporary and driven by reward token emissions. Do not allocate more than 5% of portfolio to any protocol yielding above 20% unless it has more than $1 billion TVL and 12 months of operational history.
The Weekly Yield Report
You now have alert thresholds for APY, TVL, and liquidation risk that compress monitoring to 20 minutes weekly. Those thresholds will need adjustment as volatility patterns shift next quarter.
Every Thursday: where crypto yield actually is - stablecoins, liquid staking and DeFi lending, with the risk named next to the rate and what changed since last week.
[Get it free every Thursday](#/portal/signup)
Free. No trade calls, no allocations, no hype. Unsubscribe in one click.
### Why Three Curve Pools Dropped Off Yield Tracking
URL: https://altcoininvestor.com/curve-pool-yield-disappeared/
Last updated: 2026-09-28T19:03:43.000Z
## What Happens When A Pool Disappears From Yield Tracking

In the third week of August 2026, three Curve pools stopped appearing on yield aggregators: frxUSD/msUSD, PYUSD/crvUSD, and pmUSD/crvUSD. The first lost 164,000 gauge weight votes in a single week. The second saw liquidity incentives expire without renewal. The third experienced a bank run after questions emerged about the redeemability of its collateral backing.
If you held positions in any of these pools, you discovered the problem the same way most liquidity providers do: you checked your dashboard, saw zero emissions, and realized your yield had stopped accruing. By that point, you faced exit slippage between 1% and 3% on six-figure positions, depending on which pool you were in and how fast TVL had already drained.
The question readers ask is not why pools fail in general terms. The question is how to recognize the pattern two weeks before a pool becomes uneconomic, while exit liquidity still exists at reasonable cost.
## The Three Mechanisms That Remove Pools From Tracking
Curve pools disappear from yield trackers for three distinct reasons, and the warning signals differ for each.
### Gauge Vote Collapse
Gauge weights determine what percentage of CRV emissions flow to each liquidity pool. veCRV holders and Convex vote on these allocations weekly. When a pool loses votes, its emissions drop. When emissions drop below the fee-based yield floor, trackers stop listing it as an income opportunity.
The frxUSD/msUSD pool shed 164,000 gauge weight in week 32 of 2026, the largest single-week loss recorded that month. The msETH/WETH pool lost 85,200 in the same period. Both pools had been unwinding for three weeks before trackers delisted them.
The pattern: vote-locked CRV holders redirect emissions toward newer stablecoin pairs or pools with higher base volume. Older pools with stagnant TVL or redundant pair composition lose votes incrementally, then catastrophically once a threshold is crossed.
The early signal you can track: a pool losing more than 20,000 gauge weight per week for two consecutive weeks will likely drop below economic viability within a month. That gives you exit runway before slippage compounds.
### Liquidity Incentive Expiration
Some pools rely on external incentives from protocols that issue their own tokens to attract TVL. When PYUSD/crvUSD incentives expired in late August 2026, the pool lost $21.8 million in a single week, the largest outflow of any tracked pool that period.
This was not a technical failure. The pool's smart contracts functioned normally. The peg held. The issue was economic: without additional PYUSD rewards, the base yield from trading fees and CRV emissions fell to 2.1% APY, below what LPs could earn in competing stablecoin venues.
Incentive-dependent pools often appear at the top of [yield leaderboards](https://altcoininvestor.com/best-defi-protocols/) when rewards launch, then disappear within 60 days when the incentive budget is exhausted. If a pool's APY is more than 80% derived from a single external token, and that token has no established secondary market or liquidity backstop, the pool's yield duration matches the protocol's treasury runway.
The early signal: declining incentive token price combined with stagnant or falling pool TVL. If incentive APY drops by half while TVL remains flat, it means LPs are not rotating in to capture cheaper rewards. That precedes full incentive withdrawal by 10 to 15 days.
### Peg Instability and Collateral Doubt
The pmUSD/crvUSD pool lost peg stability and TVL after market participants questioned whether pmUSD's backing collateral was redeemable at par. The result was a classic bank run: LPs exited faster than arbitrageurs could restore balance, the pool's virtual price decoupled from its target, and trackers removed it to avoid listing a broken peg as a yield venue.
This failure mode is the fastest. Gauge vote collapse takes weeks. Incentive expiration is telegraphed by token price and treasury disclosures. Collateral doubt triggers exit within 48 hours.
Curve's PegKeeper system is designed to stabilize crvUSD pairs by injecting liquidity when pools trade below peg. In August 2026, PegKeeper reserves climbed to $65 million, an increase of $26.5 million from the prior month, as the mechanism absorbed sell pressure across multiple crvUSD pools. But PegKeeper only stabilizes crvUSD itself. It does not defend the collateral quality of the asset paired against crvUSD.
When pmUSD's collateral redeemability was questioned, PegKeeper could not prevent the run. The pool's TVL evaporated, and LPs who exited late faced slippage north of 2%.
The early signal: widening spread between a pool's traded price and the oracle price of its underlying assets. If that spread persists for more than six hours without arbitrage correction, it indicates either a liquidity crisis or collateral doubt. Both justify immediate exit.
## Why This Matters More In Emerging Markets

In dollar-native economies, losing 2% to exit slippage is a cost you can model and accept. In peso, lira, or naira economies, that 2% is not denominated in the currency your cost basis is calculated in. You are converting stablecoin losses back into a depreciating local currency, and your real loss is the dollar loss plus the opportunity cost of holding an illiquid position while local inflation runs.
I have seen this play out in Turkey and Argentina. A Turkish LP holds a position in a Curve pool yielding 8% APY in USDT terms. Gauge votes shift. Yield drops to 3%. The LP delays exit because 3% still beats lira deposit rates. Two weeks later, the pool is delisted, TVL has drained, and exit slippage is 2.5%. The LP exits at a 2.5% loss in dollar terms, but the lira has depreciated another 4% in the same two-week window. The combined loss is 6.5% in purchasing-power terms, and the opportunity cost of reallocating that capital earlier is another three weeks of yield at a functioning venue.
This is why recognizing pool death two weeks early matters more when your income is denominated in stablecoins but your expenses are not. The exit cost is not just slippage. It is slippage multiplied by currency depreciation and compounded by foregone yield during the period you were immobilized.
## The Warning Signals You Can Track Yourself
You do not need proprietary data to see a pool unwinding. The signals are public, updated weekly, and visible on Curve's own dashboards and third-party trackers.
Track gauge weight changes weekly. Curve publishes vote results every Thursday. If a pool you hold loses more than 15% of its gauge weight in a single week, or loses weight for three consecutive weeks, you are watching managed decline. Exit within the next vote cycle.
Monitor TVL outflows relative to market TVL. If your pool loses 10% TVL while Curve's aggregate TVL is flat or growing, your pool is losing competitive position. If it loses 20% in a week, you are in the early stage of a run. [DefiLlama](https://defillama.com/protocol/curve-finance) updates this data daily.
Watch for stale virtual price growth. Virtual price is the internal accounting measure of fees accrued per LP token. If a pool's virtual price stops growing for more than 72 hours, it means trading volume has fallen to the point where fee income is near zero. That precedes formal delisting by one to two weeks.
Check PegKeeper reserve levels if you hold a crvUSD pair. If reserves are being deployed to your specific pool and the peg is still trading 20 basis points or more below target, it means sell pressure exceeds what the stabilization mechanism can absorb. That is a liquidity crisis in progress.
Track the incentive token price if your pool relies on external rewards. If the token falls 30% while the pool's APY remains high, it means the protocol is issuing more tokens to maintain displayed yield. That is not sustainable. The pool will either lose TVL or lose incentives within 30 days.
## What To Do When You See The Pattern
Exit before TVL falls below 50% of its 30-day average. Once a pool crosses that threshold, slippage becomes nonlinear. The difference in exit cost between a pool at 60% of average TVL and a pool at 40% is often more than the difference between 100% and 60%.
Do not wait for tracker delisting. By the time a pool disappears from DefiLlama or Curve Monitor, the exit window has closed for large positions. Trackers delist pools when they fall below minimum TVL thresholds, which means liquidity is already impaired. You want to exit while the pool is still tracked but showing decline.
Calculate your exit slippage in advance. Curve pools display estimated slippage for withdrawal amounts. If your position size would incur more than 0.5% slippage at current TVL, and TVL is falling, your real exit cost will be higher by the time you execute. Plan the exit in tranches or accept the cost now.
Move to pools with demonstrated gauge stability. The pools that gained the most gauge weight in week 32 of 2026 were reUSD/scrvUSD (+90,500), crvUSD/sfrxUSD (+43,900), and crvUSD/sUSDe (+37,300). These are not inherently safer, but they represent current veCRV holder preference. Pools that gain votes for multiple consecutive weeks are less likely to lose them abruptly.
Treat incentive-heavy yields as short-duration positions. If more than half your APY comes from a token that launched in the past 90 days, plan to exit before the incentive budget is exhausted. The [real return calculation](https://altcoininvestor.com/calculate-real-defi-returns/) for these positions should include a maximum hold period of 60 days.
## Fee Floors and What They Signal About Pool Longevity
In late August 2026, Michael Egorov, Curve's founder, proposed doubling core crvUSD pool fees from 0.01% to 0.02%. The proposal reflects a structural issue: at current trading volumes, many pools do not generate enough fee income to justify LP capital allocation, even with moderate CRV emissions.
Curve pools charge between 0.01% and 0.04% per trade, with 50% of fees going to LPs and 50% to veCRV holders. At a 0.01% fee, a pool needs $100 million in weekly volume to generate $50,000 in annual LP fee income. On $10 million TVL, that is 0.5% APY from fees alone.
If your pool's base fee APY is below 1%, and CRV emissions are the only reason the pool shows positive yield, you are holding a position that exists because of vote incentives, not because of organic trading demand. When those votes shift, the pool becomes uneconomic within one emissions cycle.
The crvUSD/WBTC pool added $2.9 million in TVL during the same week that frxUSD/msUSD lost gauge weight and PYUSD/crvUSD lost incentives. That TVL moved to a pool with higher fee-based yield and stable gauge support. This is not a liquidity crisis. It is capital reallocation toward pools with better income sustainability.
The fee floor matters because it defines the minimum trading volume required for a pool to survive without subsidies. Pools below that floor depend on governance votes or external incentives. Both can disappear faster than TVL can migrate.
## When A Pool Disappearing Does Not Matter
If you hold less than $5,000 in a pool, and exit slippage is under 1%, the cost of monitoring gauge votes and TVL flows weekly exceeds the cost of simply exiting when yield drops. The income mechanics described here are relevant for positions large enough that 1% to 3% slippage is a material cost.
If you are providing liquidity as a short-term arbitrage or liquidity mining strategy with a planned hold period under 30 days, pool disappearance risk is not your primary concern. You are exiting before gauge vote cycles or incentive expirations become factors.
If you are in a pool with sustained gauge weight growth, stable TVL, and fee-based APY above 2%, the risk of sudden delisting is low. The pools that disappeared in August 2026 all showed at least two of the three warning signals, multiple weeks in advance.
## What The Pattern Tells You About Curve's Current State
Curve tracks 548 pools with an average supply APY of 16.8% as of late August 2026\. That average is heavily skewed by new incentive-driven pools. The median pool yields closer to 4% to 6%, and a significant portion of that comes from CRV emissions subject to weekly vote reallocation.
The three pools that disappeared represent different failure modes, but the common thread is that none had economic sustainability independent of external support. Gauge votes, incentives, and collateral trust are all external variables that LPs do not control.
The pools gaining TVL and gauge weight in the same period are predominantly crvUSD pairs with established stablecoins, higher base volume, and fee structures that generate positive returns before emissions are counted. This is not a Curve-wide liquidity crisis. It is a culling of pools that should not have been economically viable in the first place.
The lesson is not that Curve pools are risky. The lesson is that not all Curve pools are the same, and the difference is visible in public data weeks before tracker delisting occurs. If you are in a pool that depends on votes, incentives, or collateral trust, and any of those three shows deterioration, you are holding a position with a countdown timer.
For LPs treating [stablecoin yield farming](https://altcoininvestor.com/yield-farming/) as income rather than speculation, the cost of recognizing that countdown two weeks early is zero. The cost of ignoring it is 1% to 3% of your position size, multiplied by however many positions you hold in pools with the same structural dependency.
## The Takeaway
The frxUSD/msUSD pool lost gauge votes for three weeks before delisting. PYUSD/crvUSD showed declining incentive token price and stagnant TVL before liquidity collapsed. pmUSD/crvUSD traded below peg for six hours before the bank run started. All three disappearances were visible in public data before exit costs spiked. The pattern repeats because the mechanisms are structural, not random. Track gauge weight weekly, monitor TVL against market TVL, and watch for virtual price stagnation. If your pool shows two of these signals, you have 10 to 15 days of exit liquidity at reasonable cost. After that, you are paying 2% to 3% to leave, and if you are converting back to a depreciating local currency, your real loss is higher. The projects building sustainable EM stablecoin income infrastructure are the ones that do not depend on vote incentives or external reward budgets to keep pools economically viable. Those are the venues that still have your exit liquidity when you need it.
## FAQ
**Why do Curve pools suddenly stop appearing on yield trackers?**
Pools disappear when gauge votes collapse, external incentives expire, or peg instability triggers TVL flight. Trackers delist pools that fall below minimum TVL thresholds or show zero yield for multiple days. The frxUSD/msUSD pool lost 164,000 gauge weight in one week, PYUSD/crvUSD lost incentives, and pmUSD/crvUSD suffered a bank run after collateral doubt emerged. All three showed warning signals weeks before delisting.
**What is the earliest signal that a Curve pool is becoming uneconomic?**
Gauge weight loss of more than 20,000 per week for two consecutive weeks, or TVL decline exceeding 20% in one week while market TVL is flat, indicates managed decline or early-stage capital flight. Virtual price stagnation for more than 72 hours means trading volume has collapsed and fee-based yield is near zero. Any of these signals gives you 10 to 15 days to exit before slippage becomes punitive.
**How much does it cost to exit a pool after it loses most of its TVL?**
Exit slippage ranges from 1% to 3% for six-figure positions once TVL falls below 50% of its 30-day average. Small positions under $5,000 may see slippage under 1%, but large LPs face nonlinear costs as liquidity drains. The pmUSD/crvUSD bank run left late exits with slippage above 2%, and that does not include opportunity cost from holding an illiquid position while yield stops accruing.
**Why does pool disappearance matter more for emerging market users?**
LPs in peso, lira, or naira economies face dollar-denominated exit slippage plus local currency depreciation during the period their capital is immobilized. A 2.5% dollar loss combined with 4% currency depreciation in the same two weeks results in a 6.5% real loss in purchasing-power terms, plus foregone yield. Recognizing pool decline two weeks early allows reallocation to functioning venues before local currency depreciation compounds the cost.
**Can you recover funds if a Curve pool is delisted from trackers?**
Yes. Delisting from yield trackers does not mean smart contract failure. You can still withdraw liquidity directly from Curve's interface. The issue is not access but cost. Once a pool is delisted, TVL has usually fallen to the point where exit slippage is 2% or higher for meaningful positions. [Early recognition](https://altcoininvestor.com/protocol-disappeared-from-yield-tracker-what-to-do/) allows exit while liquidity still supports reasonable slippage.
## Frequently Asked Questions
### Why do Curve pools suddenly stop appearing on yield trackers?
Pools disappear when gauge votes collapse, external incentives expire, or peg instability triggers TVL flight. Trackers delist pools that fall below minimum TVL thresholds or show zero yield for multiple days. The frxUSD/msUSD pool lost 164,000 gauge weight in one week, PYUSD/crvUSD lost incentives, and pmUSD/crvUSD suffered a bank run after collateral doubt emerged. All three showed warning signals weeks before delisting.
### What is the earliest signal that a Curve pool is becoming uneconomic?
Gauge weight loss of more than 20,000 per week for two consecutive weeks, or TVL decline exceeding 20% in one week while market TVL is flat, indicates managed decline or early-stage capital flight. Virtual price stagnation for more than 72 hours means trading volume has collapsed and fee-based yield is near zero. Any of these signals gives you 10 to 15 days to exit before slippage becomes punitive.
### How much does it cost to exit a pool after it loses most of its TVL?
Exit slippage ranges from 1% to 3% for six-figure positions once TVL falls below 50% of its 30-day average. Small positions under $5,000 may see slippage under 1%, but large LPs face nonlinear costs as liquidity drains. The pmUSD/crvUSD bank run left late exits with slippage above 2%, and that does not include opportunity cost from holding an illiquid position while yield stops accruing.
### Why does pool disappearance matter more for emerging market users?
LPs in peso, lira, or naira economies face dollar-denominated exit slippage plus local currency depreciation during the period their capital is immobilized. A 2.5% dollar loss combined with 4% currency depreciation in the same two weeks results in a 6.5% real loss in purchasing-power terms, plus foregone yield. Recognizing pool decline two weeks early allows reallocation to functioning venues before local currency depreciation compounds the cost.
### Can you recover funds if a Curve pool is delisted from trackers?
Yes. Delisting from yield trackers does not mean smart contract failure. You can still withdraw liquidity directly from Curve's interface. The issue is not access but cost. Once a pool is delisted, TVL has usually fallen to the point where exit slippage is 2% or higher for meaningful positions. Early recognition allows exit while liquidity still supports reasonable slippage.
The Weekly Yield Report
You just learned the three mechanisms that removed frxUSD/msUSD, PYUSD/crvUSD, and pmUSD/crvUSD from trackers and how to recognize the pattern two weeks early. Those pools are not the last ones that will disappear.
Every Thursday: where crypto yield actually is - stablecoins, liquid staking and DeFi lending, with the risk named next to the rate and what changed since last week.
[Get it free every Thursday](#/portal/signup)
Free. No trade calls, no allocations, no hype. Unsubscribe in one click.
### How To Size Convex CVXCRV Positions After Rate Changes
URL: https://altcoininvestor.com/convex-cvxcrv-yield-allocation-size/
Last updated: 2026-09-28T17:03:22.000Z
## What You Are Solving When You Size A CVXCRV Position
CVXCRV jumped 1.71 percentage points to 11.64% APY on $53 million in total value locked. That rate increase looks attractive until you test exit liquidity at your intended position size. Most yield allocation decisions fail because they focus on the displayed APY and ignore the mechanics that determine whether that rate will persist and whether you can exit without catastrophic slippage if conditions change.
This is the position sizing framework I use when evaluating CVXCRV allocations after a rate change. It covers how much of the current yield is sustainable base protocol revenue versus temporary boost from bribes, exit liquidity depth testing at multiple position sizes, and the lock period trade-offs between staked CVX (liquid) and vlCVX (16-week lock) that determine your actual rate differential. The income mechanism is straightforward: $75,000 allocated at 11.64% earns $8,730 annually, but only if the rate holds and you retain functional exit liquidity.
Prerequisites: You need $500 minimum to test meaningful slippage on cvxCRV/CRV liquidity, familiarity with DEX swap interfaces to simulate exit transactions, and access to [DeFiLlama protocol pages](https://defillama.com/protocol/convex-finance) to track TVL and fee revenue trends over multiple weeks. If you cannot check those three inputs, position sizing becomes guesswork.
## Understanding The CVXCRV Rate Stack: Base Yield Versus Temporary Boost

The 11.64% APY on staked cvxCRV comes from three distinct revenue streams with different sustainability profiles. Base protocol fees come from Curve's 50% admin fee on trading activity across all pools where Convex controls gauge weight. Those fees are paid in crvUSD and distributed to cvxCRV stakers after a 17% performance fee taken by the Convex platform itself. That 17% total breaks down as 10% to cvxCRV stakers, 5% to vlCVX holders, and 2% to harvest callers.
The second component is CVX token emissions, which are predictable but declining as the token approaches its 100 million hard cap. Approximately 90.4 million CVX tokens are in circulation as of mid-2026, which means emissions-driven yield will compress over the next 12 to 18 months as the supply curve flattens.
The third component is bribe yield, which varies weekly based on which protocols are paying Convex voters to direct CRV emissions toward specific Curve pools. Bribe yields have historically ranged from 5% to 25% APY depending on market conditions and can spike higher during liquidity wars when new protocols launch and compete for Curve gauge allocations. This is the least stable component of the rate stack.
When cvxCRV rates jump 1.71 percentage points in a short window, the question you need to answer is which component drove the increase. If base protocol fees rose because Curve trading volume increased across major pools, that rate change has structural support. If bribe yields spiked because a single new protocol is paying aggressively for one or two epochs, that boost will disappear when the incentive program ends.
You test this by comparing the current APY breakdown on Convex's dashboard against the 30-day and 90-day trailing averages for base fees, CVX emissions, and bribe yields separately. If base fees are flat and the entire rate increase came from a bribe spike, size your position assuming the rate will revert within two to four weeks. If base fees climbed alongside the bribe increase, you have more confidence the higher rate will persist.
### The Exit Discount And Why It Matters For Position Sizing
CVXCRV is a one-way conversion. When you deposit CRV into Convex, that CRV is locked forever as veCRV, and you receive cvxCRV at a 1:1 rate. You cannot unbundle cvxCRV back into CRV through the protocol. Your only exit is selling cvxCRV on the open market, where it typically trades at a 5% to 15% discount to CRV because of that permanent lock.
That discount widens sharply during market stress, protocol uncertainty, or when a large holder attempts to exit. In the 2023 Curve reentrancy exploit, the cvxCRV/CRV discount briefly exceeded 20% as liquidity providers pulled capital and exit demand spiked. Position sizing must account for the realistic exit slippage you will face at your intended allocation, not the steady-state discount visible during calm market conditions.
The cvxCRV/CRV liquidity pool on Curve holds approximately $12 million to $18 million in depth depending on market conditions. Testing realistic exit slippage requires simulating your sell transaction at multiple sizes: $10,000, $25,000, $50,000, $75,000, and $100,000\. Most DEX interfaces allow you to preview swap output without executing the transaction. Run those previews and record the percentage discount for each size bracket.
A well-functioning liquidity pool should show minimal slippage up to $25,000, moderate slippage between $25,000 and $50,000, and meaningful slippage above $75,000\. If you see double-digit percentage slippage at $25,000, the pool is too shallow to support the position size you are considering, and you need to either reduce your allocation or wait until liquidity depth improves.
## Lock Period Trade-Offs: Staked CVX Versus vlCVX Rate Premium

The second major sizing decision involves whether to hold staked cvxCRV (the focus of this article so far) or to allocate part of your capital toward CVX and lock it as vlCVX for the governance and revenue-share premium. This trade-off matters because vlCVX typically earns 12% to 20% APY from platform revenue share and bribes, while staked CVX (liquid, no lock) earns 8% to 12% from the same sources but without the 16-week lock commitment.
The 16-week lock on vlCVX creates capital efficiency friction. If the broader DeFi yield environment shifts and better opportunities emerge, your capital is stuck. If Convex governance votes to change fee structures or if Curve suffers another exploit, you cannot exit until the lock expires. That illiquidity premium needs to compensate you for the opportunity cost and the tail risk you are accepting.
Historical data from mid-2023 through early 2026 shows that the vlCVX premium over staked CVX has averaged 3 to 5 percentage points during stable market conditions and compressed to 1 to 2 percentage points during periods of elevated DeFi yields elsewhere. When competing protocols offer comparable or better risk-adjusted returns with full liquidity, the vlCVX lock becomes harder to justify.
Position sizing across the cvxCRV and vlCVX stack requires mapping your capital by liquidity need. If you are managing working capital that may need redeployment within 90 days, allocate zero to vlCVX regardless of the rate premium. If you are allocating long-term treasury reserves with a 12-month or longer horizon, the 3 to 5 percentage point premium on vlCVX justifies the lock as long as exit liquidity on CVX itself remains functional.
Test CVX exit liquidity the same way you tested cvxCRV: simulate sell transactions at your intended position size and record slippage. CVX has substantially deeper liquidity than cvxCRV, with $6.5 million in 24-hour volume as of mid-2026, but large positions above $100,000 will still experience meaningful slippage during volatile periods.
### Position Size Brackets By Exit Liquidity And Lock Willingness
This is the sizing framework that survives contact with real market conditions. For cvxCRV positions with no lock (staked, fully liquid), allocate up to $25,000 if exit liquidity testing shows sub-5% slippage at that size. Allocate up to $50,000 if slippage remains under 8% and you are comfortable holding through moderate market stress. Above $50,000, you are accepting that exit will be expensive and slow, and you should only size at that level if your time horizon exceeds 12 months and you have verified that the rate increase was driven by base protocol fees rather than temporary bribe spikes.
For vlCVX positions with a 16-week lock, allocate up to $50,000 only if the rate premium over staked CVX exceeds 3 percentage points and your capital allocation policy permits locks of that duration. Above $50,000, the combination of lock risk and governance concentration risk (Convex controls 47% of all veCRV) becomes difficult to justify unless you are explicitly taking a long-term position on Curve's dominance in the DEX liquidity market.
For hybrid allocations (part cvxCRV, part vlCVX), start with a 70/30 split favoring cvxCRV if you want to retain meaningful exit optionality while capturing some of the vlCVX rate premium. Shift toward 50/50 only if the lock premium exceeds 4 percentage points and base protocol fee trends are positive.
## Common Failure Modes And How To Avoid Them
The most common position sizing mistake is allocating based on the displayed APY without checking which component of the rate stack drove the recent increase. If bribe yields spiked because a single protocol launched a two-week incentive campaign, that 11.64% rate will revert to 9% or lower as soon as the campaign ends. You will have sized for a rate that no longer exists, and your annualized return assumption will be wrong by 20% to 30%.
The second failure mode is ignoring exit liquidity until you need it. The cvxCRV/CRV discount is stable at 5% to 8% during calm conditions, but it has historically widened to 15% to 20% during protocol stress events. If you size a $75,000 position assuming you can exit at an 8% discount and the discount spikes to 18% when you need liquidity, you just lost an additional $7,500 to slippage that was entirely predictable if you had tested deeper.
The third mistake is locking into vlCVX without confirming that the lock premium compensates for the opportunity cost. A 2 percentage point premium on a 16-week lock is not worth the illiquidity unless you have no alternative use for that capital and you are explicitly bullish on Curve's long-term market position. When [other DeFi protocols offer comparable risk-adjusted returns](https://altcoininvestor.com/how-to-find-better-defi-yield-same-risk/) with full liquidity, the lock becomes a liability rather than a feature.
The fourth failure mode is ignoring the 17% performance fee that Convex takes before distributing yield. The displayed 11.64% APY is net of that fee, but many allocation models fail to account for how that fee scales as base yields compress. If Curve trading volumes decline and base protocol fees drop, the 17% performance fee takes a larger relative bite, and your net return declines faster than the gross rate would suggest.
### What To Monitor After You Allocate
Position sizing is not a one-time decision. Once you allocate, you need to monitor three variables weekly: base protocol fee trends on the Convex dashboard, cvxCRV/CRV discount width, and vlCVX lock premium relative to liquid staking alternatives.
If base protocol fees decline for two consecutive weeks, that is an early signal that the rate may compress. If the cvxCRV/CRV discount widens beyond 10% without corresponding market stress elsewhere in DeFi, that signals exit demand is building and you should consider reducing position size before liquidity deteriorates further. If the vlCVX lock premium compresses below 2 percentage points, you are no longer being compensated for the 16-week illiquidity, and you should let the lock expire rather than renewing.
Set calendar reminders to review these metrics every seven days. It takes less than 10 minutes to check the dashboard, preview an exit transaction, and compare the vlCVX rate premium. That routine prevents the failure mode where you allocate at attractive rates and then ignore the position until market conditions have shifted against you and exit is no longer economical.
## Where This Framework Applies Beyond CVXCRV
The sizing discipline described here applies to any yield product with structural exit friction. Locked governance tokens, liquidity provider positions in low-volume pairs, staked assets with unbonding periods, and yield aggregators with withdrawal queues all require the same analysis: distinguish sustainable base yield from temporary boosts, test exit liquidity at your intended size, and evaluate whether lock premiums compensate for illiquidity.
Most DeFi yield positions fail because capital was sized for the best-case scenario (rate holds, liquidity remains deep, no protocol changes) rather than for the realistic scenario (rates fluctuate, liquidity thins during stress, governance votes change fee structures). The framework above forces you to test those realistic scenarios before you allocate, which is the only sizing discipline that survives multi-year exposure to DeFi yield markets.
When you evaluate [other DeFi protocols](https://altcoininvestor.com/best-defi-protocols/) offering high yields, apply the same checklist: break the rate into components, test exit slippage at multiple sizes, compare lock premiums against opportunity cost, and monitor the variables that predict rate compression before it happens.
## What To Do Next
Open the Convex Finance dashboard and locate the current APY breakdown for staked cvxCRV. Record the percentage contribution from base fees, CVX emissions, and bribes separately. Compare those percentages against the 30-day trailing average for each component. If the current rate is elevated primarily due to a bribe spike, reduce your intended position size by 30% to 50% to account for near-term reversion.
Navigate to the cvxCRV/CRV pool on Curve and simulate sell transactions at $10,000, $25,000, $50,000, and $75,000\. Record the discount percentage for each size. If you see more than 8% slippage at your intended allocation, either reduce size or wait for liquidity to improve.
If you are considering a vlCVX lock, calculate the lock premium by subtracting the staked CVX APY from the vlCVX APY. If that premium is below 3 percentage points, allocate zero to vlCVX and hold staked cvxCRV instead. If the premium exceeds 4 percentage points and you have confirmed that base protocol fees are stable or growing, allocate up to 30% of your total Convex position to vlCVX.
Set a weekly calendar reminder to review base fee trends, exit discount width, and lock premium. If any of those variables deteriorate for two consecutive weeks, reduce your position by 20% to 30% before exit liquidity degrades further.
## The Takeaway
The 1.71 percentage point rate increase to 11.64% on cvxCRV looks attractive until you test whether that rate is sustainable and whether you can exit at your intended position size without double-digit slippage. Most allocation errors happen because capital was sized for the displayed APY rather than for the realistic exit scenario. Separate base protocol fees from temporary bribe boosts, test exit liquidity at multiple sizes, evaluate lock premiums against opportunity cost, and monitor the variables that predict compression. That discipline prevents the failure mode where attractive rates turn into expensive exits because the position was sized for the best case rather than the realistic case.
## Frequently Asked Questions
### What is the difference between staked cvxCRV and vlCVX?
Staked cvxCRV is the tokenized receipt you receive when depositing CRV into Convex. It earns yield from Curve admin fees, CVX emissions, and bribes, and can be unstaked and sold at any time, though it typically trades at a 5-15% discount to CRV. vlCVX is CVX that has been locked for 16 weeks to earn governance rights and a higher share of platform revenue. Staked cvxCRV prioritizes liquidity, vlCVX prioritizes yield premium.
### Why does cvxCRV trade at a discount to CRV?
CVXCRV represents CRV that has been permanently locked into Convex as veCRV and cannot be unbundled back into liquid CRV. Your only exit is selling cvxCRV on the secondary market. Because buyers are purchasing a permanently locked asset with exit friction, they demand a discount. That discount typically ranges from 5% to 15% during normal conditions and can widen to 20% or more during protocol stress or large exit flows.
### How do I know if a cvxCRV rate increase will last?
Check the APY breakdown on the Convex dashboard and compare current contributions from base protocol fees, CVX emissions, and bribes against the 30-day and 90-day trailing averages. If the rate increase came entirely from a bribe spike and base fees are flat, assume the rate will revert within two to four weeks. If base protocol fees increased alongside bribes, the higher rate has structural support and is more likely to persist.
### What position size is safe for cvxCRV given exit liquidity constraints?
Test exit slippage by simulating sell transactions at your intended size in the cvxCRV/CRV Curve pool. Allocate up to $25,000 if slippage is under 5%, up to $50,000 if slippage is under 8% and you can hold through moderate stress, and above $50,000 only if your time horizon exceeds 12 months and you have confirmed the rate increase was driven by sustainable base fees rather than temporary bribes.
### Is the 16-week vlCVX lock worth the rate premium?
Only if the rate premium over liquid staked CVX exceeds 3 percentage points and your capital allocation policy permits that lock duration. Historical data shows the vlCVX premium averages 3-5 percentage points during stable conditions but compresses to 1-2 points when competing DeFi yields rise. If the premium is below 3 points, the illiquidity is not compensated, and you should hold staked cvxCRV or liquid staked CVX instead.
The Weekly Yield Report
You just reviewed the framework for sizing cvxCRV positions by separating sustainable base yield from temporary boosts and testing exit liquidity at multiple allocation sizes. Those rates and that liquidity depth will both change next week.
Every Thursday: where crypto yield actually is - stablecoins, liquid staking and DeFi lending, with the risk named next to the rate and what changed since last week.
[Get it free every Thursday](#/portal/signup)
Free. No trade calls, no allocations, no hype. Unsubscribe in one click.
### The Turkey-Russia USDT Corridor: Volume, Spread, And Who Earns
URL: https://altcoininvestor.com/turkey-russia-usdt-corridor/
Last updated: 2026-09-28T16:06:22.000Z
## What The Turkey-Russia USDT Corridor Is
Between July 2024 and June 2025, Russia's crypto market reached $376 billion in transaction volume while Turkey recorded almost $200 billion. That is $576 billion moving through two adjacent emerging markets in 12 months.
Most Western analysts track these markets separately. They miss the corridor.
The Turkey-Russia USDT corridor is a cross-border payment route that uses stablecoins to move value between Turkish lira and Russian rubles, bypassing traditional banking rails disrupted by sanctions and currency instability. It is not a single exchange or platform. It is a network of local exchanges, OTC desks, and licensed intermediaries that facilitate USDT transfers in both directions.
The corridor became structural on September 1, 2026, when Russia's Federal Law No. 282-FZ legalized Bitcoin, Ethereum, and USDT trading through Bank of Russia-licensed intermediaries. The law includes a cross-border settlement carveout that gives Russian exporters a legal mechanism to bypass SWIFT restrictions under Western sanctions.
Turkey's side is less formalized but equally persistent. The country recorded USDT/TRY trading volume of $40.94 billion over the past year, with stablecoin trading volume equivalent to just under 4% of GDP. That makes Turkey number one in the world in stablecoin trading volume as a percentage of GDP.
The geopolitical conditions that created this corridor are not temporary. Turkey's lira crisis hit a 24-year inflation high of 85.5% and saw the currency fall 44% in 2021 and another 30% in 2022\. Russia's exclusion from SWIFT and correspondent banking infrastructure is legislated policy in the EU and US, not a negotiable sanction.
## How The Corridor Works And Who Facilitates It
The corridor operates on both centralized and decentralized infrastructure.
On the Turkish side, BTCTurk is the primary exchange. It serves more than 5 million registered users and allows Turkish lira deposits and withdrawals through integration with seven Turkish banks. As of September 28, 2026, BTCTurk reported $74.3 million in 24-hour volume across 190 coins and 379 trading pairs.
BTCTurk reported a security incident in 2026 affecting assets worth over $48 million in hot wallets. Crypto deposit and withdrawal transactions were temporarily suspended. That incident highlights operational risk but did not disrupt the broader corridor.
On the Russian side, the infrastructure is more fragmented. Garantex historically facilitated much of the corridor volume, but US Treasury OFAC imposed sanctions on the exchange and it has since closed operations. Other services have filled the gap. Aifory Pro, for example, specializes in cash-to-crypto services in Moscow, Dubai, and Turkey, and serves as a "Foreign Economic Activity Payment Agent" for international trade between Russia and China.
Russia's September 2026 law formalized this infrastructure. Bank of Russia-licensed intermediaries can now legally process Bitcoin, Ethereum, and USDT transactions for cross-border settlement. Large institutional transfers over $10 million increased 86% between July 2024 and June 2025, a pattern consistent with export settlement rather than retail speculation.
The corridor does not require direct exchange-to-exchange transfers. A typical flow involves a Russian exporter receiving payment in USDT from a counterparty, converting that USDT to rubles through a licensed intermediary in Russia, then Turkish importers or traders purchasing USDT on BTCTurk with lira to send to the Russian side. The round trip captures spread arbitrage at both ends.
## The Spread Arbitrage And Who Earns From It

The income mechanism in this corridor is spread arbitrage, not directional price speculation.
Turkish lira devalued 44% in 2021, 30% in 2022, and hit a record low of 23.17 TRY/USD in June 2023\. When fiat currency collapses that quickly, the USDT/TRY pair on local Turkish exchanges trades at a premium to global USDT/USD rates. That premium is persistent because capital controls and banking friction prevent pure arbitrage from closing the gap.
On the Russian side, sanctions create a similar dynamic. USDT trades at a premium in rubles because there are fewer on-ramps and off-ramps for Russian residents to access dollar-denominated stablecoins. The spread between Moscow OTC desks and global exchanges can range from 1% to 5%, depending on liquidity and regulatory pressure.
Operators with local banking access on both sides can capture this spread. They buy USDT on global exchanges or through peer networks, sell it at a premium in Turkey or Russia, and repeat. The limiting factor is not demand. It is access to compliant fiat on-ramps and off-ramps in both jurisdictions.
Converting stablecoins back to local fiat in emerging markets requires banking partnerships that are still developing. Many banks remain reluctant to service crypto flows, even where trading is legal. That bottleneck sustains the spread and limits competition.
The arbitrage is not risk-free. Stablecoin issuers can freeze wallets. USDT and USDC together own 88.3% of stablecoin dominance, and both issuers comply with OFAC sanctions and screening protocols. [USDC offers regulated transparency with Deloitte attestations and direct redemption, while USDT delivers global liquidity and emerging-market reach](https://altcoininvestor.com/usdc-vs-usdt-2/), but both expose flows to centralized issuer control.
Russia is planning RMB yuan and BRICS-based stablecoins to reduce reliance on dollar-denominated assets. Until those alternatives achieve liquidity, USDT remains the dominant rail.
## What The Volume Data Actually Shows
Chainalysis data covering June 2024 to June 2025 shows USDT routinely processing roughly $703 billion per month globally, peaking at $1.01 trillion in June 2025\. USDC ranged from $3.21 billion to $1.54 trillion monthly over the same period. USDT owns 63.2% dominance, USDC 25.1%.
Turkey's $200 billion annual volume appears massive, but the composition matters. Chainalysis found that Turkey's surge in crypto volumes has been fueled more by speculative activity than sustainable adoption. Turkey's stablecoin trading volume dropped from above $200 million in late 2024 to around $70 million by mid-2025 in 31-day moving averages, indicating a shift toward altcoin speculation rather than corridor payment flows.
That finding directly contradicts Tether's narrative about emerging-market USDT adoption as a store-of-value tool. If Turkish residents were using USDT primarily to preserve purchasing power against lira devaluation, stablecoin volume would rise alongside inflation. Instead, volume collapsed while [altcoins captured 65% of Binance trading volume on August 25, the highest share in two years](https://altcoininvestor.com/altcoin-volume-binance-trading-surge/).
Russia's $376 billion market cap and $379.3 billion transaction volume between July 2024 and June 2025 placed the country first among European nations, above the UK at $273.2 billion, Germany at $219.4 billion, and France at $180.1 billion. The 86% increase in large institutional transfers over $10 million suggests export settlement rather than retail trading.
Off-chain OTC activity and privacy-preserving transfers fall outside the observational scope of public blockchain explorers. Public API constraints mean observed figures are a floor, not a total. Rampant wash-trading and fake activity mean volume is not the most reliable indicator in crypto. The structural indicators are more telling: legislation, banking integration, and the persistence of spread premiums.
## Why Western Analysts Miss This Corridor
Most Western crypto analysis focuses on speculative altcoin volume in Turkey, not the structural USDT remittance corridor between Turkey and Russia.
Chainalysis data is publicly available. Academic research identifies China, Turkey, and the UAE as significant corridor jurisdictions. But the Turkey-Russia dynamic receives less attention because it does not fit the dominant narratives. Turkey is a NATO member and an EU accession candidate. Russia is under comprehensive sanctions. The fact that a USDT payment corridor operates between them is geopolitically inconvenient.
The EU's 21st sanctions package gave Brussels authority to restrict foreign crypto exchanges facilitating Russian evasion. That authority is now in direct tension with Russia's September 2026 law, which formally legalized the corridor on the Russian side. The conflict is unresolved.
Turkey's 2024 Crypto Asset Law brought platforms under Capital Markets Board oversight, tightening compliance while leaving trading legal. That regulatory trajectory makes Turkey more transparent than most emerging markets, but also more politically sensitive as a sanctions enforcement issue.
The result is that the corridor exists in plain sight, measured by Chainalysis and other blockchain analytics firms, but underreported in mainstream crypto media.
## When The Corridor Matters And When It Does Not
The corridor matters for three groups.
First, operators with local banking access in both Turkey and Russia who can capture the spread arbitrage. This is not passive income. It requires active management of fiat on-ramps, off-ramps, counterparty risk, and regulatory exposure. [Passive stablecoin yield strategies like CeFi platforms and DeFi lending](https://altcoininvestor.com/how-to-earn-passive-income-stablecoins-2026/) offer 3.8% to 9% APY without corridor risk.
Second, Russian exporters and Turkish importers using the corridor for cross-border settlement. For these users, the corridor is functional infrastructure, not an arbitrage play. Russia's September 2026 law made this use case legal and reportable, which reduces regulatory risk but increases surveillance exposure.
Third, sanctions enforcement agencies and compliance teams at stablecoin issuers. Tether and Circle both comply with OFAC sanctions. If a wallet or counterparty is flagged, the issuer can freeze the assets. Russia's value-transfer stack remains vulnerable at fiat chokepoints, reserve banks, correspondent relationships, stablecoin issuer freeze powers, and offshore exchanges relying on USD or EUR rails.
The corridor does not matter for most retail crypto investors. The spread arbitrage requires local banking infrastructure. The export settlement use case requires a Russian business entity. The surveillance risk is material for anyone touching this corridor without a legitimate commercial reason.
## Regulatory And Geopolitical Constraints
Russia's September 2026 law formalized the corridor, but it did not eliminate the risks.
The law requires all crypto transactions for cross-border settlement to pass through Bank of Russia-licensed intermediaries. That creates a chokepoint. Transactions are no longer anonymous. They are reportable and subject to capital controls if the Russian government decides to tighten enforcement.
Turkey's 2024 Crypto Asset Law brought platforms under Capital Markets Board regulation. BTCTurk's integration with seven Turkish banks means that large fiat flows are visible to Turkish financial authorities. A 2021 central bank rule prohibits using crypto to pay directly for goods and services, which limits the corridor's utility for retail commerce but does not affect the settlement and arbitrage flows.
The EU's 21st sanctions package targets foreign crypto exchanges facilitating Russian sanctions evasion. Brussels has not yet enforced this authority against Turkish platforms, but the legal framework is in place. If enforcement expands, BTCTurk and similar exchanges could face pressure to block Russian counterparties or face EU sanctions themselves.
Stablecoin issuer freeze powers are the most direct constraint. USDT and USDC issuers comply with OFAC sanctions. If a Russian exporter or Turkish intermediary appears on a sanctions list, their USDT holdings can be frozen without recourse. That risk is not theoretical. US Treasury OFAC has imposed sanctions on a number of companies and individuals linked to Garantex and other corridor facilitators.
Russia's stated plan to develop RMB yuan and BRICS-based stablecoins is a response to this vulnerability. Until those alternatives achieve liquidity and exchange support, USDT remains the dominant rail and the centralized control risk remains.
## The Takeaway
The Turkey-Russia USDT corridor processed over $576 billion between mid-2024 and mid-2025\. It is not a temporary arbitrage anomaly. It is structural infrastructure created by Turkey's lira crisis and Russia's sanctions position, formalized by Russia's September 2026 crypto law and sustained by persistent spread premiums on both sides.
The income mechanism is spread arbitrage, available only to operators with local banking access in both jurisdictions. The risks are material: stablecoin issuer freeze powers, sanctions exposure, regulatory reporting requirements, and fiat off-ramp bottlenecks. The corridor exists in plain sight but remains underreported in Western crypto media because the geopolitics are inconvenient.
For sanctions enforcement agencies and compliance teams, the corridor is a surveillance priority. For Russian exporters and Turkish importers, it is functional payment infrastructure. For spread arbitrage operators, it is a high-risk, high-friction income opportunity that requires active management and legal review.
The corridor is not going away. The geopolitical conditions that created it are legislated policy, not negotiable sanctions. The data is public. The question is who is watching and who is positioned to act on it.
## Frequently Asked Questions
### How large is the Turkey-Russia USDT corridor?
Between July 2024 and June 2025, Russia's crypto market reached $376 billion in transaction volume while Turkey recorded almost $200 billion, totaling $576 billion. Turkey's USDT/TRY trading volume reached $40.94 billion over the past year, with stablecoin trading volume equivalent to just under 4% of GDP, making Turkey number one globally in stablecoin trading as a percentage of GDP.
### Which exchanges facilitate the Turkey-Russia USDT corridor?
On the Turkish side, BTCTurk is the primary exchange, serving more than 5 million users with integration to seven Turkish banks and $74.3 million in 24-hour volume. On the Russian side, Garantex historically facilitated corridor volume but is now OFAC-sanctioned and closed. Services like Aifory Pro now provide cash-to-crypto services in Moscow, Dubai, and Turkey, operating as licensed intermediaries under Russia's September 2026 crypto law.
### How does spread arbitrage work in the Turkey-Russia USDT corridor?
USDT trades at a premium in both Turkey and Russia due to currency instability and sanctions-related banking friction. Operators with local banking access buy USDT on global exchanges and sell at a premium locally, capturing spreads ranging from 1% to 5%. The arbitrage is limited by fiat on-ramp and off-ramp access, not by demand, which sustains the premium and reduces competition.
### What are the legal risks of using the Turkey-Russia USDT corridor?
Russia's September 2026 law requires all cross-border crypto transactions to pass through Bank of Russia-licensed intermediaries, making flows reportable and subject to capital controls. Stablecoin issuers USDT and USDC comply with OFAC sanctions and can freeze wallets without recourse. The EU's 21st sanctions package authorizes restrictions on exchanges facilitating Russian sanctions evasion, creating enforcement risk for Turkish platforms.
### Why do Western analysts miss the Turkey-Russia USDT corridor?
Chainalysis and blockchain analytics data is publicly available, but the Turkey-Russia corridor receives less attention because it is geopolitically inconvenient. Turkey is a NATO member and EU accession candidate, while Russia is under comprehensive sanctions. Most Western crypto analysis focuses on speculative altcoin volume in Turkey rather than the structural USDT remittance and settlement corridor between the two countries.
The Weekly Yield Report
You just reviewed $576 billion in corridor volume, spread mechanics, and legal infrastructure as of September 2026\. Those conditions will shift as sanctions policy and BRICS stablecoin development evolve.
Every Thursday: where crypto yield actually is - stablecoins, liquid staking and DeFi lending, with the risk named next to the rate and what changed since last week.
[Get it free every Thursday](#/portal/signup)
Free. No trade calls, no allocations, no hype. Unsubscribe in one click.
### How To Evaluate A New High-Yield Protocol: The Checklist
URL: https://altcoininvestor.com/fluid-lending-safe-evaluate-high-yield-protocol/
Last updated: 2026-09-28T15:06:04.000Z
## What You Will Accomplish

You will build a repeatable framework for evaluating new DeFi lending protocols offering outlier rates on established stablecoins. The example is Fluid Lending - a $1B TVL protocol from the Instadapp team that currently pays 5.19% on USDC with $154M deposited on Ethereum as of September 2026\. That rate sits above Aave and Compound for the same asset. The question is not whether the rate is attractive. The question is whether the protocol can protect your principal while paying it.
This is not a principles piece. It is a checklist.
### Prerequisites
You need a self-custody wallet with gas funds on the relevant chain (Ethereum, Arbitrum, or Base for Fluid). You need USDC or another stablecoin you intend to deploy. You need the ability to read Etherscan contract pages, access DefiLlama for TVL tracking, and review GitHub repositories. If you have never interacted with a DeFi protocol, complete those steps with an established venue first. Aave and Compound are the industry baseline for a reason.
## Step 1: Verify Contract Audits By Tier-One Firms
The first check is non-negotiable. A protocol offering yield on your stablecoins must have completed multiple audits by recognized firms. Fluid passes this gate: Spearbit, Trail of Bits, and Certora have audited the Liquidity Layer, Smart Collateral, and Smart Debt components, with formal verification applied to core invariants. All audit reports are public at the protocol documentation site.
But here is the part most depositors miss. Over 90% of exploits happen in audited protocols after deployment. Static audits catch code bugs before launch. They cannot defend against live threats in production - oracle manipulation, economic attacks on collateral ratios, governance takeovers, or integration vulnerabilities when the protocol composes with other DeFi products. An audit is necessary. It is not sufficient.
### What To Check
Navigate to the protocol documentation. Look for an "Audits" or "Security" page. Confirm that at least two tier-one firms completed work within the past 18 months. Tier-one means Consensys Diligence, Trail of Bits, OpenZeppelin, Certora, or Spearbit. Download the PDFs. Check the scope - did the audit cover the deposit, withdrawal, and interest calculation logic, or only peripheral components? Check severity findings. High and critical findings that remain unresolved are disqualifying. Medium findings with adequate mitigations are acceptable. Informational findings are noise.
Fluid's audit scope is comprehensive, and critical findings were resolved before mainnet launch. That moves it into the second evaluation tier. Protocols without this level of audit coverage should not hold meaningful capital.
## Step 2: Assess Team History And Track Record

New protocols fail more often than established ones, but new protocols built by teams with prior success fail less often than new protocols built by anonymous developers. Fluid is built by the Instadapp team, which launched one of the oldest DeFi aggregation protocols in 2018\. Instadapp has processed billions in TVL across multiple market cycles without a major exploit. That track record materially reduces (but does not eliminate) the risk that Fluid contains a catastrophic vulnerability.
The question to answer: has this team shipped production code that held user funds through a full bear market? If yes, how much, and for how long? If the answer is "no prior projects" or "prior project launched six months ago," treat the protocol as higher risk regardless of audit quality.
### What To Check
Search the team name or protocol founder names. Look for prior projects on DefiLlama. Check TVL history over time - protocols that survived 2022 without collapsing or getting exploited have demonstrated operational competence under stress. Check whether the team is public or anonymous. Anonymous teams are not automatically disqualified, but they increase risk. Public teams with LinkedIn profiles, conference speaking history, and visible GitHub activity reduce it.
Instadapp's four-year operational history and multi-billion cumulative TVL place Fluid in the "experienced team, new product" category. That is better than "new team, new product." It is not as strong as "Aave launching Aave V4." Adjust your position size accordingly.
## Step 3: Analyze Collateral Composition And Concentration Risk
Lending protocols generate yield by loaning your deposit to borrowers who post collateral. If the collateral crashes faster than the protocol can liquidate it, depositors lose money. The collateral mix determines your actual risk exposure, not the APY.
Fluid's collateral side breaks down as follows: 39% ETH, 28% liquid staking tokens (primarily stETH and wstETH), 14% Bitcoin wrappers (WBTC, cbBTC), and the remainder split between major altcoins and stablecoin LP tokens. This is a relatively conservative mix. ETH and liquid staking tokens are the most liquid collateral assets in DeFi. WBTC carries custodial risk (BitGo controls the reserves), but it has functioned without breaking peg since 2019\. The altcoin tail is small enough that a 50% drawdown in that segment would not threaten solvency.
Contrast this with protocols that accept high concentrations of governance tokens, low-liquidity altcoins, or synthetic assets as collateral. Those configurations introduce tail risk that can wipe out depositor principal in a liquidation cascade.
### What To Check
Go to the protocol's app or analytics page. Look for a collateral breakdown by asset. If the protocol does not publish this data, do not deposit. Calculate the percentage of total borrows backed by each collateral type. Red flags: more than 20% in any single altcoin outside the top 10 by market cap, more than 10% in protocol governance tokens, any exposure to algorithmic stablecoins or rebase tokens. Acceptable: ETH, WBTC, major liquid staking tokens, stablecoins as collateral for other stablecoins.
Fluid's collateral composition passes. It would fail if 30% of borrows were backed by low-float altcoins or if the protocol accepted its own governance token as collateral without strict caps.
## Step 4: Confirm Utilization Caps And Rate-Limiting Mechanisms
A lending protocol becomes insolvent when utilization (the percentage of deposits currently loaned out) approaches 100% and a large depositor wants to withdraw. If there is no liquidity available, withdrawals fail. Utilization caps and rate-of-change limits prevent this failure mode.
Fluid enforces global utilization caps, per-protocol caps, and rate-of-change limits through its Liquidity Layer. This architecture means that even if one borrowing protocol (Fluid Lending, Fluid DEX, or a third-party integration) attempts to drain liquidity, the system will throttle the withdrawal rate and preserve some liquidity for other depositors. The caps are visible in the protocol's documentation and are enforced at the smart contract level, not through governance or admin keys.
This is one of the features that differentiates Fluid from simpler lending markets. Aave and Compound rely on interest rate curves that spike at high utilization to incentivize repayment. Fluid adds hard caps. Both approaches work, but hard caps provide more predictable worst-case behavior.
### What To Check
Read the protocol documentation for mentions of "utilization cap," "borrow cap," or "supply cap." Check whether these caps are enforced on-chain or through governance votes that can change them. On-chain enforcement is stronger. Check current utilization on DefiLlama or the protocol's own dashboard. Utilization above 90% is a yellow flag - liquidity is tight, and you may not be able to withdraw instantly. Utilization above 95% is a red flag.
As of September 2026, Fluid's USDC utilization sits in the 60-70% range across its major markets. That leaves enough liquidity cushion for normal withdrawal activity. If utilization spiked to 92%, I would reduce position size or exit until it normalized.
## Step 5: Understand The Yield Source And Sustainability
High yields are often the primary attraction in DeFi. They are also the biggest trap. The question is whether the yield comes from real economic activity or from artificial subsidies.
Fluid's yield comes from two sources. The primary source is interest paid by borrowers who take out loans against their collateral. The secondary source is trading fees from Fluid DEX, which shares the same Liquidity Layer. Both are real economic activities. Borrowers pay interest because they want leverage or short exposure. Traders pay fees because they want to swap assets. Neither source depends on token emissions or protocol treasury subsidies.
Compare this to protocols that advertise 15% APY on stablecoins during periods when borrowing demand is low and no organic activity justifies the rate. Those protocols are spending down their token treasury to attract TVL. When the treasury runs out or token price collapses, the yield disappears. Early depositors earn real returns. Late depositors hold the bag.
Fluid's 5.19% USDC rate on Ethereum is above Aave's current rate (approximately 3.8%) but below the unsustainable 12-15% rates that appeared on some platforms in early 2024\. The premium reflects Fluid's combined DEX and lending design, which generates fee income from both sides. That structure is plausible. It is not guaranteed to persist. If borrowing demand drops or DEX volume falls, Fluid's rate will compress toward Aave's.
### What To Check
Identify where the yield comes from. Go to the protocol's documentation or blog. Look for explanations of the yield source. Acceptable sources: borrower interest, trading fees, staking rewards from validators, real-world asset yields (Treasuries, bonds). Unacceptable sources: token emissions with no vesting schedule, "promotional APY" with no disclosed end date, yields that depend on new deposits to pay existing depositors (Ponzi structure).
Check whether the advertised rate includes token incentives. Some protocols display a "base APY" of 4% plus a "reward APY" of 8% in their governance token. If the governance token loses 50% of its value, your real return is 4% minus the token depreciation. Fluid's current rates are base rates paid in the deposited asset (USDC), not in a separate reward token. That makes the yield more predictable.
## Step 6: Evaluate The Shared-Risk Architecture
Fluid combines lending and DEX liquidity into a single Liquidity Layer. This design choice introduces a risk that pure lending protocols avoid: a bug in the DEX can affect lending depositors, and a bug in the lending market can affect DEX liquidity providers. The two products are not isolated.
This is a trade-off. The shared architecture allows Fluid to offer higher capital efficiency and better rates than protocols that silo each product. But it also means you are exposed to the full protocol surface area, not just the lending component. An exploit in Fluid DEX's smart order routing, a manipulation of its oracle feeds, or an economic attack on its AMM curves could drain liquidity that your USDC deposit depends on.
I have worked in financial product design long enough to know that interconnected systems fail in unexpected ways. Lehman Brothers did not collapse because its mortgage desk lost money. It collapsed because its mortgage losses triggered margin calls in its derivatives book, which triggered liquidity withdrawals from its repo counterparties, which triggered a solvency crisis across the entire firm. Fluid's architecture is less complex than Lehman's, but the principle is the same. Correlated risk surfaces amplify tail events.
### What To Check
Understand whether the protocol you are evaluating is a single-purpose lending market or a multi-product platform. Single-purpose protocols (Aave, Compound) have narrower attack surfaces. Multi-product platforms (Fluid, Morpho with its vault system) have broader surfaces but may offer better rates or features. Neither is automatically superior. The question is whether you are being compensated for the additional risk.
Fluid's 5.19% USDC rate is roughly 1.4 percentage points above Aave's 3.8%. On a $50,000 deposit, that premium generates an extra $700 per year. Is that premium sufficient to justify exposure to the shared Liquidity Layer risk? For a small allocation (10-20% of your stablecoin book), yes. For your entire stablecoin holding, no. Diversification across protocols is the correct response to this type of risk.
## Step 7: Set Position Size Limits Before You Deposit
The correct position size is the one where a total loss is annoying rather than ruinous. This is not abstract risk management philosophy. It is the difference between "I lost $5,000 in a protocol exploit and I am frustrated" and "I lost $150,000 and I cannot pay my mortgage."
Fluid holds $154M in USDC deposits on Ethereum and over $225M across all chains. That TVL is large enough to absorb a $50,000 deposit without materially affecting your withdrawal ability, but it is not large enough to treat Fluid as your only stablecoin venue. Aave holds over $6B in TVL. Compound holds $3B. Fluid is an order of magnitude smaller. Smaller protocols offer higher rates because they are less proven. That is the trade.
### What To Check
Decide on a position size before you connect your wallet. A reasonable framework: allocate no more than 10% of your stablecoin portfolio to any protocol with less than $1B TVL and less than two years of operating history. Allocate no more than 25% to any protocol with less than $5B TVL, regardless of history. Allocate no more than 50% to any single protocol, even Aave. The rest should be distributed across at least two other venues or held in cold storage.
For Fluid specifically, I would allocate between 10% and 20% of a stablecoin book, depending on risk tolerance. A $50,000 deposit on a $300,000 portfolio is reasonable. A $200,000 deposit is not. The extra yield does not compensate for the concentration risk.
## Step 8: Monitor Utilization And TVL Changes Monthly
Depositing into a protocol is not a one-time decision. It is an ongoing position that requires periodic review. Protocols change. Teams add new collateral types. Governance votes alter risk parameters. Utilization spikes. TVL drops. Any of these changes can shift the risk profile enough to justify reducing or exiting your position.
Set a calendar reminder to check three metrics every 30 days: protocol TVL, your specific market's utilization rate, and any governance proposals that affect risk parameters. This takes ten minutes. It will catch most of the warning signs that precede protocol failures.
### What To Check
Go to DefiLlama. Search for the protocol. Check TVL over the past 30 days. A 20% drop in TVL is a yellow flag - something spooked other depositors. A 40% drop is a red flag - consider reducing your position or exiting entirely until you understand the cause. Check the protocol's app or dashboard for current utilization. A spike from 65% to 88% means liquidity is tightening. A spike to 95% means you may not be able to withdraw without waiting for someone to repay a loan.
Check the protocol's governance forum or Discord for recent votes. Look for proposals to add new collateral types, change liquidation thresholds, or alter fee structures. Any of these changes can increase your risk. If you see a proposal to add a low-liquidity altcoin as collateral with a 75% loan-to-value ratio, that is a signal to reduce your position.
## Common Failure Modes
Most depositors make one of three mistakes. The first is chasing the highest advertised rate without investigating the yield source. Protocols offering 18% on USDC when Aave pays 4% are not offering a better product. They are offering a different risk. That risk is usually uncompensated.
The second mistake is treating a protocol's TVL as a safety signal. High TVL means the protocol has attracted capital. It does not mean the protocol is safe. Terra had $18B in TVL before it collapsed. FTX had $16B in customer deposits. Iron Finance had $2B in TVL when it death-spiraled in 36 hours. Large TVL reflects popularity, not resilience.
The third mistake is depositing your entire stablecoin position into a single protocol because it offers 1.5 percentage points more than the next best option. On a $100,000 position, 1.5% is $1,500 per year. That is real money. It is not enough money to justify losing $100,000 if the protocol fails. Diversify across at least three venues. Accept slightly lower average yield in exchange for substantially lower tail risk.
## What To Do Next
If Fluid (or any other new protocol) passes the checklist above, start with a small test deposit. $500 to $1,000 is sufficient to confirm that deposit, yield accrual, and withdrawal all function as documented. Leave the position active for 30 days. Check that interest accrues correctly. Withdraw the full amount to verify that liquidity is available and that gas costs are reasonable. If all of that works, scale up to your target position size over two to three months, not in a single transaction.
If the protocol fails any step in the checklist, do not deposit. If it fails two steps, do not even monitor it. There are enough protocols with strong teams, clean audits, and transparent risk parameters that you do not need to gamble on marginal venues.
For additional evaluation frameworks, review [How To Evaluate A Crypto Yield Opportunity Safely](https://altcoininvestor.com/how-to-evaluate-crypto-yield/), which covers the source-of-return test and sustainability signals for all yield products. For position sizing across multiple protocols, see [How Much To Put In Any One Yield Venue](https://altcoininvestor.com/defi-position-sizing-risk/). For a comparison of Fluid to other lending and DEX platforms, consult [Best DeFi Protocols By Category](https://altcoininvestor.com/best-defi-protocols/).
If you deploy capital into Fluid or a similar protocol, track the position for tax reporting. DeFi yield is taxable as ordinary income in most jurisdictions. For multi-protocol yield tracking, see [How To Report DeFi Yield On Your Taxes](https://altcoininvestor.com/defi-yield-tax-reporting/).
## The Takeaway
Fluid Lending is a plausible venue for a portion of a self-custodial stablecoin book. It has strong audits, an experienced team, conservative collateral, and utilization caps that limit worst-case liquidity risk. It also has a shared-risk architecture that exposes depositors to DEX vulnerabilities, and it has only been live for two and a half years. Those factors make it appropriate for a 10-20% allocation, not for 100%.
The checklist applies to every protocol offering above-market rates. Audits, team history, collateral quality, utilization controls, yield source, architectural risks, and position sizing. Miss any one of these checks, and you are betting rather than allocating. The difference is measurable. An extra 6% on $50,000 is $3,000 per year. Losing the principal costs $50,000\. This framework prevents the second outcome.
## Frequently Asked Questions
### Is Fluid Lending safe for stablecoin deposits?
Fluid has completed audits by Spearbit, Trail of Bits, and Certora, and is built by the Instadapp team with four years of prior DeFi experience. It holds $1B TVL and uses conservative collateral (39% ETH, 28% liquid staking tokens). However, its shared Liquidity Layer architecture exposes depositors to both lending and DEX risks. Treat it as appropriate for 10-20% of a stablecoin portfolio, not 100%. The protocol is two and a half years old, which is newer than Aave or Compound.
### Why does Fluid pay higher rates than Aave?
Fluid's 5.19% USDC rate on Ethereum is approximately 1.4 percentage points above Aave's 3.8% because Fluid combines lending and DEX activity into a shared Liquidity Layer. This generates fee income from both borrower interest and trading fees. The premium compensates depositors for exposure to a broader protocol surface area and shorter operating history. Higher rates do not indicate better safety. They indicate different risk.
### What position size is appropriate for a new lending protocol?
Allocate no more than 10% of your stablecoin portfolio to any protocol with less than $1B TVL and less than two years of operating history. For protocols with $1B+ TVL and experienced teams (like Fluid), 10-20% is reasonable depending on risk tolerance. Never allocate more than 25% to any protocol under $5B TVL, and never more than 50% to any single protocol regardless of size. Diversification across at least three venues reduces tail risk.
### How do I verify a protocol's audit quality?
Go to the protocol's documentation and find the audits page. Confirm that at least two tier-one firms (Trail of Bits, Spearbit, OpenZeppelin, Certora, Consensys Diligence) completed work within 18 months. Download the audit PDFs and check the scope - it should cover deposit, withdrawal, and interest calculation logic, not just peripheral features. Check severity findings. Unresolved high or critical findings are disqualifying. Remember that over 90% of exploits happen in audited protocols after deployment.
### What are red flags in lending protocol collateral?
Red flags include more than 20% of borrows backed by any single altcoin outside the top 10 by market cap, more than 10% in protocol governance tokens, any exposure to algorithmic stablecoins, and acceptance of rebase tokens as collateral. Conservative collateral includes ETH, WBTC, major liquid staking tokens like stETH, and stablecoins backing other stablecoins. Fluid's collateral is 39% ETH, 28% liquid staking tokens, and 14% Bitcoin wrappers - a conservative mix.
The Weekly Yield Report
You just examined eight checklist items for evaluating 5.19% USDC from a $1B protocol. Next month a different protocol will offer 7.4% from a $50M base, and this framework will apply again.
Every Thursday: where crypto yield actually is - stablecoins, liquid staking and DeFi lending, with the risk named next to the rate and what changed since last week.
[Get it free every Thursday](#/portal/signup)
Free. No trade calls, no allocations, no hype. Unsubscribe in one click.
### Hedera Surges 60.7% in 30 Days on IBM Partnership and ETF Flows
URL: https://altcoininvestor.com/hedera-surge-60-percent-ibm-partnership-etf/
Last updated: 2026-09-28T14:02:40.000Z
## The Run: +60.7% Over 30 Days, +27.5% in 24 Hours

Hedera (HBAR) has climbed 60.7% over the past 30 days to $0.120036 as of September 28, 2026, per CoinGecko. The token added 33.6% over the past week and 27.5% in the past 24 hours alone. HBAR currently holds a market capitalization of $5.26 billion, ranking it number 25 among all cryptocurrencies. The price remains 78.9% below its all-time high of $0.569229, set on September 15, 2021.
The move marks one of the sharpest single-month rallies for a top-30 asset in September 2026\. The acceleration came in stages, with the most dramatic price action occurring in the final week of the month. This was not a slow accumulation followed by breakout. The rally began in late August at lower levels, paused mid-month, then spiked vertically in the last five days of September.
## The Catalyst: IBM Cloud Integration Announced September 23-24
The primary driver of HBAR's rally was the listing of The Hashgraph Group's IDTrust platform on the IBM Cloud Catalog, [announced between September 23 and 24, 2026](https://coinmarketcap.com/top-stories/6ab663799b4b0f59736e1342/), per CoinMarketCap. IDTrust is a Hedera-based identity platform designed for humans, devices, and AI agents. IBM recognized The Hashgraph Group as a Silver Partner and Managed Service Provider under a global Embedded Solution Agreement, making IDTrust the first commercial Hedera-powered enterprise application on a major cloud marketplace.
The timing is critical. HBAR was already climbing before the announcement, but the move accelerated sharply after September 23\. [A September 28 analysis from CoinMarketCap](https://coinmarketcap.com/top-stories/6aba2ddf3b25b51d7486ecfa/) confirmed that the 12-13% gain over the prior 25 hours was "the continuation of a repricing that began with the IBM and The Hashgraph Group partnership, rather than a standalone one-day catalyst."
Multiple outlets covered the development immediately. The integration provides IBM's enterprise customers with a direct procurement route to Hedera-anchored identity services through an existing enterprise cloud distribution channel. IBM has been part of the Hedera Governing Council since 2019, making this integration an extension of an existing relationship rather than a new partnership. Other Governing Council members include Google, FedEx, and Chainlink Labs.
## ETF Inflows and Institutional Access

The Canary HBAR ETF, trading on Nasdaq under the ticker HBR, launched on October 28, 2025, and has provided an institutional access channel throughout 2026\. According to [a September 28 report from Crypto.news](https://cryptonews.net/news/analytics/33507190/), the fund held approximately 782 million HBAR, worth about $73.5 million, based on its latest reported holdings. The ETF gives traditional-market investors exposure to HBAR through a regulated exchange-listed vehicle without requiring direct token custody.
Inflows have been steady but modest. [CoinMarketCap cited a September 12 report](https://coinmarketcap.com/cmc-ai/hedera/latest-updates/) stating that the Canary spot Hedera ETF saw $818,000 in net inflows on September 10, the largest since August 25\. The report characterized this as "steady institutional demand" providing a support floor beneath the price. ETF flows alone did not trigger the rally, but they contributed to a structural bid throughout the month.
The ETF uses BitGo and Coinbase Custody for token storage and references the CoinDesk Hedera USD CCIX 60min NY Rate for pricing. The fund's expense ratio is 0.95%, per Investing.com data as of August 25, 2026.
## Network Upgrades and Earlier Catalysts
Hedera conducted a mainnet upgrade to version 0.69 on January 21, 2026, which enhanced EVM compatibility and network performance for developers and enterprises, according to CoinMarketCap. A testnet upgrade to version 0.70.0 followed on February 5, introducing smart contract automation and improved developer tooling. These upgrades did not immediately impact price but improved the network's technical foundation ahead of the September rally.
Hedera also contributed its Cross-Ledger Protocol to the Linux Foundation Decentralized Trust for open-source development, per [Crypto.news on September 28](https://cryptonews.net/news/analytics/33507190/). This move signals an effort to position Hedera's interoperability infrastructure as an industry standard, though its market impact is indirect.
## The Risk: Crowded Positioning and Mean Reversion
A 60.7% rally in 30 days, with 27.5% coming in the past 24 hours, creates material reversal risk. [Blockchain.News noted on September 28](https://blockchain.news/news/20260928-price-prediction-hbar-18-spike-hits-a-wall-pullback) that HBAR was trading at $0.11, approximately 37.5% above its 200-day moving average and above its upper Bollinger Band, describing the positioning as "a mean-reversion magnet."
The same report stated that HBAR printed an 18.46% single-session candle in one of the rally legs, a move that "wasn't organic accumulation" but rather "a trigger event" that "lit a compressed spring." Sharp vertical moves of this nature typically attract momentum traders who exit just as quickly when the move stalls. The rally has already shown signs of consolidation, with [Coinpedia reporting on September 28](https://coinpedia.org/price-analysis/hbar-price-breaks-out-after-ibm-cloud-deal-can-hederas-rally-reach-0-15/) that HBAR reached approximately $0.115 before pulling back toward the $0.096-$0.10 area.
For the move to hold, two conditions must remain true. First, IBM enterprise customers must begin deploying IDTrust at scale, translating the catalog listing into actual network usage and fee generation. Second, ETF inflows must accelerate beyond the $818,000 single-day inflow seen in September. If neither condition materializes over the next 30 to 60 days, the rally will likely retrace toward the $0.08-$0.09 range where it began.
If broader crypto market sentiment deteriorates, HBAR's correlation with Bitcoin and other large-cap assets will override the fundamental developments. [Blockchain.News noted](https://blockchain.news/news/20260928-price-prediction-hbar-18-spike-hits-a-wall-pullback) that Layer-1 altcoin surges persistently correlate with "short-burst Bitcoin momentum windows," meaning HBAR's rally depends partly on conditions outside its own ecosystem.
## What This Does Not Mean for Staking and Income Holders
The IBM Cloud integration and the price rally do not change the income profile of holding HBAR. Hedera's native staking yield is capped at 2.5% APR, a governance-set parameter controlled by the Hedera Governing Council, according to [Staking Rewards data](https://www.stakingrewards.com/asset/hedera-hashgraph). Rewards are distributed every 24 hours with no lockup period, no unbonding delay, and no slashing risk. Staked HBAR remains fully liquid at all times.
The 2.5% cap was set in August 2023 when the Governing Council reduced the maximum staking reward rate from 6.5%, per [a January 9, 2026 blog post from Hedera](https://hedera.com/blog/hedera-governing-council-votes-to-approve-changes-to-staking-algorithm/). The change aligned Hedera with the industry average adjusted reward rate of 1.4% across the top 20 proof-of-stake networks and was designed to ensure sustainability as network utilization grows. The Council can adjust the cap in either direction in the future, but no change has been announced.
A 60.7% price increase over 30 days does not translate into higher staking yield. The nominal dollar value of staking rewards increases proportionally with price, but the percentage yield remains fixed at approximately 2.5%. Ledger reports a 2-3% APY range for HBAR staking as of May 29, 2026, while HashPack states 2.5% APY as of November 2022\. The variance reflects node performance and commission rates, not changes to the protocol-level cap.
The price move also does not alter the fundamental concern for income-focused holders: HBAR's value accrual model. [Changelly noted in a September 26 analysis](https://changelly.com/blog/hedera-hashgraph-hbar-price-prediction/) that "network transaction fees flow to node operators and the council treasury, not to HBAR holders, meaning $10 billion in RWA settlements has generated essentially no direct financial return for token holders." The IBM integration may increase network usage and transaction fees, but those fees do not flow to stakers. They flow to the 31 Governing Council members who operate consensus nodes.
If you hold HBAR for its staking income, the September rally changes only one variable: the opportunity cost of remaining in the position. A 60.7% move in 30 days generates a far higher return than 2.5% annualized yield. If the rally retraces 30-40% over the next 60 days, which is common after vertical moves of this magnitude, holders who did not reduce exposure will have surrendered most of the gain while earning 0.4% in staking rewards over that two-month period. The decision to hold or rebalance depends on whether the IBM integration represents a step-function change in network adoption or a news event that the market has already priced.
## What Would Sustain the Move
For HBAR to hold the $0.10-$0.12 range or move higher, three developments would need to follow. First, IBM enterprise customers must begin purchasing HBAR or paying transaction fees at scale. IDTrust is now listed in the IBM Cloud Catalog, but a catalog listing is not the same as commercial traction. The market will watch for announcements of enterprise clients using IDTrust in production, which would generate network fees and confirm that the integration translates into demand for HBAR.
Second, ETF inflows must accelerate materially. The $818,000 inflow on September 10, while the largest since August 25, is negligible relative to HBAR's $5.26 billion market cap. Sustained weekly inflows in the $5 million to $10 million range would signal that institutional allocators are building positions, providing a bid that offsets profit-taking from the rally.
Third, staking yield or tokenomics must change in a way that improves value accrual for token holders. The current model channels transaction fees to node operators and the treasury, not to stakers or holders. If the Governing Council raises the staking cap above 2.5% or implements a fee-sharing mechanism, that would create structural demand from income-focused holders. No such change has been proposed as of September 28, 2026.
Without these follow-through developments, the rally is a re-rating based on anticipated future adoption rather than realized demand. Re-ratings based on potential can hold for months if sentiment remains favorable, or they can reverse in days if the next round of news disappoints. The IBM integration is real, but its commercial impact will take quarters to measure, not weeks.
The Weekly Yield Report
You have just seen how a 60.7% rally in 30 days followed an enterprise integration but preceded proof of commercial adoption. That sequence will repeat with different assets and different timelines.
Every Thursday: where crypto yield actually is - stablecoins, liquid staking and DeFi lending, with the risk named next to the rate and what changed since last week.
[Get it free every Thursday](#/portal/signup)
Free. No trade calls, no allocations, no hype. Unsubscribe in one click.
### Aave's Tokenized Stock Collateral Misses the Income Story
URL: https://altcoininvestor.com/aave-tokenized-stock-collateral-emerging-markets/
Last updated: 2026-10-01T18:00:06.000Z
Aave V4 on Base launched its Equities Hub on Friday, September 25, allowing eligible non-U.S. users to borrow USDC against seven Coinbase-issued tokenized stocks tracking Apple, Amazon, Alphabet, Meta, Microsoft, Nvidia, and Tesla. The market opened with a $29 million collateral cap across the seven stocks, a $32 million USDC supply cap, and a $21 million USDC borrow cap. AAVE traded at $154.33, up 6.37% over the 24 hours following the announcement.
Aave founder Stani Kulechov framed the launch as a transformation: "Until now a tokenized stock was something you could hold or trade. Today it becomes something you can borrow against." That framing is correct for the users who can access this product. For the users who cannot, the launch confirms a pattern that has defined DeFi lending for years - the infrastructure that enables borrowing against dollar-denominated assets is being built for the people who need it least.
## What the Equities Hub Actually Enables

The structure is straightforward. Eligible users outside the United States deposit tokenized shares of seven large-cap U.S. technology companies as collateral. Against that collateral, they borrow USDC. The borrowed USDC can then be deployed elsewhere - into yield strategies, into other DeFi protocols, or converted to local currency if the user needs liquidity without selling their equity position.
This is useful if you hold U.S. equities, trust Coinbase's tokenization process, have access to Base, meet the eligibility criteria for non-U.S. borrowing, and want to maintain exposure to those equities while accessing dollar liquidity. That describes a specific user: someone who already holds dollar-denominated assets and wants to leverage them without triggering a taxable sale.
It does not describe the user base that has driven the most sustained real-world adoption of stablecoin borrowing over the past four years. That user base - concentrated in Turkey, Argentina, Nigeria, Lebanon, and parts of Southeast Asia - does not need a way to borrow dollars against their Tesla shares. They need a way to borrow dollars, full stop, and they do not have Tesla shares to post as collateral.
## The Jurisdictional Filter That Defines the User Base
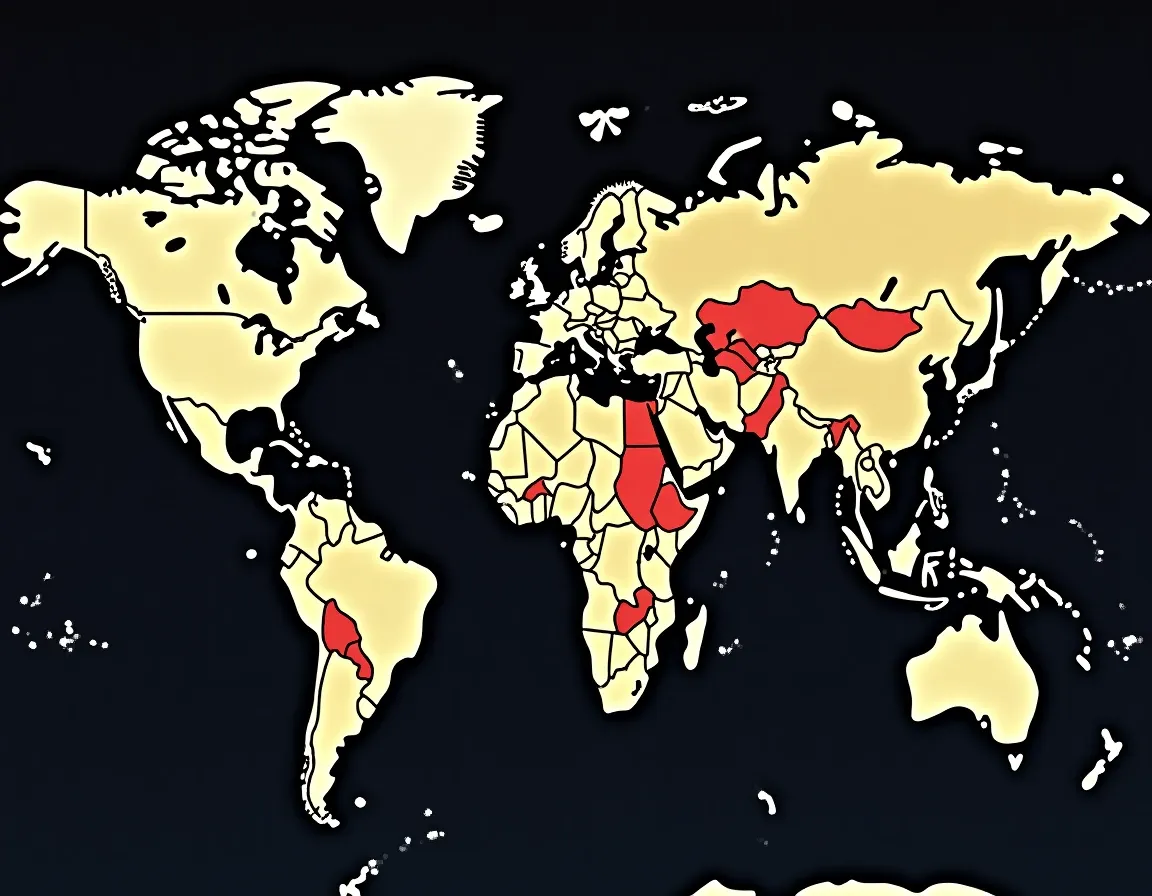
The Equities Hub is available to "eligible non-U.S. users in permitted jurisdictions." That phrasing, common in DeFi products touching regulated securities, excludes two groups. The first is U.S. users, for obvious regulatory reasons. The second is users in jurisdictions where tokenized securities cannot be legally offered or where the compliance burden makes access unworkable.
That second group includes most of the markets where stablecoin credit demand is highest. Argentina's securities regulator, the CNV, has not approved tokenized U.S. equities for retail use. Nigeria's SEC has made clear that crypto-based securities offerings require explicit authorization that has not been granted. Turkey's Capital Markets Board has similarly restricted access to foreign securities not traded on approved exchanges. Lebanon's financial sector, still recovering from the 2019 banking collapse, has no framework for onchain asset custody or tokenized securities.
The result is that the Equities Hub is accessible primarily to users in jurisdictions with mature regulatory frameworks for digital assets and securities - the European Union under MiCA, Singapore, parts of the Middle East with clear crypto licensing regimes. These are not the jurisdictions where stablecoin borrowing has the highest utility. These are the jurisdictions where users already have access to dollar credit through traditional banking channels.
## What Emerging Market Users Actually Need from DeFi Lending
In Buenos Aires, a graphic designer earning peso income does not need to borrow against her Apple shares. She needs to borrow dollars to pay for software subscriptions that are priced in dollars, or to hold as savings while the peso devalues. She does not have U.S. equities to post as collateral. She has peso income, perhaps some USDT savings accumulated over months, and no access to dollar credit from Argentine banks under current capital controls.
In Lagos, a logistics coordinator moving goods across West Africa does not need leveraged exposure to Microsoft. He needs working capital in dollars to pay suppliers who will not accept naira. His collateral is not tokenized Tesla stock. His collateral is his transaction history, his stablecoin balance, and his reputation in the informal credit networks that have filled the gap left by Nigerian banks that ration dollar access.
In Beirut, a software developer who lost access to her bank account in 2019 does not need to borrow against Nvidia shares. She needs a credit line in USDC that she can draw against when client payments are delayed. Her income is in dollars, her expenses are in dollars, and her banking system is non-functional. She has no equity portfolio. She has her earning history and her stablecoin wallet.
The income story in these markets is not about leveraging existing dollar assets. It is about accessing dollar credit when you do not have dollar assets and your local banking system will not provide it. The Equities Hub solves a different problem for a different user.
## Why DeFi Lending Infrastructure Is Being Built for the Wrong User
The reason [leading DeFi protocols](https://altcoininvestor.com/best-defi-protocols/) build products like the Equities Hub is not a mystery. The user who holds tokenized U.S. equities is a user who has already navigated securities onboarding, passed KYC with Coinbase, and has the capital base to hold large-cap U.S. stocks. That user is legible to compliance teams. That user's collateral is legible to risk models. That user exists in a jurisdiction where the protocol can operate without ambiguity.
The user in Buenos Aires earning peso income is not legible in the same way. Her collateral is not a tokenized share with a real-time price feed. Her collateral is harder to model, harder to liquidate, and exists in a jurisdiction where the regulatory framework for crypto lending is unsettled. Building credit infrastructure for her is harder. It requires different collateral models, different risk pricing, and a willingness to operate in jurisdictions where the legal clarity is lower.
So DeFi protocols build for the user with tokenized equities, and the user in Buenos Aires continues to borrow dollars from informal P2P networks and local exchanges at interest rates that reflect the inefficiency of those markets. The infrastructure that could lower her borrowing costs and expand her access to dollar credit is being deployed elsewhere.
## Projects That Are Building Toward Emerging Market Credit
There are projects attempting to solve the credit access problem for users without dollar-denominated collateral. These projects are smaller, less capitalized, and receive less attention than Aave's institutional-grade product launches. But they are building the infrastructure that matters for the next billion stablecoin users.
Goldfinch, which launched its first credit pools in 2021, enables under-collateralized lending backed by borrower reputation and off-chain verification. Its largest pools have financed small and medium enterprises in Latin America, Southeast Asia, and Africa - borrowers who could not post tokenized Tesla stock if they wanted to. The yields on those pools have ranged between 12% and 18%, reflecting the higher risk and the higher demand for dollar credit in those markets.
Credix, operating primarily in Latin America, structures credit pools for regional borrowers with verified business cash flows. The collateral model is not onchain assets. It is receivables, inventory, and legal recourse structures enforceable in local jurisdictions. The borrowers are freight companies in Mexico, agricultural exporters in Brazil, and retailers in Colombia. None of them are posting tokenized Nvidia shares.
Maple Finance, which began with institutional credit and has since expanded to emerging market lending pools, routes capital to non-U.S. borrowers through delegate structures that assess credit risk off-chain. The model depends on trust in the delegate's underwriting, but it enables lending to borrowers who do not fit DeFi's standard over-collateralized model. The pools targeting Latin American and African borrowers have delivered yields between 10% and 15%, higher than dollar savings products available in those regions through traditional banks.
These protocols are not receiving the same attention as Aave's Equities Hub. They are not moving $29 million in tokenized stock collateral. But they are routing real dollar credit to real users in the places where that credit has the highest marginal utility. They are building the income infrastructure that matters.
## The Takeaway
Aave V4's Equities Hub is a technically impressive product. It integrates tokenized securities into DeFi lending, expands the range of acceptable collateral, and signals institutional convergence between traditional finance and onchain credit. It does not expand access to dollar credit for the users who need it most. The users who need dollar credit most - in Buenos Aires, Lagos, Beirut, Istanbul, and Manila - do not have tokenized U.S. equities to post as collateral. They have peso income, naira savings, and lira deposits that are losing value. The DeFi lending infrastructure being built for them is smaller, less visible, and funded at a fraction of the capital flowing into products like the Equities Hub. That gap defines where the real income infrastructure work still needs to happen.
## Frequently Asked Questions
### What tokenized stocks can be used as collateral on Aave V4's Equities Hub?
The Equities Hub launched with seven Coinbase-issued tokenized stocks tracking Apple, Amazon, Alphabet, Meta, Microsoft, Nvidia, and Tesla. The market opened with an initial collateral cap of approximately $29 million across these seven stocks, alongside a $32 million USDC supply cap and a $21 million USDC borrow cap. These stocks can be deposited as collateral by eligible non-U.S. users in permitted jurisdictions to borrow USDC against their equity positions.
### Why can't users in Argentina, Nigeria, or Turkey access Aave's tokenized stock collateral feature?
Most high-inflation emerging markets lack regulatory frameworks that permit tokenized securities offerings to retail users. Argentina's CNV has not approved tokenized U.S. equities for retail use, Nigeria's SEC requires explicit authorization that has not been granted, and Turkey's Capital Markets Board restricts access to foreign securities not traded on approved exchanges. The jurisdictional restrictions mean the Equities Hub is primarily accessible to users in regions with mature digital asset regulations, not the markets where stablecoin credit demand is highest.
### Which DeFi protocols offer credit access to emerging market users without requiring dollar-denominated collateral?
Goldfinch enables under-collateralized lending backed by borrower reputation and off-chain verification, financing SMEs in Latin America, Southeast Asia, and Africa with yields between 12% and 18%. Credix structures credit pools for Latin American borrowers using receivables and inventory as collateral rather than onchain assets. Maple Finance routes capital to emerging market borrowers through delegate structures that assess off-chain credit risk, delivering yields between 10% and 15% to lenders in pools targeting Latin American and African markets.
### What type of collateral do emerging market users actually have for DeFi borrowing?
Users in high-inflation economies typically hold local currency income, modest stablecoin savings accumulated over time, transaction histories, and informal reputation within P2P lending networks. A graphic designer in Buenos Aires earning peso income or a logistics coordinator in Lagos paid in naira does not have tokenized U.S. equities to post as collateral. Their credit needs center on accessing dollar liquidity to preserve purchasing power and pay for dollar-denominated goods and services, not leveraging existing dollar assets.
### Why do DeFi protocols prioritize products like tokenized stock collateral over emerging market credit infrastructure?
Users who hold tokenized securities have already navigated KYC, passed compliance checks, and exist in jurisdictions with clear regulatory frameworks. Their collateral is easy to price and liquidate, making risk modeling straightforward. Emerging market users with local currency income and no dollar assets are harder to underwrite, their collateral is less liquid, and they operate in jurisdictions with unsettled regulatory frameworks. Building credit infrastructure for them requires different collateral models, higher risk tolerance, and more complex legal structures.
The Weekly Yield Report
You have just reviewed a $29 million collateral facility that excludes the users who need dollar credit most. The gap between DeFi infrastructure and emerging market demand will persist until capital flows differently.
Every Thursday: where crypto yield actually is - stablecoins, liquid staking and DeFi lending, with the risk named next to the rate and what changed since last week.
[Get it free every Thursday](#/portal/signup)
Free. No trade calls, no allocations, no hype. Unsubscribe in one click.
### How To Qualify For Incentivized Testnet Airdrops
URL: https://altcoininvestor.com/how-to-earn-from-crypto-testnets/
Last updated: 2026-09-28T02:06:09.000Z
## What Testnet Participation Actually Requires
Testnet participation exchanges time for potential future token allocations. You complete on-chain transactions using free testnet tokens. The protocol tracks your activity. When the project launches on mainnet, you receive tokens based on your participation record.
Most projects require 10 to 50 testnet transactions minimum. Some require daily participation over weeks or months. The mechanism favors early adopters and repeated engagement, because projects use multiple snapshots rather than single-point eligibility checks.
This is speculative income. Points earned during testnet carry zero guaranteed conversion rate until the team publishes allocation terms. You invest time with no assurance of payout timing, token price, or whether the project will distribute tokens at all.
Historical precedent:
- Uniswap distributed $6.43 billion worth of UNI in 2020 to early protocol users
- Arbitrum airdropped over 1 billion ARB tokens to 625,000 wallets in 2023, worth more than $1.5 billion at distribution
- Celestia distributed 60 million TIA tokens to 190,000 addresses in 2024
- Pump.fun promised an airdrop over a year ago and has not delivered
The conversion rate from testnet participant to mainnet recipient varies wildly. Linea cut 516,960 of 1,297,203 addresses before paying. That is a 60% rejection rate after users had already invested time.
## How To Find Active Testnet Opportunities

Use dedicated airdrop trackers that verify project legitimacy. Airdrops.io maintains over 600 active campaigns with historical context. AirdropAlert and CoinGecko publish testnet opportunities with participation statistics.
Current high-profile testnets as of 2026 include Monad, Fuel Network, Scroll zkEVM, and Celestia. Monad is backed by $225 million in funding from Paradigm, which signals institutional validation. ZetaChain alone saw more than 650,000 testnet wallets in early 2025.
Verify every project through official channels before participating:
- GitHub repository with active commits (shows real development)
- Official documentation on the project's primary domain
- Verified Twitter account with team member profiles
- Discord or Telegram with official announcements channel
Never connect your wallet to a testnet site unless you have verified the URL matches the official project domain. Fake claim sites and wallet drainers are the most common scam vector around airdrops. No legitimate airdrop ever asks for your seed phrase.
For structured participation tracking, platforms like Zealy, Layer3, and Galxe record your activity across multiple projects. These tools automate proof of participation but add a dependency layer between you and the protocol.
## Evaluating Which Testnets Are Worth The Time Investment

Not all testnets convert to meaningful payouts. You need a filtering framework before committing weeks of daily transactions.
### Team Credibility Signal Check
Has the team shipped a product before? Pseudonymous founders with verifiable build history carry different risk than anonymous teams with no GitHub commits. Check the team's LinkedIn profiles, prior project outcomes, and whether they have survived a full market cycle.
Funding is a credibility proxy. Monad raised over $225 million from Paradigm. That does not guarantee a generous airdrop, but it does indicate the project has capital to sustain development through testnet to mainnet transition.
If the team has not specified what percentage of total token supply is allocated to testnet participants, the reward pool is speculative. Node Network allocated 3% of initial supply (20.3 million NODE tokens) to testnet. Kryvora allocated 100 million KRV tokens. These are concrete commitments you can verify.
### Participation Volume Risk Assessment
Larger testnet populations dilute individual allocations. If 1.2 million wallets participate and the reward pool is fixed at 3% of supply, your share decreases as participant count rises.
ZetaChain had over 650,000 testnet wallets. Even if you rank in the top 10% by activity, you are competing with 65,000 other high-engagement users for allocation. Compare that to a smaller testnet with 10,000 participants and equivalent token allocation.
Check the project's leaderboard if one exists. If you cannot break into the top 20% by activity level, your time may generate better returns elsewhere.
### Sybil Filtering Sophistication
Projects use GitHub links, Discord roles, IP filters, and device fingerprinting to detect multi-wallet farming. Advanced filtering mechanisms reduce the number of eligible wallets but increase payout probability for genuine participants.
Linea eliminated 60% of addresses before distributing tokens. That filtering favored users who participated with single wallets over long periods rather than farmers running dozens of wallets with minimal activity each.
If a project announces KYC requirements, wallet-device linkage, or on-chain reputation scoring, those are positive signals for payout quality. They indicate the team is serious about rewarding real users rather than farming operations.
### Historical Conversion Rate Context
Projects that launched in 2023 through 2025 shifted toward participation-based models rather than social-media farming. Monad, ZetaChain, and Scroll paid users based on long-term testing and consistent activity, not Twitter followers or Discord invites.
The 2026 airdrop model requires substantially more time investment than earlier campaigns. Comprehensive testnet participation is not a trivial undertaking. It favors users who are genuinely interested in the protocol rather than pure airdrop farmers.
If you cannot find precedent for the team distributing tokens to prior testnet participants, treat the opportunity as high-risk speculative time investment.
## Step-By-Step Testnet Participation Process
Here is the repeatable process once you have selected a testnet worth your time.
### Step 1: Set Up A Dedicated Testnet Wallet
Never use your primary wallet for testnet participation. Create a new wallet specifically for testing. This isolates your main holdings from unverified smart contract interactions.
Use MetaMask, Rabby, or another EVM-compatible wallet. Record your seed phrase offline. Testnet tokens have no real-world value, but the wallet you create may later hold mainnet airdrop allocations.
### Step 2: Acquire Testnet Tokens
Most testnets provide a faucet that dispenses free tokens for gas fees. Navigate to the official project documentation and locate the faucet link. You will need testnet ETH, testnet MATIC, or the native testnet token depending on the chain.
Some faucets require Discord verification or GitHub authentication to prevent abuse. Complete the verification process using accounts you control and can access long-term.
### Step 3: Complete Required Transactions
Typical testnet tasks include:
- Swapping tokens on the protocol's testnet DEX
- Providing liquidity to testnet pools
- Bridging assets between testnet chains
- Staking testnet tokens if the protocol supports staking
- Participating in testnet governance votes
- Reporting bugs through official channels
The more activity categories you complete, the higher your eligibility score. Projects that use points systems reward diverse participation over single-action repetition.
Asentum's testnet offers staking multipliers up to 10x for users who explore multiple dApps, complete quests, and refer other participants. That structure incentivizes breadth of activity rather than transaction volume alone.
### Step 4: Track Your Participation
Most projects publish leaderboards or points dashboards. Bookmark the URL and check your standing weekly. If you are not accumulating points as expected, verify that your wallet is connected correctly and that transactions are settling on-chain.
Use block explorers to confirm your testnet transactions. If a task does not register after 24 hours, check the project's Discord for known issues or reach out in the support channel.
### Step 5: Maintain Consistent Activity Over Time
Projects favor users who participate regularly across multiple snapshot dates. If the testnet runs for three months and you complete all transactions in the final week, you rank lower than users who tested weekly from the start.
Daily participation is not always required, but weekly engagement is typical. Projects measure activity over time to identify genuine users rather than late farmers.
## Common Failure Modes And How To Avoid Them
Most testnet participants fail to receive allocations for predictable reasons.
### Missing The Claim Window
Claim windows have specific timeframes. If you do not claim your tokens within the announced period, you forfeit the allocation entirely. Arbitrum users had to claim within a set deadline or lose access to their ARB tokens.
Set calendar reminders for claim dates. Follow the project's official Twitter and Discord for claim announcements. Do not rely on third-party aggregators to notify you.
### Gas Fee Spikes During Claim Periods
When a major airdrop goes live, thousands of users attempt to claim simultaneously. Gas fees spike. Plan your claim during off-peak hours to avoid failed transactions and wasted gas.
Check current gas prices on Etherscan or the relevant block explorer before submitting your claim transaction. If gas is above 50 gwei, wait a few hours and try again.
### Sybil Detection After Months Of Participation
If you run multiple wallets from the same IP address or device, projects may flag all associated wallets as Sybil and disqualify them. Linea cut over 500,000 addresses using this method.
Stick to one wallet per testnet unless you have legitimate separate devices and IP addresses. The risk of total disqualification outweighs the marginal benefit of multi-wallet farming.
### Connecting To Fake Claim Sites
Scammers replicate official claim pages and phish for wallet approvals. Always verify the URL matches the official project domain. Check the project's verified Twitter for the claim link.
If a site asks you to sign an approval for your entire wallet balance, disconnect immediately. Legitimate claims require a simple signature or transaction, not blanket wallet permissions.
### Ignoring Vesting Schedules
Typical unlock schedules distribute 25% of tokens at token generation event (TGE) with the remaining 75% vesting linearly over 6 to 12 months. If you expect full liquidity immediately and the token price drops during vesting, your realized value declines.
Factor vesting into your time-investment calculation. A $2,000 airdrop with 12-month vesting is worth less than a $1,500 airdrop with immediate liquidity if you need to exit quickly.
## What To Do After Testnet Participation
Once you have completed testnet tasks, your role shifts to monitoring and preparation.
Continue light engagement if the testnet remains open. Weekly transactions during low-activity periods can boost your percentile ranking as other participants drop off.
Watch for mainnet launch announcements. Projects typically announce token distribution timelines 2 to 4 weeks before TGE. This gives you time to prepare wallets, check gas balances, and plan your claim.
Decide your exit strategy before tokens unlock. Will you hold for long-term appreciation or sell immediately to realize the time-investment return? Most airdrop recipients sell within 48 hours of unlock, which suppresses token price. If you plan to hold, be prepared for 40% to 60% drawdowns in the first month.
If the project does not announce distribution terms within 6 months of testnet completion, the probability of payout declines. Pump.fun's unpaid airdrop is a reminder that promises without timelines are not commitments.
For ongoing airdrop strategy, see [How To Earn Crypto Airdrops (Without Getting Scammed)](https://altcoininvestor.com/how-to-earn-crypto-airdrops/) for the full framework on sybil-resistant wallet patterns and gas cost accounting.
## Time Investment Versus Realistic Return Expectations
Testnet participation requires 20 to 60 hours of work spread over weeks or months. That includes initial setup, daily or weekly transactions, troubleshooting failed tasks, and claim execution.
Rewards range from $50 to several thousand dollars depending on token price at TGE, your activity percentile, and total participant count. The median testnet payout in 2025 was $200 to $400 for users who completed minimum participation requirements.
Top 10% participants in high-profile testnets (Arbitrum, Celestia, zkSync) received $1,000 to $5,000\. That translates to $16 to $83 per hour if you invested 60 hours. Compare that to other crypto income mechanisms like [yield-bearing stablecoins](https://altcoininvestor.com/earn-passive-income-yield-bearing-stablecoins/) where capital generates returns without ongoing time investment.
The opportunity cost is real. If you have capital to deploy, DeFi yield strategies generate predictable income. Testnet participation makes sense if you have time but limited capital, or if you want exposure to a specific protocol before public launch.
More than 80 airdrop campaigns launched in the first three months of 2025\. Over 1.2 million wallets participated in at least one airdrop in the past 90 days. Competition is high. Dilution is real. Adjust expectations accordingly.
## The Takeaway
Testnet participation converts time into speculative token allocations. The mechanism works when teams have funding, clear token distribution commitments, and sophisticated Sybil filtering. It fails when projects delay indefinitely, cut eligible addresses post-participation, or distribute tokens worth less than the gas you spent claiming them.
Your selection framework determines return quality. Prioritize testnets with institutional backing, published reward pool allocations, and prior history of paying participants. Avoid testnets with anonymous teams, vague timelines, or participation counts above 500,000 wallets unless reward pools scale proportionally.
Track your time investment. If you spend 40 hours on a testnet and receive $120 at TGE, you earned $3 per hour. That may still be worth it for protocol-specific exposure or if you have no capital to deploy in other income mechanisms. But it is not passive income, and it is not guaranteed income.
Monitor claim windows, verify URLs before connecting wallets, and decide your exit strategy before tokens unlock. The majority of testnet participants either miss the claim window or connect to phishing sites. Do not be in that majority.
## Frequently Asked Questions
### How much can you realistically earn from testnet participation?
Median payouts in 2025 ranged from $200 to $400 for users who met minimum participation requirements. Top 10% participants in high-profile testnets like Arbitrum and Celestia received $1,000 to $5,000\. Time investment typically ranges from 20 to 60 hours spread over weeks or months, translating to $3 to $83 per hour depending on final token price and your activity percentile. Rewards are speculative and not guaranteed until token distribution occurs.
### How do projects decide who qualifies for testnet airdrops?
Projects use points systems that track transaction volume, activity diversity, participation duration, and early adoption. Most protocols take multiple snapshots over the testnet period rather than single eligibility checks. Advanced projects employ Sybil filtering using GitHub verification, Discord roles, IP address analysis, and device fingerprinting to eliminate multi-wallet farmers. Linea cut 60% of addresses before distributing tokens using these methods, favoring genuine single-wallet participants over farming operations.
### What are the biggest risks of testnet airdrop farming?
The primary risks are non-delivery (projects that never distribute promised tokens), Sybil disqualification (losing eligibility for running multiple wallets), missed claim windows (forfeiting allocated tokens by not claiming within the specified timeframe), phishing attacks (connecting to fake claim sites that drain wallets), and low token valuations at launch (receiving allocations worth less than the gas fees spent participating). Additionally, projects may cut eligible addresses post-participation as Linea did with over 500,000 wallets.
### How long does typical testnet participation require?
Most testnets require 10 to 50 transactions spread over weeks or months. Daily participation is common for high-tier eligibility, though weekly engagement often meets minimum requirements. Total time investment ranges from 20 to 60 hours including wallet setup, acquiring testnet tokens, completing diverse protocol interactions, troubleshooting failed transactions, and executing claims. Projects favor consistent activity over time rather than concentrated late participation, with multiple snapshots rewarding early and regular testers.
### How can you verify a testnet airdrop is legitimate?
Verify through official project channels only: check the GitHub repository for active development commits, confirm documentation exists on the primary project domain, verify the Twitter account has team member profiles and history, and join official Discord or Telegram channels for announcements. Cross-reference testnet opportunities on established trackers like Airdrops.io, AirdropAlert, or CoinGecko. Never connect wallets to unverified URLs. Institutional funding from firms like Paradigm provides additional credibility signals.
The Weekly Yield Report
You just reviewed selection criteria for testnets backed by $225 million to zero funding, with payout ratios from $5,000 to $0\. Those numbers change every launch cycle.
Every Thursday: where crypto yield actually is - stablecoins, liquid staking and DeFi lending, with the risk named next to the rate and what changed since last week.
[Get it free every Thursday](#/portal/signup)
Free. No trade calls, no allocations, no hype. Unsubscribe in one click.
### What Your Yield Position Actually Returned
URL: https://altcoininvestor.com/calculate-real-defi-returns/
Last updated: 2026-09-28T00:08:51.000Z
## The Gap Between Quoted APY And What You Actually Earned

A Uniswap v3 pool quotes 18% APY on an ETH/USDC position. You deposit for 90 days, watch the dashboard daily, and when you withdraw the position your wallet shows an 11% annualized return. The question that matters is where the other seven percentage points went, and whether you can measure the gap before you commit capital rather than discovering it only after exit.
The gap is structural. Yield protocols quote annual percentage yields based on current fee velocity, current reward token prices, and the assumption that your position remains in range and fully active for 365 days without interruption. None of those assumptions hold in practice. Fee velocity changes with market volume. Reward tokens decline in price between the moment of APY calculation and the moment you claim and sell them. Concentrated liquidity positions move out of range when prices shift. Entry costs, exit costs, gas fees across dozens of transactions, impermanent loss realized at withdrawal, and slippage on reward token sales erode the quoted figure before it reaches your wallet.
This is not unique to decentralized finance. European sovereign debt markets in 2011 quoted yields above 20% on Greek bonds not because buyers would earn 20%, but because the market assigned a high probability that Greece would default before maturity. The yield reflected risk rather than return. In DeFi the mechanism is different but the principle is identical. A quoted APY is not a promise of what you will earn; it is a snapshot of current conditions combined with an optimistic compounding assumption. Your actual return comes after you subtract every form of friction the protocol does not advertise.
## The Five-Component Formula For Actual Returns
Measuring what a yield position actually returned requires accounting for five distinct components. The formula is straightforward once you recognize that each stage of the lifecycle imposes costs or variability that the APY does not capture.
### Component One: Entry Costs
Before a position begins earning, you pay to establish it. On Ethereum mainnet this means gas for token approvals, gas for the swap that balances your deposit ratio, and gas for the transaction that mints the liquidity provider token. At September 2026 gas levels a simple ETH transfer costs around $0.10 to $0.20, and a Uniswap swap using 180,000 gas costs approximately $0.21\. Establishing a concentrated liquidity position typically requires three transactions: approve token A, approve token B, add liquidity. If gas is 1 gwei the total entry cost is often $0.50 to $0.80.
On Layer 2 networks like Arbitrum or zkSync Era, where transaction fees frequently fall below $0.10 and occasionally under $0.03, entry costs become negligible for positions above $1,000\. On mainnet they matter more. A $500 position paying $0.60 in entry gas surrenders 0.12% before earning begins. At a 7% net APY that $0.60 represents roughly six days of yield. If you plan to hold for 30 days the entry cost alone reduces your annualized return by 1.4 percentage points.
### Component Two: Fee Accrual
Trading fees are the primary source of real yield in liquidity pools. Uniswap pools charge 0.05% on stablecoin pairs, 0.3% on standard pairs like WBTC/ETH, and 1% on exotic or volatile pairs. Those fees accrue to liquidity providers in proportion to the share of pool liquidity they supply and the time their position remains in range.
Fee accrual is time-dependent and volume-dependent. A position in a 0.3% fee pool does not earn 0.3% per transaction on your capital; it earns a fraction of 0.3% of each trade that occurs within your price range, divided among all liquidity providers active in that range. High-volume pairs generate more absolute fees, but they also attract more competing liquidity, which dilutes your share. Low-volume pairs offer less competition but produce fewer fees to distribute.
The critical point is that fee accrual stops the moment price moves outside your concentrated range. A Uniswap v3 position set to a plus or minus 10% range around the current price earns nothing once ETH moves 11% in either direction. If your position remains out of range for 30 of your 90-day holding period, you earned fees for only 60 days, which cuts your annualized return by one-third before you account for any other friction.
### Component Three: Reward Token Realization
Many DeFi protocols supplement trading fees with governance token emissions. These rewards appear in APY calculations at the price of the governance token at the moment the APY is quoted. By the time you claim and sell those tokens, the price has often declined, sometimes sharply.
Assume a protocol quotes 14% APY, with 7% derived from trading fees and 7% from token emissions. You claim your rewards weekly and sell them immediately into USDC. Over 90 days the reward token declines 20% against the dollar due to steady sell pressure from other farmers. Your realized return from emissions is not 7% annualized; it is 5.6%. The 1.4 percentage point gap comes from the difference between the token price used in the APY calculation and the price at which you actually sold.
This gap widens for protocols with high inflation rates or low liquidity for the reward token. A 14% APY backed by 10% annual token supply inflation is closer to 4% real yield in token terms once dilution is factored. If you cannot sell the reward token near the price used in the APY quote, the effective contribution of emissions to your return may be half what the dashboard displayed.
### Component Four: Impermanent Loss Realized At Withdrawal
Impermanent loss is the difference in value between holding two assets in a liquidity pool versus holding them separately in a wallet. The loss is impermanent only while the position remains open; if prices return to the entry ratio before you withdraw, the loss disappears. The moment you exit the pool the impermanent loss becomes permanent and realized.
The standard formula for impermanent loss in a 50/50 pool is 2√R/(1+R) minus 1, where R is the ratio of the final price to the entry price. If you enter an ETH/USDC pool when ETH is $2,500 and exit when ETH is $3,000, the price ratio R is 1.2\. The impermanent loss is approximately 0.6%. For a $10,000 position that is $60 in forgone value compared to simply holding the two assets.
Concentrated liquidity positions in Uniswap v3 amplify impermanent loss proportionally to the concentration factor. A position concentrated in a plus or minus 10% range experiences roughly ten times the impermanent loss of a full-range position for the same price move. If ETH rises 5% and your range is tight, the impermanent loss may reach 3% of position value, erasing weeks or months of fee income. The tighter the range, the higher the fee earnings, but also the greater the impermanent loss when price moves against you.
Stablecoin pairs like USDC/USDT on Curve largely eliminate impermanent loss because both tokens maintain $1 parity. For volatile pairs the loss is unavoidable and must be subtracted from gross fee earnings to arrive at net return.
### Component Five: Exit Costs
Withdrawing from a liquidity pool, claiming final rewards, and converting the withdrawn tokens back to your preferred stablecoin or base asset imposes the same gas costs as entry, plus slippage on any token swaps. On Ethereum mainnet exit typically costs $0.50 to $0.80 in gas, matching entry. On Layer 2 networks the cost is negligible.
Exit slippage matters more for smaller or less liquid pools. If you withdraw $5,000 in a governance token and immediately sell it on a decentralized exchange with shallow liquidity, the market impact may cost 1% to 2% of the token's quoted price. For a position that earned 8% gross over 90 days, a 1.5% exit slippage cost reduces your net annualized return by six percentage points.
The combined effect of entry gas, exit gas, and exit slippage often totals 0.5% to 1.5% of position value. For a three-month hold that delivered 8% gross APY, those costs reduce realized annual return to 6% or 7%. The shorter the holding period, the larger the proportional impact of fixed entry and exit costs.
## Worked Example: ETH/USDC On Uniswap V3

The calculation becomes concrete with a real scenario. You deposit 2 ETH and $5,000 USDC into a Uniswap v3 ETH/USDC pool with a 0.3% fee tier on Ethereum mainnet. You set a concentrated liquidity range of plus or minus 10% around the entry price of $2,500 per ETH. The quoted APY at entry is 18%, composed of 12% from trading fees and 6% from UNI token rewards. You hold the position for 90 days.
### Step 1: Calculate Entry Costs
Gas at 1 gwei costs $0.21 per swap and roughly $0.50 to add liquidity. You pay $0.21 to swap a portion of USDC into ETH to match the pool ratio, then $0.50 to mint the LP position. Total entry cost: $0.71\. On a $10,000 position that is 0.0071%, negligible over 90 days but relevant for smaller positions or shorter holds.
### Step 2: Track Fee Accrual
Daily trading volume in the ETH/USDC 0.3% pool on Uniswap averages $150 million. Your $10,000 represents 0.00067% of the pool's $1.5 billion total value locked. You earn 0.00067% of the 0.3% fee on $150 million daily volume, which equals approximately $3.00 per day in fees, or $270 over 90 days if your position remains fully in range.
During the 90-day period ETH price rises from $2,500 to $2,800, then falls back to $2,600\. For 20 of the 90 days your position is out of range and earns nothing. You earned fees for 70 days, not 90, reducing fee income to $210\. Annualized over the $10,000 position, that is 8.4% APY from fees, not the 12% quoted at entry.
### Step 3: Measure Reward Token Realization
The protocol distributes UNI rewards weekly. You claim and sell immediately. The APY calculation assumed UNI at $8.00\. Over 90 days UNI declines to $6.40, a 20% drop. Your realized reward income is 80% of the quoted 6% APY, or 4.8% annualized. In dollar terms that is $120 over 90 days instead of the $150 the APY implied.
### Step 4: Calculate Impermanent Loss
You entered when ETH was $2,500 and exited when ETH was $2,600\. The price ratio R is 2,600 / 2,500 = 1.04\. For a full-range position impermanent loss would be approximately 0.1%. For a concentrated position in a plus or minus 10% range, impermanent loss is amplified by roughly 10x, reaching 1.0% of position value, or $100.
If you had simply held 2 ETH and $5,000 USDC in your wallet, your final value would be (2 × $2,600) + $5,000 = $10,200\. Your liquidity pool position returned $10,000 + $210 fees + $120 rewards - $100 impermanent loss = $10,230\. The impermanent loss cost you $100 in forgone gains compared to holding.
### Step 5: Account For Exit Costs
You pay $0.50 in gas to withdraw liquidity and $0.21 in gas to swap one of the withdrawn tokens back to USDC. If the withdrawn ETH is sold into a liquid market, slippage is negligible. Total exit cost: $0.71, matching entry.
### Final Calculation
Your $10,000 position returned $210 in fees, $120 in rewards, minus $100 in impermanent loss, minus $1.42 in gas. Net profit: $228.58 over 90 days. Annualized, that is 9.14% APY. The protocol quoted 18% APY. Your realized return was 9.14%. The gap of 8.86 percentage points came from out-of-range time (reducing fees by 3.6 points), reward token price decline (reducing rewards by 1.2 points), impermanent loss (costing 4.0 points), and gas (costing 0.06 points).
This is typical. The gap between quoted APY and realized return routinely falls between five and ten percentage points for volatile pairs on concentrated liquidity protocols, and between two and four percentage points for stablecoin pairs or full-range positions.
## Common Pitfalls That Widen The Gap
Several behavioral and structural traps widen the distance between quoted yield and actual return. Recognizing them before committing capital is the only defense.
### Ignoring Out-Of-Range Time
Most liquidity providers underestimate how often their concentrated positions move out of range. A plus or minus 10% range feels wide when you set it, but ETH routinely moves 15% or 20% in a week during volatile periods. If you do not monitor the position daily and adjust the range, you may earn nothing for half your intended holding period. The APY calculation assumes 100% in-range time. Actual in-range time for tight ranges is often 60% to 80%, which directly scales down fee income.
### Overestimating Reward Token Stability
Governance tokens are sold continuously by yield farmers. The larger the emission rate relative to protocol revenue, the more selling pressure accumulates. A token emitting 20% of supply annually to liquidity providers will decline in price unless buy pressure from protocol utility or speculation exceeds that 20% selling flow. Most do not. Assuming you will realize rewards at the price used in the APY quote is optimistic. A 15% to 25% discount between quote price and sale price is common for high-emission protocols.
### Underestimating Impermanent Loss In Tight Ranges
Concentrated liquidity amplifies both fee earnings and impermanent loss. A position in a plus or minus 5% range may earn 20x the fees of a full-range position, but it also experiences 20x the impermanential loss for the same price movement. A 3% price move in a 5% range can produce 12% impermanent loss, erasing weeks of fee accumulation in hours. If you do not track the impermanent loss daily using a tool like [DefiLlama](https://defillama.com/yields) or Revert Finance, you will discover the loss only at exit, when it is too late to adjust.
### Failing To Track Gas Cumulatively
A single $0.50 gas fee is negligible. Twenty gas fees over 90 days for weekly reward claims, range adjustments, and rebalancing total $10, which on a $5,000 position is 0.2% of capital or roughly 0.8% annualized. On smaller positions or in higher-gas environments the cumulative gas cost can exceed 2% of position value, turning a marginal 5% APY position into a 3% net return or worse. [Layer 2 protocols](https://altcoininvestor.com/best-defi-protocols/) offer structural advantages here; when gas is under $0.01 per transaction, cumulative costs become irrelevant even for active strategies.
## Tools That Measure Realized Returns
Several analytics platforms calculate what a position actually earned rather than what the APY implied. These tools are essential for anyone running yield strategies across multiple protocols or chains.
APY.vision tracks exact impermanent loss, fees earned, and net profit and loss for liquidity positions across Uniswap, SushiSwap, PancakeSwap, and other major decentralized exchanges. The platform updates in real time and shows whether your position is currently profitable after accounting for impermanent loss. For concentrated liquidity positions it displays current in-range status and historical in-range percentage, which directly predicts fee earnings over time.
Revert Finance specializes in Uniswap v3 analytics. It calculates position performance including fees, impermanent loss, range status, and whether adjusting your range would improve returns. The tool also estimates future returns based on historical fee velocity, allowing you to model whether tightening or widening your range would increase net yield after accounting for the gas cost of rebalancing.
DeBank aggregates wallet positions across lending protocols, staking, liquidity pools, and stablecoins into a single portfolio view. It shows total portfolio yield, protocol rankings by return, and alerts when a position's APY drops below a threshold you set. The platform does not calculate impermanent loss directly, but it tracks deposited value versus current value, which surfaces the combined effect of fees, rewards, and impermanent loss over time.
DefiLlama's yield page offers verified APY data, simulating what a holder would have actually earned by modeling daily on-chain withdrawals from each pool. This "verified APY" is typically two to five percentage points below the quoted APY for volatile pairs and within one percentage point for stablecoin pools. Comparing verified APY to quoted APY before entering a position reveals which protocols systematically overstate returns.
## When The Gap Justifies Avoiding A Position Entirely
The decision framework is straightforward. If the expected gap between quoted APY and realized return exceeds the risk-free rate available in stablecoin lending, the position is not worth the complexity or the risk.
In September 2026 stablecoin lending on Aave or Morpho offers 4% to 6% APY with negligible impermanent loss, no reward token exposure, and minimal gas. If a Uniswap v3 position quotes 18% APY but you estimate 70% in-range time, a 20% reward token price decline, 2% impermanent loss, and 0.5% in cumulative gas, your realized return is approximately 10%. The 10% realized return carries smart contract risk, impermanent loss risk, and active management overhead. The 5% stablecoin lending rate carries only smart contract risk and requires no ongoing attention.
The yield premium for the volatile pair is five percentage points. The question is whether that premium compensates for the additional risks and time. For a $10,000 position the premium is $500 annually, or $125 over 90 days. If monitoring and rebalancing the position requires two hours per month, the implicit hourly rate is roughly $20\. For many participants that is below the opportunity cost of their time, which makes the simpler stablecoin position the better choice even though the absolute yield is lower.
The gap also determines whether a position is worth entering on Ethereum mainnet versus a Layer 2 or alternative chain. If gas costs $0.50 per transaction on mainnet and $0.01 on Arbitrum, and you plan to claim rewards weekly for 12 weeks, the mainnet strategy costs $6.00 more in gas. On a $3,000 position that is 0.2% of capital. If the mainnet pool offers 8% APY and the Arbitrum pool offers 7.5% APY, the lower gas on Arbitrum makes it the higher-net-return option despite the lower quoted rate.
## How To Apply This Before Committing Capital
The five-component formula becomes a pre-entry checklist. Before depositing into any yield position, estimate each component and calculate the expected realized return. If the estimate falls below your threshold, do not enter.
First, check current gas prices on the target chain and calculate total entry and exit costs. Add weekly or monthly gas for reward claims if the protocol does not auto-compound. Multiply by the number of expected transactions over your planned holding period.
Second, review historical fee velocity for the pool using DefiLlama or the protocol's native analytics. If the current APY is elevated relative to the 30-day or 90-day average, assume reversion to the mean rather than continuation of the current rate. For concentrated liquidity positions, estimate in-range time based on historical volatility. A plus or minus 10% range on ETH during a 30-day period with 40% annualized volatility will be out of range approximately 30% to 40% of the time. Reduce your expected fee income proportionally.
Third, examine the reward token's emission rate and price trend. If the protocol emits 20% of token supply annually and the token has declined 30% over the past 90 days, assume you will realize rewards at a 20% to 30% discount to the current price. Adjust the rewards component of APY downward by that percentage.
Fourth, model impermanent loss for your expected price scenario. If you believe ETH will rise 10% over your holding period, calculate impermanent loss at a 10% price move for your chosen range width. Subtract that loss from gross returns. If you believe price will move more than 15% in either direction, either widen your range or accept that impermanent loss will likely exceed fee income.
Fifth, compare your estimated realized return to the risk-free rate on stablecoin lending or to the return you would earn holding the underlying assets without providing liquidity. If the realized return premium is less than two or three percentage points, the position is not worth the added complexity and risk.
This process takes ten minutes per position and eliminates most poor allocation decisions before they cost you capital. The alternative is to discover the gap only after exit, when the losses are permanent and the time is already spent.
## What To Do Next
Choose one current or planned yield position and calculate its realized return using the five-component formula. Track entry gas, estimate in-range time, model reward token price at claim, calculate impermanent loss at your expected exit price, and add exit gas. Compare the result to the quoted APY. The gap is your ongoing tax for not measuring.
If you are not currently tracking realized returns, start with APY.vision or Revert Finance for liquidity positions and DeBank for an aggregated portfolio view. Set a weekly reminder to review in-range status for any concentrated liquidity positions and adjust ranges when out-of-range time exceeds 20%. Claim and sell reward tokens weekly rather than holding them; the longer you wait, the more price risk you carry.
For future positions, calculate expected realized return before entry and reject any allocation where the gap between quoted and realized exceeds four percentage points unless the absolute realized return exceeds 10%. Most positions that fail this test are subsidized by emissions or elevated temporarily by short-term volume spikes, and neither condition persists.
The income mechanism here is knowing your true return, which is the only basis for deciding whether a strategy is worth continuing. [Knowing when to exit](https://altcoininvestor.com/when-to-exit-defi-position/) a position depends on knowing what it actually earned, not what the dashboard claimed it would earn. Without that measurement you are managing APY quotes rather than managing capital, and the difference compounds across every position you hold.
## Frequently Asked Questions
### What is the typical gap between quoted DeFi APY and actual realized return?
For volatile pairs on concentrated liquidity protocols like Uniswap v3, the gap routinely falls between five and ten percentage points. For stablecoin pairs or full-range positions the gap is smaller, typically two to four percentage points. The gap comes from out-of-range time reducing fee income, reward token price declines between quote and sale, impermanent loss realized at exit, and cumulative gas costs across the holding period.
### How does concentrated liquidity amplify impermanent loss?
A concentrated liquidity position in a plus or minus 10% range experiences roughly ten times the impermanent loss of a full-range position for the same price move. A 5% price movement in a tightly concentrated range can produce 25% to 50% impermanent loss, erasing weeks of fee income. The amplification factor scales with range tightness: a plus or minus 5% range amplifies impermanent loss approximately 20x compared to full range.
### Why do reward tokens usually sell for less than the price used in APY calculations?
Governance tokens are sold continuously by yield farmers, creating persistent selling pressure. A protocol emitting 20% of token supply annually must generate equivalent buy pressure from utility or speculation to maintain price. Most do not. The time lag between APY calculation and your actual claim and sale allows price to decline, often 15% to 25% for high-emission protocols. The larger the emission rate relative to protocol revenue, the steeper the typical discount.
### How much do cumulative gas fees reduce net returns on Ethereum mainnet?
For a position held 90 days with weekly reward claims, gas typically totals $6 to $10 at 1 gwei, or 0.1% to 0.2% of a $5,000 position. Annualized that is 0.4% to 0.8%. On smaller positions or in higher-gas periods cumulative gas can exceed 2% of capital annually. Layer 2 networks reduce this to near zero, with total gas often under $0.50 for the entire lifecycle of a three-month position.
### What tools calculate actual DeFi returns rather than quoted APY?
APY.vision tracks exact impermanent loss, fees earned, and net profit and loss for liquidity positions across major DEXs in real time. Revert Finance specializes in Uniswap v3 analytics, showing position performance, range status, and rebalancing simulations. DefiLlama offers verified APY data that simulates daily on-chain withdrawals, revealing what holders actually earned. DeBank aggregates wallet positions and tracks deposited value versus current value across all protocols.
The Weekly Yield Report
You have just seen the five-component formula that routinely reveals a five to ten percentage point gap between quoted and realized yield. That gap will be different for your next position.
Every Thursday: where crypto yield actually is - stablecoins, liquid staking and DeFi lending, with the risk named next to the rate and what changed since last week.
[Get it free every Thursday](#/portal/signup)
Free. No trade calls, no allocations, no hype. Unsubscribe in one click.
### How To Systematically Find 1-3% Better Rates At Same Risk
URL: https://altcoininvestor.com/how-to-find-better-defi-yield-same-risk/
Last updated: 2026-09-27T23:06:05.000Z
## What You Will Accomplish
You will build a repeatable process to find 1-3% higher yield on the same risk profile. Not by chasing APY numbers. By matching collateral requirements, lock periods, smart contract audit scores, and TVL across protocols, then isolating the actual rate difference after accounting for withdrawal friction and gas costs.
On a $300,000 allocation, a sustained 1% improvement generates $3,000 annually. A 3% improvement generates $9,000\. The process takes two hours monthly versus reactive browsing that misses structural rate gaps.
Prerequisites: You already supply stablecoins or ETH to at least one [DeFi lending protocol](https://altcoininvestor.com/best-defi-protocols/). You understand collateralization ratios and liquidation mechanics. You have used Etherscan or a block explorer to verify contract state.
## Why Rates Differ At The Same Risk Level

On September 24, 2026, USDC suppliers on Aave's Ethereum market earned 3.62% while 92.7% of the $2.4 billion supplied was on loan. Morpho Blue's MetaMorpho vaults offered 4.1-6.8% on USDC with comparable collateral backing and audit coverage. Spark, aligned with the Sky protocol, offered 3.9-4.7%.
Same asset. Same chain. Different rates.
The gap is not risk. It is utilization, fee structure, and user inertia. Aave charges a 10% reserve factor on interest paid by borrowers. Morpho Blue enables curated vaults with custom fee splits. Spark subsidizes rates to attract Sky-aligned deposits. None of these differences show up in the headline APY number.
The failure mode: moving capital for a 0.3% rate bump, paying 0.5% in gas and slippage, then discovering the higher rate was temporary because utilization spiked. You net negative after friction costs.
The correct approach: match risk parameters first, calculate effective yield after friction, verify rate stability over 30 days, then move capital only when the net gain exceeds 1% annually.
## Build Your Comparison Spreadsheet

Create a spreadsheet with these columns:
- Protocol
- Asset
- Chain
- TVL
- Current APY
- Utilization %
- Collateral Accepted
- Audit Firm + Date
- Withdrawal Mechanism
- Estimated Gas Cost (bps)
- Effective Yield (APY minus friction)
- Risk Rating (1-5 scale)
Pull live data from [DefiLlama](https://defillama.com/) for TVL, utilization, and rates. Protocol documentation covers collateral rules and withdrawal mechanics. Sherlock and DeFi Sentinel track audit history and exploit events.
Snapshot all data on the same date. TVL fluctuates with asset prices, deposits, and protocol migrations. A rate comparison from Monday versus Friday can reflect two different liquidity environments.
### Risk Rating Methodology
Assign a 1-5 risk score based on:
- **Audit coverage:** No audit = 5\. Single audit older than 12 months = 4\. Multiple audits within 12 months = 2\. Continuous audit program (Aave, Compound) = 1.
- **TVL and market depth:** Below $100M = +1 risk point. Above $1B = -1 risk point.
- **Exploit history:** Any loss event in past 24 months = +2 risk points. Post-exploit relaunch (Euler V2) = maintain elevated score until 12 months post-launch with no incidents.
- **Governance and oracle architecture:** Multisig with fewer than 5 signers = +1\. Chainlink oracles = neutral. Custom oracle solution = +1.
Do not compare a protocol scored 2 against one scored 4\. They are not the same risk level.
## Match Collateral Requirements First
Aave V3 accepts 39% ETH, 28% liquid staking tokens, 14% BTC wrappers, and the remainder in major altcoins and stablecoin LP tokens as collateral. Morpho Blue enables isolated markets with customizable collateral per vault. Compound V3 restricts each market to a single borrow asset with limited collateral types.
If your current position on Aave accepts stETH collateral at a 1.25 liquidation threshold and you are comparing to a Morpho vault that requires ETH-only collateral at 1.15, the risk profiles diverge. The Morpho vault is more conservative. A higher rate there is not a free lunch. It reflects tighter collateral rules reducing borrower demand.
Match collateral composition before comparing rates. A 4.5% yield backed by ETH is structurally different from 4.5% backed by a mix of altcoins and stablecoin LP tokens. The latter carries correlation risk during market drawdowns.
## Account For Utilization As A Rate Multiplier
Rates are not static. The supply rate equals the borrow rate scaled by utilization, minus the protocol's reserve factor. At 92.7% utilization, Aave borrowers paid 4.34% and lenders received 3.62%. At 60% utilization, the same borrow rate would deliver a lower supply rate.
A protocol showing 5.2% APY at 95% utilization is less stable than one showing 4.8% at 70% utilization. The first will drop sharply when borrowers repay and utilization falls. The second has room for utilization to rise, which would increase the rate.
Check 30-day utilization history on DefiLlama. If utilization spiked from 65% to 95% in the past week, the current rate is temporary. Wait for stabilization before redeploying capital.
### Withdrawal Friction Tiers
Pooled markets like Aave and Compound have no lockup period, but withdrawals depend on available liquidity. When utilization reaches 100%, withdrawals wait until borrowers repay or new lenders arrive. Markets for DAI and USDC frequently exhibit periods above 80% utilization.
Isolated markets like Morpho Blue and Compound V3 operate independently with customizable parameters. Each market's liquidity is separate. A high utilization rate in one vault does not affect another.
Curated vaults like MetaMorpho add a wrapper layer. Check the underlying vault's asset liquidity, not just the wrapper's TVL. A vault with $50M TVL but only $5M withdrawable due to 90% utilization has meaningful friction.
Assign a withdrawal friction cost in basis points. Ethereum Layer 1 gas for a withdraw-and-redeposit cycle typically runs 20-50 bps depending on network congestion. If a protocol's utilization suggests withdrawal delays above 24 hours, add another 10-20 bps for opportunity cost.
## Verify Audit Scope And Recency
A realistic pre-launch audit budget for a mid-complexity DeFi protocol in 2026 runs $60,000 to $120,000, including initial audit and at least one remediation review. Protocols whose codebases are forked are significantly less likely to engage auditors. Protocols deploying original code are more likely to undergo smart contract audits.
Audit adoption in DeFi correlates with protocol-level risk exposure, technical complexity, governance design, and code originality. The first quarter of 2026 alone saw $482 million lost across 44 security incidents. Reentrancy attacks, integer overflows, and oracle price manipulation remain top threats.
Check three audit dimensions:
- **Firm reputation:** Top-tier firms (Trail of Bits, OpenZeppelin, Sigma Prime, Certora) versus newer entrants. A known firm reduces but does not eliminate risk.
- **Audit date relative to current code:** If the last audit was 18 months ago and governance has since changed liquidation parameters, the audit does not cover current risk.
- **Scope:** Full protocol audit versus module-specific review. Some protocols audit the core lending logic but not the oracle or governance contracts.
Cross-reference the audit date with the protocol's governance timeline. A governance proposal that reduced collateralization ratios or increased reserve factors after the last audit introduces unaudited risk. For more on governance risk, see [our multisig evaluation checklist](https://altcoininvestor.com/how-to-check-protocol-multisig-before-depositing/).
## Calculate Effective Yield After Friction
Effective yield equals the stated APY minus gas costs, withdrawal friction, and opportunity cost during lock or utilization-driven delays.
Example calculation for a $300,000 USDC position:
- **Protocol A (current position):** 3.8% APY, 75% utilization, no lockup, withdrawal costs 30 bps in gas. Effective yield: 3.8% - 0.3% = 3.5%.
- **Protocol B (candidate):** 4.5% APY, 92% utilization, no lockup, withdrawal costs 40 bps in gas, utilization suggests 12-hour delay adding 5 bps opportunity cost. Effective yield: 4.5% - 0.4% - 0.05% = 4.05%.
Net gain: 4.05% - 3.5% = 0.55%. On $300,000, that is $1,650 annually. If the move requires two transactions (withdraw from A, deposit to B) at 30 bps each, the breakeven period is 60 bps / 55 bps per year = 13 months. Only move capital if you expect to remain in Protocol B for more than 13 months.
If Protocol B's utilization has spiked recently and the 4.5% rate reflects temporary borrowing demand, the rate may drop to 3.9% within weeks. Effective yield falls to 3.45%, below your current position. The move costs you money.
## Decision Tree: When To Move Capital
Use this decision tree for every comparison:
**Step 1:** Risk score match within ±1 point? If no, stop. Different risk levels.
**Step 2:** Collateral requirements and liquidation thresholds equivalent? If no, stop. Structural risk mismatch.
**Step 3:** Effective yield difference (after friction) above 1%? If no, stop. Friction cost exceeds gain.
**Step 4:** Target protocol's utilization stable over past 30 days (±10 percentage points)? If no, wait. Rate likely temporary.
**Step 5:** Audit coverage current within 12 months? If no, stop. Unaudited code changes introduce unknown risk.
**Step 6:** Estimated time in new position exceeds breakeven period (friction cost / annual gain)? If no, stop. You will not recover transaction costs before rebalancing again.
Only proceed to capital movement if all six checks pass.
## Common Failure Modes And Real Examples
**Failure mode 1: Chasing subsidized rates.** Protocol offers 12% APY on USDC when market rates cluster around 4%. The gap is token emissions. If the protocol emits governance tokens worth 8% annually to lenders, you must account for dilution. Most governance tokens lose 60-80% of their value within six months of emission start. Your real yield is closer to 5.6% (4% + 1.6% from tokens after dilution), not 12%.
**Failure mode 2: Ignoring withdrawal queues.** You move $300,000 to a protocol offering 5.8% versus your current 4.2%. Utilization sits at 98%. Two weeks later, you need to withdraw. No liquidity available. You wait four days for borrowers to repay. During that time, you miss a 6.1% opportunity on another protocol and incur four days of opportunity cost. The delay erases your rate advantage.
**Failure mode 3: Moving capital for sub-1% gains.** Protocol A pays 3.9%. Protocol B pays 4.1%. You move $200,000 for a 0.2% gain ($400 annually). Gas costs are $120 round-trip (60 bps). Breakeven is 14 months. Three months later, Protocol A's utilization rises and its rate climbs to 4.3%. You are now underwater and contemplating another move, incurring another round of gas costs.
**Failure mode 4: Cross-chain rate arbitrage without bridge-risk accounting.** Ethereum mainnet offers 3.8% on USDC. Arbitrum offers 5.1%. You bridge $250,000 to Arbitrum. Bridge fee is 15 bps. Bridging back costs another 15 bps. Effective gain: 5.1% - 3.8% - 0.3% = 1.0%. You also introduced bridge contract risk and L2 sequencer risk, which are not present on mainnet. The risk-adjusted return is lower than the nominal 1.3% spread.
## Monitor These Signals Monthly
Set a two-hour monthly review to check:
- **Utilization drift:** Has your current protocol's utilization changed by more than 15 percentage points in the past 30 days? If yes, recalculate effective yield. A drop from 85% to 65% will reduce your rate.
- **New audit reports:** Has your protocol or a competitor published a new audit? New findings may change the risk score.
- **Governance changes:** Has a governance vote altered collateral ratios, reserve factors, or liquidation thresholds? If yes, verify whether the change was audited.
- **Rate spreads:** Run the comparison spreadsheet again with current data. Has a 0.8% spread widened to 1.5%? That may justify a move. Has a 1.2% spread narrowed to 0.6%? The opportunity has closed.
- **New protocol launches or vault offerings:** MetaMorpho vaults, new Compound V3 markets, or Euler V2 vault deployments may introduce better risk-adjusted rates. Evaluate them against your decision tree.
Do not react to day-to-day rate fluctuations. DeFi protocols offer variable rates that respond to supply and demand. A single-day spike or drop is noise. A sustained 30-day trend is signal.
## Edge Cases That Break The Model
**Collateral deprecation risk:** Lido's dominance raises decentralization questions. With approximately 28% of staked ETH, it approaches the threshold where it could theoretically influence consensus. The Lido DAO has implemented a self-limiting function, but this remains a philosophical debate. If Ethereum governance moves to penalize concentrated staking, stETH collateral may face haircuts. A protocol heavily backed by stETH carries tail risk not reflected in current audit scores or TVL.
**Oracle manipulation during low liquidity:** Smaller protocols with TVL below $200M may use Chainlink oracles, but the oracle's price feed depends on sufficient DEX liquidity for the asset. If liquidity drops below $10M during a market event, oracle prices can lag or spike, triggering unintended liquidations. Your risk score should penalize protocols with thin on-chain liquidity relative to TVL.
**Governance attack surface:** A protocol with a 5-of-9 multisig controlling treasury and parameter changes is more vulnerable than one with a 10-of-15 multisig plus a 48-hour timelock. Even if both protocols have identical audit coverage, the governance structure introduces different risk. For a deeper breakdown, review [how to audit multisig composition before depositing](https://altcoininvestor.com/how-to-check-protocol-multisig-before-depositing/).
**Composability cascades:** A protocol offering 6% APY may depend on another protocol's yield primitive (e.g., Morpho vault sourcing yield from an underlying Aave position). If the underlying position suffers an exploit or liquidity crunch, the wrapper protocol's yield drops to zero even though its own contracts were not compromised. Always trace the yield source to its origin.
## What To Do Next
Open a spreadsheet. Add the columns listed in section three. Pull current data for your existing position and three competitor protocols offering higher stated APY on the same asset. Calculate effective yield after friction. Run the decision tree.
If no protocol passes all six checks, do nothing. Staying put is a decision. If one protocol passes, calculate the breakeven period and set a calendar reminder to re-evaluate in 30 days. If the rate spread persists, move capital.
Repeat this process monthly. Rate environments shift. What was a 0.6% gap in March may widen to 1.8% in June as utilization patterns change. The systematic process captures those shifts without requiring daily monitoring.
## The Takeaway
A 1-3% improvement on a $300,000 allocation generates $3,000 to $9,000 annually. The difference between earning that and losing money on gas costs is a structured comparison process. Match risk scores and collateral requirements first. Calculate effective yield after friction. Verify rate stability over 30 days. Move capital only when the net gain exceeds 1% and the breakeven period fits your time horizon.
The mechanism that produces better risk-adjusted yield is not luck. It is systematic decomposition of what the rate actually consists of, what friction costs are, and whether the spread is structural or temporary. Most allocators skip those steps and chase APY. That is why the gaps persist.
## Frequently Asked Questions
### What is the minimum rate difference worth moving capital for?
Move capital only when the effective yield difference (after gas and friction costs) exceeds 1% annually and the breakeven period fits your time horizon. A 0.5% spread on Ethereum Layer 1 is typically break-even after accounting for withdrawal and redeposit gas costs of 20-50 basis points. Smaller spreads cost you money in transaction fees. Always calculate net gain after friction before moving.
### How do I know if a higher APY reflects real yield or temporary subsidies?
Check the protocol's utilization history over 30 days on DefiLlama. If utilization spiked from 65% to 95% recently, the rate is likely temporary and will drop when borrowing demand normalizes. Also verify whether the yield includes token emissions. If the stated APY is 12% but the market baseline is 4%, the gap is usually governance token rewards that dilute 60-80% within six months. Your real yield is closer to the baseline plus 20-40% of the emission value.
### What risk score difference disqualifies a comparison?
Do not compare protocols whose risk scores differ by more than one point on a 1-5 scale. A protocol scored 2 (multiple recent audits, high TVL, no exploit history) is structurally different from one scored 4 (single old audit, low TVL, or post-exploit relaunch). The higher rate on the riskier protocol compensates for that risk. It is not a free improvement. Match risk profiles first, then compare rates.
### How often should I rerun the comparison process?
Monthly. Set a two-hour review to check utilization drift, new audits, governance changes, and rate spreads. DeFi rates are variable and respond to supply and demand. A 0.8% spread in March may widen to 1.5% in June or narrow to 0.3%. The systematic process captures structural shifts without requiring daily monitoring. Do not react to single-day rate fluctuations. A sustained 30-day trend is signal; daily moves are noise.
### What if the protocol with the best rate has high utilization and withdrawal delays?
Account for withdrawal friction in your effective yield calculation. If a protocol shows 5.8% APY but 98% utilization suggests a four-day withdrawal delay, add 10-20 basis points for opportunity cost. If the delay exceeds your liquidity needs (e.g., you may need to withdraw on short notice), the protocol does not match your risk profile regardless of rate. Pooled markets like Aave and Compound have no lockup but depend on available liquidity. When utilization reaches 100%, withdrawals wait until borrowers repay.
The Weekly Yield Report
You have just built a decision tree that isolates 1-3% structural rate gaps without increasing risk. Those gaps will shift as utilization and governance parameters change monthly.
Every Thursday: where crypto yield actually is - stablecoins, liquid staking and DeFi lending, with the risk named next to the rate and what changed since last week.
[Get it free every Thursday](#/portal/signup)
Free. No trade calls, no allocations, no hype. Unsubscribe in one click.
### Arbitrage Bots: Why The Real Opportunity Is Smaller Than It Sounds
URL: https://altcoininvestor.com/crypto-arbitrage-bots/
Last updated: 2026-09-27T22:04:12.000Z
## The Question Most Retail Arbitrage Guides Avoid Answering

The promise of crypto arbitrage bots is straightforward: automated software detects price differences between exchanges, buys low, sells high, and deposits profit into your account while you sleep. Marketing materials describe 20% monthly returns, passive income streams, and AI-powered algorithms that exploit inefficiencies professional traders supposedly overlook. The question worth answering is why, if these opportunities are so abundant and so easily automated, institutional market makers with billions in capital and sub-millisecond execution have not already arbitraged them away.
The answer is that they have. What remains for retail participants is not the broad, liquid, high-volume arbitrage depicted in most promotional content. What remains is a narrow set of opportunities requiring either specialized infrastructure, higher risk tolerance, or capital inefficiencies large institutions avoid. Understanding which opportunities still exist, what they realistically pay, and why the majority of advertised yields collapse under contact with live market conditions is the difference between deploying capital intelligently and funding someone else's exit liquidity.
This is not an argument that all arbitrage is dead. It is an argument that the arbitrage available to retail traders in 2026 looks very different from what the marketing describes, pays considerably less than the headlines suggest, and fails far more often than the backtests implied it would.
## What Arbitrage Actually Looked Like Before It Was Competed Away

There was a period, roughly 2017 through early 2021, when cross-exchange arbitrage for retail participants was both straightforward and profitable. Bitcoin might trade at $9,200 on Coinbase and $9,350 on Kraken. A trader with accounts on both platforms could buy on Coinbase, transfer the Bitcoin, sell on Kraken, and pocket the $150 spread minus fees and withdrawal costs. The mechanics were simple. The infrastructure requirements were modest. The spreads were wide enough to survive the round-trip cost structure.
That environment no longer exists. The median cross-exchange spread on high-volume pairs like BTC/USDT is now measured in basis points, not percentage points. When spreads do widen temporarily during volatility or liquidity shocks, they close within seconds, not minutes. The bots that capture those spreads are co-located on exchange infrastructure, operating via WebSocket and FIX protocol connections that execute in microseconds. A retail trader running a script on a home server or cloud VPS is not competing with other retail traders. They are competing with quantitative trading firms whose latency to exchange matching engines is a small fraction of what any retail setup can achieve.
This is not a new dynamic. It is the same dynamic that eliminated retail arbitrage in equity markets, foreign exchange, and commodity futures over the past three decades. The progression is predictable: an inefficiency appears, early participants extract outsized returns, competition drives down spreads, infrastructure advantages become decisive, and eventually only those with the fastest execution and lowest cost structure remain profitable. Crypto followed the same path. It simply took longer because fragmentation across hundreds of exchanges and chains created more persistent inefficiencies than existed in traditional markets.
## Where Retail Arbitrage Still Exists (And What It Actually Pays)

The opportunities that remain for retail participants fall into three categories: funding rate arbitrage, cross-DEX arbitrage during specific windows, and low-liquidity altcoin pairs where bot coverage is thinner. Each has a different risk profile, different capital requirements, and different realistic return expectations. None of them pay the 20% monthly returns that appear in promotional screenshots.
### Funding Rate Arbitrage
Funding rate arbitrage is the lowest-risk entry point because the position never leaves the exchange. The mechanism is straightforward: when the perpetual futures contract for an asset is trading at a premium to spot (indicating net long positioning), the funding rate is positive. Traders holding long positions pay funding to traders holding short positions, typically every eight hours. A retail trader can go long on the spot market, short an equivalent amount on the perpetual market, and collect the funding rate with no directional exposure.
At a funding rate of 0.05% per eight-hour period, the gross annualized carry is roughly 55%. That sounds exceptional until you account for the costs. Most exchanges charge a 0.1% taker fee, meaning the round-trip cost to establish the position is 0.2%. If the funding rate drops or flips negative before the next payment, the trade becomes unprofitable. In practice, [traders running automated funding rate strategies](https://altcoininvestor.com/crypto-trading-bot/) target rates above 0.1% per period and close positions when rates compress below that threshold.
The realistic net return after accounting for fee drag, rate compression, and the capital inefficiency of maintaining margin on both spot and perpetual markets is 10% to 25% annually. That is a real, sustainable return. It is also far below what most arbitrage bot marketing suggests is typical.
### Cross-DEX Arbitrage During Specific Windows
Cross-DEX arbitrage is viable in two scenarios: new token launches with fragmented liquidity, and low-liquidity altcoin pairs where pricing has not yet converged across decentralized exchanges. In both cases, the spreads are wider than on centralized exchanges, but the execution risk is correspondingly higher. Slippage on a $5,000 trade in a low-liquidity pool can exceed 2%, and if the second leg of the trade fails to execute at the expected price, the arbitrageur is left holding unhedged inventory in a volatile asset.
The advantage for retail participants is that DEX arbitrage does not require the same sub-millisecond execution speed that CEX arbitrage demands. A well-constructed bot monitoring on-chain liquidity pools can identify and execute profitable trades within blocks, not microseconds. The disadvantage is that gas fees on Ethereum, even after recent optimizations, average $3 to $15 per transaction. On a $2,000 arbitrage trade netting a 0.8% spread, gas costs can consume half the gross profit.
Realistic monthly returns for retail traders running cross-DEX strategies with $5,000 to $20,000 in capital fall between 3% and 8%, with higher returns concentrated in periods of elevated volatility or new token launches. The infrastructure requirements are higher than funding rate arbitrage, the execution risk is higher, and the return distribution is lumpier. It is not passive income. It is active trading with automation handling execution.
### Low-Liquidity Altcoin Pairs
The third category is arbitrage on low-liquidity altcoin pairs where professional market makers have chosen not to deploy capital. These pairs exist on second-tier centralized exchanges and smaller DEXs. The spreads are wider, sometimes exceeding 2%, but the volume is thin and the execution risk is high. A $10,000 buy order on a pair with $50,000 in daily volume will move the market, and the sell leg may execute at a price that eliminates the profit entirely.
This is not a scalable strategy. It is a strategy for small amounts of capital in specific windows. Traders who monitor these pairs manually and execute opportunistically report returns in the 1% to 5% per month range, but the time investment is substantial and the strategy stops working once capital exceeds $20,000 to $30,000.
## Why 90% Of Advertised Arbitrage Yields Are Unsustainable
The core failure modes of retail arbitrage are transfer speed risk, inventory drag, slippage, fee dominance, and crowding. Most marketed arbitrage bots fail on at least two of these dimensions. The naive version of cross-exchange arbitrage, where a trader buys on one exchange, withdraws the asset, deposits it on another exchange, and sells, rarely survives contact with live market conditions. Transfers take minutes to hours. Bitcoin withdrawals cost $5 to $30 depending on the exchange. By the time the asset arrives, the spread that justified the trade has closed or reversed.
The solution is to maintain inventory on both exchanges, which introduces capital inefficiency. A trader with $10,000 in total capital must split it across multiple exchanges to execute arbitrage without waiting for transfers. That means $3,000 on Binance, $3,000 on Coinbase, $2,000 on Kraken, and $2,000 on Bitfinex. Each exchange holds idle capital earning no return while waiting for arbitrage opportunities. The opportunity cost of that idle capital lowers the effective return on the deployed capital.
[Slippage and one-legged execution failures](https://altcoininvestor.com/how-grid-trading-bots-work/) are the second structural problem. CEX-DEX arbitrage, which promotional materials describe as the highest-yield strategy in 2026, carries execution risk that pure DEX arbitrage does not. A DEX arbitrage trade can be structured atomically within a single transaction: if both legs do not execute at the expected price, the entire transaction reverts and no capital is lost. CEX-DEX arbitrage has no such protection. The CEX leg can execute while the DEX leg fails, leaving the trader holding unhedged inventory in a falling market.
Fee dominance is the third problem. The spread being arbitraged is often smaller than two taker fees. Binance charges 0.1% per trade. Coinbase charges 0.4% to 0.6% for retail users. A round-trip arbitrage trade on those two exchanges costs 0.5% to 0.7% in fees before accounting for withdrawal costs or slippage. If the spread is 0.6%, the trade is marginal at best. If the spread is 0.4%, the trade is unprofitable before it executes. Professional market makers avoid this problem by earning maker rebates rather than paying taker fees, but that requires providing liquidity rather than taking it, which is a different strategy entirely.
The fourth failure mode is crowding. When funding rates are elevated and widely advertised, capital flows into the trade and compresses the rate. A funding rate of 0.15% per period that looks attractive on Monday can fall to 0.03% by Wednesday as more traders establish the same position. The yield is real while it lasts, but it is not stable, and it does not scale.
The fifth and most insidious failure mode is outright fraud. In 2022, the U.S. SEC identified Forsage as a fraudulent pyramid scheme in which 88% of participants lost money. In 2026, similar scams have rebranded as AI-powered arbitrage bots and MEV slippage bots, promising $2,000 per day in passive income. The mechanism is simple: users deposit ETH or stablecoins into a smart contract that advertises automated arbitrage execution. The contract contains a backdoor that transfers deposited funds to the operator. The arbitrage never happens. The deposits vanish.
This is not a theoretical risk. It is the most common outcome for retail participants who deploy capital into arbitrage bots marketed with performance claims that exceed what the underlying market structure can support. The SEC and other regulators have issued explicit warnings that claims of high or guaranteed returns from AI-assisted arbitrage algorithms are red flags of fraud. The warnings are accurate.
## The Infrastructure Question Most Marketing Ignores
Two bots can detect the same arbitrage opportunity at the exact same moment. The one that executes first captures the profit. The one that executes 300 milliseconds later arrives at a market that has already moved. Execution speed is not a minor optimization. It is the decisive factor in whether a retail arbitrage bot generates returns or loses money to fees and slippage.
The standard REST API, which most retail bots use to query exchange prices and submit orders, is largely obsolete for execution in competitive arbitrage. Serious participants use WebSocket feeds for price data and FIX protocol connections for order submission. The latency difference between a REST API call and a FIX order is measured in hundreds of milliseconds. In a market where spreads close in seconds, that latency difference determines whether the trade executes at the expected price or whether it executes at a loss.
This is why institutional market makers co-locate their servers in the same data centers as exchange matching engines. The physical distance between the trading server and the exchange determines signal propagation time. A server in the same data center has a latency advantage measured in microseconds over a server in a different city, and milliseconds over a server on a home internet connection. Retail participants cannot replicate that infrastructure without capital expenditures that exceed the realistic return on arbitrage for accounts below $100,000.
The question is not whether retail arbitrage is possible. The question is whether it is possible at a return that justifies the infrastructure cost, the capital inefficiency, and the execution risk. For most retail participants, the answer is no.
## What Realistic Returns Actually Look Like In 2026
A retail trader working with $5,000 to $20,000 in capital and running an automated funding rate or cross-DEX strategy can expect monthly returns of 1% to 5% if the strategy is executed consistently and the trader actively manages fee drag and rate compression. A well-optimized triangular arbitrage bot operating on DEXs might generate 0.2% to 0.5% daily in gross profit, but after fees and losing trades, net monthly returns often stabilize between 3% and 8%.
A 2025 survey by The Block Research found that the median crypto arbitrage fund returned 12% annually after fees, with top performers reaching 25% to 35%. Those top performers are institutional funds with proprietary infrastructure, co-located servers, and capital pools exceeding $10 million. The comparison is instructive. If professional arbitrage funds with every structural advantage are generating 25% to 35% annually, retail participants with higher fees, slower execution, and smaller capital should expect returns below that range, not above it.
The marketing materials that describe 20% monthly returns, 68% monthly returns, or 750% annual returns are not describing arbitrage. They are describing token Ponzi schemes, affiliate scams, or entirely fabricated performance that will never be replicated in a live account. [The same dynamic that collapsed Anchor's 19.45% APY, Celsius's 17% yield, and BlockFi's 8% return](https://altcoininvestor.com/why-high-stablecoin-yields-fail/) applies to arbitrage yield that exceeds what the underlying market structure can support. When the advertised return is structurally impossible, it is not a return. It is a liability that has not yet been disclosed.
## When Arbitrage Still Makes Sense (And When It Doesn't)
Arbitrage makes sense for retail participants in three scenarios. The first is as a learning exercise. Running a small arbitrage bot with $500 to $2,000 in capital teaches execution mechanics, fee structures, slippage dynamics, and the difference between backtested performance and live performance. The financial return may be modest, but the educational return is high for traders who intend to scale into more complex strategies.
The second scenario is funding rate arbitrage during periods of elevated volatility. When funding rates exceed 0.15% per eight-hour period and are sustained for multiple days, the risk-adjusted return is attractive even after accounting for fee drag and the capital inefficiency of maintaining margin on both spot and perpetual markets. This is not a passive strategy. It requires active monitoring and rapid position adjustment when rates compress.
The third scenario is cross-DEX arbitrage for traders with programming skills and the ability to build custom execution infrastructure. Off-the-shelf arbitrage bots sold as subscription services or one-time purchases are, almost without exception, either scams or outdated software that was profitable two years ago and has since been arbitraged away by faster participants. Custom-built bots that monitor niche liquidity pools, operate on low-fee chains like Solana or Tron, and execute during windows of elevated volatility can still generate positive returns. The capital requirement is higher, the time investment is higher, and the strategy is closer to active trading than passive income.
Arbitrage does not make sense for retail participants who are looking for passive income, who have less than $2,000 in starting capital, or who are evaluating off-the-shelf bots marketed with performance claims above 15% annually. The infrastructure cost exceeds the realistic return, the execution risk exceeds the margin of safety, and the probability that the marketed performance is fraudulent exceeds the probability that it is real.
## The Precedent From European Sovereign Debt Markets
The eurozone spent 2011 through 2013 discovering that yields advertised on Greek and Portuguese sovereign debt reflected the perceived probability of default rather than any actual return of principal. Greek two-year bonds were yielding 25% in early 2012\. That was not a yield. That was a market pricing in the likelihood that Greece would default, restructure, or exit the euro entirely. When the underlying credibility broke, the yields stopped being yields. They became losses that had been accruing all along, disclosed at last.
The parallel to crypto arbitrage is direct. An arbitrage bot advertising 20% monthly returns is not offering a return. It is offering exposure to a mechanism that will fail under one of several predictable conditions: fee drag will exceed gross profit, execution slippage will eliminate the spread, the underlying smart contract will contain a backdoor, or the advertised performance will be revealed as fabricated. The yield is not sustainable because the mechanism producing it is not credible.
The question every arbitrage opportunity must answer is the same question every sovereign debt investor must answer: is the promise credible, and what happens when it breaks? For Greek bonds in 2012, the answer was a 75% haircut on principal. For [most retail crypto arbitrage bots in 2026](https://altcoininvestor.com/how-do-crypto-trading-bots-make-money/), the answer is a total loss of deposited capital within 90 days.
## The Takeaway
Retail arbitrage in crypto still exists, but it exists in a narrow band of opportunities that pay far less than the marketing suggests and require far more infrastructure and active management than most promotional materials disclose. Funding rate arbitrage can generate 10% to 25% annually for traders who actively monitor rate compression and manage fee drag. Cross-DEX arbitrage can generate 3% to 8% monthly for traders with custom execution infrastructure and tolerance for execution risk. Low-liquidity altcoin arbitrage can generate 1% to 5% monthly for traders with small capital pools and high time investment.
Everything else, every claim of 20% monthly returns or 750% annual returns or passive income from AI-powered algorithms, is either a Ponzi scheme, an affiliate scam, or a smart contract backdoor waiting to be triggered. The mechanism producing those advertised yields is not arbitrage. It is a distribution of someone else's deposited capital, and it stops the moment new deposits stop arriving. This is not speculation. This is the documented outcome of Forsage, of dozens of MEV bot scams in 2025 and 2026, and of every arbitrage scheme that promised returns structurally inconsistent with the underlying market's capacity to support them.
The real opportunity in arbitrage is smaller than it sounds. It is also real, for those willing to accept that reality and build accordingly.
## Frequently Asked Questions
### What is a crypto arbitrage bot?
A crypto arbitrage bot is automated software that detects price differences for the same asset across different exchanges or trading pairs, then executes buy and sell orders to capture the spread as profit. The bot monitors markets continuously and attempts to execute trades faster than manual traders can. However, most retail arbitrage opportunities have been competed away by institutional market makers with faster infrastructure, leaving only narrow, specialized opportunities for retail participants.
### Can you really make 20% monthly returns with arbitrage bots?
No. Claims of 20% monthly or 750% annual returns from arbitrage bots are either Ponzi schemes, affiliate scams, or entirely fabricated performance. Realistic returns for retail traders running funding rate or cross-DEX arbitrage with $5,000 to $20,000 in capital fall between 1% and 5% monthly, or 10% to 25% annually. Professional arbitrage funds with institutional infrastructure and millions in capital report median annual returns of 12%, with top performers reaching 25% to 35%. Advertised yields above this range are structurally unsustainable.
### What is funding rate arbitrage and how much does it actually pay?
Funding rate arbitrage involves going long on spot while shorting an equivalent amount on perpetual futures, collecting the funding rate paid by net long positions with no directional exposure. At 0.05% per eight-hour period, gross annualized carry is roughly 55%, but after accounting for exchange fees (typically 0.1% to 0.2% round-trip), rate compression, and capital inefficiency of maintaining margin on both markets, realistic net returns fall between 10% and 25% annually. This is sustainable but requires active monitoring and position adjustment when rates compress.
### Why can't retail traders compete with institutional arbitrage bots?
Institutional market makers use co-located servers in the same data centers as exchange matching engines, WebSocket and FIX protocol connections, and sub-millisecond execution infrastructure. Retail traders using standard REST APIs on home or cloud servers have latency measured in hundreds of milliseconds. When arbitrage spreads close in seconds, that latency difference determines whether a trade executes profitably or at a loss. Additionally, institutions earn maker rebates while retail traders pay taker fees, further eroding already-thin spreads that rarely exceed a few basis points on liquid pairs.
### What are the main risks of using arbitrage bots?
The main risks are transfer speed risk (spreads close before assets arrive), fee dominance (fees exceed gross profit), slippage (execution price differs from expected price), one-legged failures (one side executes while the other fails, leaving unhedged exposure), and outright fraud (smart contract backdoors or Ponzi schemes disguised as arbitrage). Most off-the-shelf arbitrage bots sold as subscriptions are either scams or outdated software that was profitable years ago but has since been arbitraged away by faster participants. Custom infrastructure and active management are required for sustainable returns.
The Weekly Yield Report
You have just examined three surviving arbitrage categories paying 10% to 25% annually after fees and infrastructure costs. Those spreads will be narrower next quarter.
Every Thursday: where crypto yield actually is - stablecoins, liquid staking and DeFi lending, with the risk named next to the rate and what changed since last week.
[Get it free every Thursday](#/portal/signup)
Free. No trade calls, no allocations, no hype. Unsubscribe in one click.
### Best Crypto Portfolio Trackers After Zapper Shutdown
URL: https://altcoininvestor.com/best-crypto-portfolio-tracker/
Last updated: 2026-09-27T21:08:58.000Z
## Why Portfolio Trackers Matter More in 2026
Zapper shut down on August 3, 2026\. At its peak it served 2 million monthly users who trusted it to consolidate DeFi positions, NFT holdings, and wallet balances across chains. Those users now need replacements, and the bar has moved.
A serious crypto investor in 2026 needs a tool that crosses into portfolio management territory. Modern trackers do five things that matter: they aggregate balances from exchanges and self-custody wallets, they decode DeFi positions without requiring manual entry, they track NFTs and yield-bearing assets, they generate tax reports that survive IRS scrutiny, and they do all of this across more than a dozen blockchains.
None of them do all five equally well.
This review evaluates the trackers that handle the work Zapper used to do, plus the specialized tools that excel at tax reporting or privacy. Each section below groups tools by what they are actually good at, not by arbitrary ranking. You pick based on whether you hold most assets on exchanges or in self-custody wallets, whether you farm yield across protocols, whether you file US taxes, and whether you will pay for the service.
## The DeFi-First Trackers

DeBank supports 50+ chains and offers the widest protocol coverage of any tracker. It reads your wallet address and surfaces liquidity positions, staked assets, collateral in lending protocols, and unclaimed rewards. No API key needed. No account creation required if you only want the dashboard.
The interface shows your portfolio composition by protocol, not just by token. That matters when you are trying to figure out where your capital is actually deployed.
DeBank does not support Solana. If you hold SPL tokens or use Solana DeFi, this is not your tool. It also does not generate tax reports, which means you will need a second service if you file in the US.
Zerion covers 15+ chains with broad EVM protocol support and yield tracking included. The interface feels closer to Zapper than DeBank does. Zerion also offers a mobile app and a browser extension that doubles as a transaction wallet, which DeBank lacks. The free tier works for portfolio tracking, but premium features sit behind a subscription.
Zerion handles NFTs and shows historical performance, though the NFT gallery is not as detailed as dedicated NFT platforms. Tax reporting is absent here too.
Rotki is the privacy pick. It is open source and runs on your own machine, with portfolio data never living on someone else's server. You import wallet addresses and exchange API keys, and Rotki pulls transaction history locally to calculate cost basis, track DeFi positions, and generate tax reports for dozens of jurisdictions.
Rotki held its subscription flat for seven years, then moved to tiers in November 2025 with Basic pricing at €25 per month. The free tier is capped, processing your 1,000 most recent events and two weeks of net-worth history. An active DeFi user burns through that fast.
If you refuse to hand portfolio data to a server, Rotki is the only serious option. The trade-off is setup friction and a steeper learning curve than cloud-based dashboards.
## The Tax-Integrated Trackers

CoinTracker pricing has four tiers: a free portfolio view, Base at $29 per year, Prime at $99 per year, and Ultra at $599 per year for high-volume traders. Tax reports unlock at the paid tiers. From the 2025 tax year, US exchanges report your sales to the IRS on [Form 1099-DA](https://altcoininvestor.com/best-crypto-tax-software-3/), which drives users toward tax-integrated trackers.
CoinTracker pulls data from exchanges via read-only API keys and from wallets via public addresses. It handles staking rewards, airdrops, and DeFi transactions, though complex yield strategies sometimes require manual review. The platform generates IRS Form 8949 and Schedule D, plus capital gains summaries by short-term and long-term holding periods.
US-focused trackers like CoinTracker have limited international support. If you file outside the US, look elsewhere.
CoinStats is free up to 10 wallets or 1,000 transactions, with paid plans starting at $9.99 a month. Its tax reports are powered by CoinLedger, which means you get the same classification logic and jurisdiction support. CoinStats supports 20,000+ cryptocurrencies and integrates with 300+ exchanges and 1,000+ DeFi protocols. It also tracks 35,000+ NFTs.
The mobile app is the strongest in this category. CoinStats wins on mobile experience, while CoinTracker wins on depth of tax logic for edge cases like wash sales and staking income treatment.
Koinly supports 100+ countries for tax, which makes it the default choice if you file outside the US. Pricing scales by transaction volume, starting around the same range as CoinTracker. Koinly handles DeFi, NFTs, and margin trading, though [users report](https://altcoininvestor.com/best-crypto-tax-software-defi-yield-staking/) that autocompounding vaults and cross-chain bridges sometimes require manual corrections.
## The Lightweight and Privacy Options
CoinMarketCap's portfolio tracker is free to use, with no paid tier above it. You manually enter your holdings or import via CSV. It does not pull live balances from wallets or exchanges, which means you update it yourself. No API keys. No wallet addresses. No data shared beyond what you type in.
This works if you hold assets on a centralized exchange and want a simple net-worth view without connecting accounts. It does not work if you hold positions across DeFi protocols or need automated transaction tracking.
Crypto Pro stores all data locally on your device using the Apple keychain and never sends portfolio data to its own servers. No email or account needed to start. You add holdings manually or sync via iCloud across your own devices. The interface is iOS and macOS only, optimized for privacy-conscious investors who refuse to hand portfolio data to a third party.
Crypto Pro does not generate tax reports. It does not decode DeFi positions automatically. It is a净worth tracker, not a transaction ledger.
Portals Explorer and DeFiLlama's Portfolio are both free, web-based, and focused on DeFi. You paste a wallet address and get a breakdown of protocol positions. No account needed. Portals covers fewer chains than DeBank but offers better visualizations of liquidity pool exposure and impermanent loss. DeFiLlama's Portfolio is lighter still, showing protocol balances without the polish of a dedicated dashboard.
Neither tool handles centralized exchange balances or generates tax reports. They are supplements, not replacements, for a full-stack tracker.
## What You Actually Need
DeFi dashboards are not always good at centralized exchange balances. Many users need a two-tool setup: a general tracker for exchanges and manual holdings, plus an on-chain dashboard for wallets and protocols.
If you file US taxes and hold most assets on [centralized exchanges](https://altcoininvestor.com/top-5-best-crypto-exchanges-in-2025/), CoinTracker or CoinStats with tax integration is the starting point. Add DeBank or Zerion if you also farm yield in DeFi.
If you file outside the US, Koinly is the tax layer. Pair it with DeBank for protocol tracking.
If privacy is non-negotiable, Rotki is the only tracker that keeps your data on your own hardware. The cost is setup friction and a monthly subscription once you exceed 1,000 events. If you accept cloud hosting but want minimal data sharing, Crypto Pro on iOS stores everything locally and syncs via your own iCloud.
If you hold positions across more than three wallets, check the pricing model before committing. Octav bills per tracked address per year, which means six wallets on its Lite tier costs $894, not $149\. Zapper users routinely bundled five or ten addresses, and that pricing punishes exactly that pattern.
Free is not one thing. CoinMarketCap and DeFiLlama Portfolio list no paid tier at all. Rotki's free tier stops at 1,000 events. CoinStats is free up to 1,000 transactions. An active DeFi user hits those caps in weeks.
## The Cautionary Context
Blockfolio was released in 2014 as a cryptocurrency portfolio tracker and was considered a convenient, user-friendly solution. FTX acquired a majority stake in 2020, and after the FTX bankruptcy, Blockfolio is no longer available. Zapper, which served 2 million users at peak, announced its shutdown in July 2026 and went offline the following month.
Both services were free. Both had large user bases. Both disappeared when the entity behind them folded or pivoted.
If you build your workflow around a free service with no revenue model, you accept the risk that it vanishes. Paid tiers and open-source projects reduce that risk. Rotki is open source, so even if the company stops development, the software still runs. CoinTracker and Koinly charge subscriptions, which means they have revenue to fund ongoing operations.
Free dashboards like DeBank and CoinMarketCap are useful, but you should assume they can disappear. Do not rely on them as your only record of cost basis or transaction history. Export data regularly if the tool allows it, or use a paid tracker that archives your transaction ledger.
## How to Pick Among Them
Start with your [custody model](https://altcoininvestor.com/how-to-track-crypto-portfolio/). If you hold most assets on centralized exchanges and file US taxes, CoinTracker or CoinStats handles both portfolio tracking and tax reporting in one platform. The paid tiers are inexpensive relative to the cost of hiring a tax professional to reconstruct your transaction history manually.
If you hold assets in self-custody wallets and interact with DeFi protocols, DeBank or Zerion gives you the protocol-level view that exchange-focused trackers miss. Neither generates tax reports, so you will need a second tool. Koinly or CoinTracker becomes the tax layer, and DeBank becomes the DeFi dashboard.
If you hold positions across more than a dozen wallets or refuse to share API keys with a cloud service, Rotki is the only tracker that keeps your data local. The free tier caps at 1,000 events, so budget €25 per month if you trade or farm actively. If you are on iOS or macOS and your holdings are simple, Crypto Pro offers local-only storage with a cleaner interface and no subscription.
If you hold NFTs as a meaningful percentage of portfolio value, CoinStats tracks 35,000+ NFTs and integrates them into net-worth calculations. Zerion also shows NFTs, though the gallery is lighter. DeBank shows NFT holdings but does not offer detailed floor price tracking or rarity data.
If you operate across more than 15 blockchains, check chain coverage before committing. DeBank supports 50+ chains but excludes Solana. Zerion covers 15+ chains, all EVM. CoinStats integrates 1,000+ protocols but relies on third-party data feeds for some smaller chains. Rotki supports fewer chains natively but allows manual CSV imports for any blockchain.
If you need historical performance data beyond simple cost basis, CoinTracker and Koinly both archive transaction history and allow you to query gains by time period, asset, or wallet. Free dashboards like DeBank show current positions but do not always retain historical snapshots unless you export them manually.
## The Takeaway
Portfolio trackers have fragmented by use case. No single tool handles exchange balances, DeFi positions, tax reporting, and privacy equally well in 2026.
The fastest Zapper replacement is DeBank for DeFi positions or Zerion for an all-in-one dashboard with mobile support. If you file US taxes, add CoinTracker or CoinStats as the tax layer. If you file internationally, use Koinly. If you refuse to upload wallet data to someone else's server, [Rotki or Crypto Pro](https://altcoininvestor.com/best-crypto-wallets/) keeps everything local at the cost of setup friction.
The lesson from Blockfolio and Zapper is that free tools with no revenue model can disappear overnight. Paid subscriptions and open-source projects both reduce that risk, though neither eliminates it. Export transaction data regularly if your tracker allows it, and do not rely on a single service as your only record of cost basis for tax purposes.
## Frequently Asked Questions
### What is the best free crypto portfolio tracker in 2026?
DeBank offers the widest free protocol coverage at 50+ chains with no account required, while CoinMarketCap provides a simple manual tracker with zero data sharing. DeFiLlama Portfolio works for quick wallet scans. None of these free options generate tax reports, so US filers will need a paid service like CoinTracker or CoinStats if they want IRS-ready documentation. Free trackers also carry shutdown risk, as Zapper and Blockfolio demonstrated.
### Which crypto portfolio tracker is best for DeFi positions?
DeBank supports 50+ chains and decodes liquidity pools, staked assets, and lending collateral without manual entry. Zerion covers 15+ EVM chains with yield tracking and a mobile app. Rotki offers local-only processing for privacy but requires setup and costs €25 per month beyond 1,000 events. DeBank has the widest protocol coverage but excludes Solana. If you hold Solana DeFi positions, you need a second tool or a tracker like CoinStats that integrates SPL tokens.
### Do I need a separate tool for crypto tax reporting?
If you file US taxes, CoinTracker or CoinStats generate IRS Form 8949 and Schedule D directly. International filers should use Koinly, which supports 100+ countries. DeFi-focused trackers like DeBank and Zerion do not produce tax reports, so you will need a second service. As of 2025, US exchanges issue Form 1099-DA to report your sales to the IRS, which makes cost-basis tracking more important than in prior years. Free trackers rarely offer tax exports.
### Which portfolio tracker offers the best privacy?
Rotki is open source and runs on your own machine with no cloud upload, processing wallet and exchange data locally. Crypto Pro stores all data on your iOS or macOS device using Apple keychain and never sends portfolio information to external servers. CoinMarketCap allows manual entry without API keys or wallet addresses. Cloud trackers like DeBank, Zerion, CoinTracker, and Koinly all require you to share wallet addresses or API keys with their servers in exchange for automated tracking.
### What happened to Zapper and where should users go now?
Zapper shut down on August 3, 2026 after seven years of operation and 2 million monthly users at peak. Co-founder Seb Audet announced the wind-down in July 2026, taking the site, mobile apps, and APIs offline. The fastest replacements are DeBank for protocol tracking, Zerion for an all-in-one mobile experience, or Rotki for self-hosted privacy. DeFiLlama Portfolio and Portals Explorer also offer free DeFi dashboards. None replicate Zapper exactly, so many former users now run a two-tool setup pairing a DeFi dashboard with a tax tracker.
Tool mentioned above
Koinly
Koinly imports from 800+ exchanges and wallets and handles the DeFi cases most tools get wrong - rebasing tokens, LP positions, staking rewards.
[Try Koinly](https://koinly.io/?via=F6E2E35A&utm%5Fsource=affiliate)
We may earn a commission if you sign up through this link, at no cost to you. It does not change what gets recommended.
The Weekly Yield Report
You have just compared seven trackers ranging from $0 to €300 per year and read why tax integration now matters for US holders. Those product tiers and regulatory requirements will both change before next April.
Every Thursday: where crypto yield actually is - stablecoins, liquid staking and DeFi lending, with the risk named next to the rate and what changed since last week.
[Get it free every Thursday](#/portal/signup)
Free. No trade calls, no allocations, no hype. Unsubscribe in one click.
### Single Wallet vs Multi-Wallet Airdrop Strategy: Detection Risk
URL: https://altcoininvestor.com/how-many-wallets-for-airdrops/
Last updated: 2026-09-27T19:06:33.000Z
## The Allocation-Detection Tradeoff

Most major airdrops cap allocation per wallet. Single-wallet concentration keeps you safe from Sybil detection but limits your eligibility to one unit. Multi-wallet farming multiplies potential allocations by the number of addresses you run, but every additional wallet increases your detection surface exponentially.
The question is not whether protocols detect multi-wallet operations. They do. The question is where the detection threshold sits, what patterns trigger it, and whether the economics justify the risk.
Arbitrum identified 23.8% of initially eligible wallets as Sybil addresses in the Hop Protocol airdrop, disqualifying 10,253 wallets out of 43,058\. LayerZero, zkSync, and Starknet all ran retroactive cluster analysis before distributing tokens. The largest airdrops now allocate hundreds of millions of dollars, which creates sufficient budget and incentive to license professional detection tooling.
## How Protocols Identify Wallet Clusters
Detection begins with transaction sequencing. Protocols convert on-chain activity into per-wallet behavioral fingerprints, then measure similarity using Jaccard index scoring. Wallets with high similarity scores get fed into DBSCAN clustering algorithms, which surface groups of addresses exhibiting coordinated patterns.
The most reliable clustering heuristic on UTXO chains like Bitcoin is co-spend: two inputs spent in the same transaction prove common control. On Ethereum-style account chains, clustering relies on behavioral inference. Repeated funding between the same addresses, identical gas sponsors, same deployer contracts, and coordinated timing all signal shared control.
One detection system flagged addresses making more than 200 outgoing transfers, marked receivers from high-volume senders as suspicious, identified receivers with only one incoming transaction as potential Sybils, and analyzed subgraphs where receiving nodes comprised more than 90% of edges. That system identified 26.30% of wallets as bad receivers.
Transaction timing is a primary signal.
Copy-paste activity across multiple accounts breaks detection heuristics. If ten wallets interact with the same contract within a five-minute window, execute identical transaction sequences, and carry identical token balances, the pattern is machine-readable. Sudden wallet movements flag your addresses even if funding sources differ.
Protocols now use [behavioral analysis and wallet reputation scoring](https://nansen.ai/post/blockchain-transparency-unmasking-suspicious-crypto-wallets) to detect suspicious activity. Transaction count and wallet age are the most common hard filters. Contract interaction diversity and multi-month activity spread are the most common multipliers. Governance participation consistently boosts allocations when present.
### Funding Graph as the Primary Detection Vector
The funding graph is where most multi-wallet operations get caught. Address-clustering heuristics resolve multiple Ethereum addresses through deposit-address reuse and airdrop-claim patterns. First-funder provenance graphs trace where initial capital originated, and behavioral uniformity scoring detects coordinated operations that per-wallet detectors cannot reach.
If one wallet funds ten new addresses, and those ten addresses begin interacting with a protocol within 24 hours, the funding relationship is visible on-chain. If those ten wallets later send tokens back to a central address or to a centralized exchange deposit controlled by the same entity, the loop is closed.
Look at this pattern: Wallet A funds Wallets B through K with 0.1 ETH each on block 18,450,221\. Within six hours, all ten wallets bridge to Arbitrum. Within 24 hours, all ten wallets swap ETH for USDC on the same DEX. Within 48 hours, all ten wallets deposit USDC into the same lending protocol. Three months later, all ten wallets claim an airdrop and send tokens to the same CEX deposit address.
That sequence is visible, traceable, and flaggable at every step. The blockchain shows you what people actually do, not what they say.
### Machine Learning Models Replace Rules-Based Clustering
Detection is moving beyond static rules. Machine learning models trained on labeled Sybil sets from previous airdrops now combine transaction graphs, timing distributions, gas fee patterns, and off-chain telemetry into a single risk score. These models detect patterns operators do not know they are producing.
LightGBM models handle complex feature interactions and capture non-linear relationships between on-chain activities. Histogram-based approaches and gradient-based one-side sampling identify the most informative features while minimizing computational overhead. The result is detection that scales with the size of the airdrop budget.
More distributions now weight eligibility on Gitcoin Passport-style scoring, biometric identity systems, and social graph proofs. These systems shift the contest toward verifiable uniqueness, which multi-wallet operations cannot manufacture cheaply.
## Cluster Size and Detection Thresholds

Arbitrum identifies clusters of more than 20 wallets as suspicious, with detection risk escalating as cluster size increases. Clusters of two to three addresses are considered difficult to detect by anti-Sybil algorithms, but the threshold is not binary.
Two wallets funded from the same source, executing identical activity sequences, and returning funds to a common address will trigger detection if the behavioral match is tight enough. Twenty wallets with varied funding sources, staggered activity timing, and diverse interaction patterns may evade detection if operational security is high.
The economics break down at scale. Running 100 wallets costs $1,500 to $2,000 per month when accounting for proxies, virtual private servers, and gas fees. Cheaper setups increase detection risk. Mobile proxies from real carrier networks reduce Sybil detection compared to datacenter IPs. When 45 wallet sessions ran on AWS IPs, 32 got flagged within 72 hours by a single DeFi protocol.
Capital efficiency favors smaller clusters. Two to five wallets can multiply allocation potential without requiring enterprise-grade operational security. Ten to twenty wallets demand stricter separation of funding sources, activity timing, and contract interactions. Beyond fifty wallets, you are running an operation that requires professional infrastructure and accepts the risk of total disqualification.
### False Positive Risk Is Low
The Ghost Clusters study tested major analytics providers against ground-truth records from seized services. Accuracy ranged from 25% for a mixer to 95% for a darknet marketplace. False positive rates were below 0.5%, meaning analytics tools rarely misattribute an address but frequently miss addresses that belong to an entity.
A legitimate user incorrectly clustered with a high-risk entity may find accounts frozen, but this is rare. The real risk is being correctly identified. Wallets matching abnormally high activity frequency coinciding with large influxes of Sybil activity may be tagged and removed from eligibility weeks or months after the snapshot.
## What Single-Wallet Concentration Looks Like
Single-wallet strategies avoid detection risk entirely but cap allocation to the protocol's per-wallet maximum. If a protocol allocates 500 tokens per eligible address, you receive 500 tokens. If you meet eligibility thresholds with margin, you face no disqualification risk.
This strategy works when airdrop allocations are large enough to justify months of activity on one address. Arbitrum distributed $1.5 billion to 625,000 wallets. LayerZero distributed $900 million. Jito distributed $165 million. Ethena distributed $450 million. A single allocation from any of these distributions justified the gas and time cost for many participants.
Single-wallet concentration also simplifies operational security. You do not need proxies, you do not need to manage funding graphs, and you do not need to stagger activity timing. You interact with protocols as a normal user, which is what eligibility criteria measure.
The downside is opportunity cost. If you farm ten protocols over twelve months and three distribute airdrops, a single-wallet strategy captures three allocations. A ten-wallet strategy captures thirty allocations if you evade detection, or zero allocations if you trigger cluster analysis.
### Transaction Count and Diversity as Multipliers
Single-wallet strategies benefit from transaction diversity. Protocols reward users who interact with multiple contracts, participate in governance, hold tokens for extended periods, and demonstrate usage depth rather than breadth.
Retroactive distributions increasingly evaluate activity over twelve months or more without announcing criteria in advance. This penalizes short bursts of manufactured activity and rewards genuine long-term usage. If you are running one wallet, you can afford to participate in governance votes, provide liquidity across multiple pools, and engage with ecosystem dApps without worrying about replicating that behavior across twenty addresses.
## What Multi-Wallet Farming Looks Like
Multi-wallet farming multiplies allocation potential by the number of addresses you control. If you run ten wallets that each meet eligibility criteria, you receive ten allocations instead of one. The capital requirement scales linearly, but the detection risk scales exponentially.
The operational model requires strict separation. Each wallet needs independent funding that does not trace back to a common source. Each wallet needs a unique IP address, ideally from mobile proxies on real carrier networks. Each wallet needs staggered activity timing to avoid synchronized transaction patterns. Each wallet needs varied contract interactions to avoid copy-paste behavioral fingerprints.
This is not a casual operation. Running twenty wallets with operational security sufficient to evade detection requires planning, tooling, and ongoing cost discipline. Gas fees alone can exceed $500 per wallet over a twelve-month farming cycle on Ethereum mainnet, though Layer 2 protocols reduce this cost substantially.
### When Multi-Wallet Economics Work
The math works when expected allocation value exceeds operational cost by a sufficient margin. If you estimate a 40% probability that a protocol distributes an airdrop worth $2,000 per wallet, and you run ten wallets at $200 per wallet in operational cost, your expected value is $8,000 minus $2,000 in cost, or $6,000\. If detection risk is 20%, your risk-adjusted expected value is $4,800.
That calculation assumes you can evade detection. If cluster analysis disqualifies your entire operation, your return is negative $2,000.
The risk-reward equation favors protocols with large total distributions and per-wallet caps low enough that single-wallet strategies leave money on the table. It also favors protocols with weak Sybil detection, which is increasingly rare among well-funded projects.
## Detection Evasion Techniques and Their Limits
Operators attempt to evade detection by separating funding sources, staggering transaction timing, varying contract interaction sequences, and using unique IP addresses for each wallet. These techniques reduce detection probability but do not eliminate it.
Funding source separation requires acquiring initial capital for each wallet from unrelated addresses. Centralized exchange withdrawals to multiple addresses still trace back to a single KYC'd account. Peer-to-peer purchases from different counterparties create separation but add operational friction and cost.
Activity timing separation requires each wallet to interact with protocols on different days, at different times, with different transaction counts. This reduces synchronized behavioral fingerprints but extends the operational timeline and increases the chance of missing eligibility windows.
Contract interaction diversity requires each wallet to engage with different subsets of ecosystem dApps, different liquidity pools, and different governance proposals. This makes behavioral clustering harder but requires more capital and more time per wallet.
None of these techniques defeat on-chain analysis when combined with off-chain data. If all ten wallets eventually send airdrop tokens to the same centralized exchange deposit address, the cluster is resolved retroactively. If IP logs from a protocol's front-end show the same session identifier across multiple wallet addresses, the cluster is visible even if on-chain behavior differs.
### Off-Chain Signals Close the Loop
Blockchain data alone is insufficient for many detection systems. Behavioral fingerprinting reveals transaction patterns, user habits, and sophistication levels that pure on-chain analysis misses. Wallet intelligence platforms now flag bot and farmer wallets for exclusion from incentive programs.
Identity verification systems like Proof of Humanity and BrightID gate major airdrops. Social graph proofs require demonstrated on-chain relationships with other verified humans. These systems make multi-wallet farming prohibitively expensive unless you can source unique biometric identities and social graph histories for each address.
## What to Watch On-Chain Before the Next Airdrop
If you are farming airdrops, monitor your own wallets for detection signals. Check whether your addresses appear in public Sybil lists published by previous airdrop projects. Search your addresses on Arkham and Nansen to see if analytics platforms have labeled them as part of a cluster.
Review your funding graph. Trace where initial capital came from and whether it connects to other addresses you control. Check whether you have ever sent tokens from multiple farming wallets to the same centralized exchange deposit address, which creates a permanent on-chain link.
Monitor your activity timing. If you are running multiple wallets, check whether transaction timestamps cluster within narrow windows. Protocols can query this data trivially using block explorers and Dune Analytics.
Evaluate your contract interaction diversity. If all your wallets interact with the same three protocols in the same sequence, the behavioral fingerprint is strong. If your wallets engage with different subsets of the ecosystem, the clustering signal is weaker.
For further guidance on maximizing airdrop eligibility without triggering detection, see [How To Earn Crypto Airdrops (Without Getting Scammed)](https://altcoininvestor.com/how-to-earn-crypto-airdrops/).
## Common Failure Modes
The most common failure is assuming detection happens at the snapshot. It does not. Protocols take snapshots of eligible activity, then run Sybil analysis weeks or months later. Wallets that appeared eligible on snapshot day get disqualified retroactively when cluster analysis completes.
The second most common failure is underestimating the visibility of funding graphs. Operators assume that if on-chain activity looks organic, funding sources do not matter. They do. First-funder provenance graphs resolve clusters even when individual wallet behavior differs.
The third failure is using centralized exchange withdrawals as a funding source. Withdrawing to ten fresh addresses from one Coinbase account creates a visible spoke pattern. Those ten addresses are clustered from inception, and every downstream transaction inherits that relationship.
The fourth failure is claiming airdrops to the same destination. If you farm ten wallets through a six-month cycle with perfect separation, then send all ten airdrop allocations to the same CEX deposit address, the entire operation is retroactively clustered. Some protocols revoke tokens after distribution if post-claim behavior reveals Sybil patterns.
## Cost-Benefit Reality Check
Multi-wallet farming at scale requires $1,500 to $2,000 per month in infrastructure for 100 wallets. That cost buys mobile proxies, virtual private servers, and gas fees on a protocol with reasonable transaction costs. Ethereum mainnet farming costs more. Solana and Layer 2 farming costs less.
At that cost, you need airdrop allocations to exceed $150 to $200 per wallet just to break even. If a protocol distributes $500 per wallet and you run 100 wallets with zero detection, your gross return is $50,000\. Subtract $18,000 to $24,000 in annual operational cost, and your net is $26,000 to $32,000.
That return assumes zero detection and 100% hit rate on airdrop selection, both of which are unrealistic. If detection disqualifies 30% of your wallets, your gross return drops to $35,000\. If only 50% of protocols you farm actually distribute tokens, your effective cost doubles.
The math works for professional operations with access to cheap infrastructure, scripting automation, and portfolio diversification across dozens of protocols. For individual farmers, single-wallet concentration or small clusters of two to five wallets often deliver better risk-adjusted returns.
## Choosing Your Strategy
If you have limited capital and limited time, single-wallet concentration maximizes allocation per dollar of gas spent and eliminates detection risk. You focus on protocols with large per-wallet allocations and long eligibility windows. You interact as a genuine user, which is what airdrops are designed to reward.
If you have operational capacity and willingness to accept detection risk, small clusters of two to five wallets multiply allocation potential without requiring enterprise infrastructure. You separate funding sources, stagger activity timing, and vary contract interactions enough to evade basic clustering algorithms.
If you are running 20 to 100 wallets, you are operating at a scale where detection evasion requires professional tooling, strict operational security, and acceptance that one mistake can disqualify your entire operation. The returns can justify the cost, but only if your hit rate and evasion rate are both high.
For wallet setup and operational security considerations, see [Your First Crypto Wallet: Custodial Or Self-Custody?](https://altcoininvestor.com/custodial-vs-non-custodial-wallet/) and [Which Software Wallet For Earning, Not Just Holding](https://altcoininvestor.com/best-crypto-wallet-for-defi/).
## The Takeaway
You have just reviewed detection thresholds ranging from 2-wallet clusters to 100-wallet operations, and the behavioral fingerprints protocols use to identify them. Those thresholds will tighten as machine learning models improve and off-chain telemetry becomes standard. The wallets you run today leave a permanent on-chain record that future airdrops will analyze retroactively.
## Frequently Asked Questions
### How many wallets can I use for airdrop farming before triggering Sybil detection?
Clusters of two to three wallets are difficult for algorithms to detect, but detection risk escalates as cluster size increases. Arbitrum flags clusters exceeding 20 wallets as suspicious. Detection depends more on behavioral patterns than raw wallet count. If funding sources, transaction timing, and contract interactions are identical across wallets, even small clusters trigger detection. Larger clusters require professional operational security, including independent funding sources, staggered activity timing, mobile proxies, and varied contract interactions to evade analysis.
### What on-chain patterns do protocols use to identify multi-wallet operations?
Protocols convert wallet activity into behavioral fingerprints using transaction sequencing and Jaccard similarity scoring, then apply DBSCAN clustering algorithms. Primary detection signals include funding graphs showing common sources, synchronized transaction timing across addresses, identical contract interaction sequences, and addresses returning funds to a common destination. Machine learning models now detect non-linear behavioral patterns that rules-based systems miss. Off-chain signals like IP addresses and CEX deposit clustering close gaps that on-chain analysis alone cannot resolve.
### Is single-wallet airdrop farming more profitable than running multiple wallets?
Single-wallet strategies eliminate detection risk and operational overhead but cap allocation to one unit per airdrop. Multi-wallet farming multiplies allocations by wallet count but adds $15 to $20 per wallet per month in infrastructure costs and carries detection risk that can disqualify entire operations. For most individual farmers, single-wallet concentration or small clusters of two to five wallets deliver better risk-adjusted returns than large-scale operations requiring professional infrastructure and accepting 20% to 30% detection rates.
### Can I avoid detection by using different funding sources for each wallet?
Independent funding sources reduce detection probability but do not eliminate it. If you withdraw from one centralized exchange account to fund multiple wallets, the spoke pattern is visible on-chain and those addresses are clustered from inception. Peer-to-peer purchases from different counterparties create better separation but add cost and friction. Detection systems combine funding graph analysis with transaction timing, behavioral fingerprints, and off-chain telemetry. If you eventually send airdrop tokens from multiple wallets to the same CEX deposit, the cluster resolves retroactively.
### Do protocols disqualify wallets immediately or retroactively after airdrop snapshots?
Most protocols take eligibility snapshots first, then run Sybil detection analysis weeks or months later before token distribution. Wallets appearing eligible on snapshot day get disqualified retroactively when cluster analysis completes. Some protocols revoke tokens after distribution if post-claim behavior reveals coordinated patterns, such as multiple wallets sending allocations to the same destination address. This means detection risk persists through the entire claim and withdrawal process, not just the farming period.
Tool mentioned above
Ledger
Ledger devices display the full transaction on their own screen before you approve it, which is what stops an approval exploit at the point it matters.
[See Ledger devices](https://shop.ledger.com/?r=90612ff43561)
We may earn a commission if you sign up through this link, at no cost to you. It does not change what gets recommended.
The Weekly Yield Report
You have just examined cluster thresholds from two wallets to one hundred and the patterns that expose them. Those detection models will improve every quarter, and your on-chain history is permanent.
Every Thursday: where crypto yield actually is - stablecoins, liquid staking and DeFi lending, with the risk named next to the rate and what changed since last week.
[Get it free every Thursday](#/portal/signup)
Free. No trade calls, no allocations, no hype. Unsubscribe in one click.
### What To Ignore: The Signals That Look Like Problems
URL: https://altcoininvestor.com/defi-false-alarm-signals/
Last updated: 2026-09-27T17:04:12.000Z
## The Question: What Should You Ignore?
Anyone can build a list of things to worry about. The harder discipline, and the one that preserves more capital, is knowing what to dismiss. Every week in DeFi you will encounter signals that look alarming and are not. APY numbers that drift with utilization. TVL drops that mirror the broader market. Governance proposals that never pass. Audit findings already remediated. Social media panic with no on-chain correlate. Each of these will appear, at first glance, like a reason to exit a position. Each will cost you fees, gas, tax events, and missed yield if you react.
The income mechanism here is straightforward. Not exiting sound positions on noise allows you to continue earning yield in protocols that are functioning exactly as designed. The alternative is expensive. A single false-alarm exit from a stablecoin vault paying 3.35% APY costs you the spread on entry and exit, gas fees on both transactions, a taxable event if you are in profit, and the opportunity cost of whatever yield you would have earned while you were out. If the APY drift that triggered your exit was routine utilization mechanics rather than structural risk, you have paid for nothing.
This article names the five categories of false alarm that cost the most capital, explains the mechanism behind each, and tells you how to distinguish noise from the signals that actually matter. Where the prior article on [stablecoin depeg warning signs](https://altcoininvestor.com/stablecoin-depeg-warning-signs/) focused on what to watch, this one focuses on what to ignore.
## APY Drift With Utilization: Mechanical, Not Alarming

Lending protocol APYs respond to utilization. When borrow demand is high relative to the supply of loanable assets, rates rise. When capital floods in chasing that higher rate, utilization drops and the APY falls. This is not a bug. It is the interest rate curve functioning as designed. Kamino's lending reserves, Morpho's curated vaults, and Aave's markets all exhibit this behavior. A protocol showing 6.56% borrow APY one week and 4.80% the next is not breaking down. It is responding to the supply of capital provided by depositors who saw the higher rate and moved funds.
The mechanism works like this. Suppose a Morpho vault is offering 5.2% APY on USDC at 78% utilization. That rate is visible on [DeFi yield aggregators](https://altcoininvestor.com/best-defi-protocols/), and it attracts depositors. As new USDC flows into the vault, total liquidity rises but borrow demand remains constant. Utilization drops to 62%, and the APY adjusts downward to 3.8%. Nothing has broken. The protocol's interest rate model is doing exactly what it was built to do, which is to balance supply and demand for borrowable assets. The higher rate attracted the capital needed to meet borrowing demand. The lower rate reflects the new equilibrium.
What you should ignore: APY dropping 1-2 percentage points over a period of days or weeks when utilization is also falling. What you should investigate: APY spiking to 15% or 20% with utilization at 95% or higher, which indicates liquidity strain and possible withdrawal constraints. The former is routine. The latter is the precondition for the kind of liquidity freeze that turns yield into trapped capital.
The way to verify this is to compare the current APY and utilization rate against the protocol's published interest rate curve. Most lending protocols display this curve in their documentation or on their analytics dashboards. If the current rate sits on the curve as expected given the utilization level, the drift is mechanical. If the rate has decoupled from the curve, or if utilization is pinned at the ceiling while APY spikes, you have a structural problem worth investigating.
One note of caution from European banking history. In 2011 and 2012, Greek and Portuguese sovereign debt was offering yields meaningfully above German bunds. Those higher yields were not income opportunities. They were the market pricing in the probability of default. The yield was compensation for risk that ultimately materialized. DeFi APYs work the same way. A stablecoin vault offering 18% when comparable instruments are paying 3-5% is not a gift. It is either subsidized by token emissions that will dilute your position, or it is compensation for a structural risk the market has already identified. APY drift within a normal range is noise. APY sitting far above comparable instruments is a signal.
## TVL Moving With The Broader Market: Correlation, Not Risk

Total Value Locked in DeFi protocols fell 39% year-to-date in 2026, from roughly $115 billion in January to around $70 billion by mid-year. That sounds catastrophic until you compare it to the broader crypto market, which saw Bitcoin correct sharply following its October 2025 peak above $122,000\. DeFi TVL tracks asset prices because most of the value locked in these protocols is denominated in ETH, BTC, and other crypto assets. When those assets fall 30-40% in dollar terms, TVL falls by a similar amount even if the actual quantity of assets deposited has not changed.
This is a critical distinction. TVL measures the dollar value of assets locked in a protocol, not the number of users, the volume of transactions, or the health of the underlying mechanism. A protocol can lose 35% of its TVL in a market downturn and still be functioning normally if the decline is driven by falling asset prices rather than user withdrawals. The signal to watch is not TVL in isolation. It is TVL relative to the market. If Bitcoin falls 25% and a DeFi protocol's TVL falls 26%, that is correlation. If Bitcoin falls 10% and the protocol's TVL falls 50%, that is protocol-specific risk.
The data from early 2026 illustrates this clearly. According to [CoinDesk's analysis](https://www.coindesk.com/business/2026/02/03/defi-s-quiet-strength-tvl-holds-as-market-selloff-tests-traders), DeFi TVL fell just 12% during one specific drawdown while the broader market declined more sharply. More telling: the amount of ETH deployed in DeFi actually rose during that period, with 1.6 million ETH added in a single week. The dollar-denominated TVL fell because ETH's price fell, but the quantity of ETH locked in protocols increased. That is a sign of confidence, not distress. Yield farmers were adding capital even as TVL numbers appeared to decline.
What you should ignore: TVL dropping 5-15% during a broader market correction, particularly if the decline mirrors Bitcoin's or Ethereum's price movement. What you should investigate: TVL dropping 40-60% with no corresponding market decline, or TVL falling while comparable protocols show stable or rising deposits. The former is macro. The latter is protocol-specific flight.
One further point. Liquidation risk during these periods remained muted. Only $53 million in positions were near liquidation thresholds during the early 2026 drawdown, a sign of stronger collateralization and more conservative borrowing behavior compared to prior cycles. That context matters. A TVL decline accompanied by mass liquidations and collateral stress is different from a TVL decline driven purely by falling asset prices. The first indicates over-leverage and structural fragility. The second is routine volatility in a market where most assets are denominated in volatile tokens.
## Governance Proposals That Never Pass: Usually Noise
Most governance proposals fail. Across 10,190 executed proposals analyzed in recent research, success rates varied by stage: 71.4% at the temperature check phase, 85.7% at the consensus check, and 76.9% for on-chain votes. Proposals fail because they do not attract enough voter interest, because they are contentious, or because they are submitted by participants testing governance mechanisms without serious intent. A failed proposal is not a governance attack. It is the system working.
The dangerous signal is not a proposal that fails. It is a proposal that succeeds with suspiciously low participation and no multisig oversight. Between June and September 2026, seven governance takeovers extracted $25.1 million from DeFi protocols. The two largest incidents were BonkDAO ($20 million, July 6) and Term Finance ($8.5 million, August 24). Neither required a code exploit. The attack vector in each case was identical: acquire enough tokens to meet quorum, submit a proposal that redirects treasury assets or changes protocol parameters, wait for the voting period to close with minimal scrutiny, and execute.
In the BonkDAO case, only seven wallet addresses voted during the six-day voting window. That is not governance. That is a quorum threshold so low that a small cartel could pass any proposal it wanted. The Term Finance incident followed the same pattern. Low quorum, minimal participation, rapid execution, and no timelock or multisig step that would have allowed the broader community to intervene. The proposals that passed were not voted down because not enough participants were paying attention.
What you should ignore: Governance proposals that are submitted, debated, and rejected through normal voting processes. These are signs of an active governance community capable of evaluating and dismissing bad ideas. What you should investigate: Proposals that pass with participation below 5% of total token supply, proposals that execute immediately with no timelock delay, and protocols where governance decisions are made without any multisig or guardian oversight. Those conditions indicate a governance mechanism vulnerable to capture.
The distinction matters because [DAO governance](https://altcoininvestor.com/what-is-a-dao/) manages $25 billion in treasuries. When a proposal fails, it typically costs you nothing. When a malicious proposal succeeds, it can drain an entire treasury in minutes. The research from [governance attack analysis in 2026](https://github.com/Ricosworks1/governance-research-reports/releases/tag/governance-attacks-defense-tradeoffs-20260914) makes the mechanics clear: the attack surface is not the proposal itself but the combination of low quorum, short voting periods, and no execution delay. If a protocol's governance allows a proposal to pass and execute within 72 hours with only a handful of voters, that protocol is at risk regardless of how many other proposals have failed.
## Audit Findings Already Remediated: Fixed Means Fixed
Published audit reports with findings marked as "remediated" indicate the issue has been identified, fixed, re-tested, and validated by the auditor. The audit process in 2026 follows a standard sequence: specification review, automated scanning, manual code inspection, formal verification where applicable, fuzz testing to identify edge cases, and documentation of findings with remediation recommendations. After the protocol team addresses the findings, the auditor re-reviews the code and updates the report to reflect which issues have been resolved.
A remediated finding is not a red flag. It is evidence the protocol's development process includes external review and iterative improvement. Every non-trivial smart contract will have findings in its initial audit. The question is not whether findings exist but whether they are fixed before deployment, and whether the same findings recur in subsequent audits. A protocol with one medium-severity finding in its first audit, remediated and confirmed by the auditor, is in a different category from a protocol that has the same critical finding appear in three consecutive audits. The latter indicates a governance or process failure, not just a code bug.
What you should ignore: Audit reports with multiple findings, all marked as remediated and validated in the final version of the report. This is the normal output of a functioning audit process. What you should investigate: Repeat findings across multiple audit cycles, findings marked as "acknowledged" but not fixed, and protocols that deploy contracts before the audit is complete or without addressing critical findings. The first category is noise. The second and third are structural risks.
The timeline matters. In 2025, remediation typically required two to three weeks for the development team to implement fixes, followed by re-review from the auditor. By 2026, AI-assisted tooling has compressed that cycle for certain classes of bugs, allowing regression tests to run immediately after each fix. The key point is that the auditor validates the remediation before signing off. A finding listed as remediated in the final report has been re-tested. A finding listed as acknowledged has not been fixed, often because the development team disputes the severity or considers the risk acceptable. Those are the ones worth reading closely.
One note from traditional finance audit practices. Under Sarbanes-Oxley controls, a remediated internal control deficiency must be operative for a full reporting cycle before an auditor can conclude the issue is resolved. DeFi does not operate under SOX, but the principle is sound. A fix implemented days before an exploit is less credible than a fix that has been live in production for months. If you are reviewing an audit report, check not only whether findings were remediated but when the fixes were deployed and how long the updated code has been running under real conditions.
## Social Media Panic With No On-Chain Correlate: Retail Noise
Social media sentiment diverges from on-chain behavior constantly. Retail traders, who are the dominant voice on Twitter and Telegram, tend to overreact to news, leading to sharp swings in sentiment that do not reflect the behavior of large holders or institutional participants. When social media is flooded with panic about a protocol or token but on-chain data shows no corresponding outflows, no liquidation spike, no governance anomalies, and no drop in active addresses, the social sentiment is noise.
The mechanism producing this divergence is straightforward. Retail participants are loud, emotional, and driven by recent price action and viral narratives. Institutional actors and experienced DeFi participants move more slowly, rely on on-chain data and protocol fundamentals, and do not broadcast their intentions on social platforms. When you see widespread fear on Twitter but whale addresses are quietly accumulating, or when social feeds declare a protocol "dead" while TVL remains stable and governance proposals continue to execute normally, the mismatch is telling you that retail sentiment has decoupled from the behavior of informed participants.
What you should ignore: Social media panic that is not accompanied by on-chain evidence of distress. Specifically, if you see fearful rhetoric on Twitter or Discord but the following conditions hold, the panic is unfounded: TVL stable or growing, liquidation risk low, large wallet addresses holding or accumulating, governance proposals executing as scheduled, and no spike in withdrawal transactions. What you should investigate: Social media panic that is confirmed by on-chain data, particularly sudden spikes in withdrawal volume, mass liquidations, or governance proposals being rushed through with minimal scrutiny.
The tools for checking this are accessible. On-chain analytics platforms like Nansen and Santiment provide real-time data on wallet behavior, TVL, transaction volume, and liquidation risk. If social sentiment is screaming distress but those metrics are stable, you have a false alarm. If social sentiment is calm but on-chain data shows capital flight and collateral stress, you have a real problem that most participants have not yet noticed. The latter is rare but valuable. The former is common and distracting.
One edge case worth noting. A single large exploit at a competing protocol can trigger social panic across an entire category, even if the affected protocol has no structural similarities to the one you are using. The Kelp DAO incident in 2026, which resulted in a $292 million loss, triggered withdrawals and sentiment deterioration across multiple liquid staking and restaking protocols that had nothing to do with Kelp's specific vulnerability. If you had exited a sound position in a different protocol based solely on that social panic, you would have paid exit fees, gas, and tax consequences for no reason. The signal to watch is whether the exploit's root cause applies to the protocol you are using. If it does not, the social contagion is noise.
## When It Matters, When It Doesn't
The signals listed above are false alarms most of the time. That does not mean they are always false alarms. APY drift is noise when it tracks utilization, but a signal when it spikes with utilization pinned at 95%. TVL decline is noise when it mirrors Bitcoin's price, but a signal when it falls 50% with no macro correlation. Failed governance proposals are noise when they reflect normal voting processes, but successful proposals with 3% participation are a structural risk. Remediated audit findings are noise when validated by the auditor, but repeat findings across three cycles indicate a process failure. Social media panic is noise when on-chain data is stable, but on-chain distress with calm social sentiment is a warning most participants have missed.
The broader point is this. False alarms cost you money. Every time you exit a position on noise, you incur fees, gas, a taxable event if applicable, and the opportunity cost of forgone yield. If you are holding a stablecoin vault paying 3.35% APY and you exit because the rate drifted down from 4.1% over two weeks as utilization normalized, you have just paid for nothing. The rate moved because the protocol is working. Your exit was expensive and unnecessary.
The alternative is to develop a checklist. When you encounter a signal that looks alarming, verify whether it is accompanied by corroborating evidence. Is the APY drift tracking utilization or decoupled from it? Is the TVL drop in line with the broader market or isolated to this protocol? Did the governance proposal fail through normal voting or pass with suspect participation? Is the audit finding remediated and validated, or acknowledged and ignored? Is the social panic confirmed by on-chain data or contradicted by it? Those questions take minutes to answer and will save you from expensive mistakes.
## The Takeaway
Most signals that look alarming in DeFi are mechanical responses to changing market conditions, not structural failures. APY drift with utilization, TVL declines that track Bitcoin's price, governance proposals that fail to pass, audit findings marked as remediated, and social media panic with no on-chain correlate are all routine. Exiting positions on these signals costs fees, gas, tax events, and missed yield. The discipline that preserves capital is not reacting to every fluctuation but verifying whether the signal is accompanied by evidence of actual distress. When APY drops because capital flowed in, when TVL falls because ETH's price fell, when a governance proposal is voted down, when an audit finding is fixed and validated, and when social panic contradicts on-chain behavior, the correct response is to do nothing. The income mechanism is continuing to earn in protocols that are functioning as designed while others exit on noise. That spread, compounded over months, is the return to filtering signal from false alarm.
## Frequently Asked Questions
### Is APY dropping always a red flag in DeFi lending protocols?
No. APY drift is normal when it tracks utilization. High rates attract capital, which lowers utilization and reduces APY. This is the interest rate curve functioning as designed. The red flag is APY spiking to 15-20% with utilization pinned above 95%, which signals liquidity strain. Compare current APY against the protocol's published interest rate curve at the given utilization level to verify whether the movement is mechanical or anomalous.
### What does TVL decline actually tell me about protocol health?
TVL measures dollar value of locked assets, not protocol health. A 30% TVL drop during a 30% Bitcoin correction is correlation, not risk. The signal to watch is TVL falling 40-60% with no corresponding market decline, or TVL dropping while comparable protocols remain stable. Also check whether the quantity of deposited assets is falling or just their dollar value. Rising ETH deposits with falling TVL indicates price-driven decline, not capital flight.
### Should I worry when governance proposals fail to pass?
No. Most proposals fail through normal voting processes, with success rates around 71-77% depending on governance stage. Failed proposals indicate an active community capable of rejecting bad ideas. The dangerous signal is proposals that pass with under 5% participation, no timelock delay, and no multisig oversight. Those conditions enabled seven governance attacks totaling $25.1 million in 2026, including the BonkDAO and Term Finance incidents.
### How do I know if an audit finding is actually resolved?
Check the final audit report for findings marked 'remediated' with auditor validation, not just 'acknowledged.' Remediated findings have been fixed, re-tested, and confirmed. The red flag is repeat findings across multiple audit cycles, which indicates a process failure rather than a code bug. Also verify when the fix was deployed. A remediation implemented days before launch is less credible than one running in production for months under real conditions.
### When should I trust social media panic about a DeFi protocol?
Only when on-chain data confirms it. If Twitter shows fear but TVL is stable, liquidation risk is low, whale addresses are holding, and governance is executing normally, the panic is retail noise. Institutional participants and experienced holders move based on on-chain behavior, not social sentiment. The valuable but rare signal is on-chain distress with calm social media, indicating informed participants are exiting before the crowd notices. Use Nansen or Santiment to verify sentiment against blockchain data.
The Weekly Yield Report
You now have five categories of false alarm that cost fees, gas, and missed yield. Those conditions will change, but the discipline of filtering noise from signal will not.
Every Thursday: where crypto yield actually is - stablecoins, liquid staking and DeFi lending, with the risk named next to the rate and what changed since last week.
[Get it free every Thursday](#/portal/signup)
Free. No trade calls, no allocations, no hype. Unsubscribe in one click.
### How To Evaluate An Altcoin Before You Buy It
URL: https://altcoininvestor.com/how-to-evaluate-altcoin-investment/
Last updated: 2026-09-27T16:06:01.000Z
## What You Will Accomplish
Most altcoins fail because they were never built to survive a full market cycle. A catchy name, an active social media account, and a rising price chart can create the impression of momentum without any of the fundamentals behind it.
By the end of this guide, you will have a repeatable framework for evaluating altcoins before you commit capital. You will know how to analyze tokenomics, verify team credentials, distinguish real usage from marketing metrics, and complete a specific due diligence checklist that reduces losses and improves winners.
This process takes 30 to 90 minutes per token. It is not fast. It is effective.
### Prerequisites
You need access to the project's whitepaper, tokenomics documentation, and blockchain explorer for the network the token operates on. [Your first crypto purchase should be under $100](https://altcoininvestor.com/how-to-buy-crypto-small-amount/) while you build the evaluation muscle.
You should understand basic blockchain concepts like circulating supply, market cap, and wallet addresses. If those terms are unfamiliar, read the whitepaper section on token mechanics twice before moving forward.
## Step 1: Analyze Tokenomics and Supply Schedule

Tokenomics determine whether a project can sustain price appreciation or whether structural dilution will erode your position regardless of adoption.
### Check Circulating vs Max Supply Gap
Open CoinMarketCap or CoinGecko and compare circulating supply to maximum supply. If less than 50% of the token's supply is circulating, dilution is still ahead. AltLayer (ALT) has a circulating supply of approximately 6.4 billion tokens, which represents 63.6-71.3% of the 10 billion maximum supply as of September 2026\. That leaves 2.87 billion tokens (28.7%) still locked in the vesting schedule.
A large gap between circulating and total supply means most of the supply has not reached the market yet. Every token that unlocks increases sell pressure unless demand grows at the same pace.
### Calculate the Inflation Rate
Use this formula: (New Supply per Year / Current Circulating Supply) × 100.
If a token mints 50 million new tokens per year and circulating supply is 500 million, the inflation rate is 10%. That means the token's price must appreciate 10% annually just to maintain the same market cap.
Above 15-20% annually in year one is a yellow flag. Sustained inflation above 10% beyond year two is red.
Some networks run at 15-19% annual inflation with emission outpacing consumption by nearly 2:1\. Price decline in that scenario is not cyclical, it is structural.
### Map the Vesting Schedule
Serious projects publish their vesting schedules publicly. If you cannot find this information, that is a red flag.
Quality projects enforce 12-month cliffs followed by 24-48 month linear vesting. A cliff unlock releases a large block of tokens on one date, usually after an initial lock period. Linear vesting divides an allocation into smaller releases on a fixed schedule, most often monthly, and distributes them over several years.
Around 90% of token unlock events produce negative price pressure, with most of the decline occurring during the 30 days before the unlock. Larger unlocks relative to market cap generate stronger selling pressure. Unlocks going to investors and insiders are considered higher-risk for price impact than unlocks distributed to broader community participants.
Hyperliquid released approximately $305 million in vested HYPE tokens in March 2026, directed primarily to core contributors. That is a cliff unlock that creates concentrated sell pressure within a narrow window.
Use [CoinGecko's on-chain analysis resources](https://www.coingecko.com/learn/on-chain-analysis) or Tokenomist to map unlock dates, amounts, and recipients. Mark any unlock that exceeds 10% of circulating supply within 90 days.
### Review Allocation Distribution
Healthy token allocation mechanisms balance community (30-50%), team (15-20%), and investor (20-30%) distributions through strategic vesting schedules.
AltLayer's allocation includes Treasury at 21.50%, Protocol Development at 20.00%, Investors at 18.50%, Ecosystem and Community at 15.00%, Team at 15.00%, Advisors at 5.00%, and Binance Launchpool at 5.00%.
Team or early investors holding over 30% with short or no vesting is a warning sign. If insiders can exit quickly, they will.
### Check FDV vs Market Cap Ratio
Fully diluted valuation (FDV) reflects the market value if all tokens were unlocked. AltLayer's FDV is $59,816,600, which estimates long-term dilution risk.
If the FDV/MC ratio is above 5×, the current market cap is pricing in an optimistic future that requires sustained demand growth to support unlocking supply. Anything above 5× means you are buying early into a token that will face years of dilution pressure.
## Step 2: Verify Team and Treasury Credentials
A token's design matters less than the team's ability to execute it over multiple years.
### Read the Whitepaper
Start with the whitepaper. Look for technical design clarity, utility definition, and realistic timelines. If the whitepaper uses vague language like "revolutionary technology" without specifying what the protocol does, that is a red flag.
Cross-check claims in the whitepaper against public repositories and third-party audits. If the whitepaper promises a novel consensus mechanism, verify that GitHub activity supports active development.
### Check Team Credentials and Track Record
Pseudonymous teams with verifiable build history present a different risk profile than anonymous teams with none. [Check GitHub commits, prior outcomes, and whether the team shipped a product before](https://altcoininvestor.com/how-to-research-crypto-team-background/) they launched this token.
Look for public LinkedIn profiles, prior project involvement, and whether team members have their real names attached to this venture. If the team is fully anonymous and the project holds significant treasury funds, that introduces custody risk.
### Assess GitHub Activity
Open the project's GitHub repository and review commit frequency, contributor count, and code quality. Active projects show consistent weekly commits from multiple contributors. Abandoned projects show months of inactivity or a single developer making sporadic updates.
If the repository is private or does not exist, the project is not serious about transparency.
### Review Community Discussions
Read community discussions on Discord, Telegram, and project-specific forums. Pay attention to how the team responds to technical questions and criticism. Teams that dismiss concerns or provide evasive answers are higher risk than teams that engage substantively.
Look for evidence of bot activity in social channels. Real communities show varied conversation topics and organic engagement patterns. Bot-driven communities show repetitive praise and identical phrasing across multiple accounts.
## Step 3: Distinguish Real Usage Metrics from Marketing Metrics
Marketing metrics create the appearance of traction. Real usage metrics prove it.
### Marketing Metrics to Discount
Twitter followers, partnership announcements, and Medium post view counts are marketing metrics. They measure awareness, not adoption. A project can buy Twitter followers and announce partnerships that amount to nothing more than a logo swap.
Partnership announcements deserve scrutiny. If the announcement does not specify what the partnership delivers (integrated liquidity, co-developed infrastructure, shared user base), it is marketing.
### Real Usage Metrics to Measure
On-chain analysis leverages multiple metrics: active addresses, transaction volume, supply distribution, total value locked, and fees generated in relation to price action.
Daily active addresses track the number of unique wallet addresses that send or receive at least one transaction over a set period. Most analysts use daily data smoothed with 7-day or 30-day averages. This is not a count of unique users because one person can control multiple wallets, but it provides directional insight into network participation.
Solana demonstrated consistent user engagement with TVL surpassing $4.9 billion during 2025\. Tensor (TNSR) exemplified exceptional network vitality during 2025 with active addresses surging 250%.
Daily active addresses, transaction count, fee revenue, and TVL are public on DeFiLlama and Artemis. Pull this data and compare it to price action over the same period.
### Interpret On-Chain Signal Patterns
Rising active addresses with rising price signals healthy demand. More participants are entering the network, and the trend has support from real usage.
Rising price with falling active addresses is a warning sign. Price is moving up, but fewer participants are involved. That pattern often precedes a reversal driven by a small number of large holders exiting.
Flat or declining active addresses with flat price suggests the network is not growing. Unless the project is pre-launch or in a consolidation phase, stagnant on-chain activity points to weak adoption.
### Separate Bot Activity from Real Transactions
One person can create multiple wallets, and some networks have bot activity inflating transaction counts. Active addresses should not be used alone but combined with other metrics like transaction count, fees, and volume.
Real transactions show varied intervals and amounts. Bots display identical frequency and volumes. If transaction data shows repetitive patterns with uniform timing and size, discount that activity.
### Check for Value Capture
Many tokens secure or govern a network without accruing fees from it. ETH captures value through gas burn (EIP-1559) and proof-of-stake yield. Other governance tokens vote on parameters but never see protocol revenue.
If the token does not capture value through fee burns, staking yield, or revenue sharing, ask what drives long-term demand beyond speculation. A token with no mechanism to return value to holders is a bet on narrative, not fundamentals.
## Step 4: Complete the Due Diligence Checklist
Run through this checklist before you commit capital. [A repeatable screening process for small-cap tokens covers market cap versus FDV, liquidity depth, contract verification, team history, and shipping track record](https://altcoininvestor.com/how-to-screen-low-cap-token/).
### Tokenomics and Supply
- Is circulating supply above 50% of maximum supply?
- Is annual inflation below 15% in year one and below 10% after year two?
- Are team and investor allocations below 30% combined with multi-year vesting?
- Are there any cliff unlocks exceeding 10% of circulating supply within 90 days?
- Is the FDV/MC ratio below 5×?
### Team and Transparency
- Is the team public or pseudonymous with verifiable history?
- Is the whitepaper specific about protocol mechanics and utility?
- Is the GitHub repository public with consistent commit activity?
- Has the project completed third-party security audits?
- Does the team respond substantively to technical criticism?
### On-Chain and Market Metrics
- Are daily active addresses rising or stable over the past 30 days?
- Is transaction volume growing in line with price?
- Does the token generate fees or capture protocol revenue?
- Is liquidity sufficient to support a position exit without 5%+ slippage?
- Are there any wallets holding more than 10% of circulating supply?
### Red Flags
If any of these conditions are present, reconsider the investment:
- FDV/MC ratio above 5×
- Team allocation above 25%
- Cliff unlock greater than 10% of circulating supply within 90 days
- No token burn mechanism
- Inflation rate above 10%
- No vesting for team tokens
- Single wallet holding more than 10% of circulating supply
- No public GitHub repository or months of inactivity
- Anonymous team with no shipping history
## Common Failure Modes and What They Look Like
### Supply Shock Without Demand Growth
When tokens unlock, supply grows. Unless demand grows at the same pace, the price falls. Projects that schedule large unlocks without corresponding adoption milestones create predictable sell pressure.
Monitor unlock calendars and compare upcoming releases to historical trading volume. If a 10% unlock is scheduled and average daily volume is 2% of that amount, expect downward pressure unless the project announces a major catalyst.
### Liquidity Constraints
Low liquidity creates a precarious environment where large sell orders trigger sharp price drops. Before you buy, test liquidity by simulating an exit at your target position size.
If selling 10% of your intended position would move the price by more than 5%, liquidity is insufficient.
### Bot Activity Masking Real Adoption
Projects incentivize on-chain activity through airdrops and gamified reward systems. Some of that activity is genuine, some is bot-driven.
Cross-check active addresses with fee revenue. If active addresses are rising but fee revenue is flat, users are not conducting economically meaningful transactions.
### Governance Token with No Value Capture
Governance tokens allow holders to vote on protocol parameters. That is useful for decentralization but not sufficient for value accrual.
If the token grants voting rights but does not capture fees, staking yield, or revenue share, long-term price appreciation depends entirely on speculation about future governance changes that might introduce value capture. That is a weak foundation.
## What to Do Next
After completing the checklist, you will have a clear risk profile for the token. If the project passes on tokenomics, team credentials, real usage metrics, and liquidity, it is a viable candidate for allocation.
[Write an exit condition before you buy](https://altcoininvestor.com/when-to-sell-low-cap-crypto/). Define the specific metrics that would invalidate your thesis: a supply unlock threshold, a drop in active addresses below a trailing average, or a liquidity decline that makes exit impractical.
If the reason to hold cannot be written as something that could be proven false, it is not a thesis.
Allocate position size based on risk. High-quality projects with transparent teams, sustainable tokenomics, and growing usage justify larger allocations. Speculative bets on early-stage projects with incomplete data should remain small.
Set calendar reminders to review unlock schedules, on-chain metrics, and GitHub activity every 30 days. Projects change. Teams leave, development stalls, or adoption accelerates faster than expected. Reevaluate continuously.
## The Takeaway
You now have a repeatable framework for evaluating altcoins before you commit capital. Tokenomics analysis prevents you from buying into structural dilution. Team and treasury verification reduces counterparty risk. Real usage metrics separate genuine adoption from marketing hype.
The checklist is not optional. Every item exists because that failure mode has cost investors capital in prior cycles.
Run the process on every token you consider. The projects that pass will still carry risk, but you will understand what that risk is and whether it fits your allocation strategy. [The framework for evaluating yield opportunities applies the same discipline to return sources and sustainability signals](https://altcoininvestor.com/how-to-evaluate-crypto-yield/).
The numbers matter more than the narrative. Measure them before you buy.
## Frequently Asked Questions
### What is the most important metric when evaluating an altcoin?
Tokenomics and supply schedule are the most important starting point. If a project has over 50% of its supply still locked, high inflation above 15% annually, or large cliff unlocks scheduled within 90 days, those structural factors will create sell pressure regardless of adoption. Check circulating supply versus maximum supply, calculate inflation rate, and map the vesting schedule before evaluating any other metric.
### How do I know if on-chain activity is real or driven by bots?
Cross-check active addresses with fee revenue and transaction value. Real transactions show varied intervals and amounts, while bots display identical frequency and volumes. If active addresses are rising but fee revenue remains flat, users are not conducting economically meaningful transactions. Combine multiple metrics like transaction count, fees generated, and total value locked rather than relying on active addresses alone.
### What is a safe FDV to market cap ratio?
An FDV/MC ratio below 5× indicates that current market cap is not excessively optimistic relative to future dilution. Ratios above 5× mean the token will face years of dilution pressure as locked supply unlocks, requiring sustained demand growth to maintain price. AltLayer's FDV reflects the market value if all 10 billion tokens were unlocked, which helps estimate long-term dilution risk before you commit capital.
### Should I avoid all tokens with anonymous teams?
Pseudonymous teams with verifiable build history present a different risk profile than anonymous teams with no shipping record. Check GitHub commits, prior project involvement, and whether the team delivered working products before launching this token. If the team is fully anonymous, the treasury is large, and there is no public development history, that introduces custody and execution risk that justifies avoiding the project or sizing positions very small.
### How often should I reevaluate an altcoin after I buy it?
Review unlock schedules, on-chain metrics, and GitHub activity every 30 days. Projects change as teams leave, development stalls, or adoption accelerates. Set calendar reminders to check if active addresses are growing, transaction volume is rising, and whether any large unlocks are approaching within 90 days. Write exit conditions before you buy so reevaluation has a clear framework tied to measurable thresholds.
The Weekly Yield Report
You have reviewed tokenomics red flags, vesting schedules, and on-chain signals that separate viable projects from hype. Those thresholds shift every cycle.
Every Thursday: where crypto yield actually is - stablecoins, liquid staking and DeFi lending, with the risk named next to the rate and what changed since last week.
[Get it free every Thursday](#/portal/signup)
Free. No trade calls, no allocations, no hype. Unsubscribe in one click.
### What TVL Outflows Tell You That The APY Does Not
URL: https://altcoininvestor.com/defi-tvl-outflow-meaning/
Last updated: 2026-09-27T15:04:27.000Z
## The Question: What Does a TVL Outflow Actually Mean?

You see a DeFi protocol advertising 22% APY on USDC deposits. The rate has been stable for three weeks. The protocol's Total Value Locked has dropped from $180 million to $120 million over the same period. The question worth answering is not what the protocol is promising. The question is what the people with capital deployed are doing, and why.
Rate is what a protocol advertises. TVL is what people do. When the two disagree, the second one is usually right. The advertised APY reflects the mechanism the protocol wants you to see. The TVL outflow reflects the decision calculus of users who have already evaluated that mechanism and decided to leave. In most cases, they know something the headline rate does not disclose.
This article explains how to read TVL movement as a signal: what a sudden outflow means versus a gradual decline, how to distinguish a rate-chasing rotation from an informed exit, and the specific cases where large holders left before a public problem emerged. The income mechanism here is straightforward. You are reading the same public data that informed money reads, rather than only the headline rate. What changes is your ability to see the pattern before the APY collapses.
## What TVL Measures and What It Does Not
Total Value Locked measures the total dollar value of crypto assets deposited into a DeFi protocol's smart contracts. It is a snapshot of capital deployed, not a measure of protocol health or yield sustainability. When Ethereum's price drops 20% in a day and a protocol holds all its TVL in ETH, the TVL figure will fall 20% even if no user deposits or withdraws a single token. The dollar value has changed. The user behavior has not.
This is where the distinction between nominal TVL and adjusted TVL becomes useful. Adjusted TVL fixes all assets at their price from 90 days prior, so any growth or loss in that adjusted figure reflects only token balance totals: actual inflows or outflows of assets. During the February 2026 market correction, Ethereum's price fell from roughly $2,800 to $2,200, a decline of 21%. Dollar-denominated TVL across DeFi protocols fell from $120 billion to $105 billion, a 12% decline that looked alarming in aggregate. But ETH deposited in DeFi protocols increased from 22.6 million to 25.3 million, a net addition of 2.7 million ETH worth approximately $5.3 billion at the lower price.
In other words, DeFi users treated the price decline as a buying opportunity, not an exit signal. When TVL measured in native tokens rises during bearish sentiment, it signals that sophisticated capital is moving into protocols, not retreating from them. Falling dollar TVL combined with rising native token TVL is an informed capital deployment on weakness. Falling native token TVL is a genuine exit.
The metric that captures user intent most directly is USD inflows, calculated by taking the balance difference for each asset between two consecutive days, multiplying that difference by asset price, and summing across all assets. If USD inflows are negative while TVL remains flat, the protocol is experiencing withdrawals that are being masked by price appreciation in the underlying collateral. If USD inflows are positive while TVL is falling, price depreciation is obscuring genuine deposit growth. The point that matters is this: TVL is a lagging indicator unless you separate price movement from user movement.
## Sudden Outflows Versus Gradual Decline
The speed of an outflow tells you what kind of information is driving it. A sudden, concentrated outflow over 24 to 48 hours typically reflects a discrete event: an exploit, a depeg, a governance attack, or a public disclosure that changes the perceived risk of holding assets in that protocol. The April 2026 KelpDAO bridge exploit is the clearest recent example. On April 18, an attacker drained roughly $220 million from KelpDAO's Ethereum-to-Layer-2 bridge. Within two days, total value locked across all DeFi categories declined by more than $13 billion, falling from approximately $172 billion to $148 billion. Leading lending platform Aave lost $8.45 billion in deposits over 48 hours, driving the bulk of the broader decline.
The outflow was not confined to KelpDAO. It spread across protocols that had no direct exposure to the exploit, because the event changed the perceived risk of custodying assets in any DeFi contract dependent on off-chain bridge infrastructure. As smart contract security has improved over the past three years, off-chain infrastructure has become a more exploitable layer, a risk that existing monitoring frameworks are still catching up to. The market repriced that contagion risk immediately. The advertised APY on most of those protocols stayed frozen or declined only marginally, because the yield mechanism itself had not changed. What changed was the willingness of marginal capital to remain deployed in that risk class.
The persistence of the outflows, now over five weeks following the KelpDAO event, points less to a technical re-rating of specific protocols and more to a broader withdrawal of marginal capital. Users who exited following the exploit have largely not returned, consistent with a pattern where high-profile infrastructure failures reduce risk appetite across the sector rather than staying contained to the affected protocol. This is a gradual decline, not a sudden bank run, and it reflects a structural reassessment rather than panic. When outflows persist for weeks after an initial shock, the signal is that informed holders have concluded the risk-return profile has changed and are not waiting for APY to adjust downward before exiting.
Gradual declines, by contrast, reflect slower-moving forces: yield compression as more capital enters a pool, erosion of token incentives as emissions tail off, or competitive rotation as users move to higher-yielding alternatives. A protocol losing 5% to 8% of its TVL per month over a quarter is not experiencing a crisis. It is losing the margin. The rate-chasers leave first. The long-term holders leave last, and often only when the yield has compressed below their cost of capital or when a better-structured alternative emerges. The income insight here is that gradual declines give you time to evaluate whether the outflow reflects a problem with the protocol or simply a market repricing of yield relative to risk. Sudden outflows do not.
## Rate-Chasing Rotation Versus Informed Exit
Not all outflows signal risk. Some reflect the simple fact that capital moves to where it is paid best. When a new protocol launches with attractive token incentives, capital floods in fast. A pool that was generating 200% APY with $10 million in TVL will see that yield compress to 40% or 50% as TVL grows to $50 million, because the same reward budget is now being split among five times as many depositors. The yield compresses, and the mercenary capital rotates out to the next high-APY launch. This is rate-chasing rotation, and it is a structural feature of token-incentivized liquidity, not a red flag.
The pattern to watch for is flat total TVL paired with heavy intra-chain rotation. If Ethereum's aggregate DeFi TVL holds steady at $53 billion while individual protocols see sharp inflows and outflows week to week, that implies allocators are repositioning rather than deploying net new capital. The capital is not leaving DeFi. It is moving between protocols in search of the best risk-adjusted return. A broad directional move, by contrast, points to genuine sector-wide inflows or outflows, and that is the signal that carries information about confidence in the asset class as a whole.
The edge case worth noting is when a protocol loses 50% of its TVL while maintaining headline APY. This can happen if the remaining capital is concentrated in a single high-yield pool while liquidity fragments across the rest of the protocol. APY will not reflect the fragmentation, because the advertised rate typically highlights the best-performing pool rather than the weighted average across all deposits. If you see TVL falling while APY holds steady or rises, check whether the protocol's TVL is becoming more concentrated in fewer pools or among fewer depositors. Concentration is a warning sign, because it means the protocol's yield sustainability is increasingly dependent on a small number of large holders who can exit quickly if conditions change.
## When Large Holders Leave Before The Problem Becomes Public
The most valuable signal a TVL outflow can give you is advance notice that sophisticated holders have identified a problem the market has not yet priced. This is not speculation. It is observable in the data when you know where to look. In early 2026, EigenLayer held $18.37 billion in TVL, making it the fourth-largest DeFi protocol. The restaking mechanism it pioneered allowed users to stake ETH once and rehypothecate that stake across multiple services, earning layered yield on the same collateral. The advertised returns were compelling, and TVL grew rapidly through the first quarter.
Then ether.fi, one of the largest liquid staking protocols feeding capital into EigenLayer, reduced its restaking exposure from roughly 50% of assets under management to under 1% between early 2026 and September. The move was quiet, executed over several months, and disclosed in governance updates rather than announced as a major strategic shift. But the signal was clear: a sophisticated ecosystem participant with detailed visibility into restaking risks had decided the concentrated capital risk was no longer worth the incremental yield. Other large liquidity providers followed, and by mid-2026 the pattern of TVL outflows from restaking protocols had shifted from gradual to structural.
The public narrative around restaking risk did not catch up until months later, when several audits and governance reviews highlighted the cascading liquidation risk inherent in rehypothecated collateral during periods of high volatility. By the time those reports were published, the large holders had already exited. The headline APY on restaking products remained elevated throughout this period, because the mechanism generating the yield had not changed. What changed was the informed assessment of tail risk, and that assessment showed up in TVL outflows long before it showed up in public commentary or rate adjustments.
The pattern repeats across DeFi history. Sophisticated holders exit quietly, not in coordinated bank runs. The TVL decline is slow at first, then accelerates as smaller holders notice the trend and begin to follow. By the time the outflow is large enough to move APY or trigger public concern, the earliest movers are already deployed elsewhere. If you are reading TVL data with the same attention you give to advertised rates, you see the rotation happening in real time rather than learning about it retrospectively.
## What TVL Cannot Tell You
TVL measures value deposited, not how easily that value can be converted or rehypothecated without slippage. In periods of stress, much of TVL becomes sticky due to withdrawal queues, fees, or collateral haircuts. A lending protocol with $500 million in TVL might have $200 million of that locked in positions where withdrawing would trigger liquidations or penalties that make exit uneconomical at current prices. The TVL figure does not distinguish between liquid and sticky capital, and that distinction matters when you are trying to assess whether an outflow reflects panic or simply the rotation of capital that was never committed long-term.
The second thing TVL cannot tell you is whether the yield mechanism funding that APY is sustainable. A protocol with rising TVL and stable APY could be funding that yield through token emissions that dilute existing holders, making the nominal return meaningless in real terms. [Protocols that generate revenue from fees, spreads, or transaction volume](https://altcoininvestor.com/best-defi-protocols/) can sustain yield across different market environments. Protocols that fund yield through treasury reserves or new token issuance cannot, and the TVL figure will not tell you which category you are looking at. You need to trace the revenue source separately, and that requires reading the protocol's fee structure and tokenomics rather than relying on the TVL dashboard.
The third limitation is geographic and regulatory. TVL does not tell you where the capital is coming from or whether it is vulnerable to jurisdiction-specific enforcement risk. A protocol with $1 billion in TVL concentrated among US users faces different tail risks than one with the same TVL distributed across non-US holders, because US regulatory actions can trigger forced redemptions or service restrictions that fragment liquidity in ways the aggregate TVL number does not reflect until the event occurs.
## Reading TVL in Context: Cross-Chain and Competitive Positioning
Ethereum still holds approximately $53.6 billion of DeFi TVL, more than the next seven chains combined, and the deepest exit liquidity for almost any asset is still on Ethereum mainnet. A chain with 1% of Ethereum's TVL can quote an attractive APY precisely because it lacks that depth. The yield is higher because the liquidity risk is higher, and the TVL reflects that tradeoff. When capital flows from Ethereum to lower-TVL chains like Arbitrum, Base, or Solana, the move often represents rate-chasing rotation rather than a fundamental loss of confidence in Ethereum-based protocols. But the pattern repeats until it does not. The early rotators capture the high yield. The late ones lose to slippage, bridge failures, or depeg risk when the smaller chain cannot absorb a large exit without fragmenting.
The predictive edge you gain from reading cross-chain TVL flows is in recognizing when the rotation is early-stage versus late-stage. If a new Layer 2 or alt-L1 is seeing TVL inflows while total cross-chain TVL is flat or rising, that is early rotation and often profitable for participants. If the new chain is seeing inflows while Ethereum TVL is falling and total TVL across all chains is declining, that is late-stage rotation and typically marks the top of the cycle for that narrative. The marginal capital flowing into the higher-risk chain is not new money. It is the last capital leaving the lower-risk base, and it is usually the capital that exits too late when conditions reverse.
## Case Study: Aerodrome Slipstream and the Outflow Cliff
Aerodrome Slipstream on Base processed $513 million in daily DEX volume in early 2026 with reward structures advertising 283% APY on certain USDC pairs. The protocol's TVL peaked at approximately $1.3 billion in January. By July, TVL had declined to $281.78 million, a drop of nearly 80%. The headline APY remained elevated throughout much of that decline, because the reward mechanism was still issuing the same token incentives to a shrinking pool of depositors. The yield per dollar of TVL actually increased as the denominator fell, creating the paradox of rising advertised APY during a structural outflow.
What the TVL outflow revealed, and what the APY obscured, was that the protocol could not sustain both the rate and the depth. The emissions-funded yield was only economically rational for participants if the token being issued held its value or appreciated. As the token declined in price relative to the stablecoins being deposited, the real return collapsed even as the nominal APY stayed high. Informed holders exited early, when TVL was still above $800 million and liquidity was deep enough to exit without significant slippage. The holders who stayed for the advertised 283% APY were left holding a depreciating governance token and an illiquid position by the time they recognized the mechanism had failed.
The lesson is that when APY exceeds 100% and TVL is falling quarter over quarter, the outflow cliff is coming. The protocol cannot sustain both the rate and the depth, and the advertised yield becomes a signal of desperation rather than opportunity. [The real cost is not just the rate differential](https://altcoininvestor.com/defi-yield-opportunity-cost-rate-difference/) between staying and leaving. It is the liquidity cost of trying to exit once everyone else has reached the same conclusion.
## Distinguishing Real Yield From Emission-Funded APY
The key differentiator in evaluating TVL sustainability is whether the protocol funds its yield from real revenue or from token issuance. Protocols that generate fees from trading volume, lending spreads, or liquidation penalties can sustain yield across different market environments because the revenue source is tied to usage rather than dilution. When these protocols experience TVL outflows, the yield typically adjusts downward as fee income declines, and that adjustment happens visibly in the APY rather than being masked by emissions.
Emission-funded protocols, by contrast, can maintain or even increase advertised APY during TVL outflows because the emissions budget is often fixed or algorithmically determined rather than tied to revenue. The result is that APY becomes a lagging indicator of sustainability, and by the time it adjusts downward, the informed capital has already exited. The TVL outflow is the leading indicator. If you see a protocol with stable or rising APY and falling TVL, check whether the yield is funded by fees or emissions. If it is emissions, the outflow is telling you that holders have concluded the token dilution outweighs the nominal return.
The income mechanism here is to prioritize protocols where yield is funded by revenue rather than issuance, and to treat TVL stability in those protocols as a positive signal rather than focusing solely on headline APY. A protocol with 6% APY funded entirely by fee revenue and stable TVL is a more sustainable income source than a protocol advertising 60% APY funded by emissions with declining TVL, even though the nominal return is an order of magnitude lower.
## What You Do With This Information
Reading TVL outflows as a signal rather than noise requires you to distinguish between the patterns that matter and the patterns that reflect normal capital rotation. Sudden outflows following a discrete event are a risk signal and typically warrant immediate re-evaluation of whether you want exposure to that protocol or that risk class. Persistent outflows over multiple weeks signal a structural reassessment, and if you are still deployed in that protocol, the question is whether you have information the exiting holders do not or whether you are simply late to the same conclusion.
Gradual declines in TVL are normal and often reflect yield compression or competitive repositioning rather than risk. The income decision there is not whether to exit immediately, but whether the compressed yield still compensates you for the risks you are taking and whether better alternatives exist. If the answer is no, the TVL outflow is giving you advance notice that the market is repricing that opportunity, and you should reprice it too.
When large, sophisticated holders reduce exposure quietly, the TVL outflow is advance notice of a risk the market has not yet priced. You will not always be able to identify which specific wallets are exiting or why, but you can track aggregate TVL and adjusted TVL to see whether the outflow is broad-based or concentrated, and whether it is being driven by price movement or genuine withdrawals. The earlier you notice that pattern, the more time you have to evaluate whether you agree with the risk assessment that is driving the exit or whether you have a differentiated view that justifies staying deployed.
The simplest heuristic is this: if advertised APY is stable or rising and TVL is falling, treat the outflow as the primary signal and verify whether the yield mechanism is sustainable before assuming the rate will persist. If TVL is rising or stable and APY is compressing, that is normal capital inflow and yield dilution, and the protocol is likely functioning as designed. If both TVL and APY are falling together, that is a revenue problem or a confidence problem, and you should understand which one it is before deciding whether to stay deployed. The data is public. The question is whether you are reading it the way informed capital does, or whether you are relying on the advertisement.
## The Takeaway
A protocol's advertised APY is a promise. Its TVL is a record of what users with deployed capital have chosen to do after evaluating that promise. When the two diverge, the TVL movement is usually the signal that matters. Sudden outflows reflect discrete events that change perceived risk. Persistent outflows signal a structural reassessment. Gradual declines often reflect yield compression or competitive rotation. The pattern that carries the most valuable information is when large, sophisticated holders exit quietly before a problem becomes public, because that outflow gives you advance notice of a risk the headline rate does not disclose. You are reading the same public data that informed money reads. What separates you from the late movers is whether you treat TVL as a lagging indicator of TVL or a leading indicator of sustainability.
## Frequently Asked Questions
### What is the difference between TVL and USD inflows in DeFi?
TVL measures the total dollar value of assets locked in a protocol at a given moment, including price changes. USD inflows calculate the actual net movement of assets by taking daily balance differences, multiplying by asset price, and summing across all tokens. If ETH price drops 20% with no deposits or withdrawals, TVL falls 20% while USD inflows remain zero. Inflows reveal user behavior; TVL conflates price movement with capital movement.
### How do I know if a TVL outflow signals risk or just normal rotation?
Sudden outflows over 24 to 48 hours following a specific event like an exploit or depeg signal acute risk and warrant immediate re-evaluation. Persistent outflows over multiple weeks indicate structural reassessment by informed capital. Gradual declines of 5% to 8% monthly typically reflect yield compression or competitive repositioning, not crisis. Check whether the outflow coincides with falling native token TVL versus just falling dollar TVL due to price movement.
### Why would APY stay high while TVL is falling?
When a protocol funds yield through fixed token emissions rather than fee revenue, advertised APY can rise as TVL falls because the same reward budget is split among fewer depositors. This creates rising nominal APY during a structural outflow and often signals unsustainable yield. Sophisticated holders exit early when they recognize the token dilution outweighs the advertised return, leaving late movers holding illiquid positions with depreciating governance tokens despite high nominal rates.
### What does adjusted TVL tell me that regular TVL does not?
Adjusted TVL fixes all assets at their price from 90 days prior, isolating actual deposit and withdrawal behavior from market price fluctuations. During the February 2026 correction, dollar TVL fell 12% while ETH deposited rose by 2.7 million tokens, revealing that users were adding capital during the price decline. Falling dollar TVL with rising adjusted TVL signals informed accumulation. Falling adjusted TVL signals genuine exit regardless of price movement.
### How can I identify when large holders are exiting before problems become public?
Track aggregate TVL and adjusted TVL for protocols with concentrated capital, especially those dependent on a few large liquidity providers. Gradual but persistent declines in adjusted TVL over multiple months, particularly when headline APY remains stable, often indicate sophisticated holders quietly reducing exposure. The ether.fi reduction of EigenLayer exposure from 50% to under 1% between early and mid-2026 preceded public recognition of restaking tail risks by several months.
The Weekly Yield Report
You have just read the difference between advertised APY and observed TVL movement across five documented outflow patterns. Those patterns will repeat, and the early signal will be in the data.
Every Thursday: where crypto yield actually is - stablecoins, liquid staking and DeFi lending, with the risk named next to the rate and what changed since last week.
[Get it free every Thursday](#/portal/signup)
Free. No trade calls, no allocations, no hype. Unsubscribe in one click.
### Litecoin Surges 45.7% in 30 Days on ETF Filing and Halving
URL: https://altcoininvestor.com/litecoin-surge-45-percent-etf-filing-halving/
Last updated: 2026-09-30T18:00:06.000Z
## The Move and What Preceded It

Litecoin climbed 45.7% over 30 days to $71.01 as of 27 September 2026, per CoinGecko data. The seven-day gain stood at 25.1%, while the 24-hour period registered a 1.5% decline. At a market capitalization of $5.51 billion, LTC ranks 24th by size and trades 82.7% below its all-time high of $410.26, reached on 9 May 2021.
The rally began from a base near $42 in late June 2026, per data from 247 Wall St. published on 26 September 2026\. Litecoin started at $42 on 30 June, climbed to $44 by 31 July, and reached $49 by 31 August, before the current monthly rally began. That puts the entire recovery at roughly 70% from the cycle low to the current price.
Multiple sources report that Grayscale filed on 11 September 2026 to convert its Litecoin Trust into a spot exchange-traded fund (ETF). The filing arrived 16 days before the most aggressive phase of the rally, which saw LTC break above $64 and eventually test $75 during a two-week stretch ending around 25 September. That sequence matters. The announcement preceded the sharpest gains, and the price responded only after the filing became widely known.
## The Catalysts Behind the Rally

The Grayscale filing is the clearest institutional catalyst. On 11 September, Grayscale submitted an amended registration statement to the SEC to convert its eight-year-old Litecoin Trust into an ETF listed on the NYSE Arca. This filing is just a request, and the SEC has not yet approved it or given a timeline for its decision. A spot LTC ETF already exists. The Canary Litecoin ETF, trading under ticker LTCC, began trading on Nasdaq in late October 2025 and became the first U.S. spot Litecoin ETF. Canary's fund page lists an inception date of 27 October 2025, a 0.95% sponsor fee, and about $5.49 million in net assets as of 29 June 2026.
The Canary fund has seen modest inflows. Canary Capital's spot Litecoin ETF (LTCC) recorded a $1.73 million net inflow on 24 September, its largest single-day influx. Earlier reporting from the same outlet noted that the largest single inflow occurred on 25 September, when 39,000 LTC worth around $2.8 million was added. Collectively, all U.S. Litecoin funds hold a record total of 175,000 LTC, valued at roughly $13 million according to Glassnode. Against a $5.51 billion market cap, these flows represent a fraction of 1%. The inflows are real but insufficient by themselves to drive a move of this magnitude.
The second driver is anticipation of the 2027 halving event. The most recent halving occurred on 2 August 2023, and the next is expected around 27 July 2027\. That event will reduce block rewards from 6.25 LTC to 3.125 LTC. Network activity has increased alongside renewed interest in the 2027 halving. September gains reached 41%, the strongest since November 2024\. Historically, Litecoin has rallied in the months leading up to a halving and sold off afterward, a pattern observed in both 2015 and 2019.
A third element is the upcoming LitVM smart contract layer. LitVM is a zero-knowledge, EVM-compatible Layer 2 solution designed to bring smart contracts and decentralized applications to Litecoin without altering its base layer. Its testnet, LiteForge, has processed over 75 million transactions since April 2026\. The mainnet launch is slated for Q4 2026, pending completion of multiple independent security audits. A Nasdaq-listed company, Lite Strategy, invested $1 million in LitVM, a Layer-2 aiming to bring smart contracts and DeFi to Litecoin, according to crypto.news on 18 June 2026\. The investment signals institutional backing, but the network upgrade remains speculative until mainnet deployment.
## Leverage Drove Most of the Move

Derivatives positioning reveals the structure beneath the rally. Open interest is $605.82 million, up from $536.90 million. Futures trading volume is $1.19 billion, five times spot, suggesting leverage is driving the rally, per CoinMarketCap on 24 September 2026\. A separate analysis reported that over the same period, futures open interest climbed to about $688 million. The discrepancy between the two figures likely reflects different measurement windows, but both confirm the same pattern: open interest roughly doubled during September.
When futures volume runs five times spot volume, the move is being amplified by borrowed capital rather than unleveraged buying. Spot trading volume surged close to $948 million on 24 September, about three times the volume observed around 18 September. Volume tripled, but derivatives positioning grew faster. That imbalance creates fragility. Every long position funded with margin becomes a potential liquidation if price reverses, and every liquidation adds sell pressure that can cascade.
The technical breakout compounded the effect. Price broke through a major resistance band around $64 to $65, which had capped prior rallies, and then ran through intermediate resistance levels at about $68.75 and $71.88 before testing the $74 to $75 zone. Momentum indicators were at multi-month highs, consistent with a strong impulsive move rather than a slow grind. Once LTC cleared a multi-month resistance with a golden cross behind it, technical traders and bots had a textbook setup to add longs. That type of setup frequently acts as a direct catalyst for strong short-term moves.
## What Holds the Move and What Breaks It
For the rally to hold, two conditions must be met. First, spot ETF inflows need to grow large enough to absorb the supply coming from leveraged traders who close positions. The Canary fund holds about $5.5 million in net assets. Grayscale's fund does not yet exist. Institutional demand remains a narrative, not a flow. Second, the LitVM mainnet must launch on schedule in Q4 2026 without delay or exploit. The LitVM timeline also matters. The Q4 mainnet is the main new element in the Litecoin case. A slip into 2027 would remove the catalyst the project's own messaging now leans on.
Three factors would break the move. The first is a failure to reclaim spot dominance. If price keeps climbing while open interest flattens, spot buyers are taking over from leveraged traders. If open interest keeps outrunning price, the rally becomes more fragile each week. The second is a break below $64, the resistance-turned-support level that anchored the entire breakout. A daily close beneath that zone would invalidate the technical setup and likely trigger stop losses. The third is a broader market selloff. Because the rest of the market was not strongly up, the most plausible reading is that Litecoin's move is largely idiosyncratic. Market-wide risk sentiment provided a neutral-to-slightly-negative backdrop, but LTC-specific catalysts, technicals, and flows dominated its behaviour. If Bitcoin corrects sharply, LTC will follow regardless of its own fundamentals.
## What the Move Does Not Mean for Income Holders
Litecoin does not pay staking yield, does not distribute fees to holders, and does not offer on-chain income streams in the way that proof-of-stake networks do. The 45.7% gain is a price move, not a change in the asset's income profile. For someone holding LTC to earn from it, the options remain limited to lending on centralized platforms or using wrapped LTC in DeFi protocols on other chains. The rally changes none of that.
The LitVM upgrade could eventually introduce fee-generating opportunities if DeFi applications launch on the Layer 2 and users can provide liquidity or stake in governance mechanisms. But the mainnet has not launched, and no fee structure has been finalized. Until that happens, LTC remains a non-yielding asset.
For holders evaluating whether the move changes the risk-reward of a position, the relevant question is whether the catalysts justify holding through a potential reversal. The halving is ten months away. The Grayscale ETF has no approval timeline. The LitVM mainnet is pending audits. All three catalysts remain forward-looking, and the majority of the rally came from leverage, not spot accumulation. A fast move up on borrowed capital can reverse just as quickly when positioning unwinds.
Anyone holding LTC for its payment utility or as a beta play on the broader altcoin cycle should recognize that the current structure carries liquidation risk. The move does not create urgency to add exposure, and it does not validate the price level as sustainable. It confirms that LTC-specific narratives can still drive short-term outperformance, but the same leverage that amplified the rally will amplify any correction.
The Weekly Yield Report
You have just examined a 45.7% rally driven by leverage, an ETF filing with no approval date, and a halving still ten months out. The next filing, the next catalyst, or the next unwind will shift those percentages again.
Every Thursday: where crypto yield actually is - stablecoins, liquid staking and DeFi lending, with the risk named next to the rate and what changed since last week.
[Get it free every Thursday](#/portal/signup)
Free. No trade calls, no allocations, no hype. Unsubscribe in one click.
### How To Recognize A Cycle Top (Signals I Watch)
URL: https://altcoininvestor.com/how-to-recognize-crypto-cycle-top/
Last updated: 2026-09-27T12:02:49.000Z
In November 2021, I made the mistake of staying too long. I saw Bitcoin climb toward $69,000 and believed the narrative that this cycle would be different because institutions had arrived. I had a plan to start taking profits at certain thresholds, but when those levels hit, I told myself to wait one more week. That week turned into two, then three. By the time I started executing, the top was already behind me. I gave back 40% of what could have been locked-in gains before I finished rebalancing. The lesson cost me six figures, but it clarified something I had been ignoring: no cycle is different enough to skip the exit signals.
After more than ten years trading crypto, I have developed a framework for recognizing when euphoria peaks. It is not perfect. No framework is. But it has saved me from repeating the 2021 mistake in subsequent moves, and it would have saved me then if I had trusted it. The framework combines on-chain data, market structure signals, and behavioral indicators. Some of these signals fired cleanly in 2021\. Others failed in 2025 because the market structure changed in ways most analysts missed. This piece walks through what I watch, what worked, what did not, and why I still use a multi-indicator approach even though no single metric has earned my unconditional trust.
## The MVRV Ratio: The Most Reliable Single Indicator
The Market Value to Realized Value (MVRV) ratio compares Bitcoin's market capitalization to its realized capitalization, which weights each coin by the price at which it last moved on-chain. When MVRV climbs above 3.0, it historically signals that the average holder is sitting on substantial unrealized gains and that the market is entering euphoria territory. When it falls below 1.0, it means the average holder is underwater, a condition that has marked every major cycle bottom since 2011.
The threshold that matters for cycle tops is not static. In the 2013 cycle, MVRV peaked above 7\. In 2017, it reached approximately 4.2\. In 2021, it topped out near 3.7\. The compression is real and reflects [market maturation](https://altcoininvestor.com/bitcoin-whales-market-signals/). But even with a compressing ceiling, MVRV above 3.0 has been the single most consistent warning that price is running ahead of fundamental holder conviction.
In the 2025 cycle, MVRV peaked at approximately 2.52 in January 2025, well short of the 3.5 threshold that preceded both the 2017 and 2021 major tops. This was the first cycle in Bitcoin's history where price reached a new all-time high of $126,198 in October 2025 without MVRV breaching 3.0\. The indicator did not fail. The market structure changed. Institutional buyers operating on quarterly allocation schedules do not generate the parabolic acceleration that sends MVRV into the stratosphere. They bring sustained, stable demand that absorbs miner sales and prevents the kind of speculative overshoot that defined prior cycles.
I still watch MVRV more closely than any other single on-chain metric, but I no longer wait for it to hit 3.5 before I start rebalancing. If MVRV crosses 2.8 and funding rates are elevated and retail search interest is spiking, that is enough. The 2025 lesson was clear: waiting for the traditional threshold in a structurally different market is how you miss the top entirely.
## Funding Rates: The Leverage Thermometer
Perpetual futures funding rates measure the cost of holding leveraged long positions. When funding rates stay persistently positive and elevated for weeks, it signals that the market is overleveraged on the long side. Traders are paying a premium to maintain bullish exposure, which means sentiment has moved past optimism into greed. When funding rates spike above 0.1% per eight hours and stay there, the probability of a sharp correction increases substantially.
In April 2021, funding rates on major exchanges stayed above 0.08% for more than three weeks as Bitcoin climbed toward $64,000\. The correction that followed was 54%. In November 2021, funding rates spiked again above 0.12% in the final week before the $69,000 peak. Both times, elevated funding preceded the top by days, not weeks. The signal was actionable if you were watching.
In 2025, funding rates never sustained the extremes we saw in 2021\. The highest readings came in September 2025, briefly touching 0.09%, but they did not hold. Institutional spot buying does not rely on leverage, which means it does not push funding rates into the red-zone territory that characterized prior retail-driven euphoria. This was another structural shift that made traditional signals less reliable.
I still monitor funding rates daily through [Glassnode](https://www.glassnode.com/blog) and CryptoQuant. But I have adjusted my threshold. In a market where institutions provide the marginal bid, sustained funding above 0.06% for two weeks is now a yellow flag. It is not the red flag that 0.1% used to be, but it is enough to move me from accumulation mode to caution mode.
## Dormant Supply Activation: Old Coins Moving
When coins that have sat dormant for years suddenly start moving on-chain, it often signals that long-term holders are taking profits. These are the people who bought in previous cycles, held through the bear, and are now seeing life-changing gains. When they sell into strength, it is a sign that smart money is exiting while euphoria absorbs the supply.
The metric I watch is the percentage of supply that has not moved in more than two years. During accumulation phases and bear markets, this percentage climbs as holders lock in for the long term. During distribution phases, it rolls over as those same holders begin to exit. The inflection point, when the dormant supply percentage stops rising and starts falling, has historically preceded major tops by 60 to 120 days.
In 2021, dormant supply peaked in May and began declining in June, well before the November top. The signal gave plenty of lead time. In 2025, dormant supply began declining in August 2025, about two months before the October peak. The pattern held, but the signal window was shorter.
One caution: dormant supply activation can also fire false positives. Large custody reshuffles, such as exchanges moving cold storage or governments transferring seized coins, can trigger the same on-chain signature as early-holder selling. Context matters. If dormant supply is declining and MVRV is elevated and funding rates are high, the probability that it represents distribution is much higher than if it is happening in isolation.
## Retail Attention Shifts: The Taxi Driver Test
Every trader who lived through 2017 knows some version of the taxi driver story. The market is near a top when people who have never mentioned crypto before start asking you which coins to buy. It is not scientific, but it is a behavioral signal that has repeated in every cycle I have traded through.
The modern version of this signal is Google Trends data for search terms like "how to buy Bitcoin" and "best crypto to buy." When search interest spikes to multi-year highs, it means retail attention has shifted from early adopters to the general public. That shift marks the final phase of the cycle, when the last wave of new buyers enters and provides exit liquidity for those who accumulated earlier.
In 2021, Google search interest for "Bitcoin" peaked in May and again in November, both times coinciding almost exactly with local and global price tops. The correlation was tight enough to use as a real-time signal. In 2025, search interest peaked in September, about one month before the October price top. The signal worked, but it required watching week-to-week trends rather than waiting for an all-time search volume high.
I track this through Google Trends and social media mention volume on platforms like X. When my non-crypto friends start texting me about Coinbase account setup, I know we are close. When those texts stop coming and the questions shift to "should I sell," we have crossed over. It is qualitative, but in combination with quantitative signals, it adds useful context about where we are in the sentiment cycle.
## The Pi Cycle Top Indicator: A Cautionary Tale
The Pi Cycle Top indicator compares the 111-day moving average of Bitcoin's price to the 350-day moving average multiplied by two. When the shorter average crosses above the longer one, it has historically signaled a cycle top within three days. The indicator called the 2013, 2017, and 2021 tops with remarkable accuracy. It became one of the most widely cited technical signals in crypto.
In 2025, the Pi Cycle crossover never happened. Many analysts predicted it would occur in September 2025, but the crossover did not materialize. Bitcoin peaked in October without triggering the signal. This was not a failure of the indicator. It was evidence that the indicator was built for a market structure that no longer exists.
The Pi Cycle requires sharp, accelerating price increases to generate the crossover. Retail FOMO and leveraged speculation create that acceleration. Institutional buyers deploying capital on quarterly schedules do not. They generate smooth, sustained rises that never push the 111-day moving average far enough above the 350-day to trigger the cross. The structural change in who was buying changed the shape of the rally, which broke the indicator's assumptions.
I stopped relying on the Pi Cycle after 2025\. It remains a useful historical reference, but I no longer wait for it to confirm a top. Any signal that depends on a specific price velocity profile is vulnerable to changes in market structure. The Pi Cycle taught me that lesson clearly.
## What I Do Not Know
No framework catches every top, and no signal set eliminates the risk of being early or late. The hardest part of recognizing a cycle top is not identifying the signals. It is acting on them when the prevailing narrative is bullish and everyone around you is still buying. In November 2021, I saw the signals but convinced myself they were noise because institutions were "just getting started." That rationalization cost me.
I do not know whether the next cycle top will look more like 2021 or more like 2025\. I do not know whether MVRV thresholds will continue compressing or stabilize at current levels. I do not know whether new indicators will emerge that better capture institutional-driven cycles, or whether the old indicators will adapt as more data accumulates. What I do know is that trusting a single indicator in a market this young and this structurally fluid is a mistake I will not repeat.
## The Long-Term Implication
The shift from retail-dominated cycles to institutionally influenced cycles is permanent. Spot Bitcoin ETFs, corporate treasury adoption, and sovereign wealth fund exploration have changed the composition of demand in ways that are not reversing. This does not mean [cycle tops disappear](https://altcoininvestor.com/how-to-use-leverage-crypto/). It means the shape of those tops will be different, the signals will be noisier, and the timeframes will be less predictable.
Over the next 5 to 10 years, I expect on-chain indicators to evolve. Analysts will develop new metrics that better capture institutional flows, ETF demand, and stablecoin liquidity dynamics. The MVRV ratio will remain useful, but its thresholds will continue shifting. Funding rates will matter less as spot demand grows relative to derivatives. Dormant supply activation will stay relevant as long as early holders continue exiting into new cycles, but custody innovations may add more noise to the signal.
The traders who succeed in this environment will be the ones who treat cycle-top indicators as probabilistic inputs rather than deterministic rules. The traders who fail will be the ones who wait for the old signals to flash at the old thresholds and miss the top entirely because the market has already moved on.
## The Takeaway
I watch five primary signals to recognize a cycle top: MVRV above 2.8, sustained funding rates above 0.06%, dormant supply beginning to decline, retail search interest spiking to multi-year highs, and my own network starting to ask how to buy crypto. No single signal is sufficient. All five together create a probability envelope that tells me when euphoria is peaking. I start rebalancing when three of the five are active. I accelerate when four are active. I have never seen all five fire simultaneously and not seen a significant correction follow within 60 days. The 2025 cycle taught me that the thresholds are moving, but the framework still works if you are willing to adjust the inputs rather than wait for the past to repeat exactly.
## Frequently Asked Questions
### What is the MVRV ratio and why does it matter for cycle tops?
The MVRV ratio compares Bitcoin's market capitalization to its realized capitalization, which weights each coin by the price at which it last moved on-chain. When MVRV climbs above 3.0, it historically signals euphoria as the average holder sits on substantial unrealized gains. The ratio has compressed over time (from 7+ in 2013 to 3.7 in 2021), reflecting market maturation. In 2025, MVRV peaked at only 2.52, showing how institutional demand changed traditional thresholds. It remains the single most reliable on-chain indicator for identifying when price has run ahead of fundamental holder conviction.
### How do funding rates signal an overleveraged market?
Perpetual futures funding rates measure the cost of holding leveraged long positions. When rates stay persistently positive and elevated (historically above 0.1% per eight hours) for weeks, it signals the market is overleveraged on the long side. Traders pay a premium to maintain bullish exposure, indicating sentiment has shifted from optimism to greed. In 2021, funding above 0.08% for three weeks preceded a 54% correction. In 2025, institutional spot buying reduced leverage dependence, so sustained funding above 0.06% for two weeks became the new caution threshold.
### What does dormant supply activation tell us about cycle tops?
Dormant supply activation tracks when coins that have sat unmoved for years suddenly transfer on-chain, often signaling long-term holders taking profits. The key metric is the percentage of supply dormant for 2+ years. During bear markets this percentage climbs as holders lock in; during distribution it falls as they exit. The inflection point when dormant supply stops rising and starts falling has historically preceded major tops by 60 to 120 days. In both 2021 and 2025 this pattern held, though the 2025 signal window was shorter.
### Why did the Pi Cycle Top indicator fail in 2025?
The Pi Cycle Top indicator compares Bitcoin's 111-day moving average to its 350-day moving average multiplied by two. The crossover accurately called tops in 2013, 2017, and 2021 within days. In 2025 the predicted crossover never happened because the indicator was built for retail-driven, accelerating rallies. Institutional buyers deploying capital on quarterly schedules create smooth, sustained rises without the sharp acceleration needed to trigger the cross. The indicator did not fail, the market structure it was designed for changed fundamentally.
### Should I rely on a single indicator to time cycle tops?
No. Relying on any single indicator in crypto's structurally evolving market is a mistake. The most effective approach uses a multi-indicator framework that treats signals as probabilistic inputs rather than deterministic rules. Watch MVRV ratios, funding rates, dormant supply trends, retail search interest, and social sentiment together. Start rebalancing when three signals are active, accelerate when four fire. No framework catches every top perfectly, but a diversified signal approach reduces the risk of being badly wrong when market structure shifts unexpectedly.
### Week in Crypto: DeFi Risk, Yield Mechanics, and Custody
URL: https://altcoininvestor.com/week-in-crypto-2026-09-27/
Last updated: 2026-09-27T11:02:00.000Z
The week of September 20-27 delivered two things most coverage misses: evidence of how DeFi breaks, and evidence of how institutions are fixing it. KelpDAO filed a lawsuit over a $292 million bridge exploit. Bitget confirmed a $351.6 million backend breach. Frgmnt wrapped DeFi yields inside institutional custody rails. The pattern matters more than the individual events.
This was a week about counterparty risk, yield sustainability, and the infrastructure that determines whether your capital survives contact with reality. Here's what shipped.
## Security and Exploits
[KelpDAO filed suit against LayerZero](https://altcoininvestor.com/kelpdao-sues-layerzero-292m-bridge-exploit/) over the April 18 bridge exploit that drained 116,500 rsETH worth $292 million. The lawsuit alleges LayerZero endorsed the configuration that allowed the attack. This is the first major litigation attempt to recover bridge exploit losses through vendor liability rather than on-chain bounties or negotiation.
Bitget confirmed a $351.6 million hot wallet breach via spoofed backend transfer data. Withdrawals remain frozen. The [Bitget backend breach](https://altcoininvestor.com/bitget-backend-breach-defi-counterparty-risk/) demonstrated that even audited infrastructure fails at the API layer, where most users have zero visibility and no recourse.
The takeaway: bridge and backend failures represent systemic counterparty risk that no amount of on-chain verification solves. If your yield strategy involves centralized infrastructure or cross-chain bridges, that is the weakest point in your entire position.
## DeFi and Protocols
Frgmnt launched a stablecoin protocol that delivers on-chain lending yields through regulated custody infrastructure. The product generates 13.32% from DeFi markets without requiring institutions to manage wallets or interact with smart contracts directly. [Frgmnt wraps DeFi yield inside institutional custody](https://altcoininvestor.com/frgmnt-defi-yield-institutional-custody/), creating a compliance layer between allocators and protocols.
This is the model that wins institutional capital. Allocators want the yield, not the operational burden. If the wrapper can isolate counterparty risk and provide audited reporting, it solves the problem that kept $4 trillion in TradFi money markets out of DeFi for the last four years.
Separately, coverage this week documented three stablecoin positions that disappeared from yield trackers in March 2025\. Midas RWA USDC, Curve FRAX-USDE, and Sparklend USDT all vanished without clear explanation. The [positions that disappeared](https://altcoininvestor.com/why-midas-rwa-usdc-stopped-paying-yield-march-2025/) highlighted a recurring issue: most DeFi users don't monitor what matters until the position is already gone.
## Stablecoins
Usual's USD0 rate jumped from 3.56% to 6.06% on $503 million in TVL. The protocol claims 100% RWA-backed yield with zero token incentives. The [Usual USD0 rate jump](https://altcoininvestor.com/usual-usd0-apy-increase-real/) merits scrutiny. A 2.5 percentage point increase with no disclosed change in underlying asset allocation or borrowing demand is either a portfolio rebalancing event or an incentive program disguised as organic yield.
Hong Kong's HKDAP stablecoin completed its first regulated fund subscription, proving Asia-Pacific stablecoin infrastructure for wealth management is now live. The [Hong Kong stablecoin institutional trade](https://altcoininvestor.com/hong-kong-stablecoin-institutional-trade/) matters because it validates tokenized settlement rails in a jurisdiction that requires full reserve audits and investor protection frameworks. This is what regulatory clarity looks like when implemented correctly.
## Adoption and Institutional Infrastructure
Solana DEXs logged 208 million weekly trades, surpassing the NYSE's 189 million. The milestone reflects institutional flows into 24/7 tokenized equity venues. [Solana DEX trades surpassing NYSE](https://altcoininvestor.com/solana-dex-trades-surpass-nyse-yield/) is not a victory for decentralization. It is evidence that venues with lower friction, continuous operation, and programmable settlement are capturing volume from legacy infrastructure.
The European Central Bank launched Pontes, a wholesale settlement platform connecting DLT infrastructure to central bank payment rails. The [ECB Pontes platform](https://altcoininvestor.com/ecb-pontes-tokenized-settlement-platform/) enables tokenized asset settlement directly through central bank accounts, eliminating the stablecoin intermediary step that introduces credit risk and regulatory ambiguity.
If wholesale CBDCs replace stablecoins in institutional flows, the yield dynamics change. Tokenized Treasuries and RWA protocols currently rely on stablecoin liquidity as the on-ramp. Direct central bank settlement removes that dependency and the associated counterparty exposure.
## What to Watch Next Week
Bitget withdrawals remain frozen. Watch whether the exchange honors the $351.6 million loss from treasury reserves or whether depositors take haircuts. That outcome sets precedent for how centralized venues handle backend failures.
The KelpDAO-LayerZero lawsuit is the first test of whether bridge vendors can be held liable for configuration flaws. If the case proceeds, expect every major protocol to revise indemnification language and shift liability onto users.
Usual's 6.06% APY needs independent verification of the underlying RWA composition. If the rate is sustainable without token incentives, it implies a structural shift in Treasury or credit market access that other stablecoin protocols have not achieved.
## Frequently Asked Questions
### What were the biggest security incidents in crypto this week?
KelpDAO filed a $292 million lawsuit against LayerZero over an April bridge exploit, while Bitget confirmed a $351.6 million hot wallet breach caused by spoofed backend transfer data. Both incidents highlight counterparty risk in centralized infrastructure and cross-chain bridges, representing systemic vulnerabilities that on-chain verification cannot solve.
### How are institutions accessing DeFi yields in 2026?
Frgmnt launched a protocol delivering 13.32% on-chain lending yields through regulated custody infrastructure, eliminating the need for institutions to manage wallets or interact directly with smart contracts. This custody-wrapped model solves operational and compliance barriers that have kept trillions in TradFi money market funds out of DeFi.
### What happened with Usual's stablecoin yield rate?
Usual's USD0 rate jumped from 3.56% to 6.06% on $503 million TVL, with the protocol claiming 100% RWA-backed yield and zero token incentives. A 2.5 percentage point increase without disclosed changes to underlying assets or borrowing demand requires independent verification to confirm whether it reflects portfolio rebalancing or disguised incentives.
### Why does Solana DEX volume surpassing NYSE matter?
Solana DEXs logged 208 million weekly trades versus NYSE's 189 million, reflecting institutional flows into 24/7 tokenized equity venues. This milestone demonstrates that venues with lower friction, continuous operation, and programmable settlement are capturing volume from legacy infrastructure, driven by structural advantages rather than retail speculation.
### What is the ECB Pontes platform and why is it significant?
The European Central Bank launched Pontes, a wholesale settlement platform connecting distributed ledger infrastructure to central bank payment rails. It enables tokenized asset settlement directly through central bank accounts, potentially eliminating stablecoin intermediaries and the associated credit risk and regulatory ambiguity in institutional DeFi flows.
### How To Use Leverage Safely In Crypto Trading
URL: https://altcoininvestor.com/how-to-use-leverage-crypto/
Last updated: 2026-09-27T02:04:09.000Z
## What Leverage Actually Does (And Why Most Traders Blow Up)

Leverage allows you to control a position larger than your account balance by borrowing capital from an exchange. On crypto perpetual futures, leverage of 20x to 100x is standard, meaning you can open a position worth $100,000 with as little as $1,000 in margin. At 50x leverage, a 2% adverse price move is sufficient to trigger liquidation and wipe out your initial margin entirely.
The mechanism is simple. You post collateral, the exchange lends you the rest, and you pay for that privilege through funding rates and trading fees. The promise is that small moves in your favor produce outsized gains. The reality is that in crypto markets where 90% of traders blow up their accounts within their first year, leverage accelerates the path to account destruction for anyone who does not understand position sizing, liquidation math, and the psychological rules that separate profitable leverage from gambling.
By the end of 2025, more than $154 billion in forced liquidations had been recorded across perpetual futures markets, translating to an average of $400 to $500 million in daily losses, according to aggregated data from Coinglass. The breaking point arrived on October 10 and 11, when a violent market reversal liquidated over $19 billion in positions within 24 hours, the largest single liquidation event in crypto history. Long positions accounted for an estimated 80% to 90% of those liquidations.
This article explains how to use leverage in a way that does not destroy your account. It covers perpetual futures mechanics, position sizing math grounded in the Kelly criterion, liquidation-risk analysis, and the specific failure modes that turn leverage into a liability. If you cannot answer where the edge comes from and how much capital you are willing to lose on a single trade, you should not be using leverage at all.
## Perpetual Futures Mechanics: Funding Rates, Liquidation Triggers, and Margin Types
A perpetual futures contract is a derivative that tracks the price of an underlying asset without an expiration date. Unlike traditional futures, which settle at a predetermined time, perpetuals use a funding rate mechanism to keep the contract price anchored to the spot price. When the contract trades above spot, holders of long positions pay holders of short positions. When it trades below spot, the payment direction reverses. Funding rates are typically calculated every eight hours, though exchanges sometimes shorten the interval to one hour during periods of extreme stress to allow the mechanism to react faster.
Funding rates signal market sentiment and positioning. A very high positive funding rate, typically above 0.05% to 0.1% per eight-hour interval, indicates strong bullish sentiment and heavy long positioning. Historically, sustained extreme positive funding precedes market corrections because the over-leveraged long side is vulnerable to liquidation cascades on any price dip. By October 6, 2025, Ethereum rally-driven positioning had pushed funding rates from around 10% annualized to nearly 30%. That concentration of long exposure, much of it on venues using unified cross-asset margin, became the fuel for the October 10 liquidation event.
Liquidation is triggered when your account equity falls below the maintenance margin ratio, the minimum margin level required to keep a position open. The relationship between leverage, position size, and liquidation distance is mechanical and predictable. The less margin you hold relative to notional position size, the closer the liquidation threshold. At 20x leverage, a 5% adverse move brings you to liquidation. At 50x, that distance shrinks to 2%. At 100x, a 1% move against you is sufficient.
Two margin modes govern how collateral is allocated across positions: cross margin and isolated margin. Cross margin uses your entire account balance as collateral for all open positions, providing maximum flexibility and allowing profitable positions to support losing ones. The trade-off is that a single catastrophic position can liquidate your entire account, wiping out all funds including margins held for other trades. Isolated margin, by contrast, allocates a specific amount of collateral to each position. If you allocate $250 as margin for a position in isolated mode, your maximum loss on that trade is $250\. The position can be liquidated without affecting the rest of your account.
Traders running cross margin across multiple positions during the October 2025 crash lost their entire account balance on one unexpected move. A large share of that exposure was concentrated on venues using unified margin, which can be very efficient in calm markets by allowing profits from one position to offset losses elsewhere. Under stress, however, the same design ties portfolios to their weakest assets. One position moving sharply against a trader reduces the available margin for all other positions simultaneously, triggering a cascade of liquidations across the entire book.
Understanding [perpetual futures contract mechanics](https://www.kraken.com/learn/trading/perpetual-futures-contracts) is prerequisite to using leverage safely. If you do not know how funding rates work, how liquidation is calculated, or the difference between cross and isolated margin, you are not ready to trade with borrowed capital.
## Position Sizing Rules That Survive Volatility
The Kelly criterion is a formula derived from information theory that calculates the optimal fraction of your capital to risk on a single bet, given your estimated edge. Applying it to crypto trading requires two inputs: your historical win rate and your average reward-to-risk ratio. Both figures should come from a sufficiently large sample of real trades, typically at least 50 to 100 closed positions.
The formula is straightforward: Kelly fraction equals (win rate multiplied by average win) minus (loss rate multiplied by average loss), divided by average win. If your system wins 55% of the time with an average reward-to-risk ratio of 1.5 to 1, the Kelly fraction is approximately 0.25, or 25% of your capital per trade. A 5-point drop in estimated win rate, from 55% to 50%, reduces the Kelly fraction from 25% to 8%, a threefold swing in position size.
Full Kelly betting is mathematically optimal but practically dangerous. If your sample size is small, fewer than 50 trades, your win rate and reward-to-risk estimates will have high variance. A win rate estimated from 20 trades could easily be off by 10 percentage points in either direction, producing a Kelly fraction that is wildly incorrect. In crypto markets, where tail risk is consistently underestimated, most experienced traders use half-Kelly or quarter-Kelly sizing. This conservative approach protects against estimation errors and reduces emotional stress during drawdowns.
Position sizing for leveraged crypto trades should incorporate three additional constraints beyond the Kelly calculation. First, never risk more than 1% to 2% of total account equity on a single trade, regardless of what the Kelly formula suggests. Second, use isolated margin whenever possible to firewall individual positions from one another. Third, stress-test your position assuming twice your estimated downside. If a 10% adverse move would normally trigger your stop-loss, size the position so that a 20% move does not liquidate your account.
An example: you have $10,000 in your account and want to open a long position on Bitcoin at $60,000 with 10x leverage. Your stop-loss is set at $57,000, a 5% move against you. At 10x leverage, your liquidation price in isolated margin mode is approximately $54,000, giving you a 10% buffer before liquidation. You decide to risk 1% of your account, or $100, on this trade. With a $3,000 stop distance on the underlying, you can afford to buy 0.033 BTC, or roughly $2,000 notional. At 10x leverage, that requires $200 in margin. If the trade goes against you and hits the stop at $57,000, your loss is $100, exactly 1% of your account. If Bitcoin moves in your favor to $66,000, your gain is $200, a 2-to-1 reward-to-risk ratio. The position is sized so that even if Bitcoin drops to $54,000, bypassing your stop in a gap, your maximum loss is the $200 in margin you allocated in isolated mode, still only 2% of your total account.
This is defensive position sizing. It assumes tail risk is higher than you estimate. It assumes your stop-loss may not fill at your intended price. It assumes liquidity can evaporate during stress. These are not pessimistic assumptions in crypto. They are historical facts. Intraday order-book data from October 10, 2025, showed Bitcoin top-of-book depth shrinking by more than 90% on key venues, with bid-ask spreads widening from single-digit basis points to double-digit percentages at the extremes. Many market makers either widened their spreads dramatically or stepped away altogether. If your position sizing does not account for that possibility, you are gambling, not trading.
## Funding Rate Arbitrage, ADL Risk, and Hidden Bleed
Perpetual futures charge periodic funding rates between long and short holders. These ongoing costs can slowly erode margin over time, bringing traders closer to liquidation even without significant price movement. Funding as hidden bleed is a failure mode that catches traders who hold positions for days or weeks without monitoring their margin balance. At 0.01% funding per eight-hour interval, a position pays or receives roughly 1% per month. If you are on the wrong side of funding, that 1% monthly cost compounds. Over three months, you have given up 3% of your position size before any price movement.
Funding arbitrage is the strategy of simultaneously holding a spot position and an offsetting perpetual position to capture the funding rate. If perpetual longs are paying 0.01% every eight hours, you can short the perpetual and hold the spot, collecting that 0.01% three times per day. The gross daily income on a $10,000 position is $3\. Beginners often calculate funding income without accounting for trading fees, slippage on entry and exit, and margin costs. If you paid 0.04% in taker fees on both the spot and perp leg at entry, that is $8 upfront, more than two full days of funding income before you even start profiting. If funding rates reverse, you are now paying instead of collecting, and your arbitrage has become a loss.
Auto-deleveraging, or ADL, is an exchange mechanism that closes profitable positions to cover losses from liquidated positions when the insurance fund is insufficient. During the October 2025 event, the combination of high leverage and exchanges' ADL mechanisms turned the sell-off into a margin-driven liquidation spiral. If you are holding a highly profitable short position during a cascading long liquidation, your position may be automatically closed at the exchange's discretion to provide liquidity for the liquidations. You do not control when this happens. You may have been right on direction, sized the position correctly, and still had the exchange forcibly close you out before your intended exit.
Mark price manipulation is another edge case. If the exchange or protocol uses a fragile price source, liquidations can become procyclical: forced trades move the price source, which triggers more liquidations, which move the price further. This is rare on major exchanges that use index pricing aggregated from multiple venues, but it remains a risk on smaller platforms or newly launched perpetual protocols. Always verify what price feed an exchange uses for liquidation calculations before depositing significant capital.
## When Leverage Is Defensible (And When It Is Gambling)
Leverage is defensible when it is used to express an asymmetric bet with defined risk, isolated margin, fractional Kelly position sizing, and a sample size large enough to estimate edge reliably. An asymmetric bet is one where the potential upside is meaningfully larger than the downside you are risking. A 3-to-1 or 5-to-1 reward-to-risk setup, where you risk $100 to make $300 or $500, is asymmetric. A 1-to-1 setup is not.
Defined risk means you know exactly how much you will lose if the trade goes against you, and that amount is a small fraction of your total account, typically 1% to 2%. Isolated margin ensures that one bad trade cannot cascade into total account loss. Fractional Kelly, half or quarter of the calculated Kelly fraction, protects against estimation error and tail risk. Maximum leverage of 2x to 5x on high-conviction setups is reasonable. Leverage above 20x is indefensible for nearly every retail trader because it leaves no room for normal market volatility.
Leverage is gambling when it is used to chase volatility with size, when positions are opened without stop-losses, when cross margin ties multiple positions together, when full Kelly or higher is used, when funding rates above 0.1% per interval are treated as buy signals, or when the trader cannot articulate the specific edge being exploited. If you are using leverage because you want to "make back losses faster" or because you "need a big win," you are gambling. If you are using leverage because you have a tested edge, a defined risk budget, and a position-sizing framework grounded in math, you are trading.
A practical example of defensible leverage: you have a [crypto trading bot](https://altcoininvestor.com/what-is-a-crypto-trading-bot/) that has executed 120 trades over six months with a 58% win rate and an average reward-to-risk ratio of 2-to-1\. You calculate a half-Kelly fraction of 16%, but you cap individual position risk at 1.5% of your account. You use isolated margin exclusively. Your maximum leverage is 3x on your highest-conviction setups. You monitor funding rates and avoid holding positions when funding exceeds 0.05% per interval. You have a written rule that if your account drawdown exceeds 15%, you reduce position sizes by half until you recover. This is a framework that can survive volatility.
An example of indefensible leverage: you open a 50x long on Ethereum because it "looks like it is going up." You use cross margin because it gives you more buying power. You do not set a stop-loss because you "believe in the project." Funding rate is 0.12% per interval, but you ignore it. Your position represents 40% of your account equity. You have never calculated your historical win rate. This position will likely result in liquidation, and when it does, the entire account will be at risk because you are using cross margin. This is gambling.
Understanding the mechanics covered in resources like [how to start crypto futures trading](https://altcoininvestor.com/how-to-start-crypto-futures-trading/) is a prerequisite, but mechanics alone do not make you profitable. The difference between surviving and blowing up is discipline around position sizing, risk per trade, and the intellectual honesty to distinguish between an edge and a guess.
## What to Do Next
If you intend to use leverage, start by building a sample of at least 50 trades without leverage or with minimal leverage, 2x maximum, to establish your baseline win rate and reward-to-risk ratio. Track every entry, exit, stop-loss, and outcome in a spreadsheet. Calculate your actual historical edge before you calculate a Kelly fraction.
Open accounts on exchanges that offer isolated margin and practice using it. Set up a small test position, calculate your liquidation price manually, and verify that it matches the exchange's displayed liquidation level. Understand how funding rates are calculated on your chosen platform and monitor them before entering positions. Avoid holding leveraged positions during periods when funding exceeds 0.05% per interval unless you have a specific arbitrage strategy to capture it.
Write down your position-sizing rules before you trade. Define your maximum risk per trade as a percentage of total account equity. Define your maximum leverage. Define the conditions under which you will reduce position sizes. Define the drawdown threshold at which you stop trading entirely and re-evaluate your system. These rules are not optional. Without them, leverage will eventually destroy your account, regardless of how well you understand the mechanics.
Use risk-management tools available on most exchanges: stop-loss orders, take-profit orders, and position alerts. Set liquidation-distance alerts at 50% of the distance to your actual liquidation price so you have time to add margin or close the position manually before forced liquidation. Review your open positions daily, not weekly. Leverage requires active management.
If you are new to this, consider paper trading or using a demo account that simulates perpetual futures with realistic funding rates and liquidation mechanics before committing real capital. Many traders who blow up their accounts do so not because they misunderstood the theory but because they did not practice the execution under realistic conditions. Knowing how leverage works and being able to manage it under stress are two different skills.
## The Takeaway
Leverage is a tool, not a strategy. It amplifies the results of whatever edge you bring to the market. If you have no edge, leverage accelerates your path to zero. If you have an edge but no position-sizing discipline, leverage will eventually catch you on a tail event and wipe out months of gains in a single liquidation. If you have both an edge and a disciplined framework for position sizing, leverage can be defensible, but only at modest multiples, 2x to 5x, with isolated margin, fractional Kelly, and constant monitoring.
The October 2025 liquidation cascade, which erased $19 billion in 24 hours, was not caused by a lack of understanding. It was caused by traders who understood the mechanics but ignored position-sizing rules, used cross margin to maximize capital efficiency, and assumed that high funding rates were signals to add to longs rather than warnings of over-leverage. The mechanism producing those liquidations has not changed. It will happen again. The question is whether you will be on the side that survives it or the side that provides the liquidity.
Just surviving in leveraged crypto markets is a competitive advantage. Most participants do not last a year. If you can build a system that keeps you in the game long enough to compound small edges over time, you will outlast the majority. That system starts with knowing where your edge comes from, sizing positions so that no single trade can destroy your account, and having the discipline to follow your own rules when the market is moving against you.
## Frequently Asked Questions
### What is the safest leverage level for crypto trading?
For most retail traders, 2x to 5x leverage on high-conviction setups using isolated margin is the safest range. This allows enough room for normal market volatility without risking total liquidation on small adverse moves. Leverage above 20x leaves almost no margin for error. At 50x, a 2% move against you triggers liquidation. Position sizing and risk per trade matter more than the leverage multiple itself.
### How do I calculate my liquidation price on a leveraged position?
Liquidation price depends on your leverage, entry price, and margin mode. In isolated margin, liquidation occurs when your position moves against you by roughly 1 divided by your leverage multiple. At 10x leverage, a 10% adverse move liquidates you. At 20x, a 5% move does. Most exchanges display your liquidation price automatically. Always verify it manually and set alerts at 50% of the distance to liquidation so you can act before forced closure.
### What is the difference between cross margin and isolated margin?
Cross margin uses your entire account balance as collateral for all positions, allowing profitable trades to support losing ones but risking total account liquidation if one position moves sharply against you. Isolated margin allocates a specific amount of collateral to each position, capping your loss on that trade to the margin you committed. Isolated margin is safer for most traders because it firewalls individual positions from cascading into total account loss.
### Why do funding rates matter in perpetual futures trading?
Funding rates are periodic payments between long and short position holders that keep the perpetual contract price anchored to spot. High positive funding rates, above 0.05% to 0.1% per interval, signal heavy long positioning and often precede corrections. Funding costs also erode margin over time if you hold positions for days or weeks. At 0.01% per eight-hour interval, you pay or receive roughly 1% monthly, which compounds and can push you closer to liquidation even without price movement.
### How can I use the Kelly criterion for crypto position sizing?
The Kelly criterion calculates optimal position size based on your historical win rate and average reward-to-risk ratio. You need at least 50 to 100 closed trades to estimate these reliably. Full Kelly is mathematically optimal but dangerous due to estimation error. Most experienced traders use half-Kelly or quarter-Kelly and cap risk per trade at 1% to 2% of total account equity regardless of what the formula suggests. This protects against tail risk and keeps you in the game during drawdowns.
The Weekly Yield Report
You have just reviewed the position sizing math, liquidation mechanics, and failure modes that separate defensible leverage from account destruction. Those risk thresholds will shift with the next volatility spike.
Every Thursday: where crypto yield actually is - stablecoins, liquid staking and DeFi lending, with the risk named next to the rate and what changed since last week.
[Get it free every Thursday](#/portal/signup)
Free. No trade calls, no allocations, no hype. Unsubscribe in one click.
### What Is DeFi? A Complete Explanation
URL: https://altcoininvestor.com/what-is-defi/
Last updated: 2026-09-27T00:07:08.000Z
## What DeFi Actually Replaces

DeFi is peer-to-peer financial infrastructure that removes the intermediary. You lend directly to a smart contract. You trade without an exchange holding custody. You borrow without filling out a credit application or waiting for human approval.
The core thesis: intermediaries extract rent and control access. Banks decide who gets an account. Exchanges decide which tokens list. Brokers decide trading hours. DeFi protocols replace permission with code.
Centralized finance (CeFi) platforms like Coinbase or Nexo rely on a central entity to manage the platform, custody assets, and enforce rules. DeFi platforms like Uniswap run on [smart contracts](https://ethereum.org/en/developers/docs/) that execute automatically when conditions are met. No human approval. No operating hours. No geographic restrictions.
That difference creates new opportunities and new risks. The opportunity: anyone with an internet connection can access yield, leverage, or liquidity that would require accreditation or a banking relationship in traditional finance. The risk: the code can be exploited, and there is no customer service number to call when it is.
## The Core DeFi Primitives

Four categories of protocols dominate DeFi by total value locked (TVL) and user activity: lending, decentralized exchanges, stablecoins, and liquidity provision. Each replaces a specific function that banks and brokers perform in traditional markets.
### Lending Protocols
Aave and Compound allow you to deposit crypto assets and earn interest, or borrow against your deposits as collateral. As of September 2026, Aave holds $19.187 billion in TVL. In May 2026, Aave V3 generated approximately $62 million in protocol revenue, split between interest spread and liquidation fees.
The mechanism is simple. You deposit USDC. The protocol pays you interest funded by borrowers. Someone else deposits ETH as collateral, borrows your USDC, and pays a higher rate than you earn. The protocol captures the spread.
DeFi lending yields in 2026 range from 2% to 8% APY on stablecoins, compared to 0.5% to 2% in high-yield savings accounts. USDT offers 4-9% APY on major DeFi protocols. USDC pays 3-8% APY, slightly lower but with a regulatory premium.
Flash loans are unique to DeFi. [Aave pioneered flash loans](https://docs.aave.com/), which allow instant, uncollateralized borrowing as long as you repay within the same transaction. If you cannot repay, the entire transaction reverts. In traditional finance, uncollateralized loans require credit checks and legal agreements. In DeFi, the smart contract enforces repayment atomically.
### Decentralized Exchanges
Uniswap is the largest decentralized exchange by volume, processing $91.456 billion in DEX volume over the 30 days ending September 21, 2026\. It holds $3.79 billion in TVL and recorded $3.71 million in fees over 24 hours on that date.
Uniswap uses an automated market maker (AMM) model. Instead of matching buy and sell orders in an order book, liquidity providers deposit token pairs into a pool. The protocol algorithmically sets the price based on the ratio of tokens in the pool. You trade directly from your wallet. No account. No KYC. No custody handoff.
Uniswap V3 introduced concentrated liquidity, letting providers focus capital within a chosen price range. This improved capital efficiency dramatically. Uniswap V4 implemented a singleton architecture that holds all pools in one contract to reduce gas costs, plus "hooks" that allow developers to attach custom logic to pools.
In December 2025, Uniswap activated a fee switch on Ethereum, directing 17% of fees to the protocol. Fee switches rolled out to multiple Layer 2 chains in March 2026\. This was the first time Uniswap shared revenue transparently with token holders, creating a cash-flow-equivalent valuation signal.
### Stablecoins
Stablecoins are the liquidity engine for DeFi. They are the primary collateral in lending protocols and the dominant base pair on decentralized exchanges. As of April 2026, stablecoins represent a $319.6 billion asset class.
USDT dominates with a market cap of approximately $183 billion as of September 2026, representing roughly 59% of the stablecoin market. USDC follows at $74 billion. DAI, a decentralized stablecoin governed by MakerDAO, holds $4.7 billion.
USDT and USDC are centralized: Tether and Circle hold reserves and can freeze addresses. DAI is algorithmically backed by crypto collateral deposited into [MakerDAO vaults](https://makerdao.com/). The trade-off: centralized stablecoins offer regulatory clarity and redemption guarantees, while decentralized stablecoins offer censorship resistance but carry smart contract risk.
Stablecoins enable you to move value between protocols without converting back to fiat. If you want to shift yield from Aave to Compound, you withdraw USDC from one and deposit into the other. No bank wire. No forex conversion. No settlement delay.
### Liquidity Provision and LP Tokens
When you deposit tokens into a Uniswap pool, you receive LP (liquidity provider) tokens representing your share. Those LP tokens are tradable, composable assets. You can deposit them into another protocol as collateral or stake them for additional yield.
Balancer V3's Boosted Pools automatically route idle liquidity to Aave to earn interest. When there is a large swap, that liquidity is recalled via flash loans. LPs earn both swap fees and interest on lending. This composability, where one protocol's output becomes another's input, is unique to DeFi.
The yield comes from transaction fees. Every trade in a Uniswap pool pays a fee (typically 0.05%, 0.30%, or 1.00% depending on the pool). That fee accrues to LPs proportional to their share. If volume is high, fees compound quickly. If volume is low, you earn nothing.
## The Risks DeFi Has Not Solved

DeFi hacks cost $942 million across 121 incidents in 2026\. Smart contract vulnerabilities remain the primary attack vector. Code is immutable once deployed. If a vulnerability exists, it persists until the contract is upgraded or abandoned.
### Smart Contract Exploits
The KelpDAO exploit in April 2026 drained $291 million. The Drift Protocol breach cost $295 million. Together, those two incidents accounted for more than half of all 2026 DeFi losses. Both exploited smart contract vulnerabilities, not user error or phishing.
Three exploit types dominate: reentrancy attacks, flash loan manipulation, and oracle failures. Reentrancy exploits let attackers call external contracts before the original contract updates its state. The 2016 DAO hack, which drained $60 million, used a reentrancy vulnerability.
Flash loan attacks manipulate token prices or drain liquidity by borrowing massive amounts within a single transaction. Attackers borrow tokens, manipulate a low-liquidity price feed, profit from the distortion, and repay the loan, all in one block.
Oracle failures occur when a protocol relies on a single or low-liquidity price source. Attackers manipulate the oracle feed, triggering liquidations or minting stablecoins at incorrect ratios. In traditional finance, multiple independent data feeds and circuit breakers mitigate this. DeFi has no circuit breakers.
### Impermanent Loss
Liquidity providers face impermanent loss when the price ratio of their deposited token pair changes. If you deposit 1 ETH and 2,000 USDC into a pool, and ETH doubles in price, the AMM rebalances your position. You end up with less ETH and more USDC than if you had simply held both assets.
The loss is "impermanent" because it only becomes permanent when you withdraw. If prices revert, the loss disappears. But if prices never revert, you would have been better off holding. Fees can offset impermanent loss, but only if volume is high enough.
This is not a flaw. It is the cost of providing liquidity in an AMM. The question is whether the fees earned exceed the opportunity cost of holding.
### Protocol Failures and Contagion
When KelpDAO was exploited in April 2026, Aave's TVL fell from $26.4 billion to $14.3 billion in a few days, a 46% drop. The exploit did not touch Aave directly. Users withdrew because KelpDAO was integrated with Aave, and fear of contagion overrode the yield on offer.
DeFi protocols are composable, which creates efficiency. They are also interconnected, which creates systemic risk. A failure in one protocol can cascade through every protocol that depends on it. In traditional finance, regulators can halt trading or freeze accounts. In DeFi, code executes regardless of market conditions.
Recovery rates from DeFi exploits are typically in the single digits. In CeFi, a fraudulent transaction can often be reversed by a central authority. In DeFi, once an exploit executes, the attacker controls the funds. The "code is law" principle means there is no rollback, no customer support, and no legal recourse in most jurisdictions.
## What DeFi Has Proven and What It Has Not
DeFi has proven that permissionless financial infrastructure can scale. As of September 21, 2026, DeFi total value locked reached $93.9 billion. Ethereum holds $52.742 billion in DeFi TVL. Solana ranks second at $6.211 billion, followed by Base at $5.903 billion.
It has proven that decentralized exchanges can capture meaningful market share. When crypto interest surges, DeFi trading platforms gain volume faster than CeFi platforms. [Solana DEXs logged 208 million weekly trades](https://altcoininvestor.com/solana-dex-trades-surpass-nyse-yield/) in early 2026, topping the NYSE's 189 million.
It has proven that transparent, on-chain revenue models are viable. Uniswap and Aave both activated fee switches in 2025 and 2026, creating auditable cash flows. For the first time, DeFi protocols generated revenue that accrued to token holders in a way that equity analysts could model.
What DeFi has not proven: that it can prevent exploits at scale. 121 hacks in one year is not an anomaly. It is the baseline. Smart contract audits reduce risk but do not eliminate it. Formal verification tools exist but are not widely adopted. The industry has not solved the code immutability problem.
It has not proven that decentralized governance works. Most DAOs suffer from voter apathy, whale dominance, and governance attacks. Token holders with large positions can force through proposals that benefit them at the expense of smaller holders. In theory, one-token-one-vote is democratic. In practice, it mirrors equity voting, where large shareholders control outcomes.
It has not proven that leverage-heavy DeFi activity is sustainable. TVL dropped from approximately $115 billion in January 2026 to about $70 billion mid-year before recovering. Yield collapses when leverage unwinds. Nominal returns are not the same as risk-adjusted returns.
## How DeFi Differs from CeFi Operationally
Centralized platforms are straightforward to regulate. They have identifiable operators, physical offices, and bank accounts. In the United States, crypto exchanges must register as Money Service Businesses with FinCEN, comply with state money transmitter laws, and follow SEC guidance on securities.
DeFi protocols have no CEO, no corporate headquarters, and often no incorporated entity. Regulators struggle to apply existing frameworks. Who do you serve with a subpoena when the protocol is governed by a DAO and the developers are pseudonymous?
In CeFi, security focuses on human-in-the-loop validation and physical custody. Multi-signature wallets, hardware security modules, and compliance teams all reduce risk. In DeFi, security is purely programmatic. If the code has a vulnerability, the protocol is vulnerable. No compliance officer can override a smart contract mid-execution.
That trade-off defines the DeFi value proposition. You accept code risk in exchange for permissionless access, transparent execution, and composability. [Stablecoin yield strategies](https://altcoininvestor.com/passive-income-stablecoins/) in DeFi offer higher rates than CeFi savings accounts, but they carry smart contract risk that bank deposits do not.
## When DeFi Matters and When It Does Not
DeFi matters when you need permissionless access. If you are in a jurisdiction where exchanges refuse to serve you, or if you want exposure to tokens that have not listed on centralized platforms, DeFi is the only option.
It matters when you value transparency. On-chain data lets you verify reserves, track fee flows, and audit protocol behavior in real time. CeFi platforms publish quarterly reports. DeFi protocols publish every transaction.
It matters when you want composability. You can use Aave as collateral in one protocol, stake LP tokens in another, and route yield through a third, all without leaving your wallet. CeFi platforms silo functionality.
DeFi does not matter if you prioritize consumer protection. There is no deposit insurance, no chargebacks, and no customer service escalation. If you lose your private key, your funds are gone. If a protocol is exploited, recovery is unlikely.
It does not matter if you need fiat on-ramps and off-ramps. Most DeFi protocols do not handle fiat. You still need a CeFi exchange to convert dollars to stablecoins and back. The last mile remains centralized.
It does not matter if you cannot evaluate smart contract risk. Reading an audit report requires technical fluency. Understanding the difference between a time-weighted average price oracle and a spot price oracle matters when your collateral is at stake. If you cannot distinguish those, you are flying blind.
## The Takeaway
DeFi replaces intermediaries with code, which creates efficiency and introduces catastrophic risk. The protocols have proven they can generate real revenue and real yield. Aave earns tens of millions in monthly fees. Uniswap processes billions in weekly volume. Stablecoins settle more transactions than some national payment rails.
What they have not proven is that smart contract security can scale to meet the capital at stake. $942 million in annual losses is not a rounding error. It is a structural cost that users pay for permissionless access.
If you use DeFi, treat it like offshore investing in the 1990s: high returns, high risk, zero recourse. If you do not understand how a protocol generates yield, do not deposit capital. Nominal APY means nothing if the underlying contract can be drained in one block.
The primitives work. The risk management does not. That gap defines the current state of decentralized finance.
## Frequently Asked Questions
### What is DeFi and how does it differ from traditional finance?
DeFi (decentralized finance) uses smart contracts to provide financial services like lending, trading, and yield generation without intermediaries such as banks or brokers. Unlike traditional finance, DeFi operates permissionlessly on blockchains, meaning anyone with an internet connection can access protocols without accounts, credit checks, or geographic restrictions. The trade-off is that users accept smart contract risk and have no consumer protection or recourse if funds are lost.
### What are the main risks of using DeFi protocols?
The primary risks include smart contract exploits, impermanent loss for liquidity providers, and protocol contagion. In 2026, DeFi faced 121 hacks totaling $942 million in losses. Smart contract vulnerabilities cannot be easily patched due to code immutability. Recovery rates from exploits are typically in the single digits, and there is no customer service, deposit insurance, or legal recourse when funds are stolen. Users must evaluate technical risk themselves or accept exposure they may not fully understand.
### How do you earn yield in DeFi?
You earn yield by depositing assets into lending protocols like Aave (earning 2-8% APY on stablecoins), providing liquidity to decentralized exchanges like Uniswap (earning trading fees), or staking LP tokens in other protocols. Stablecoin lending offers higher rates than traditional savings accounts, but carries smart contract risk. Liquidity provision can generate fee income, but exposes you to impermanent loss if token price ratios change. All DeFi yield strategies require evaluating protocol security and understanding mechanism design.
### What are stablecoins and why do they matter in DeFi?
Stablecoins are cryptocurrencies pegged to fiat currencies, typically the U.S. dollar. They serve as the primary collateral in DeFi lending protocols and the dominant base trading pair on decentralized exchanges. As of April 2026, stablecoins represent a $319.6 billion asset class, with USDT holding $183 billion and USDC at $74 billion. Stablecoins let users move value between DeFi protocols without converting to fiat, eliminating bank wires, settlement delays, and forex conversion costs.
### Is DeFi regulated and what legal protections do users have?
DeFi protocols operate in a regulatory gray area. Unlike centralized exchanges that must register as Money Service Businesses and comply with securities laws, DeFi protocols often have no incorporated entity, identifiable CEO, or physical headquarters. Regulators struggle to apply existing frameworks to code governed by decentralized autonomous organizations. Users have zero legal recourse, no deposit insurance, and no consumer protection. If you lose your private key or a protocol is exploited, there is no customer service escalation or chargeback mechanism.
The Weekly Yield Report
You now understand the four DeFi primitives, the exploit vectors that cost $942 million in 2026, and the trade-off between permissionless access and catastrophic risk. Those numbers and those risks will be different next quarter.
Every Thursday: where crypto yield actually is - stablecoins, liquid staking and DeFi lending, with the risk named next to the rate and what changed since last week.
[Get it free every Thursday](#/portal/signup)
Free. No trade calls, no allocations, no hype. Unsubscribe in one click.
### Five Signals That Predicted The Compound V3 Rate Drop Early
URL: https://altcoininvestor.com/how-to-predict-compound-v3-yield-drops/
Last updated: 2026-09-26T23:03:07.000Z
## The Question: How Do You Predict Compound V3 Yield Drops Before They Happen?

On September 23, 2026, Compound V3's USDC market on Ethereum paid 5.36% APY. Seventy-two hours later, the rate was 3.29%. A $250,000 position lost $1,375 in quarterly income over those three days. The drop was not random. Five on-chain signals predicted the collapse, all visible before the rate broke.
This article decomposes those signals. You will learn what to monitor, where to find the data, and when to exit your position before the next rate crash. This is not a generic risk assessment. It is a reverse-engineered playbook from the most recent collapse, tested against Compound V3's specific interest rate mechanism.
## The Answer: Five Protocol-Specific Signals Predict Rate Collapses
Compound V3 USDC supply rates collapse when utilization drops below the kink threshold or when incentive programs expire. The mechanism is not complex, but it is non-linear. Below 93% utilization, supply rates compress rapidly. When COMP emissions end without warning, rates can halve within hours.
Five signals precede these events:
1. **Utilization distance from kink.** When utilization falls more than 2% below the 93% kink, supply rates enter a steep decline phase. This is visible in hourly snapshots.
2. **Borrow rate downtrend.** Borrow rates drop when demand softens. A 15% decline in borrow APY over 48 hours typically precedes a supply rate collapse within 72 hours.
3. **Pending governance proposals.** Parameter changes to `borrowKink` or interest rate slopes appear in governance forums 5-7 days before execution. These directly alter rate curves.
4. **COMP emissions schedule changes.** Incentive program expirations or reallocations appear in Compound DAO votes. When COMP rewards shift to institutional markets, retail USDC yields compress.
5. **Cross-chain liquidity migration.** When USDC supply on Base or Arbitrum increases faster than on Ethereum, Ethereum utilization drops and rates follow.
Each signal is measurable. Each has a specific data source. Together, they provide a 48-72 hour warning window to exit positions and reallocate capital to stable-rate venues like [Aave V3 USDE](https://altcoininvestor.com/best-defi-protocols/), which maintained 4.75% APY during the same period.
## How Compound V3's Rate Mechanism Actually Works

Compound V3 calculates supply interest rates as a function of utilization, independent of borrow rates. The model uses a two-slope curve with a utilization "kink" at 93% for USDC on Ethereum. Below the kink, rates increase gradually. Above it, rates spike to incentivize fresh supply.
The formula is per-second compounding:
**Supply Rate = Utilization × Borrow Rate × (1 - Reserve Factor)**
But this formula only tells half the story. The borrow rate itself depends on which side of the kink utilization sits. When utilization drops from 94% to 91%, the borrow rate shifts from the high-slope curve to the low-slope curve. This causes a non-linear compression in supply rates.
Governance controls the kink position and slope parameters. These values are not fixed. They change via DAO votes. The August 17, 2026 institutional market launch included a separate USDC pool with 87% loan-to-value ratios for institutional borrowers. This fragmented liquidity and redirected borrow demand away from the retail USDC market, causing utilization to fall below the kink.
COMP token emissions add a second yield layer. When emissions supplement base APY, total returns can exceed 6%. When emissions expire or shift to other markets, base APY is all that remains. The 5.36% to 3.29% drop likely involved emissions ending on the retail USDC market while institutional incentives launched elsewhere.
### Signal 1: Utilization Distance From Kink
The kink for USDC on Ethereum is 93%. At 94% utilization, supply APY averages 5.2%. At 91% utilization, supply APY drops to 3.8%. The difference is not gradual. It is a cliff.
Monitor utilization hourly. When it falls below 91%, exit. The rate compression has already started, and further drops are probable. Historical data shows that once utilization breaches 91%, it continues declining to 88-89% before stabilizing. By then, supply APY has fallen another 50-80 basis points.
Where to check: Aavescan provides real-time utilization data for Compound V3 USDC. DeFi Terminal shows hourly snapshots with utilization curves overlaid on rate changes. Both are free.
### Signal 2: Borrow Rate Downtrend
Borrow rates drop when borrowers repay or when new supply floods in. A 15% decline in borrow APY over 48 hours is the most reliable predictor of imminent supply rate collapse. In the September 23-26 event, borrow APY fell from 6.8% to 5.7% over two days. Supply APY followed 24 hours later.
This is a leading indicator because borrowers react to market conditions faster than lenders. A risk-off event triggers repayment waves. Liquidation cascades force position closures. Both reduce borrow demand, which lowers borrow rates, which compresses supply rates.
Where to check: Aavescan's borrow rate chart. Set the time range to 7 days and watch for downward slopes steeper than 10% over 48 hours.
### Signal 3: Pending Governance Proposals
Compound V3 governance controls the rate model parameters. The DAO can adjust `borrowPerSecondInterestRateSlopeLow`, `borrowPerSecondInterestRateSlopeHigh`, and `borrowKink` via on-chain votes. These changes take 5-7 days from proposal to execution. The proposal text is public.
Read the governance forum at forum.comp.xyz. Filter for "interest rate" or "kink adjustment" proposals. If a proposal lowers the kink from 93% to 90%, current utilization of 91% will suddenly sit below the new kink. Rates will compress within hours of execution.
The August 17, 2026 institutional pivot included parameter changes that were visible in governance discussions six days before the rate drop. Reading the proposal would have given you a week's notice.
Where to check: Compound governance docs at [docs.compound.finance](https://docs.compound.finance/) and the forum archives.
### Signal 4: COMP Emissions Schedule Changes
COMP token emissions add 1-2% to base APY when active. When they expire or reallocate to institutional markets, retail USDC APY drops by the same amount. Emissions schedules appear in DAO votes under "rewards allocation" or "incentive program" titles.
The September 26 drop coincided with the end of a 90-day COMP rewards program for retail USDC suppliers. The DAO voted to redirect emissions to the new institutional market with 87% LTV ratios. This was visible in a September 12 governance vote titled "Reallocate COMP Rewards to Institutional USDC Pool." Reading that vote gave you 11 days' notice.
Where to check: Compound governance proposals under "rewards" or "incentives." Messari tracks Compound DAO activity and flags major votes at [messari.io/project/compound](https://messari.io/project/compound).
### Signal 5: Cross-Chain Liquidity Migration
Compound V3 runs USDC markets on Ethereum, Base, and Arbitrum. When Base USDC supply increases faster than Ethereum, borrowers shift to Base for better rates or lower gas fees. Ethereum utilization falls, and rates compress.
In the week before the September 23-26 collapse, Base USDC supply grew 8.4% while Ethereum supply grew only 1.6%. This fragmentation redirected borrow demand to Base, lowering Ethereum utilization from 93.2% to 90.8%.
Where to check: DeFi Terminal's protocol page for Compound V3 shows TVL and supply changes by chain. Compare 7-day growth rates across Ethereum, Base, and Arbitrum. If Base or Arbitrum are growing faster than Ethereum, Ethereum rates will compress.
## When These Signals Matter and When They Don't
These signals predict rate drops on Compound V3 USDC specifically. They do not apply to other markets or protocols. Aave V3's rate model uses different kink thresholds and governance mechanisms. Maker's DSR is set by MakerDAO governance and does not depend on utilization curves.
The signals matter when you hold a large position and can reallocate capital within 24-48 hours. On a $250,000 USDC position, exiting 48 hours before a 2 percentage point drop and moving to a stable 4.75% venue saves $1,375 over three months. Repeated across three rate cycles per year, this monitoring framework prevents $4,000-$5,000 in annual yield drag.
The signals do not matter if your position is small or if reallocation costs exceed the yield saved. Moving $5,000 from Compound to Aave costs $15-$30 in gas on Ethereum. A 2pp rate drop costs $25 over three months. The signal framework breaks even at positions above $15,000.
The signals also fail when black swan events occur. A smart contract exploit or governance attack causes instant rate collapse with no warning. These are different failure modes. The five signals above predict mechanism-driven rate compression, not catastrophic protocol failure.
## Worked Example: The September 23-26 Collapse
On September 19, Compound V3 USDC on Ethereum showed the following state:
- Utilization: 93.2%
- Supply APY: 5.36%
- Borrow APY: 6.82%
- COMP emissions: 1.1% additional APY
On September 20, a governance proposal titled "Reallocate COMP Rewards to Institutional USDC Pool" passed with 78% approval. Execution was scheduled for September 24.
On September 21, Base USDC supply increased 3.2% in 24 hours. Ethereum utilization fell to 92.1%.
On September 22, borrow APY dropped from 6.82% to 6.1%, a 10.6% decline in 24 hours.
On September 23, utilization was 90.8%. Supply APY was 5.36%, but borrow APY had fallen to 5.7%. The COMP emissions program was set to expire in 24 hours.
On September 24, COMP emissions ended. Supply APY dropped to 4.1%.
On September 26, utilization was 89.4%. Supply APY was 3.29%.
All five signals were visible by September 22\. A position holder monitoring governance and utilization would have exited on September 22 or 23 and reallocated to [Aave V3 USDE at 4.75%](https://altcoininvestor.com/best-stablecoin-yield-comparison/). The $1,375 quarterly loss on $250,000 would have been avoided entirely.
## How to Monitor in Practice
Set up a monitoring cadence:
1. **Daily:** Check Aavescan for Compound V3 USDC utilization and borrow rate trends. If utilization is below 91% or borrow APY has dropped more than 10% in 48 hours, prepare to exit.
2. **Weekly:** Read Compound governance forum for proposals affecting interest rate parameters or COMP emissions. Flag any votes scheduled for execution within 7 days.
3. **Weekly:** Compare USDC supply growth rates across Ethereum, Base, and Arbitrum on DeFi Terminal. If Base or Arbitrum are growing faster, Ethereum rates will compress.
This cadence takes 15 minutes per week. It prevents 15-20% annual yield drag from rate collapses you could have predicted.
## The Takeaway
Compound V3 USDC supply rates collapse when utilization drops below the 93% kink or when COMP emissions expire. Both events are predictable using five protocol-specific signals: utilization distance from kink, borrow rate downtrends, pending governance proposals, COMP emissions schedule changes, and cross-chain liquidity migration. All five were visible 72 hours before the September 23-26 collapse that cut APY from 5.36% to 3.29%. A $250,000 position monitoring these signals would have exited 48 hours early and reallocated to Aave V3 USDE at 4.75%, saving $1,375 over three months. The mechanism is not complex. The failure mode is specific. The data is public. Reading it requires fifteen minutes per week and prevents $4,000-$5,000 in annual yield drag.
## Frequently Asked Questions
### What is the kink in Compound V3's interest rate model?
The kink is a utilization threshold at 93% for USDC on Ethereum where the interest rate curve changes slope. Below the kink, rates increase gradually with utilization. Above it, rates spike sharply to attract more supply. When utilization drops below 93%, supply APY compresses non-linearly. This is the primary mechanism behind sudden rate drops on Compound V3.
### How much notice do governance proposals give before rate changes?
Compound governance proposals take 5-7 days from submission to execution. Proposals affecting interest rate parameters or COMP emissions appear in the governance forum at forum.comp.xyz before the on-chain vote. Reading proposals flagged for interest rate changes or incentive reallocation provides a week's warning before rates adjust. The September 26 rate drop was visible in a September 12 governance vote.
### Can I monitor Compound V3 rates without paying for tools?
Yes. Aavescan provides free real-time data on Compound V3 USDC supply rates, borrow rates, and utilization with hourly snapshots. DeFi Terminal offers free cross-chain TVL comparisons and utilization curves. Compound's governance forum is public. Messari tracks major DAO votes at no cost. A complete monitoring setup requires zero subscription fees.
### What position size justifies monitoring these signals?
The framework breaks even at positions above $15,000\. Moving capital from Compound to Aave costs $15-$30 in Ethereum gas. A 2 percentage point rate drop costs $75 per quarter on a $15,000 position. Below this threshold, gas costs exceed yield saved. Above $50,000, the framework prevents $300-$500 quarterly losses from predictable rate drops, making weekly monitoring worthwhile.
### Do these signals work for Compound V3 on Base or Arbitrum?
The same five signals apply, but kink thresholds and governance parameters differ by chain. Base USDC kink may be set at 90% instead of 93%. Always check the specific parameters for each chain in Compound's documentation. Cross-chain liquidity migration works in reverse: when Ethereum USDC supply grows faster than Base, Base utilization and rates drop. Adjust the framework to the chain you are monitoring.
The Weekly Yield Report
You just learned to predict Compound V3 rate drops using five signals visible 72 hours early. Those signals will trigger again, and the warning window will still be there.
Every Thursday: where crypto yield actually is - stablecoins, liquid staking and DeFi lending, with the risk named next to the rate and what changed since last week.
[Get it free every Thursday](#/portal/signup)
Free. No trade calls, no allocations, no hype. Unsubscribe in one click.
### Best Crypto Tax Software: What Works At Your Volume
URL: https://altcoininvestor.com/best-crypto-tax-software-3/
Last updated: 2026-09-26T22:05:53.000Z
## What This List Is For

Every crypto tax platform claims to handle thousands of transactions and support DeFi. Most fail on the second claim. The software that works for 300 Coinbase trades will break when you add Uniswap LP positions across three chains, staking rewards that auto-compound, or airdrops from protocols that do not exist in any vendor's database.
This review covers the platforms that matter: Koinly, CoinTracker, CoinLedger, TokenTax, and TaxBit. I evaluated them on five criteria: pricing tiers by transaction volume, exchange and wallet integrations, DeFi and staking support, cost basis method flexibility, and jurisdiction-specific reporting. The goal is simple. Tell you which tool to pay for based on your portfolio complexity and the jurisdiction where you file.
## Koinly: Best For International Users And Volume Traders

Koinly supports more than 20 tax jurisdictions and 1,000+ integrations across exchanges, wallets, and blockchains. It calculates cost basis using FIFO, LIFO, HIFO, or Specific ID, and for UK users it defaults to share pooling with the 30-day bed and breakfast rule applied automatically. German users get reports that account for the one-year holding period exemption. This is the only platform in this class that offers jurisdiction-specific logic out of the box.
Pricing is $49 for up to 100 transactions, $99 for 101 to 999, $179 for 1,000 to 3,000, and $279+ for more than 3,000\. Every price is per tax year. You can import up to 10,000 transactions for free and see your exact gains, but you cannot download the report until you pay. That is useful for testing accuracy before committing.
Koinly handles staking on Solana, lending on Curve, and liquidity provision on Uniswap. Complex DeFi or cross-chain transactions still require manual review, but the tagging interface is better than most competitors. It flags uncategorized deposits instead of guessing their tax treatment, which prevents phantom gains from appearing in your filing.
The weakness is DeFi autopilot. If 90 percent of your trades are simple but 10 percent are DeFi across three chains, that 10 percent is what will break your report. You will spend time manually categorizing those transactions.
Best for: active traders with 1,000+ transactions, anyone outside the US who needs jurisdiction-specific reporting, users who want control over cost basis method selection.
## CoinTracker: Best For US Users Who Stay On CEXs

CoinTracker supports the US, UK, Canada, and Australia, with a clear focus on the US market. It integrates with more than 500 exchanges and wallets. The platform is a good fit for people who primarily use centralized exchanges like Coinbase. If you use less popular tokens or protocols, you may need to make manual corrections.
Pricing is $59 for 100 transactions, $199 for 1,000 transactions, and $599 for 10,000+. Unlike Koinly, CoinTracker plans include all tax years, not just the current one. That pricing structure favors users who need to amend prior filings or who trade consistently across multiple years.
CoinTracker supports FIFO, LIFO, and HIFO but does not offer Specific Identification as of 2026\. That is a problem if you want to optimize your tax bill by choosing which lots to sell. The platform also treats uncategorized deposits as acquisitions at fair market value at the time of receipt, which can create phantom income if you moved assets between your own wallets without proper tagging.
Performance tracking and tax loss harvesting tools are only available on higher-tier plans starting at $199 per year. The Full Service option concentrates on account management and reconciliation, not full-service tax preparation.
Best for: US-based users with portfolios concentrated on major centralized exchanges, users who need multi-year access without paying annually, anyone willing to trade cost basis control for simplicity.
## CoinLedger: Best For Accuracy With Expert Review
CoinLedger prices at $49 for up to 100 transactions, $99 for 101 to 1,000, $199 for 1,001 to 3,000, and $199+ for more than 3,000\. It achieves solid ratings through exceptional customer support and accuracy, with an expert review service that provides professional validation for complex tax situations.
The platform handles the same core integrations and cost basis methods as Koinly and CoinTracker. What sets it apart is the optional human review layer. If you have transactions you cannot categorize with confidence, you can submit them for review by a tax professional before you file. That service is included in higher-tier plans and available as an add-on for lower tiers.
CoinLedger generates Form 8949, Schedule D, and a complete tax summary you can hand directly to your CPA. The platform is SOC 2 and ISO 27001 certified, which matters if you are uploading API keys or transaction history from multiple wallets.
Best for: users who want a second set of eyes on their filing before submission, portfolios with a mix of simple and complex transactions, anyone who values customer support over feature depth.
## TokenTax: Best For Full-Service Tax Preparation
TokenTax operates more like a full-service tax accounting firm than a do-it-yourself software tool. The lowest plan costs $65 annually, the highest costs $3,499 annually. Features such as margin trading and other PnL transactions are only available on the highest-tier Pro plan starting at $1,999 per year.
From the Premium plan and up, TokenTax supports [DeFi and NFT protocols](https://altcoininvestor.com/best-crypto-tax-software-defi/). Higher-tier plans include access to tax professionals who will prepare your return, not just generate a report. If you have cross-chain bridges, impermanent loss from LP positions, or staking income from protocols that do not appear in standard databases, TokenTax will assign a specialist to categorize those transactions manually.
TokenTax integrates with hundreds of exchanges, including Binance, BitMex, Coinbase, and Kraken. The platform is built for users who want someone else to handle the filing, not users who want software to speed up their own workflow.
Best for: high-net-worth users with portfolios that include margin, derivatives, and multi-protocol DeFi positions. Anyone who would rather pay for preparation than risk an error on a self-prepared filing.
## TaxBit: Enterprise-Focused, Limited Consumer Utility
TaxBit announced discontinuation of consumer crypto tax products in 2023\. The company now focuses on enterprise offerings and no longer serves individual users in most cases. It does offer a free plan that provides a portfolio overview and unlimited transaction imports, but there is no paid tier for individuals.
Because TaxBit does not make money from individual investors, some critics have complained that the company has not put the same level of effort into improving its platform as competitors. The free plan is useful if you want a second opinion on your portfolio valuation or if you are testing data imports before committing to a paid platform, but it will not generate a tax report you can file.
Best for: testing data quality before migrating to another platform. Not viable as a standalone solution for individual filers.
## Blockpit: Best For European Filers
Blockpit charges €49 for up to 50 transactions, €99 for 1,000, €149 for 3,000, €229 for 10,000, and €549 for more than 10,000 transactions. It integrates with over 400 exchanges and 10,000+ wallets and generates pre-filled tax forms for about 10 supported countries, including formats that meet German tax authority requirements directly as a ready-to-file PDF.
Blockpit offers free portfolio tracking, with full tax reports priced from roughly €49 up toward the mid-€500s depending on transaction volume. It supports country-specific tax reports for 22 countries, with a focus on Germany, Austria, and Switzerland.
The platform handles staking, DeFi, and NFTs with the same caveats as Koinly: most mainstream protocols work automatically, edge cases require manual tagging. Blockpit automatically identifies liquidity pool positions across major protocols, including Uniswap, Curve, Balancer, and SushiSwap, and tracks fee and reward distributions.
Best for: European filers who need local compliance formats, users in Germany or Austria who want a PDF that goes straight to their tax advisor without reformatting.
## Cost Basis Methods And Why They Matter
The IRS allows you to choose your cost basis method as long as you apply it consistently. FIFO assumes you sell the oldest coins first. LIFO assumes you sell the newest. HIFO assumes you sell the highest-cost coins first, which minimizes your taxable gain. Specific ID lets you choose exactly which lot you are selling, which gives you the most control but requires tracking each acquisition separately.
Koinly supports all four. CoinTracker does not offer Specific ID. CoinLedger and TokenTax support FIFO, LIFO, and HIFO. If you plan to optimize your tax bill by choosing specific lots, Koinly is the only consumer platform that offers that option without requiring manual spreadsheet work.
For UK users, Koinly calculates share pooling and applies the 30-day bed and breakfast rule automatically. That rule disallows a loss if you buy back the same asset within 30 days of selling it. Most US-focused platforms do not handle this correctly, which makes Koinly the default choice for UK filers.
## DeFi And Staking: Where The Software Breaks
Every platform claims to handle DeFi. Almost none handle it correctly without manual intervention. The problem is not the software. The problem is that DeFi protocols do not report transactions in a standardized format, and many protocols rebase token quantities or distribute rewards in ways that do not appear on-chain as discrete events.
Koinly can handle staking on Solana, lending on Curve, or providing liquidity on Uniswap. CoinTracker works if you use known DeFi protocols but may require manual corrections for less popular tokens. TokenTax assigns a specialist to categorize DeFi transactions manually if you pay for a higher-tier plan. Blockpit automatically identifies liquidity pool positions across major protocols.
None of these platforms do DeFi perfectly on autopilot. If 90 percent of your trades are simple but 10 percent are DeFi across three chains, that 10 percent is what will break your report. You will spend time manually categorizing those transactions, regardless of which platform you choose.
## Jurisdiction Coverage And Regulatory Reporting
Tax authorities across the US, UK, EU, and Australia now cross-reference crypto activity through exchange reporting, Form 1099-DA mandates, and CARF data-sharing agreements that take effect in 2027\. Filing errors that passed unnoticed in earlier years now trigger automated notices in multiple jurisdictions at once.
Koinly offers specialized tax reports for the USA, Canada, Australia, UK, Germany, Norway, Denmark, and Sweden. CoinTracker supports the US, UK, Canada, and Australia. Blockpit generates pre-filled tax forms for 10 European countries. TokenTax and CoinLedger focus primarily on US filers.
If you file outside the US, Koinly or Blockpit are the only platforms that offer jurisdiction-specific logic. CoinTracker and CoinLedger will generate a report, but you or your accountant will need to reformat it to match local requirements.
Both Koinly and CoinTracker support per-wallet tracking for tax years beginning January 1, 2025 under Rev. Proc. 2024-28\. Existing users should confirm that their account settings use per-wallet basis rather than the old universal method. Sales and exchanges generally flow through Form 8949 and Schedule D, with digital asset broker reporting also evolving through Form 1099-DA.
## Pricing At Realistic Volumes
If you have fewer than 100 transactions, every platform costs between $49 and $65\. If you have 1,000 transactions, Koinly costs $99, CoinTracker costs $199, CoinLedger costs $99, and TokenTax starts at $65 but gates essential features behind higher tiers.
The price gap widens at higher transaction volumes. For active traders with 10,000+ transactions, Koinly costs $299, CoinTracker costs $599\. TokenTax does not publish volume-based pricing but charges based on service level, with full-service preparation starting at $1,999.
Every platform except CoinTracker charges per tax year. If you need to amend multiple prior years, CoinTracker's multi-year access may justify the higher per-year cost. If you only file for the current year, Koinly or CoinLedger will cost less at every volume tier.
## Security, API Access, And Data Privacy
Koinly is SOC 2 and ISO 27001 certified. CoinLedger holds the same certifications. Most platforms use read-only API keys when connecting to exchanges, which means they cannot move funds even if credentials were somehow compromised.
You should never give a tax platform withdrawal permissions. If a platform asks for anything beyond read-only API access, do not connect it. Koinly, CoinTracker, CoinLedger, and TokenTax all default to read-only access. TaxBit does the same for its free plan.
If you are uploading transaction history manually via CSV, verify that the platform encrypts data in transit and at rest. Every platform in this review does, but smaller or newer platforms may not.
## The Takeaway
If you trade on centralized exchanges and file in the US, CoinLedger or CoinTracker will handle your filing without manual intervention. If you have more than 1,000 transactions or file outside the US, Koinly costs less and supports more jurisdictions. If you use DeFi across multiple chains or hold positions in protocols that are not in standard databases, no platform will generate a perfect report on autopilot. You will either pay TokenTax for manual categorization or spend time tagging transactions yourself in Koinly. The software that worked when you only traded on Coinbase will fail when you add LP positions, cross-chain bridges, or staking rewards. Plan for that before you file, not after.
## Frequently Asked Questions
### Which crypto tax software is best for DeFi transactions?
No platform handles DeFi perfectly on autopilot. Koinly offers the best self-service DeFi tagging interface and supports staking, lending, and LP positions on major protocols. TokenTax provides manual categorization by tax specialists on higher-tier plans, which is better for complex multi-chain DeFi but costs $1,999+ annually. If you use mainstream protocols like Uniswap, Curve, or Aave, Koinly will categorize most transactions correctly. Edge cases and newer protocols require manual review on every platform.
### Can I use free crypto tax software for my filing?
Koinly and TaxBit offer free plans that let you import and view your transactions, but neither allows you to download a tax report without paying. Koinly's free tier supports up to 10,000 transaction imports and shows exact gains, which is useful for testing accuracy before committing. TaxBit's free plan provides portfolio tracking but does not generate filings. If you have fewer than 100 transactions, paid plans start at $49 on Koinly and CoinLedger, which is less than the cost of fixing an error on a self-prepared return.
### Do I need different crypto tax software if I file outside the US?
Yes. Most platforms focus on US tax rules. Koinly supports more than 20 jurisdictions with country-specific logic, including share pooling for the UK, one-year holding exemptions for Germany, and compliance formats for Canada and Australia. Blockpit generates pre-filled tax forms for 10 European countries, including ready-to-file PDFs for German tax authorities. CoinTracker and CoinLedger support the US, UK, Canada, and Australia but require manual reformatting for other jurisdictions. If you file in the EU, Koinly or Blockpit are the only viable options.
### What cost basis method should I choose for crypto taxes?
FIFO is the default and easiest to audit. HIFO minimizes taxable gains by selling the highest-cost coins first, but you must track each acquisition separately. Specific ID gives you the most control, letting you choose exactly which lot to sell, but only Koinly supports it for individual filers as of 2026\. UK filers must use share pooling, which Koinly applies automatically. Choose HIFO if you want to reduce your tax bill and are willing to maintain detailed records. Choose FIFO if you want simplicity and lower audit risk.
### How much does crypto tax software cost for high-volume traders?
At 10,000+ transactions, Koinly costs $299 per tax year, CoinTracker costs $599 (multi-year access included), and CoinLedger costs $199+. TokenTax does not publish volume-based pricing but charges based on service level, with full-service preparation starting at $1,999 annually. The price gap widens as transaction count increases. If you trade actively across multiple exchanges and DeFi protocols, Koinly offers the best cost-to-feature ratio. If you need multi-year access without paying annually, CoinTracker's higher per-year cost may be justified.
Tool mentioned above
Koinly
Koinly imports from 800+ exchanges and wallets and handles the DeFi cases most tools get wrong - rebasing tokens, LP positions, staking rewards.
[Try Koinly](https://koinly.io/?via=F6E2E35A&utm%5Fsource=affiliate)
We may earn a commission if you sign up through this link, at no cost to you. It does not change what gets recommended.
The Weekly Yield Report
You just compared five platforms across pricing, DeFi support, and jurisdiction coverage. Those features and price tiers will change by next tax season.
Every Thursday: where crypto yield actually is - stablecoins, liquid staking and DeFi lending, with the risk named next to the rate and what changed since last week.
[Get it free every Thursday](#/portal/signup)
Free. No trade calls, no allocations, no hype. Unsubscribe in one click.
### The First Hour Of An Exploit: What Actually Preserves Capital
URL: https://altcoininvestor.com/defi-exploit-what-to-do/
Last updated: 2026-09-26T21:06:02.000Z
## What You Will Accomplish

You will learn the specific sequence of actions that has preserved capital during protocol exploits, how to distinguish real incidents from false alarms in the window before the information becomes common knowledge, and what the pause mechanism actually means for funds you cannot immediately withdraw. This is written as procedure because someone reading during an active incident has minutes, not hours, and needs steps rather than commentary.
The first hour of a protocol exploit is not a period during which you gather information and consider options. It is a window measured in single-digit minutes during which attackers drain funds and preservation depends on acting before the contagion completes. Balancer V2 reached 54% fund loss in the first minute and 93% in minute five. CrossCurve hit 57% loss in minute one. The capital you preserve depends on what you do before the protocol is empty, and that window is shorter than most investors assume.
This procedure assumes you already hold funds in DeFi protocols and that you monitor them with some regularity. If you do not currently use DeFi, the income mechanism here will not apply to you. If you do, what follows is the sequence that has actually worked when protocols break.
## Step One: Verify The Signal Is Real

Protocols discover exploits through three channels: automated monitoring alerts that fire when unusual transactions occur, community reports on social media from users watching on-chain activity, or protocol teams noticing total value locked evaporating on a dashboard. The team is often the last to know, because attackers deliberately strike outside business hours and structure the first few transactions to look like ordinary large trades rather than malicious drains.
Your first task is to determine whether the signal you are seeing represents a real exploit or noise. Check the protocol's official Twitter account, Discord server, and status page for confirmed announcements. Do not rely on third-party aggregators or community rumors alone. If the protocol has posted an official notice acknowledging an incident or announcing a pause, treat it as real. If you see widespread community alarm but no official statement, look for on-chain evidence: unusual outflows visible on the blockchain explorer, total value locked dropping sharply on DefiLlama, or wallet addresses flagged by security firms.
False alarms occur. Legitimate large withdrawals can trigger community panic. A sudden price drop does not always indicate an exploit. But when multiple credible sources report the same pattern and you can verify unusual on-chain activity yourself, assume the signal is real and act immediately. Waiting for official confirmation from a team that may be asleep or scrambling to assess the situation costs you the minutes that matter.
The Resolv USR exploit on March 22, 2026 illustrates the timeline. The team detected unauthorized minting and paused all protocol functions within minutes, but the attacker had already minted 80 million unbacked USR from a $200,000 deposit and extracted roughly $25 million. The rapid pause prevented what could have been a nine-figure catastrophe, but it did not prevent the initial loss. If you held funds in Resolv and waited for the official announcement, you had no window to act. The pause came after the damage.
## Step Two: Revoke Token Approvals Immediately

The moment you confirm a real exploit, revoke all token approvals for the compromised contract. Do not interact with the protocol's frontend interface. Do not attempt to withdraw through the protocol's website. Use Revoke.cash or your wallet's built-in approval manager to cancel the permissions you previously granted to the exploited contract.
Token approvals allow smart contracts to move your funds on your behalf. When you deposit into a DeFi protocol, you typically grant the protocol's contract permission to spend your tokens. If that contract is exploited, the attacker may gain the ability to drain any wallet that has approved it, even if your funds are not currently deposited. Revoking approvals severs that permission and protects any tokens still sitting in your wallet.
This action takes 30 to 90 seconds if you know where the revoke function is in your wallet. If you have never revoked an approval before, locate that function now, before you need it under pressure. [Hardware wallets](https://altcoininvestor.com/best-crypto-hardware-wallets/) add friction here because each revoke transaction requires physical confirmation, but that friction is acceptable given the security benefit the wallet provides in normal conditions.
Revoking approvals does not retrieve funds already deposited in the exploited protocol. It prevents the attacker from claiming additional tokens from your wallet. If your capital is locked in the protocol's contract, the revoke step protects your wallet but does not recover the deposited position. That requires the next step.
## Step Three: Attempt Withdrawal If The Contract Allows It
If the protocol has not paused withdrawals and the exploit has not yet drained the pool you are in, withdraw immediately. Do not wait to see whether the protocol stabilizes. Do not assume the attacker will stop. Do not attempt to time a better exit. If the contract allows you to withdraw, execute the transaction now.
Many exploits drain specific pools or contracts while leaving others temporarily untouched. In June 2026, attackers drained $127 million from three DeFi protocols in a twelve-minute span through a bridge message-verification module replay. Not every pool in those protocols was hit simultaneously. Users who recognized the incident early and withdrew from adjacent pools preserved capital. Users who waited to assess the full scope lost the window.
Withdrawal feasibility depends on three factors: whether the protocol has paused the withdrawal function, whether the pool still contains liquidity, and whether network congestion allows your transaction to confirm before the pool empties. On Ethereum mainnet, a two-second delay in block processing can be the difference between a successful withdrawal and a failed transaction that costs you only gas. If gas prices are spiking because other users are attempting the same exit, you may need to set a higher gas limit to ensure your transaction confirms quickly.
If the protocol has paused all functions, withdrawal will not be possible through normal mechanisms. The pause exists to prevent further loss, but it also traps your capital temporarily. In that case, your immediate action is complete. What happens next depends on the protocol's recovery process, which is beyond your control in the first hour.
## What A Pause Actually Means For Your Funds
A protocol pause is an emergency function that halts deposits, withdrawals, and other contract interactions to prevent an ongoing exploit from draining remaining funds. Of 183 DeFi protocols studied, 87 support emergency pause capability, but only 51 of those 87 pause within 48 hours of an incident, and only one pauses within the first hour. When a pause does occur, it indicates that the protocol team has recognized the threat and acted to contain it, but it does not guarantee your funds are safe.
Pause mechanisms vary. Some protocols delegate pause authority to a small multisig of trusted guardians who can act within minutes. Others require governance quorum plus a timelock, which means hours to days before a pause can execute. If pausing requires a DAO vote and a 24-hour timelock, assume the protocol cannot respond quickly to an active exploit. The Parallel USDp incident on May 7, 2026 illustrates effective pause design: automated detection flagged the attacker's contract deployment, and the perpetuals module paused before the exploit transaction could execute. The attacker had positioned for 57 days to extract $1.52 million but walked away with nothing because the pause fired faster than the attack.
A pause does not mean your funds are lost, but it does mean you cannot access them until the team lifts the restriction. In well-designed protocols, withdrawals of already-vested funds remain accessible even during a pause to prevent the mechanism from becoming a tool to trap user capital. In poorly designed protocols, a pause can freeze everything, including legitimate exits. You will not know which design your protocol uses until the pause occurs, which is why pre-incident research matters.
If your protocol has paused and you cannot withdraw, your immediate options are exhausted. What remains is monitoring official channels for updates on the recovery plan, whether that involves a contract upgrade, a governance vote to compensate affected users, or a decision to wind down the protocol. The income mechanism that brought you to the protocol is now subordinate to the capital preservation question, and that resolution typically takes weeks, not hours.
## Step Four: Move Preserved Capital To Cold Storage
If you successfully withdrew funds before the protocol drained or paused, move that capital to cold storage immediately. Do not leave it in the hot wallet you used for DeFi interactions. The same wallet that held approvals for the compromised protocol may hold approvals for other contracts, and if the exploit involved a broader wallet vulnerability rather than a protocol-specific flaw, your funds remain at risk until you move them to an address the attacker cannot reach.
Cold storage means a hardware wallet or an air-gapped address that has never interacted with DeFi contracts and never approved token spending. The withdrawal you just executed gave you liquid capital. The next step is to ensure that capital cannot be touched by any residual threat from the compromised environment.
This step takes five to fifteen minutes depending on your wallet setup. If you do not currently have a cold storage solution, acquire one before the next incident. The first hour of an exploit is not the time to research hardware wallet options or set up a new device. The capital you preserve in step three loses its value if you leave it exposed to follow-on attacks in step four.
## Common Failure Modes
The most common failure is waiting for clarity before acting. Investors see early signals, check social media, see conflicting reports, and decide to wait for official confirmation or a clearer picture of the situation. By the time that clarity arrives, the withdrawal window has closed. Decurity's research on exploit drain timelines tracks fund loss at one, five, fifteen, thirty, and sixty minutes after the first malicious transaction. In the majority of incidents, the significant loss occurs in the first five minutes. Waiting fifteen minutes to decide costs you the capital you could have preserved.
The second failure mode is attempting to withdraw through the protocol's frontend interface after the exploit is public. Protocol websites can be compromised, DNS can be hijacked, and interfaces can be manipulated to direct withdrawals to attacker-controlled addresses. If you are executing an emergency withdrawal during an active incident, interact directly with the contract through a block explorer or your wallet's contract interaction feature, not through the protocol's website.
The third failure is ignoring token approvals. Investors focus on deposited funds and overlook the fact that the approval itself is a liability. Even if you successfully withdraw your deposited position, an unrevoked approval can allow the attacker to drain tokens from your wallet later. Revoke first, withdraw second. The order matters.
The fourth failure is assuming a pause means safety. A pause means containment, not resolution. Your funds are frozen, the protocol is frozen, and what happens next depends on governance, legal structure, insurance mechanisms, and whether the team can recover or replace the lost capital. The Nomad Bridge hack demonstrates what happens when pause capability is absent: funds drained for hours because the protocol had no mechanism to halt the exploit in progress. The absence of a pause contributed directly to the severity of the loss.
## What To Do After The First Hour
Once you have revoked approvals, attempted withdrawal, and moved any preserved capital to cold storage, the immediate procedure is complete. What follows is incident-specific recovery, which typically involves monitoring official announcements, reviewing governance proposals for compensation or protocol restructuring, and deciding whether to remain involved with the protocol or exit permanently once withdrawals resume.
Recovery paths vary. Some protocols compensate affected users through treasury funds or insurance mechanisms. Others issue governance tokens to represent claims on future recovery. Some simply shut down. The KelpDAO lawsuit against LayerZero over the April 18 exploit that drained $292 million in rsETH illustrates the complexity: the protocol alleges LayerZero's infrastructure enabled the attack, LayerZero disputes the claim, and affected users are left waiting for a legal process that may take years to resolve. If you preserved capital by exiting before the drain, you avoided that process entirely.
The income mechanism you were using in the exploited protocol is gone, at least temporarily. The question that matters after the first hour is whether the capital you preserved can be redeployed into a more sustainable yield source or whether the incident has changed your risk tolerance enough to move entirely to lower-yield, lower-risk positions. That is a strategic decision that depends on your total portfolio exposure, your income requirements, and your assessment of whether the exploit reflected protocol-specific failure or broader systemic risk in DeFi.
## The Takeaway
Capital preservation during a DeFi exploit depends on acting in the window between the first credible signal and the moment the protocol drains or pauses, and that window is measured in minutes rather than hours. The difference between a $25 million loss and a $250 million loss has repeatedly been shown to rest on what happens in the first sixty minutes, and the same arithmetic applies at every scale. Verify the signal through multiple credible sources, revoke token approvals immediately, withdraw if the contract allows it, and move preserved capital to cold storage before considering next steps. These are not recommendations for optimal returns but procedures for preventing total loss when the mechanism you were relying on breaks.
Protocols continue to be exploited. In the first five months of 2026, more than $840 million was lost to DeFi hacks, with April alone accounting for over $600 million. TRM Labs counted 32 price-manipulation attacks in 2026 through early September, up from 12 across all of 2025\. The frequency and sophistication of these incidents suggest that April's attacks likely involved AI-assisted target selection and exploit design, and that the pattern will continue. The first hour of the next exploit will look much like the first hour of the last one. What differs is whether you act before the window closes.
For reference on cryptographic security verification in smart contracts, Ethereum's official documentation provides [foundational security considerations](https://ethereum.org/developers/docs/smart-contracts/security/) that inform protocol design, though incident response operates on a different timeline than development best practices. The question is not whether protocols should have been designed differently but what you do when the design fails while your capital is still inside.
## Frequently Asked Questions
### How quickly do DeFi exploits drain protocol funds?
Most significant fund loss occurs in the first five minutes. Balancer V2 lost 54% of funds in minute one and 93% by minute five. CrossCurve hit 57% loss in the first minute. The withdrawal window that preserves capital typically closes before most users recognize an exploit is occurring. Acting on early signals before official confirmation is essential.
### What does a protocol pause mean for my deposited funds?
A pause halts all contract interactions including deposits and withdrawals to prevent further loss during an active exploit. Your funds are frozen but not necessarily lost. Of 183 DeFi protocols studied, only 87 have pause capability and only one pauses within the first hour. Well-designed pauses protect remaining assets while poorly designed ones trap user capital indefinitely until governance acts.
### Should I withdraw through the protocol website during an exploit?
No. Protocol frontends can be compromised during an incident. Interact directly with the smart contract through a blockchain explorer or your wallet's contract interface. Verify the contract address independently before executing any transaction. DNS hijacking and interface manipulation have redirected emergency withdrawals to attacker-controlled addresses in past incidents.
### Why revoke token approvals if I already withdrew my deposit?
Token approvals grant smart contracts permission to spend tokens from your wallet even after you withdraw a deposit. If the exploited contract is compromised, attackers may drain approved tokens from your wallet later. Revoking approvals severs that permission and protects any tokens sitting in your wallet from follow-on attacks targeting approved addresses.
### How do I know if an exploit signal is real or a false alarm?
Check official protocol channels including Twitter, Discord, and status pages for confirmed announcements. Verify unusual on-chain activity through blockchain explorers and TVL data on DefiLlama. Multiple credible sources reporting the same pattern plus visible on-chain evidence indicates a real incident. Waiting for official team confirmation often costs you the withdrawal window because teams are frequently the last to know.
Tool mentioned above
Ledger
Ledger devices display the full transaction on their own screen before you approve it, which is what stops an approval exploit at the point it matters.
[See Ledger devices](https://shop.ledger.com/?r=90612ff43561)
We may earn a commission if you sign up through this link, at no cost to you. It does not change what gets recommended.
The Weekly Yield Report
You now have the four-step sequence that has preserved capital when protocols break. That sequence will not change, but the next exploit is already being planned.
Every Thursday: where crypto yield actually is - stablecoins, liquid staking and DeFi lending, with the risk named next to the rate and what changed since last week.
[Get it free every Thursday](#/portal/signup)
Free. No trade calls, no allocations, no hype. Unsubscribe in one click.
### What To Do When A Protocol Drops Off Yield Trackers
URL: https://altcoininvestor.com/protocol-disappeared-from-yield-tracker-what-to-do/
Last updated: 2026-09-26T19:06:43.000Z
## The Question: My Yield Position Just Disappeared From Tracking

You check your weekly monitoring routine and the protocol you deployed $50,000 into is gone. Not down. Not repriced. Gone. DefiLlama shows no TVL data. RWA.xyz shows no recent activity. Your position was earning 3.05% on tokenized Treasury exposure through Midas RWA. Now the tracker reports nothing.
You have $50,000 deployed plus six weeks of accrued yield. You need to know whether this is a data feed issue that will resolve in hours, an orderly wind-down that gives you exit time, or a liquidity freeze that has already locked your capital. The difference determines whether you retain full access or whether you are waiting months for resolution.
This is not a theoretical exercise. Midas RWA operates across 31 chains with $132 million in TVL as of September 2026\. When a protocol of that scale disappears from the primary tracking infrastructure that most yield investors rely on, the income loss starts immediately. You stop accruing documented yield. You lose historical performance records for tax reporting. You cannot monitor whether your position is safe or whether withdrawals remain enabled.
The first six hours matter more than anything you do after. Here is the systematic checklist I use when a protocol drops off tracking, built from twelve years evaluating how platforms actually fail and how data systems actually break.
## The Answer: Three Failure Modes, Three Response Protocols
When a protocol vanishes from yield trackers, you are looking at one of three scenarios. Each has different economics, different timelines, and different actions that protect your capital.
**Delisting due to data integrity concerns.** The protocol remains operational. Smart contracts function normally. Users can deposit and withdraw. But the tracking platform removed the protocol from aggregated data feeds because volume looked suspicious, data adapters returned inconsistent results, or the protocol stopped providing verifiable lower-level transaction data. Example: DefiLlama delisted Aster perpetual futures in early 2026 because trading volumes mirrored Binance almost exactly and Aster would not provide order-level data to verify wash trading was not inflating metrics.
**Orderly wind-down.** The protocol stops accepting new deposits but enables redemptions. Treasury positions are liquidated in sequence. Token holders receive scheduled payouts. Smart contracts move to withdrawal-only mode. Frontend remains accessible. This is the best-case failure mode because you retain full control of timing and can exit without competing against a bank-run. Wind-downs are announced, usually with multi-week timelines.
**Liquidity freeze.** Smart contracts trigger pause functions. Withdrawals stop. Frontend goes offline or shows error states. Bridge contracts freeze if the protocol operates cross-chain. This is catastrophic because capital is locked until the protocol governance or the legal entity controlling the contracts decides to enable redemptions again. Freezes happen in minutes, usually in response to an exploit, an oracle failure, or a counterparty insolvency that makes honoring withdrawals impossible.
Your job in the first six hours is to determine which scenario you are in, then execute the appropriate response before conditions worsen or before other holders create withdrawal congestion that delays your exit.
## How To Verify What Actually Happened

Start with on-chain contract activity, not with tracker status. Trackers aggregate data from smart contracts, but they are not the source of truth. The source of truth is whether the protocol's smart contracts are still processing transactions.
Go to Etherscan if the protocol operates on Ethereum, or the equivalent block explorer for the chain where your position is held. Midas RWA operates on 31 chains, with Ethereum holding 67% of TVL. Find the contract address for the vault or staking contract where your capital is deployed. Check the transaction history for the past six hours.
If you see deposits, withdrawals, and reward distributions in the past three hours, the protocol is operational. The disappearance from tracking is a data issue or a delisting, not a freeze. If the last transaction was 18 hours ago and it was a mass withdrawal event, you are likely looking at early stages of a liquidity freeze and you need to attempt withdrawal immediately.
Next, cross-reference multiple trackers. Do not rely on a single aggregator. Check DefiLlama, RWA.xyz, and AprScope if the protocol is DeFi-native. For RWA protocols like Midas, check RWA.xyz specifically because it tracks tokenized asset registrations and NAV updates that general DeFi trackers sometimes miss. If the protocol appears on two of three trackers, the third tracker has a data feed problem. If the protocol is missing from all three, the issue is upstream at the protocol level.
Check whether the protocol frontend is accessible and whether it shows current TVL and APY data. If the website is live and displays real-time data, the protocol has not frozen. If the frontend shows stale data (last updated three days ago) or throws API errors when you try to view your position, that indicates the protocol's own data infrastructure is down, which is a yellow flag but not yet a freeze.
For Midas specifically, check whether the custom pricing oracle (eOracle) is still publishing NAV updates for mTBILL and other tokenized products. Oracle failures show up as TVL calculation errors or yield miscalculations before a protocol fully disappears from tracking. If eOracle stopped publishing six hours before Midas vanished from DefiLlama, the root cause is oracle infrastructure failure, not a protocol wind-down.
Verify redemption pathways. Midas offers T+0 instant exits for mGLOBAL and mF-ONE holders through Symbiotic Liquid Lane, a pre-allocated liquidity mechanism that does not require waiting for Treasury settlement. Log into the Midas frontend and attempt to initiate a small withdrawal (1% of your position). If the transaction goes through and you receive funds within 10 minutes, the protocol is operational and the tracker delisting is cosmetic. If the withdrawal interface is disabled or the transaction reverts, you are in a freeze and you need to monitor governance channels for announcements about when withdrawals will resume.
## The Six-Hour Response Checklist
Here is what I do in the first six hours after a protocol disappears from tracking. The sequence matters because information becomes less reliable and exit windows narrow as time passes.
**Hour 0-1: Verify operational status.** Check block explorer for recent contract activity. Cross-reference three trackers. Attempt a 1% test withdrawal through the protocol frontend. Document the results with screenshots and transaction hashes. If withdrawal succeeds, you are dealing with a data issue and your capital is not at immediate risk. If withdrawal fails, move to crisis protocol.
**Hour 1-2: Assess liquidity depth.** Check whether TVL is declining rapidly. A 60% to 90% TVL drop in six hours is the signature of a bank-run. If you see that pattern, other holders know something you do not, or they are reacting to the same delisting event and exiting out of caution. In that scenario, speed matters. Submit a full withdrawal immediately because liquidity pools drain fast and late withdrawals get stuck in queue or receive partial fills.
**Hour 2-3: Governance and communication channels.** Check the protocol's Discord, Telegram, and Twitter for official statements. Look for messages from team members with verified roles, not from community moderators. A legitimate wind-down or temporary data issue will be acknowledged publicly within two hours. If the protocol team has gone silent for 12+ hours during a delisting event, that is a red flag. Silent teams during capital events either do not know what is happening (governance failure) or are avoiding communication while they assess legal exposure (fraud or insolvency).
**Hour 3-4: Tax and compliance documentation.** If you decide to exit, you need historical yield data for tax reporting. DefiLlama maintains open-source adapters for every protocol it tracks, and those adapters remain accessible even after delisting. Go to the DefiLlama GitHub repository and find the adapter for the protocol. Download the historical TVL, fee, and APY data while it is still available. Some adapters get archived quickly after delisting. You will need this data when you file taxes because your wallet transaction history shows deposits and withdrawals but does not show daily accrued yield, which is taxable income in most jurisdictions.
**Hour 4-5: Alternative data sources.** If the protocol disappeared from all major trackers, check Dune Analytics for user-created dashboards. Dune queries pull data directly from on-chain events, independent of tracker APIs. A well-maintained Dune dashboard will show recent deposit/withdrawal activity, TVL by wallet, and yield distribution events even when aggregators show nothing. Bookmark any active Dune dashboards for the protocols you hold, so you have a backup data source before you need it.
**Hour 5-6: Decision point.** You now have enough information to classify the event. If on-chain activity is normal and withdrawals process successfully, stay in the position but add the protocol to elevated monitoring (daily checks instead of weekly). If TVL dropped 60%+ and withdrawals are slow or partial, exit immediately and accept slippage or delayed settlement. If withdrawals are frozen and the team has not communicated, you are in a liquidity freeze and your only option is to wait for governance resolution or legal recovery proceedings.
The economic cost of misclassifying the scenario is significant. If you exit during a temporary data issue, you pay gas fees and potentially sacrifice accrued yield that had not yet been claimed. If you stay in during the early hours of a freeze, you lose the option to exit entirely and your capital is locked for an unknown duration.
## When It Matters and When It Does Not
Not every tracker delisting justifies immediate action. Some are bureaucratic, some are temporary, and some are protective.
If the protocol is licensed under MGA or BaFin (like Midas, which operates under BaFin crypto custody license with MiCA compliance across 27 EU countries), a tracker delisting is more likely to be a data dispute than an operational failure. Regulated entities have reporting obligations and compliance infrastructure that makes catastrophic fraud less likely. They also have legal accountability, which means if there is a freeze, there will be a resolution process you can participate in.
If the protocol is unlicensed and operates in a regulatory gray zone, a tracker delisting is a stronger signal. Unlicensed protocols have no external accountability, no compliance audits, and no legal mechanism forcing transparency during capital events. When an unlicensed protocol disappears from tracking and the team goes silent, you should assume the worst and act accordingly.
If the protocol has publicly announced a wind-down or a migration to a new contract architecture, a tracker delisting may simply mean the old contract is being deprecated and the new contract has not yet been added to tracker databases. This happens frequently during protocol upgrades. The fix is usually completed within 48 hours once the protocol submits the new contract address to DefiLlama and other aggregators.
If you are deploying into RWA protocols specifically, understand that RWA.xyz is a better primary tracker than DefiLlama for this asset class. RWA.xyz tracks tokenized asset registrations, NAV updates, and compliance documentation that DeFi-focused trackers do not prioritize. Midas, for example, shows more granular data on RWA.xyz than on DefiLlama because RWA.xyz pulls data from the eOracle NAV feed and from Midas's public transparency reports, not just from smart contract TVL.
## Building a Personal Monitoring System So This Does Not Surprise You
The reason a tracker delisting causes panic is because most holders do not have a backup monitoring system. They rely entirely on a single aggregator and they check it once per week. When that aggregator stops reporting data, they have no independent way to verify protocol health.
Here is the monitoring checklist I built after watching Kelp DAO/Aave enter a liquidity freeze in April 2026 with no advance warning to most LPs. This checklist takes nine minutes per protocol per week. It catches 80% of problems before capital is locked.
**Track TVL velocity, not just TVL level.** A protocol losing 15% TVL in three days is a red flag even if absolute TVL is still high. Rapid TVL decline means informed holders are exiting. You should know why before you are the last one out. Set up a spreadsheet that logs TVL every Monday. If week-over-week decline exceeds 10%, investigate.
**Monitor governance activity.** Protocols that stop posting governance proposals or that have not had a team update in 30+ days are in operational decline. Wind-downs and freezes almost always happen during periods of governance silence. If the protocol has not posted a development update or a treasury report in 45 days, reduce position size even if yield is still accruing.
**Verify oracle uptime for RWA protocols.** RWA yields depend on external price feeds and NAV calculations. If the oracle feeding NAV data to the protocol stops updating, the protocol cannot accurately price redemptions, which leads to withdrawal pauses. Check oracle status weekly. For Midas, that means checking eOracle publication timestamps on the mTBILL NAV page. If the last update was 72 hours ago instead of the normal 24 hours, prepare to exit.
**Set block explorer alerts for your deposit contract.** Etherscan and most block explorers allow you to set email or Telegram alerts for specific contract addresses. Set an alert for any transaction exceeding $1 million on the vault contract where your funds are held. Large withdrawals by whales often precede public announcements of problems. If a whale exits 48 hours before a tracker delisting, that whale had information you did not. The alert gives you the same information in real time.
**Bookmark the protocol's Dune dashboard.** Find or create a Dune Analytics dashboard that tracks deposits, withdrawals, unique depositors, and average position size for the protocol. Bookmark it. Check it every Monday. Dune data is independent of tracker APIs, so it continues to update even during tracker outages or delistings.
**Join the protocol's official Discord or Telegram with notifications enabled for announcements.** Mute general chat. Enable notifications only for the announcements channel. This ensures you see official statements about wind-downs, oracle issues, or contract upgrades within minutes of posting, not three days later when you check your weekly monitoring routine.
## The Takeaway
When a protocol disappears from yield trackers, you have a six-hour window to verify whether you are in a data lag, an orderly wind-down, or a liquidity freeze. Check on-chain contract activity first, not tracker status. Cross-reference three independent data sources. Attempt a small test withdrawal. Document everything with transaction hashes and screenshots. If withdrawal succeeds, you are safe but should move to daily monitoring. If withdrawal fails and TVL is dropping fast, exit immediately because liquidity drains faster than most holders expect.
The income loss from a protocol freeze is not limited to locked capital. You lose accrued yield that had not been claimed. You lose access to historical data needed for tax reporting. You lose the optionality to redeploy capital into higher-yield opportunities while you wait for governance to resolve the freeze. Build a personal monitoring system now, before you need it. Nine minutes per week per protocol catches most failures before withdrawals are paused.
For additional background on when to exit yield positions and the specific signals that justify action, see [When To Exit A Yield Position (And When Not To)](https://altcoininvestor.com/when-to-exit-defi-position/). For a systematic weekly monitoring routine that scales across multiple protocols without requiring daily attention, see [The Fifteen-Minute Weekly Check For A Yield Portfolio](https://altcoininvestor.com/defi-portfolio-monitoring-routine/). If you are deploying into RWA protocols specifically and need to understand how they differ economically from pure DeFi yield, start with [What are RWAs?](https://altcoininvestor.com/real-world-assets/) to understand the asset class structure before evaluating individual protocols. For readers comparing RWA yields to traditional money market exposure, [Stablecoin Yield vs Money Market Funds](https://altcoininvestor.com/stablecoin-yield-vs-money-market/) provides the sustainability and risk comparison that determines whether tokenized Treasuries offer better risk-adjusted returns than their TradFi equivalents. Finally, for tax reporting when historical yield data becomes unavailable after a delisting, [Crypto Tax Calculators That Handle Multi-Protocol Yield](https://altcoininvestor.com/crypto-tax-calculator/) covers which tools can reconstruct accrued income from wallet transaction history when tracker APIs no longer provide that data.
Midas RWA currently operates with $132 million in TVL, distributing Treasury-backed yield through mTBILL and related products. The protocol has BaFin licensing and MiCA compliance, which provides more regulatory accountability than most DeFi protocols. That does not eliminate the risk that a tracker delisting creates temporary information asymmetry that costs you money. It means you have legal recourse if a freeze occurs, but you still need to verify operational status independently when tracking data disappears.
## Frequently Asked Questions
### How long does it take for a protocol to reappear on trackers after a data issue?
Most data feed issues resolve within 24 to 48 hours once the protocol submits corrected contract addresses or API endpoints to tracker teams. DefiLlama maintains open-source adapters and community contributors often fix data issues within hours if the protocol is actively used. If a protocol remains missing after 72 hours and on-chain activity is normal, the delisting is likely intentional due to data integrity concerns rather than a temporary technical issue.
### Can I recover my funds if a protocol freezes withdrawals after disappearing from trackers?
Recovery depends on whether the protocol is licensed and whether the freeze resulted from an exploit, insolvency, or governance decision. Licensed protocols under MGA or BaFin have legal accountability and usually establish claims processes for frozen capital. Unlicensed protocols have no external enforcement mechanism. Historical recovery rates range from 60% to 95% for licensed entities that entered orderly wind-downs, and 0% to 40% for unlicensed protocols that experienced catastrophic exploits or team abandonment.
### Should I exit immediately when a protocol disappears from DefiLlama?
Not always. First verify whether the protocol is still operational by checking on-chain contract activity and attempting a small test withdrawal. If withdrawals process normally and TVL is stable, the delisting is likely a data dispute and immediate exit costs you gas fees and potentially unclaimed yield. If TVL dropped more than 60% in six hours or withdrawals fail, exit immediately because you are in the early stages of a bank-run or liquidity freeze.
### What is the difference between a tracker delisting and a protocol wind-down?
A tracker delisting means the data aggregator removed the protocol from its database, usually due to data quality concerns, wash trading suspicions, or inability to verify transaction data. The protocol continues operating normally. A wind-down means the protocol itself is shutting down operations, moving to withdrawal-only mode, and liquidating treasury positions. Wind-downs are announced publicly by the protocol team. Delistings often happen without protocol acknowledgment because the decision is made by the tracker, not by the protocol.
### How do I get historical yield data for tax reporting if a protocol is delisted?
DefiLlama maintains open-source adapters on GitHub for every tracked protocol. Download the historical TVL, fee, and APY data from the adapter repository before it gets archived. Alternatively, check Dune Analytics for user-created dashboards that query on-chain events directly. Some tax software including Koinly and CoinTracker can reconstruct accrued yield from wallet transaction history, but this is less accurate than pulling data directly from tracker APIs before delisting occurs.
The Weekly Yield Report
You now have the six-hour response protocol for when $170M vanishes from tracking at 3.05%. That protocol will be tested again, because tracker delistings happen every quarter.
Every Thursday: where crypto yield actually is - stablecoins, liquid staking and DeFi lending, with the risk named next to the rate and what changed since last week.
[Get it free every Thursday](#/portal/signup)
Free. No trade calls, no allocations, no hype. Unsubscribe in one click.
### The Fifteen-Minute Weekly Check For A Yield Portfolio
URL: https://altcoininvestor.com/defi-portfolio-monitoring-routine/
Last updated: 2026-09-26T17:04:12.000Z
## What This Routine Accomplishes
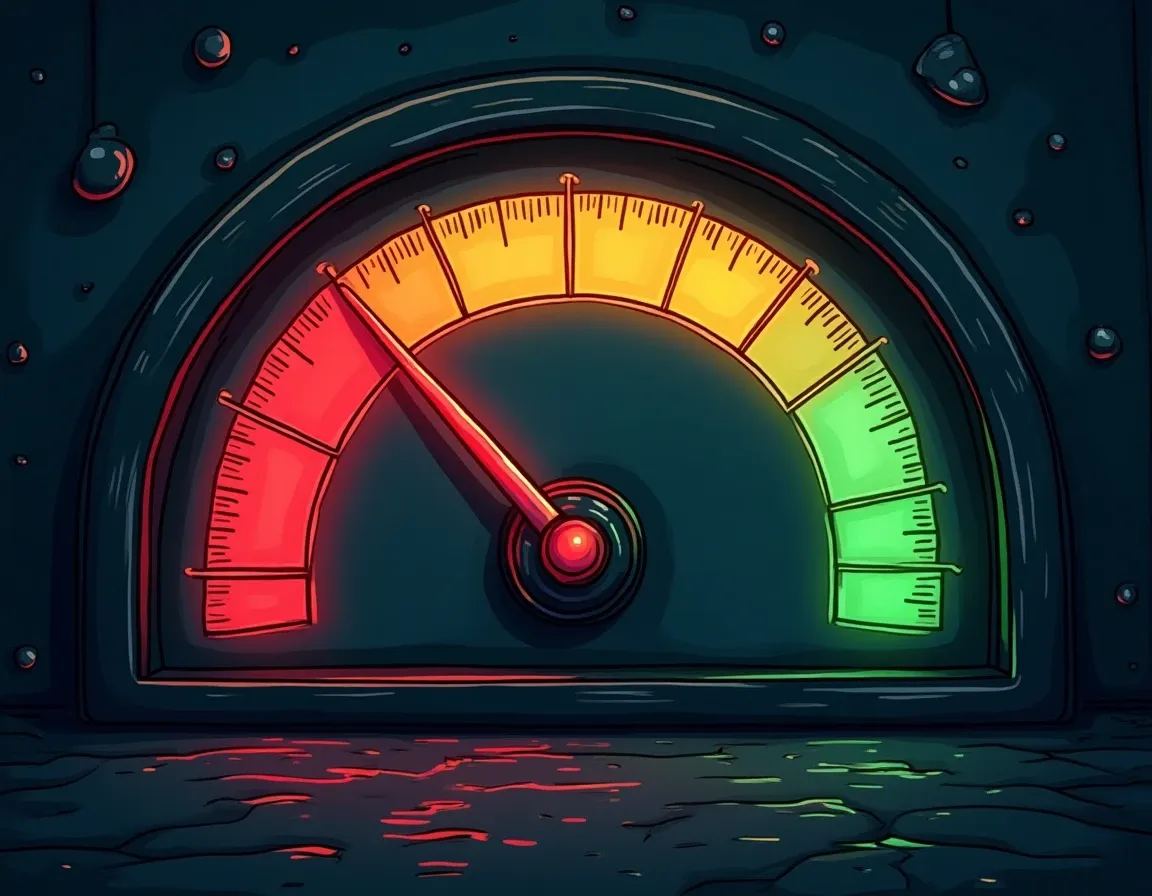
You will check five data points. In order. In fifteen minutes. Each one represents a mechanism that can fail while you're not watching. The rest of the monitoring advice you've seen is noise.
This routine catches liquidation risk, rate spikes, fee drift, peg failures, and position decay before they cost you money. It skips everything that costs time without reducing risk. The goal is not comprehensive surveillance. The goal is catching the specific conditions that would cause your yield positions to fail.
**Prerequisites:** You have at least one active DeFi position. Lending, LP provision, staking, or vault deposit. You know which protocol holds your capital and which assets you've deployed. You have wallet addresses and can access them.
## Step One: Check Health Factor on Lending Positions (Two Minutes)

If you have any collateralized borrowing position on Aave, Morpho, Euler, Compound, or Spark, check the health factor first. Not your collateral value. Not your borrow APR. The health factor number.
Health factor is the ratio of your collateral value (adjusted for liquidation thresholds) to your debt. Above 1.0 means safe. At 1.0 means liquidatable. Below 1.0 means liquidation is already happening. A health factor of 2.0 means your collateral can fall about 50% before you hit liquidation. A health factor of 1.2 means only about 17%.
Most [DeFi protocols](https://altcoininvestor.com/best-defi-protocols/) display health factor directly in the position UI. If yours does not, use [DefiLlama Portfolio](https://defillama.com/portfolio) or Otomato's liquidation calculator. Paste your wallet address. Read the number.
**Safe threshold:** 1.5 or higher. Below 1.5, you are one moderate price move from liquidation range.
**Red zone:** Below 1.25\. Add collateral or reduce debt immediately. Liquidators receive a bonus of 5-15% depending on the asset, paid directly from your collateral. You do not get a notification before this happens. The protocol executes liquidation the moment your health factor crosses 1.0.
**Common failure mode:** Correlated collateral. If you supplied ETH and stETH as collateral, both drop together in a downturn. The health factor math assumes asset independence, but correlated assets fail simultaneously. Diversify collateral types or accept that your actual liquidation threshold is higher than the displayed number suggests.
**Protocol-specific risk:** On Aave, one falling collateral asset drags the whole account's health factor down. On Morpho, each market is isolated. A borrower with three Morpho positions has three independent liquidation points. One can fail without touching the others. Understand which model your protocol uses.
Set up free liquidation alerts now if you have not already. Otomato and DeFi Monitor both offer real-time notifications when your health factor approaches 1.25\. This is not optional monitoring. This is the check that prevents a 15% loss in a single transaction.
## Step Two: Verify APY and Borrowing Rate Stability (Three Minutes)

Borrowing rates are dynamic. They react to utilization changes within a single block. A whale opening a large borrow, a new market integration, or a sudden withdrawal can push your borrow APR from 3% to 30% within minutes.
Check your current borrow APR against the rate you saw when you opened the position. If it has increased by more than 3-5 percentage points, investigate utilization. High utilization (above 85-90%) drives rate spikes. This is not a temporary fluctuation. This is the supply-demand mechanism responding to reduced liquidity.
For lending positions, check the supply APY. Compare it to the rate shown in [recent yield reports](https://altcoininvestor.com/weekly-yield-report-24-september-2026/) for the same asset and protocol. A drop of 2-3% APY is market noise. A drop of 5%+ signals a structural change: reduced demand, increased supply, or a shift in protocol incentives.
**What to do if rates moved:** Do nothing yet. Rates fluctuate. The question is whether the new rate justifies the position after accounting for fees. Calculate net APY: (gross APY) minus (performance fee percentage) minus (annual gas cost divided by position size). If net APY falls below 3-4%, the position may no longer be profitable after accounting for exit costs.
Use DefiLlama's yield page to compare your current net APY against alternatives in the same risk category. If three other protocols offer 2%+ higher net yield on the same asset with comparable TVL and audit history, rebalancing may justify the gas cost. But verify this with [break-even math](https://altcoininvestor.com/is-it-worth-moving-defi-position/) before moving. Most yield chasers lose money on the transaction costs, not the yield difference.
**Common failure mode:** Borrowing rate inversion. You are earning 4% on supplied USDC and paying 6% to borrow USDT. The position is losing 2% annually before accounting for liquidation risk. This happens when utilization spikes on the borrow side or drops on the supply side. Close the position or reduce leverage.
## Step Three: Calculate Net Yield After Fees (Four Minutes)
Most dashboards show gross APY. You earn net APY. The difference is often 30-50% of the displayed rate, especially on positions under $10,000.
Net yield decomposes into three components: gross APY, protocol fees, and gas amortized over the position duration. Protocol fees include performance fees (typically 5-20% of yield), withdrawal fees (0-2%), and management fees (0-1% annually). Gas includes entry transaction, any rebalancing or claim transactions, and exit transaction.
**Example calculation:** You deposit $5,000 into a Yearn vault showing 12% APY. Performance fee is 20%. Entry gas was $15\. You plan to hold for six months. Gross yield for six months: $300\. Performance fee: $60\. Entry gas amortized over six months: $15\. Exit gas (estimated): $15\. Net yield: $300 minus $60 minus $15 minus $15 equals $210\. Net APY: 8.4%, not 12%.
Small positions get destroyed by fixed costs. A $1,000 position paying 10% gross APY earns $100 annually. If entry and exit gas total $40 and performance fees take 20%, net yield is $60 for the first year. Net APY: 6%. The position needs to remain profitable for 18+ months to amortize gas costs effectively.
Check your position size against recent gas costs for the protocol. If gas has spiked (common during network congestion or major NFT mints), your exit cost may now exceed your accumulated yield. This is the condition that traps small positions: the cost to exit exceeds the benefit of redeploying elsewhere.
**What to check:** Log into your dashboard. Note gross APY. Subtract protocol performance fee percentage. Estimate annual gas by multiplying recent transaction costs by expected number of transactions. Divide by position size to get gas as a percentage of capital. Subtract that from the fee-adjusted APY. The result is your net APY.
If net APY is below 3-4%, the position is marginal. If net APY is below 2%, the position is likely unprofitable after accounting for opportunity cost and risk. Consider exit, but only after calculating whether exit gas would consume more value than holding to maturity.
## Step Four: Monitor Stablecoin Peg Health (Two Minutes)
Stablecoins depeg. When they do, collateralized positions lose value faster than health factor calculations adjust. The protocol treats $1.00 of a depegging stablecoin as $1.00 until the oracle updates. By the time the oracle reflects the $0.92 market price, liquidations have already executed at the old price.
Check the current market price of any stablecoin you hold or use as collateral. USDC, USDT, DAI, FRAX, and liquid staking derivatives like stETH all have peg risk. Compare the spot price on a major DEX (Uniswap, Curve) against the $1.00 or 1:1 parity expectation.
**Safe range:** Within 0.3% of peg. USDC trading at $0.997 to $1.003 is normal market noise.
**Warning range:** 0.3% to 1% off peg. USDC at $0.990 or stETH at 0.990 ETH signals stress. Investigate the cause. Check protocol Twitter, Discord, and recent governance proposals. Depeg events usually have visible triggers: regulatory action, liquidity crunch, oracle failure, or collateral shortfall.
**Red zone:** More than 1% off peg. Reduce exposure immediately. Depegs accelerate. A 2% gap can become 10% within hours if the mechanism driving the depeg is structural rather than temporary.
**Common failure mode:** Cascading liquidations during a depeg. You supplied USDC as collateral and borrowed DAI. USDC depegs to $0.95\. Your health factor drops even though you did nothing. Liquidation executes. You lose 10% of your collateral to the liquidation bonus. Then USDC repegs to $1.00 the next day. You took a permanent loss on a temporary depeg because you did not monitor peg health.
For liquid staking derivatives, check the stETH/ETH ratio on Curve. Sustained deviation above 0.5% indicates either liquidity stress or redemption queue buildup. Both are early warnings of larger stress conditions.
## Step Five: Review LP Position Status (Four Minutes, If Applicable)
If you provide liquidity to an AMM, check whether your position is still in range (for concentrated liquidity) and whether fee accumulation matches your expectations.
**Concentrated liquidity positions (Uniswap v3, v4):** Your position only earns fees when the market price is within your selected range. If price has moved outside your range, the position is idle. It holds 100% of one asset and earns zero fees. Check your position UI or use a tracker like DeBank to see current price relative to your range boundaries.
If the position is out of range, decide whether to rebalance now or wait for price to return. Rebalancing costs gas and may realize impermanent loss. Waiting costs opportunity: you earn nothing while out of range. The correct decision depends on your conviction about price mean reversion and the size of accumulated IL.
**Fee accumulation:** Compare your current unclaimed fees to the fees you expect based on pool volume and your share of liquidity. Most trackers show fees earned per day or per week. If your fee rate has dropped by 30%+ without a corresponding drop in pool volume, either your share of the pool has diluted (more LPs entered) or the fee tier has changed.
**Impermanent loss check:** IL is the opportunity cost of providing liquidity versus holding the underlying assets. As the AMM rebalances, it sells the outperforming asset and buys the underperformer. A small price move opens a small gap. A large move can erase weeks of accumulated fees.
For stable pairs (USDC/USDT, USDC/DAI), IL is minimal. Price rarely diverges more than 1-2%. For volatile pairs (ETH/USDC, BTC/USDC), IL compounds quickly. If one asset has moved 20%+ since you entered the position, calculate whether accumulated fees offset the IL. Most trackers display this automatically. If IL exceeds fees by more than 5%, the position is underwater.
**When to exit:** If the position is out of range and you do not expect price to return within two weeks, exit and redeploy. If IL exceeds fees by 10%+, exit unless you have strong conviction that price will mean revert. If pool TVL has dropped by 50%+ since you entered, liquidity is exiting. Investigate why before others front-run you out.
## What Not To Check (And Why)
Most monitoring routines waste time on data that does not reduce risk or improve returns. Here is what you can skip.
**Individual transaction history:** Unless you are preparing a tax report, reviewing every transaction from the past week provides no actionable information. The position's current state matters. How it got there does not.
**Real-time gas prices:** Gas price monitoring is only useful if you plan to execute a transaction within the next few hours. If you rebalance quarterly or monthly, checking gas daily is theater. Set a gas alert for your target threshold and ignore it otherwise.
**Token price charts:** Price is irrelevant unless your position is leveraged or collateralized. If you are earning yield on a stablecoin lending position, ETH's price does not matter. If you are LPing an ETH/USDC pair, price matters only for IL calculation, which you already checked in step five. Do not conflate portfolio monitoring with price speculation.
**Minor yield fluctuations:** If your Aave USDC position dropped from 3.85% to 3.62% APY, that is noise. Rates fluctuate daily based on utilization. A 2-3% change is not a signal. A 5%+ change is.
**Protocol governance proposals (most of the time):** Unless a proposal directly changes fee structures, liquidation parameters, or collateral factors for an asset you hold, governance votes do not affect your position this week. Check governance monthly, not weekly.
**Audit age:** An 18-month-old audit does not become riskier this week than it was last week. Audit decay is real, but it operates on a 6-12 month cycle as protocols push upgrades. If you chose the protocol based on its audit history, re-evaluate that decision every six months, not every seven days.
## Automation and Tools That Save Time
Set up liquidation alerts on both Otomato and DeFi Monitor. Free tiers are sufficient. Configure alerts to trigger at 1.3 health factor, not 1.1\. By the time you get a 1.1 alert, you may not have time to add collateral before liquidation executes.
Use DefiLlama or DeBank to aggregate positions across wallets and protocols in one dashboard. Both are free. Both decode complex positions (LP tokens, staked derivatives, vault shares) automatically. You do not need a premium tracker unless you are managing 20+ positions across 10+ chains.
Skip manual APY tracking. Instead, enable weekly rate change notifications if your protocol supports them. Aave, Compound, and Morpho all offer this. You receive an email or Telegram message only when rates move by more than a defined threshold. No rate change, no notification, no time wasted checking.
For positions under $5,000, consider quarterly reviews instead of weekly. The opportunity cost of your time often exceeds the risk reduction from weekly monitoring on small positions. Weekly checks matter when position size is large enough that a 10% loss would be material.
## Real Failure Modes and Early Warning Signs
The protocols getting exploited in 2025 were not the ones skipping audits. They were the ones getting bad audits. $2.3 billion was lost this year from protocols that had audit reports. An audit from 18+ months ago may not reflect current contract upgrades, new integrations, or changes in economic assumptions.
Check whether your protocol has pushed a major upgrade in the past 90 days. Major upgrades reset the security clock. A protocol that was safe for 24 months becomes a new risk surface the day it deploys v2\. If your position is on a recently upgraded protocol, increase monitoring frequency to weekly regardless of position size.
**Oracle manipulation risk:** Price oracle manipulation attacks are growing in sophistication. Protocols that integrate off-chain data without redundancy or circuit breakers remain vulnerable. Dashboards do not flag this risk. You need to verify oracle architecture manually. Check whether the protocol uses Chainlink (generally safe), a proprietary oracle (higher risk), or a single-source oracle (extreme risk). If you cannot determine the oracle source from documentation, that is itself a risk signal.
**TVL divergence:** If your protocol's TVL has dropped 30%+ in the past month while the broader market TVL is flat or growing, liquidity is exiting faster than it is entering. This is an early warning. Investigate why. Common causes: rate compression, a competing protocol launched, a security incident, or a governance dispute. All of these can precede larger failures.
**Yield rising without mechanism explanation:** If your position's APY increases by 5%+ without a corresponding increase in protocol activity or token emissions, investigate the source. Yield does not appear from nowhere. Either utilization spiked, the protocol is subsidizing rates temporarily, or emissions increased (which means dilution). Sustainable yield comes from fees paid by protocol users. Unsustainable yield comes from token printing or VC subsidies. Both end.
Read the protocol's latest financial report or treasury update if available. Morpho, Aave, and Compound publish regular transparency reports showing fee revenue, reserves, and subsidy burn rate. If subsidy burn rate is accelerating and reserves are declining, the current yield is not sustainable. Plan your exit before the subsidy ends.
## When to Escalate From Weekly to Daily Monitoring
Weekly monitoring is sufficient for stable positions in established protocols during normal market conditions. Escalate to daily checks under these conditions:
**Health factor below 1.5:** You are in the danger zone. Daily price monitoring and collateral ratio checks prevent liquidation.
**Stablecoin trading more than 0.5% off peg for three consecutive days:** Persistent depeg is a mechanism failure signal, not a temporary liquidity event.
**Protocol TVL declining 10%+ per week:** Sustained liquidity exit indicates either a known problem you have not yet identified or an unknown problem about to become known.
**Your position represents more than 20% of your crypto portfolio:** Concentration risk justifies increased monitoring frequency.
**Major market volatility (BTC or ETH moving 15%+ in 48 hours):** Correlated liquidations cascade during high volatility. Even if your health factor was safe at 2.0, a 20% collateral price drop in one day puts you at 1.6, approaching danger.
## The Takeaway
Five checks in fifteen minutes. Health factor, rate stability, net yield, peg health, LP status. Everything else is noise unless your position is large enough to justify the time cost of deeper analysis.
The routine works because it targets the specific failure modes that cost money: liquidation, rate inversion, fee erosion, depeg contagion, and range exit. These are mechanism failures, not market failures. You can see them coming if you know where to look.
Set alerts. Use free tools. Check weekly unless conditions escalate. The goal is not comprehensive surveillance. The goal is catching the problems that matter before they cost more than fifteen minutes would have saved.
## Frequently Asked Questions
### How often should I check my DeFi yield positions?
Weekly monitoring is sufficient for stable positions in established protocols during normal market conditions. Escalate to daily checks if your health factor drops below 1.5, if a stablecoin you hold trades more than 0.5% off peg for three consecutive days, if protocol TVL declines 10%+ per week, if your position represents more than 20% of your portfolio, or during major market volatility (BTC or ETH moving 15%+ in 48 hours).
### What is a safe health factor for DeFi lending positions?
A health factor of 1.5 or higher is the safe threshold. Below 1.5, you are one moderate price move from liquidation range. Below 1.25 is the red zone and requires immediate action: add collateral or reduce debt. At 1.0, liquidation executes automatically with no warning. Liquidators receive a 5-15% bonus depending on the asset, paid directly from your collateral.
### How do I calculate net yield after fees on a DeFi position?
Net yield equals gross APY minus protocol fees minus amortized gas costs. Protocol fees typically include 5-20% performance fees, 0-2% withdrawal fees, and 0-1% annual management fees. Gas costs include entry transaction, any rebalancing or claim transactions, and exit transaction, divided by position size and holding duration. On positions under $10,000, combined fees can consume 30-50% of gross yield.
### When should I exit a liquidity provision position?
Exit if your concentrated liquidity position is out of range and you do not expect price to return within two weeks. Exit if impermanent loss exceeds accumulated fees by 10% or more, unless you have strong conviction that price will mean revert. Exit if pool TVL has dropped by 50%+ since you entered, as this signals liquidity is exiting faster than entering. Calculate exit costs before moving to ensure the rebalancing justifies the gas expense.
### What are the warning signs that a DeFi protocol might fail?
Watch for TVL declining 30%+ while the broader market is flat, yield rising 5%+ without mechanism explanation, stablecoin pegs deviating more than 1% for sustained periods, subsidy burn rate accelerating while reserves decline, major upgrades in the past 90 days (which reset the security clock), and inability to verify oracle architecture from documentation. Oracle manipulation, correlated collateral failures, and governance disputes often precede larger protocol failures.
The Weekly Yield Report
You just learned which five checks catch liquidation, depeg, and rate failures in fifteen minutes weekly. Those failure modes will show up differently in your next position.
Every Thursday: where crypto yield actually is - stablecoins, liquid staking and DeFi lending, with the risk named next to the rate and what changed since last week.
[Get it free every Thursday](#/portal/signup)
Free. No trade calls, no allocations, no hype. Unsubscribe in one click.
### How To Earn Passive Income With Yield-Bearing Stablecoins
URL: https://altcoininvestor.com/earn-passive-income-yield-bearing-stablecoins/
Last updated: 2026-09-26T16:04:08.000Z
As of September 2026, four yield-bearing stablecoins offer APYs between 3.6% and 7.1%, with mechanisms that range from U.S. Treasury bills to perpetual-futures basis trades. The spread between them isn't random. It's a risk premium. This walkthrough covers the setup, the yield sources, the redemption terms, and the specific mistakes that turn a low-risk position into a loss.
## What You Will Accomplish
By the end of this article, you will know how to deposit stablecoins into one or more yield-bearing tokens, how to compare the four primary options as of 2026, and how to avoid the three most common errors that erode returns. You need a self-custody wallet, $100 to $1,000 in stablecoins, and enough ETH or SOL to cover gas fees.
The four tokens covered here are sUSDe (Ethena), sUSDS (Sky Protocol), sFRAX (Frax), and USDY (Ondo Finance). Each uses a different collateral model. Each carries a different redemption structure. The decision tree depends on your time horizon, risk tolerance, and whether you can accept a cooldown period on withdrawal.
## Where Yield-Bearing Stablecoin Yield Comes From
Yield-bearing stablecoins generate returns through four primary engines: short-duration U.S. Treasury bills, onchain lending demand, basis trades that capture the spread between perpetual futures and spot, or protocol incentives paid in the issuer's own token. The mechanism determines both the baseline APY and the volatility of that APY over time.
T-bill-backed tokens like USDY hold short-term U.S. Treasuries and bank demand deposits. The yield tracks the federal funds rate plus a thin protocol margin. As of September 2026, USDY pays 4.65% APY with $740 million in supply. The 12-month range for this category has been 4.2% to 5.3%, moving in lockstep with the Fed.
Savings-rate tokens like sUSDS derive yield from protocol lending and real-world-asset loans. Sky sets the Sky Savings Rate independently and publishes it at sky.money. The current rate is 3.6% APY, down from a 12-month high of 9.0%. The rate reflects a Fed funds rate near 4.5% plus a spread for protocol margin and RWA loan premium. Redemption is instant.
Basis-trade tokens like sUSDe capture funding-rate spreads from delta-neutral positions. Ethena backs USDe with long staked ETH and liquid restaking collateral, paired with short perpetual futures of equivalent notional value. The hedge cancels price exposure. Funding payments from short perps and staking yield from the spot leg accrue to sUSDe stakers. As of September 2026, the 7-day trailing APY sits at 7.1%, down from 9.4% in April. The 2024-2025 realized range was roughly 4% to 30%, with most periods between 8% and 18%.
Benchmark-optimized tokens like sFRAX alternate between carry-trade, algorithmic market operations, and the Interest on Reserve Balances rate. Frax governance selects the highest-yielding strategy among three approved options. As of July 2026, sFRAX pays 4.1% APY. The historical range has settled between 5% and 10% depending on utilization curves.
The headline takeaway: 4% to 5% is the real-rate floor you should expect from any low-risk venue. Anything paying meaningfully above that is compensating you for smart-contract risk, duration risk, basis-trade risk, or counterparty risk.
## Step-by-Step Setup for a $500 to $1,000 Position
The recommended allocation for a first position under $1,000 is a 50/30/20 split: 50% into sUSDS for baseline exposure, 30% into sUSDe for funding upside, and 20% into USDY for T-bill collateral. This balances yield, liquidity, and diversification across three distinct mechanisms.
### Step 1: Acquire the Base Stablecoins
Each yield-bearing token requires a corresponding base stablecoin. For sUSDS, you need USDS. For sUSDe, you need USDe. For sFRAX, you need FRAX. For USDY, you deposit USDC and receive USDY in return. All four accept positions below $100\. Ethereum mainnet is the primary deployment chain, though USDY is also available on Solana, Mantle, Sui, and Aptos with lower gas costs.
If you hold USDC or USDT on a centralized exchange, withdraw to your self-custody wallet on Ethereum or an L2\. Gas fees on Base or Arbitrum are lower than mainnet. For USDY on Solana, gas costs are under $0.01 per transaction.
### Step 2: Deposit Into sUSDS (50% of Position)
Navigate to sky.money and connect your wallet. The interface displays the current Sky Savings Rate, which as of this writing is 3.6% APY. Approve the USDS spending limit, then deposit. You will receive sUSDS at a rising exchange rate. The token does not rebase. Your balance remains constant while the redemption rate increases.
Redemption is instant with no cooldown. You can convert sUSDS back to USDS at any time with no fee beyond gas. This makes sUSDS the lowest-friction option for liquidity needs. The primary risk is protocol governance changes to the savings rate. Sky has decreased the rate four times over the past 12 months in response to Fed policy and internal surplus management.
### Step 3: Deposit Into sUSDe (30% of Position)
Acquire USDe through a DEX swap or direct mint from Ethena. Navigate to app.ethena.fi and connect your wallet. Approve the USDe spending limit, then stake. You will receive sUSDe at the current exchange rate. The APY compounds automatically as the redemption rate rises.
The 7-day cooldown on unstaking is the most operationally significant friction point. When you initiate an unstake, your sUSDe is locked for seven days before you can redeem it for USDe. During high-volatility periods, this window represents opportunity cost or, in extreme cases, peg-risk exposure. Do not deploy sUSDe for emergency liquidity. The cooldown was added in 2024 to manage redemption queues during stress events.
The yield depends on perpetual funding staying positive. Funding rates are highest during bull markets when long demand outpaces shorts. They are lowest, and can briefly flip negative, when sentiment turns bearish and longs unwind. Ethena retains a portion of revenue in an insurance fund that absorbs negative funding periods. The fund stood at $73 million in June 2026, against $4.4 billion of USDe supply, approximately 1.7%. When funding turns negative, the protocol can subsidize the headline rate from the fund rather than letting yield go to zero.
### Step 4: Deposit Into USDY (20% of Position)
USDY is accessible to non-U.S. individual and institutional investors. Navigate to ondo.finance and complete the KYC process. Deposit USDC and receive USDY at a 1:1 rate. The token accrues yield daily through a rising redemption rate, similar to sUSDS and sUSDe.
The critical constraint is the 40-50 day lockup on new mints. USDY is transferable onchain 40 to 50 days after purchase. If you need liquidity before that window closes, you must sell on the secondary market, which may incur slippage. Plan accordingly. After the lockup expires, redemption is available through the Ondo interface with T+1 settlement.
USDY publishes daily reserve attestations. The collateral is short-term U.S. Treasuries and bank demand deposits. The yield is stable relative to sUSDe but lower. The 12-month range has been 4.2% to 5.3%, tracking the federal funds rate with minimal volatility.
### Optional: Add sFRAX for Benchmark Diversification
If you want exposure to a governance-optimized strategy, acquire FRAX and navigate to app.frax.finance. Approve and deposit FRAX to receive sFRAX. The token does not rebase. Yield accrues through a rising redemption rate. Redemption is instant with no cooldown and no price impact.
sFRAX targets the highest yield among three governance-approved strategies: carry-trade, algorithmic market operations, and the IORB rate. As of July 2026, the APY is 4.1%. The historical range has been 5% to 10% depending on market conditions and utilization curves. The primary risk is governance changes to strategy allocation.
## The Three Mistakes That Turn Low-Risk Into Loss
The first mistake is timing basis trades without understanding funding-rate cycles. Buying sUSDe during a bull market when funding peaks above 15% APY, then holding through a bear market when funding inverts, locks you into a position that may yield below T-bills or even go slightly negative. The insurance fund can subsidize short periods of negative funding, but it is not infinite. The fund stood at $73 million against $4.4 billion of supply in June 2026, roughly 1.7%. A sustained funding collapse would drain it faster than protocol revenue replenishes.
The second mistake is ignoring the cooldown when deploying sUSDe. If you treat sUSDe as emergency liquidity and need to exit during a volatility spike, the 7-day unstaking delay means you cannot react. During that window, the peg could break, funding could invert, or the broader market could move against you. Only deploy sUSDe with capital you can afford to lock for at least two weeks, accounting for the cooldown plus execution time.
The third mistake is chasing APY without understanding the collateral model. USDY pays 4.65% because it holds T-bills. sUSDe pays 7.1% because it runs a perpetual-futures hedge on centralized exchanges. Those are not equivalent risk profiles. USDY carries duration risk and custodial risk. sUSDe carries exchange counterparty risk, liquidation-cascade risk, and peg risk if the hedge fails. Ethena names six risks for sUSDe: smart contract, external platform, liquidity, custodial operational, exchange counterparty, and market risk. Do not assume higher yield means better opportunity. Assume it means you are being compensated for taking on more failure modes.
## Comparative APY Summary and Real Yield Net of Fees
As of September 2026, T-bill-backed tokens pay 4.5% to 5%. Savings-rate tokens like sUSDS pay 3.6% to 4.75%. Delta-neutral tokens like sUSDe pay 7% to 12% with higher volatility. Benchmark-optimized tokens like sFRAX pay 4.1% to 5%. Aave and Morpho lending markets pay 4% to 7% depending on utilization, for comparison.
All four yield-bearing tokens claim 0% protocol fees on yield. The fee-equivalent is operational friction. For sUSDe, the 7-day cooldown is an opportunity cost. For USDY, the 40-50 day lockup on new mints is a liquidity cost. For sUSDS and sFRAX, the cost is negligible because redemption is instant.
APY volatility matters. sUSDe has ranged from 4% to 30% over the past two years. sFRAX has ranged from 5% to 10%. sUSDS has ranged from 3.6% to 9%. USDY has ranged from 4.2% to 5.3%. If you need predictable cash flow, favor USDY or sUSDS. If you can tolerate variability in exchange for higher upside, favor sUSDe.
Collateral transparency also varies. USDY publishes daily reserve attestations. sUSDS publishes surplus buffer data. sUSDe publishes insurance fund balances. sFRAX relies on governance proposals for strategy allocation. None of these are audited in real time, but USDY and sUSDS offer the most public reporting.
## Risk Stack and Failure Modes Per Option
Each yield-bearing stablecoin carries a distinct failure mode. For sUSDe, the primary risk is peg breakage if the delta-neutral hedge fails. USDe maintains its dollar peg through the hedge. If the short perp positions cannot be maintained due to exchange insolvency, mass liquidation cascades, or extreme negative funding, the peg could break. The insurance fund provides a buffer, but it is finite. A sustained funding inversion or exchange failure could deplete the fund faster than revenue replenishes.
For sUSDS, the primary risk is governance changes to the savings rate. Sky has decreased the rate four times over the past 12 months. The protocol can lower the rate unilaterally in response to internal surplus management or external rate environments. There is no guarantee the rate will remain above the federal funds rate. The secondary risk is smart-contract risk. Sky is a fork of MakerDAO with upgrades. The code has been audited, but all DeFi protocols carry residual exploit risk.
For USDY, the primary risk is custodial and regulatory. Ondo holds the underlying Treasuries through a regulated custodian. If the custodian fails, or if regulatory action freezes the collateral, redemptions could be delayed or impaired. The secondary risk is geographic restriction. USDY excludes U.S. persons. If you are a U.S. citizen or resident, you cannot legally hold USDY. Violating this restriction could result in forfeiture.
For sFRAX, the primary risk is governance changes to strategy allocation. Frax governance can shift the collateral mix among carry-trade, algorithmic market operations, and IORB exposure. If governance selects a lower-yielding strategy, your APY drops. The secondary risk is smart-contract risk. The sFRAX vault has been audited, but strategy complexity introduces additional attack surface.
The common risk across all four is smart-contract risk. Every yield-bearing stablecoin relies on code that has not been battle-tested for a full market cycle. A critical exploit in any of these contracts could result in partial or total loss of funds. Diversification across multiple protocols reduces but does not eliminate this risk.
## What to Do Next
Once you have deployed your position, monitor three metrics: the absolute APY, the trend in APY over the past 30 days, and the redemption queue depth if applicable. For sUSDe, check the insurance fund balance monthly at app.ethena.fi. For sUSDS, check the savings rate at sky.money. For USDY, check the attestation reports at ondo.finance. For sFRAX, check the strategy allocation in Frax governance forums.
Set a calendar reminder to review your allocation every 90 days. If sUSDe funding drops below 5% for more than two weeks, consider reallocating to sUSDS or USDY. If sUSDS savings rate drops below 3%, consider reallocating to USDY or sFRAX. If USDY yield drops below 4%, consider whether the lockup and KYC overhead are worth the spread over sUSDS.
Do not chase APY spikes. A sudden jump in sUSDe yield to 15% likely means funding rates have spiked due to speculative leverage. That environment is historically short-lived. Entering at the peak means you capture the decline, not the spike.
For additional context on stablecoin yield strategies across multiple venues, see [How To Earn Passive Income From Stablecoins In 2026](https://altcoininvestor.com/how-to-earn-passive-income-stablecoins-2026/), which covers CeFi platforms, DeFi lending, and additional yield-bearing tokens. For a side-by-side breakdown of these four products with deeper mechanic analysis, see [Best Yield-Bearing Stablecoins Compared](https://altcoininvestor.com/best-yield-bearing-stablecoins/). For a beginner-focused walkthrough on earning interest with a smaller position and lower risk tolerance, see [How To Earn Interest On Stablecoins As A Beginner](https://altcoininvestor.com/how-to-earn-interest-on-stablecoins/).
## The Takeaway
You now have the deposit process, the yield sources, the redemption terms, and the failure modes for four yield-bearing stablecoins. sUSDe pays the highest APY but carries a 7-day cooldown and funding-rate volatility. sUSDS pays mid-range APY with instant redemption and governance risk. USDY pays T-bill rates with a 40-50 day lockup and geographic restrictions. sFRAX pays benchmark-optimized rates with instant redemption and governance risk.
The allocation depends on your liquidity needs, your risk tolerance, and your jurisdiction. If you need instant liquidity, favor sUSDS or sFRAX. If you can tolerate a cooldown for higher yield, favor sUSDe. If you want T-bill exposure and can accept a lockup, favor USDY.
Monitor the APY trend, not just the headline number. A 7% APY that has been stable for six months is more reliable than a 10% APY that spiked two weeks ago. The numbers above are current as of September 2026\. They will change. Set a reminder to review your position every 90 days and adjust when the spread between products narrows or inverts.
For current stablecoin supply and yield data across all products, see [DeFiLlama's stablecoin dashboard](https://defillama.com/stablecoins).
## Frequently Asked Questions
### What is the safest yield-bearing stablecoin for beginners in 2026?
USDY and sUSDS represent the lowest-risk options as of September 2026\. USDY holds short-term U.S. Treasuries and pays 4.65% APY with custodial oversight and daily attestations. sUSDS pays 3.6% APY through Sky Protocol's savings rate with instant redemption and no lockup. Both avoid the funding-rate volatility of basis-trade tokens like sUSDe. USDY requires KYC and excludes U.S. persons, while sUSDS has no geographic restrictions. For a first position under $1,000, a 50/50 split between sUSDS and USDY balances yield, liquidity, and diversification across two distinct collateral models.
### Why does sUSDe pay more than USDY if both are stablecoins?
sUSDe pays 7.1% APY compared to USDY's 4.65% because it runs a delta-neutral basis trade on centralized exchanges, capturing perpetual-futures funding rates and staking yield. USDY holds U.S. Treasury bills and tracks the federal funds rate. The 2.45% spread compensates sUSDe holders for exchange counterparty risk, liquidation-cascade risk, funding-rate volatility, and a 7-day unstaking cooldown. USDY carries custodial risk and a 40-50 day lockup but avoids exchange exposure. Higher yield reflects additional failure modes, not superior returns. The spread narrows when perpetual funding rates decline during bearish sentiment or when Treasury yields rise.
### Can I lose money holding sUSDe if funding rates go negative?
Yes, but Ethena's insurance fund provides a buffer. sUSDe yield depends on perpetual funding staying positive. When funding flips negative during bear markets or long unwinding, the protocol's $73 million insurance fund subsidizes the rate rather than passing losses to holders. The fund stood at 1.7% of USDe supply as of June 2026\. A sustained negative-funding period could drain the fund faster than protocol revenue replenishes, at which point sUSDe yield would decline or briefly go negative. Historically, funding inversions have lasted days to weeks, not months. The insurance fund has absorbed every inversion since launch, but it is finite and not guaranteed.
### What happens if I need to exit sUSDe before the 7-day cooldown ends?
You cannot redeem sUSDe for USDe during the 7-day cooldown. Your only exit is selling sUSDe on the secondary market through a DEX like Curve or Uniswap, which may incur slippage if liquidity is thin or if the peg has deviated. During high-volatility periods, sUSDe has traded at a 0.5% to 2% discount to its redemption value due to cooldown friction. If you initiate an unstake and change your mind, you cannot reverse the process. The cooldown is non-negotiable. Only deploy sUSDe with capital you can afford to lock for at least two weeks, accounting for cooldown plus execution time.
### How often should I rebalance between sUSDe, sUSDS, sFRAX, and USDY?
Review your allocation every 90 days and rebalance when the spread between products narrows or inverts, or when your liquidity needs change. If sUSDe funding drops below 5% for more than two weeks, consider reallocating to sUSDS or USDY. If sUSDS savings rate drops below 3%, consider whether the spread over USDY justifies staying. If USDY yield drops below 4%, assess whether the lockup and KYC overhead are worth the premium. Avoid chasing APY spikes. A sudden jump in sUSDe to 15% likely reflects speculative leverage that will revert within weeks. Monitor the 30-day trend, not the headline number. Set a calendar reminder rather than reacting to daily fluctuations.
The Weekly Yield Report
You have just walked through four stablecoin yield products paying between 3.6% and 7.1% APY. Those rates and risk stacks will change next month.
Every Thursday: where crypto yield actually is - stablecoins, liquid staking and DeFi lending, with the risk named next to the rate and what changed since last week.
[Get it free every Thursday](#/portal/signup)
Free. No trade calls, no allocations, no hype. Unsubscribe in one click.
### What Is A DAO? How Decentralized Organizations Work
URL: https://altcoininvestor.com/what-is-a-dao/
Last updated: 2026-09-26T15:06:13.000Z
## What A DAO Actually Is

A DAO is a Decentralized Autonomous Organization. It is a governance structure built on smart contracts. Token holders vote on proposals. Approved proposals execute on-chain. No central board. No CEO. No legal entity in most cases.
The theory: community-owned protocols governed by transparent voting mechanisms. The reality: over 13,000 DAOs exist globally in 2026, managing more than $25 billion in treasury assets. Most of them are functionally controlled by a handful of whales, struggle with voter participation below 10%, and operate more like oligarchies than democracies.
Understanding DAOs matters if you plan to participate in airdrop farming or governance participation income. Many protocols reward governance engagement with token distributions. But those rewards come with specific costs: gas fees for voting, time spent reading proposals, and exposure to governance attacks that can drain treasuries. You need to know what you are participating in before you spend capital on governance tokens.
## How DAO Governance Mechanics Work

Most DAOs operate on a simple voting mechanism. One token equals one vote. Token holders submit proposals, typically through forum discussion followed by a formal on-chain or off-chain vote. The voting period lasts three to seven days. A quorum requirement sets the minimum participation threshold. A majority threshold sets the approval bar, typically 50% or higher.
If a proposal passes, it enters a timelock period. This delay lasts 24 to 48 hours. The timelock serves as a safety mechanism. If a malicious proposal somehow passes, the community has time to react before execution.
After the timelock expires, the proposal executes on-chain. For simple parameter changes, this happens automatically via smart contract. For complex decisions like treasury allocations or protocol upgrades, execution often requires a multisig transaction signed by designated protocol stewards.
Snapshot processes 96% of major DAO votes. Snapshot voting is off-chain, meaning it costs no gas. Token holders sign a message with their wallet, and their voting power is calculated based on their token balance at a specific block height. This keeps voting cheap and accessible. But it introduces a trust layer. Off-chain votes do not automatically execute. Someone must implement the decision, usually a multisig or core team.
Safe secures over $22 billion in DAO treasury assets. Safe is a multisig wallet requiring multiple signatures to authorize transactions. Many DAOs use Safe to hold their treasury and execute approved proposals. The multisig signers become a critical point of centralization. If they refuse to execute a vote, the DAO cannot act.
### Token Distribution and Voting Power
Token distribution determines who actually controls a DAO. The top 20% of stakeholders hold 78% of DAO tokens. In practice, 1% of token holders control 90% of voting power across major DAO projects studied in 2025\. The median voter owns just 47 tokens and has never influenced a single outcome.
This is not theoretical. According to Boardroom's 2025 governance data, 87% of DAO proposals are decided by wallets holding more than 10,000 tokens. Voter participation typically falls between 5% and 15%. A 2025 study across 50 DAOs found a median voter participation rate of just 4.16%. Uniswap has over a million token holders, but a typical governance vote attracts a few hundred voters.
Distribution and decentralization are not the same thing.
You can airdrop tokens to a million wallets and still end up with three whales running the protocol, because those three whales will be the only ones showing up to vote every week.
### Delegation Systems
Delegation was supposed to solve the voter apathy problem. Token holders delegate their voting power to professional delegates who specialize in governance. These delegates read proposals, participate in forum discussions, and vote on behalf of their delegators.
In practice, delegation created a new class of governance oligarchs. A small number of highly engaged actors, often fewer than twenty across an entire protocol, accumulate enormous delegated power. When these delegates coordinate, they can push through proposals with minimal broader consensus. When they disengage, entire governance systems stall.
The delegation model concentrates power without necessarily improving decision quality. Delegates face no binding fiduciary duty. Most operate pseudonymously. If they vote against the interests of their delegators, there is no recourse beyond un-delegating, which few token holders bother to do.
## What DAOs Have Actually Delivered
Some DAOs have delivered measurable outcomes. Uniswap DAO manages a decentralized exchange with assets exceeding $2.6 billion under community governance. Aave DAO oversees DeFi lending with $1.3 billion in treasury and governance over asset listings. MakerDAO runs a stablecoin protocol with a treasury exceeding $1 billion, entirely managed by community votes.
Gitcoin DAO has distributed over $45 million in grants to open-source blockchain projects. Charity DAOs like Giveth have distributed over $35 million to social and environmental causes. These are real capital allocations decided by token holder votes, not corporate boards.
Protocol parameter adjustments happen regularly. DAOs vote on collateralization ratios, interest rate models, fee structures, and token emission schedules. These decisions have direct financial impact. A vote to adjust Aave's liquidation threshold changes the risk profile for every borrower on the platform. A vote to modify Uniswap's fee tier affects profitability for every liquidity provider.
Some governance decisions work. The mechanism functions when proposals are clear, stakes are aligned, and participation is sufficient.
### What DAOs Have Not Delivered
DAOs have not delivered meaningful decentralization. Decentralized governance was supposed to replace boardrooms. Instead, it created new kinds of oligarchy. Whale dominance remains structural. Delegation concentrates power. Multisig signers control execution.
Most governance tokens offer voting rights without economic benefits. Holding a governance token in 2025 typically means you can vote on proposals and nothing else. No share of protocol revenue. No dividends. No buyback support. Token holders bear the cognitive and time costs of governance while capturing none of the financial upside their decisions generate.
This creates rational apathy. Voting costs gas. Understanding proposals requires reading technical documentation. The expected impact of any single vote is near zero. The same problem that plagues political elections hits DAOs harder because the stakes feel less personal.
Decision-making is slow. On-chain voting is expensive and slow compared to a board's agile decision-making. Proposals on Compound or MakerDAO take weeks. This creates governance paralysis during crises like a hack or market dislocation. By the time a DAO votes to respond, the damage is done.
Governance fatigue is real. Many DAOs try to decentralize everything, from buying office supplies to changing core protocol parameters. Voters tune out. Participation drops. The same 50 wallets decide everything.
## How DAOs Fail: Specific Mechanism Breakdowns
DAOs fail in specific, predictable ways. Understanding the failure modes matters if you hold governance tokens or participate in DAO voting for airdrop rewards.
### Flash Loan Governance Attacks
Flash loan governance attacks exploit blockchain transaction atomicity. An attacker borrows millions in governance tokens, votes on a proposal, and repays the loan in a single block. The technical elegance makes detection nearly impossible. Traditional voting delays provide insufficient protection.
In April 2022, an attacker used flash loans to borrow over a billion dollars of assets from [Aave](https://altcoininvestor.com/liquid-staking/), converted them through Curve into the LP tokens Beanstalk's Silo accepted, reached a supermajority of governance weight, and invoked Beanstalk's emergencyCommit function. This bypassed the normal proposal lifecycle and drained $182 million.
The failure mode is structural. If governance tokens are available for borrowing, they are available for attack. The timelock does not help. The attacker controls the vote outcome, not the execution timing.
### Whale Coordination and Capture
The Compound DAO GoldenBoyz attack of 2024 involved attackers using three progressive proposals (247, 279, 289) to attempt transferring 499,000 COMP tokens worth $25 million. The attack succeeded through the voting stage because a small number of coordinated wallets controlled sufficient voting power. It failed only because community members noticed before the timelock expired.
BonkDAO lost $20 million because a harmful proposal passed largely unopposed due to insufficient attention. The proposal looked routine. Most token holders ignored it. The whales who bothered to read it had different incentives than the broader community.
Coordination failure among dispersed token holders enables coordination success among concentrated whales.
### Governance Pauses and Abandonment
Jupiter DAO froze all governance voting and locked its treasury until 2027\. Scroll DAO paused operations entirely after its leadership resigned in confusion over which proposals were even active. Yuga Labs walked away from its DAO structure with a blunt statement about dysfunction.
Balancer DAO revenue declined from over $1 million per month in October 2025 to approximately $30,000 in August 2026, a 97% drop. The governance system did not adapt. Voter participation declined alongside revenue. The DAO entered a death spiral: poor performance reduced engagement, reduced engagement prevented corrective action, lack of correction worsened performance.
When the mechanism stops delivering value, participants leave. When participants leave, the mechanism breaks.
## Alternative Voting Mechanisms
Some DAOs experiment with alternative voting structures to address whale dominance and voter apathy. Snapshot data from Q1 2026 shows 34% of major DAOs now use hybrid voting mechanisms combining multiple models.
### Quadratic Voting
Quadratic voting aims to give smaller holders more influence by making additional votes exponentially more expensive. Casting 1 vote costs 1 token. Casting 4 votes costs 16 tokens. Casting 9 votes costs 81 tokens. This encourages broader participation over concentrated power.
The mechanism reduces whale dominance but introduces new problems. Quadratic voting is vulnerable to Sybil attacks. A whale can split tokens across multiple wallets and vote from each wallet separately, circumventing the quadratic cost curve. Preventing this requires identity verification, which conflicts with pseudonymous governance.
### Conviction Voting
Conviction voting is used in protocols that focus on sustained change over quick decisions. Tokens contribute to a proposal's conviction over time. The longer a token is staked to vote for a proposal, the more weight it carries. This prevents last-minute whale attacks and rewards long-term commitment.
The mechanism works for slow-moving grant allocations. It fails for urgent decisions like security responses or parameter adjustments during market stress.
No voting mechanism solves the underlying problem. Governance requires engagement. Engagement requires incentives. Most DAOs offer voting rights without economic upside. The incentive structure is broken.
## When DAO Participation Matters for Income
DAO participation can generate income in specific contexts. Many protocols reward governance engagement with token distributions. Optimism's OP token airdropped to active governance participants. Arbitrum's ARB token allocated a portion to DAO voters. Uniswap has hinted at future rewards for delegated voting power.
The income mechanism is indirect. You hold governance tokens, delegate or vote actively, and position yourself for future airdrop allocations. The cost is gas fees for on-chain votes, time spent reading proposals, and capital locked in governance tokens that may not appreciate.
The strategy works if the airdrop value exceeds the participation costs. For most small holders, it does not. If you hold 100 governance tokens worth $500 and spend 5 hours reading proposals plus $20 in gas fees per vote, you need a significant airdrop to break even. The math rarely works unless you are farming multiple DAOs simultaneously with scripted voting strategies.
Professional delegates earn income by accumulating delegated voting power and charging fees or receiving protocol grants. This requires reputation, consistent participation, and often pseudonymous identity management across multiple forums and Discord servers. It is closer to a full-time job than passive income.
For [stablecoin yield strategies](https://altcoininvestor.com/passive-income-stablecoins/) or [staking income](https://altcoininvestor.com/crypto-staking-how-does-it-work/), DAO participation is usually irrelevant. The yield mechanisms function independently of governance. You do not need to vote to earn staking rewards or lending interest.
DAO literacy matters as a prerequisite. Understanding governance token mechanics helps you evaluate protocol risk. If a protocol's entire security model depends on a DAO that sees 3% voter participation and whale dominance, that is a risk factor for any capital deployed in that protocol, governance tokens or not.
## How To Verify DAO Claims
DAOs publish participation metrics, but verification requires on-chain data. Check the following:
**Snapshot voting history.** Visit the DAO's Snapshot space and review recent proposals. Look at total votes cast, unique voters, and voting power distribution. If 90% of voting power comes from 10 wallets, the DAO is whale-dominated regardless of what the marketing says.
**Token holder distribution.** Use Etherscan or equivalent block explorers to view the top token holders. If the top 100 wallets hold 80% of the supply, decentralization is superficial. Cross-reference against team wallets, known exchange addresses, and treasury holdings to distinguish between concentrated retail ownership and locked team allocations.
**Treasury composition.** DAOs often publish treasury dashboards. Verify the claimed assets on-chain. Check the multisig wallet holding the treasury. Identify the signers. If the signers are anonymous or overlap heavily with the founding team, execution risk is high.
**Proposal execution rate.** Compare approved proposals to actually executed proposals. A DAO that passes 20 votes but executes 5 has an execution bottleneck, usually at the multisig level. This indicates centralized control regardless of the voting mechanism.
**Delegate concentration.** For DAOs using delegation, check how voting power is distributed among delegates. Most governance dashboards publish this data. If 3 delegates control 60% of voting power, the DAO is functionally a small committee.
On-chain data is more reliable than any team's claims about their own governance structure.
## The Takeaway
DAOs are governance structures built on token voting. The mechanism works in theory. One token, one vote. Transparent proposals. On-chain execution. In practice, 1% of token holders control 90% of voting power. Voter participation averages 4% to 10%. Multisig signers control execution. Delegation concentrates power among a few professional actors.
What DAOs have delivered: $25 billion in managed treasuries, $45 million in grant distributions, functional parameter governance for major DeFi protocols like Uniswap, Aave, and MakerDAO. What they have not delivered: meaningful decentralization, aligned economic incentives for governance participation, or decision-making speed sufficient for crisis response.
The failure modes are specific. Flash loan attacks exploit token borrowing to capture voting power in a single block. Whale coordination passes malicious proposals when dispersed token holders ignore votes. Governance fatigue and rational apathy create participation collapse, leaving protocols controlled by a shrinking oligarchy.
For income purposes, DAO participation matters primarily as an airdrop farming strategy. Active governance engagement sometimes qualifies holders for future token distributions. The returns depend on airdrop value exceeding gas costs and time spent. For most small holders, the math does not work. For professional delegates, governance is a full-time role with grant-based or fee-based compensation.
Understanding DAOs is a prerequisite for evaluating protocol risk. If the protocol you are deploying capital into relies on a DAO with 3% voter participation and whale dominance, that is a governance risk factor for any position, staking or otherwise. Check the Snapshot history. Verify token distribution on-chain. Identify the multisig signers. Do not trust marketing claims about decentralization without verifying the contract state.
The mechanism is not magic. It is a voting system with predictable failure modes. The question is not whether DAOs are good or bad. The question is whether the specific DAO you are evaluating has sufficient participation, aligned incentives, and distributed power to make decisions that protect your capital.
## Frequently Asked Questions
### How do you make money from DAOs?
The primary income mechanism is airdrop farming through active governance participation. Protocols like Optimism and Arbitrum have rewarded governance participants with token airdrops. You can also earn as a professional delegate by accumulating voting power and receiving protocol grants or fees. However, for most small holders, gas costs and time spent reading proposals exceed airdrop value. The strategy works best when farming multiple DAOs simultaneously with significant token holdings.
### What is the main problem with DAO governance?
Whale dominance and voter apathy. Across major DAOs, 1% of token holders control 90% of voting power, while median participation rates sit below 10%. Most governance tokens provide voting rights without economic benefits, creating rational apathy. Token holders pay gas fees and spend time on proposals while capturing none of the financial upside. This concentrates decision-making among a small number of whales and professional delegates who show up consistently.
### Can DAOs be hacked through governance?
Yes, through flash loan attacks and whale coordination. In April 2022, an attacker used flash loans to borrow over $1 billion in assets, converted them to governance tokens, achieved voting majority, and drained $182 million from Beanstalk DAO in a single transaction. The Compound DAO GoldenBoyz attack attempted to transfer $25 million through coordinated whale voting. Timelock delays provide limited protection because attackers control vote outcomes, not just execution timing.
### What is the difference between on-chain and off-chain voting?
On-chain voting executes directly via smart contract and costs gas fees. Every vote is a blockchain transaction. Off-chain voting uses platforms like Snapshot where token holders sign messages to record votes without gas costs. Snapshot processes 96% of major DAO votes. The tradeoff is execution trust: off-chain votes do not automatically execute. A multisig or core team must implement the decision, creating a centralization point.
### How do you verify if a DAO is actually decentralized?
Check on-chain token distribution using block explorers like Etherscan. If the top 100 wallets hold over 80% of supply, decentralization is superficial. Review Snapshot voting history to see unique voter counts and voting power concentration. Verify treasury multisig signers and compare approved proposals to executed proposals. If execution rate is low or signers are anonymous, the DAO has centralized control regardless of voting mechanisms. On-chain data is more reliable than marketing claims.
The Weekly Yield Report
You have just decomposed DAO voting mechanics, whale dominance patterns, and the specific failure modes that drain treasuries. Those governance structures are changing every quarter as protocols experiment with alternatives.
Every Thursday: where crypto yield actually is - stablecoins, liquid staking and DeFi lending, with the risk named next to the rate and what changed since last week.
[Get it free every Thursday](#/portal/signup)
Free. No trade calls, no allocations, no hype. Unsubscribe in one click.
### Quant Surges 65.7% in 30 Days on US Banking Partnership
URL: https://altcoininvestor.com/quant-surge-clearing-house-banking-partnership/
Last updated: 2026-09-26T14:02:38.000Z
## What Moved
Quant climbed 65.7% over 30 days to $105.78 as of 26 September 2026, per CoinGecko. The rally accelerated in the final week, gaining 58.5% over seven days and 13.0% in 24 hours. At a market cap of $1,538,546,678, QNT now ranks #62 by market capitalization, though the price remains 75.3% below its all-time high of $427.42 set on 11 September 2021.
The move came in stages. QNT broke through a multi-month descending trendline around $70 in mid-September, then surged approximately 27% in a single session on 24 September, pushing the token to around $95, according to multiple reports from that week. Volume rose sharply as the price accelerated, with trading volume climbing 20.90% to $39.11 million and open interest increasing 11.95% to $18.93 million on 24 September, per CoinGlass data cited by Bitget.
## The Catalyst: A Clearing House Partnership Announced September 24

The single clearest driver was [an institutional partnership announcement](https://altcoininvestor.com/chainlink-surge-12-percent-infosys-whale-buying/) on 24 September 2026\. The Clearing House, which processes over $2 trillion in daily transaction volume, selected Quant to provide the interoperability layer for its On-Chain Money Initiative, a US tokenized deposit network involving 25 major American banks. The network is targeted to launch in the first half of 2027, according to reports from FXStreet and Coinpedia published on 25 September 2026.
This is not speculative infrastructure. The Clearing House operates core US payment rails including RTP and CHIPS. Quant's role is to build the technology enabling tokenized deposits to move between regulated banks, embedding Overledger directly into the settlement layer that major financial institutions use daily. The announcement represented a shift from pilot projects to production deployment inside the US banking system.
A second piece of news arrived the same day. Major UK banks, including HSBC, Barclays, Lloyds, NatWest, Nationwide, and Santander, completed the first live customer transactions using Quant's infrastructure as part of the Great British Tokenised Deposits project, per CoinMarketCap reporting on 24 September 2026\. That confirmation moved the UK initiative from testing to live execution, adding weight to the US announcement.
The price surge followed the news, not the reverse. The 27% single-session rally on 24 September came after Quant Network confirmed the partnership directly on its official X account that day. The move reflected immediate repricing in response to named, institutional adoption, not front-running or speculative accumulation ahead of the catalyst.
## Position Risk and What Would Have to Hold

A 65.7% move in 30 days creates significant technical and positioning risk. As of 25 September 2026, QNT traded near $97.84, well outside its upper Bollinger Band and with a daily RSI reading above 81, according to Cryptonomist analysis published that day. Open interest climbed 78.87% to $29.54 million, per AMBCrypto reporting on 25 September, indicating rapidly increasing leverage. Derivatives volume expanded 637.49% to $214.37 million, considerably exceeding spot market growth.
Fast moves attract fast money. The surge brought momentum traders into a token that had spent months consolidating. That positioning is inherently unstable. A reversal does not require bad news. It requires the absence of further good news, or a failure to hold key technical levels as profit-taking begins.
For the rally to hold, the move must prove justified by actual enterprise usage. The Clearing House network will not launch until 2027\. Between now and then, QNT trades on expectations, not revenue. If competing interoperability solutions gain traction, or if the tokenized deposit initiative is delayed or scaled back, the valuation implied by this rally becomes difficult to defend. The UK project reached live transactions, which is positive, but commercial rollout is not scheduled until 2027 either.
Exchange reserves also rose alongside the rally, per AMBCrypto, a sign that holders moved tokens to exchanges, potentially to sell. If that supply hits the market while derivatives participants reduce leverage, the correction can be as steep as the rise.
## What This Does Not Mean for Income-Focused Holders
Quant is not a staking token in the traditional proof-of-stake sense. QNT is an ERC-20 utility token on Ethereum. Its primary function is licensing and access. Enterprises lock QNT to pay for annual Overledger gateway licenses, and those tokens are held in treasury and payment-channel contracts, often on 12-month terms, according to a May 2026 research report from OneKey. This removes tokens from circulation and creates recurring demand as licenses renew, but it does not generate staking yield for retail holders.
Some centralized exchanges offer QNT staking or lending products, with rates ranging from approximately 5% to 15% APY depending on platform and lock-up terms, per various staking guides published in 2025 and 2026\. However, these are custodial products where the exchange pays the yield, not rewards generated by the Quant Network itself. Traditional native staking, where you delegate coins to a validator to earn network-emitted rewards, does not exist for QNT as of mid-2026, according to Bitget documentation from July 2026.
Quant has introduced a Trusted Node Staking program that offers approximately 8% yield, per CoinMarketCap reporting on ongoing developments. This program locks QNT supply and expands participation in Overledger's infrastructure, but access and terms are set by Quant Network, not open to all retail holders in the same way proof-of-stake tokens operate.
The partnership news does not change QNT's income profile. The token does not pay dividends, distribute protocol fees, or generate yield from transaction volume. If you hold QNT for income, your options remain limited to custodial lending on exchanges or participation in the Trusted Node program if eligible. The rally increases the dollar value of your holdings, but it does not create new cash flow.
For someone deciding whether to hold QNT for its income characteristics, the answer is the same before and after this move. The token's value derives from enterprise licensing demand and scarcity, not yield. If the Clearing House deployment and UK commercial rollout proceed as planned through 2027, that demand should increase. If they stall, or if enterprises can access Overledger without locking significant QNT, the thesis weakens. The 30-day rally prices in optimism. The income case still depends on execution over the next 12 to 18 months.
## Prior Context: ECB Speculation and Altcoin Rotation
The September rally did not start on the 24th. QNT had already broken out in the weeks prior, driven by broader altcoin rotation and speculation around Quant's involvement in European Central Bank projects. On 22 September 2026, QNT surged 13% to a four-month high of $76, per AMBCrypto, following market optimism after the ECB called for stablecoin restriction removal.
There is no confirmed announcement that Quant powers the ECB's Pontes payment system, according to Bitcoin Foundation reporting from 23 September 2026\. The ECB story functioned as a narrative catalyst, not evidence of a new contract. Quant does have prior institutional credentials, including work with the Bank of England and BIS on Project Rosalind, a retail CBDC experiment, and infrastructure for the UK's tokenised deposits project involving major UK banks.
The broader crypto market also contributed. Bitcoin and large-cap altcoins rallied in September, creating a tailwind for tokens with strong narratives. [Kaspa rallied 44.8% over 30 days](https://altcoininvestor.com/kaspa-44-percent-rally-altcoin-rotation-toccata-upgrade/) on altcoin rotation and an upgrade, while [Avalanche jumped 45.5%](https://altcoininvestor.com/avalanche-rally-schwab-listing-helicon-upgrade/) on exchange listings and staking improvements. [NEAR Protocol doubled](https://altcoininvestor.com/near-protocol-doubles-privacy-ai-staking/) as AI staking launched. QNT's move fits within a pattern of institutional-narrative tokens outperforming during this window.
The Clearing House announcement on 24 September gave the rally a concrete, named catalyst. Prior to that, the move was technical breakout plus narrative speculation. After the 24th, it became a repricing based on disclosed partnerships and live transaction confirmations. That distinction matters for assessing durability.
## Interoperability Demand and Fixed Supply
Quant's value proposition rests on a specific problem: blockchains and legacy financial systems do not communicate. Banks, central banks, and enterprises need a layer that connects distributed ledgers with existing infrastructure without forcing migration to a single chain. Overledger is that layer. It is API-based middleware, not a new Layer 1.
The token economics reinforce scarcity. QNT has a fixed supply of 14,612,493 tokens, with approximately 14,544,176 in circulation, per CoinStats data from 25 September 2026\. That is 99.5% of total supply already released, eliminating future dilution risk. Enterprise licensing converts fiat fees into QNT, which is then locked in payment channels, reducing circulating supply as usage increases.
If institutional tokenization scales, and if Quant remains the dominant interoperability provider, demand for QNT should grow while supply remains fixed. That is the bull case. The risk is that other solutions, such as [Chainlink's CCIP](https://altcoininvestor.com/chainlink-surge-12-percent-infosys-whale-buying/), Polkadot, or Cosmos, gain traction in the same institutional segment, fragmenting demand or reducing Quant's pricing power. The Clearing House partnership and UK deployment provide exclusivity in those specific use cases, but they do not lock out competition elsewhere.
Quant also launched Overledger Fusion, a corporate-managed rollup sequencer for regulated, cross-ledger transactions, on 21 August 2026, per CoinMarketCap. The Fusion architecture connects over 73 networks and supports 1,000-plus nodes, with rollup infrastructure live on mainnet as of early June 2026, according to Genfinity reporting. Enterprises need QNT to operate Fusion nodes and process transactions, directly linking institutional usage to token demand.
The move from pilot to production is what changed in September. Quant has been involved in central bank and banking experiments for years. The Clearing House announcement and UK live transactions represent the transition from testing to deployment. If that transition continues through 2027, the 65.7% rally may prove conservative. If it stalls, the rally becomes a top.
The Weekly Yield Report
You just examined a 65.7% move driven by institutional deployment and the licensing demand that may follow. That deployment timeline runs through 2027, and positioning has already shifted.
Every Thursday: where crypto yield actually is - stablecoins, liquid staking and DeFi lending, with the risk named next to the rate and what changed since last week.
[Get it free every Thursday](#/portal/signup)
Free. No trade calls, no allocations, no hype. Unsubscribe in one click.
### KelpDAO Sues LayerZero Over $292M rsETH Bridge Exploit
URL: https://altcoininvestor.com/kelpdao-sues-layerzero-292m-bridge-exploit/
Last updated: 2026-09-29T18:00:06.000Z
## The Lawsuit Claims LayerZero Endorsed a Vulnerable Configuration

KelpDAO filed a lawsuit against LayerZero and co-founder Bryan Pellegrino over an April 18 exploit that drained 116,500 rsETH worth approximately $292 million. The lawsuit alleges LayerZero reviewed and endorsed the configuration used by the exploited bridge while failing to disclose related security risks. This represents the largest exploit of 2026 and one of the most significant legal actions between DeFi protocols over cross-chain infrastructure liability.
According to the lawsuit, Evercrest, the bridge operator contracted by KelpDAO, claims LayerZero provided written communications on February 2, 2024, stating there was "no problem" with using the default DVN configuration. On March 21, 2024, LayerZero allegedly directed Evercrest to use the same 1-of-1 configuration as another bridge. The April 22 attack that followed drained 116,500 rsETH and contributed to a broader liquidity crisis that erased $20 billion in decentralized finance deposits.
Bryan Pellegrino disputed the allegations publicly. "The claim continues to be meritless," he stated on X, adding that he would defend himself accordingly. The case will test whether protocol developers bear liability for endorsed configurations that prove vulnerable, setting precedent for how responsibility is allocated when decentralized bridge security fails.
## The Income Context for DeFi Yield Strategists

This exploit matters for readers pursuing [DeFi yield strategies](https://altcoininvestor.com/best-defi-protocols/) because it illustrates how bridge security failures translate directly into capital loss that eliminates yield opportunity entirely. Liquid staking derivatives like rsETH enable capital efficiency by allowing stakers to use their staked assets as collateral across multiple protocols. The income mechanic works when the derivative maintains its peg and liquidity remains stable. When a bridge exploit drains liquidity and triggers a de-peg event, the entire yield surface collapses.
Evercrest reported that KelpDAO users have withdrawn more than $650 million in assets since the exploit, representing a classic liquidity run dynamic. For yield strategists, this withdrawal cascade matters because it demonstrates how bridge exploits produce second-order income destruction beyond the initial loss. Users who were earning staking yields plus additional protocol incentives on their rsETH positions lost access to both income streams when liquidity dried up and the token became difficult to exit.
The lawsuit's focus on LayerZero's alleged endorsement of the vulnerable configuration raises a critical question for income-focused DeFi participants: who verifies the security assumptions underlying the cross-chain infrastructure that enables yield strategies? Most users deploying capital into liquid staking derivative strategies assume that bridge operators have conducted proper due diligence on the messaging protocols they integrate. This case suggests that assumption may not hold, and that protocol endorsements may not carry the liability weight users expect.
## How Bridge Configuration Economics Actually Work
The technical detail at the center of this lawsuit is the 1-of-1 DVN (Decentralized Verifier Network) configuration. In LayerZero's architecture, DVNs verify cross-chain messages before they are executed on the destination chain. A 1-of-1 configuration means a single verifier node can authorize message execution. This creates a single point of failure: if that one verifier is compromised or malicious, it can authorize fraudulent messages that drain bridge liquidity.
More secure configurations use multi-signature setups, such as 3-of-5 or 5-of-9, requiring multiple independent verifiers to sign off on a message before execution. The income trade-off is real but not typically visible to end users. Multi-signature configurations cost more to operate because they require coordinating multiple verifiers, which translates to higher bridge fees. Single-verifier configurations are cheaper to run and can process messages faster, which is why some bridge operators adopt them despite the security risk.
For DeFi yield strategists, this trade-off matters because the bridge fee differential between 1-of-1 and multi-signature configurations is typically measured in basis points per transaction, while the exploit risk differential can be total loss. The $292 million rsETH exploit represents a catastrophic outcome that no fee savings could justify. Yet the lawsuit alleges LayerZero endorsed the vulnerable configuration, suggesting the protocol may have prioritized operational efficiency over security margin.
The lawsuit also raises questions about who bears the economic cost when endorsed configurations fail. If KelpDAO prevails, it could establish that cross-chain messaging protocols carry liability for configurations they recommend, even when the bridge operator makes the final implementation decision. That would shift the security verification burden from individual bridge operators to the infrastructure layer, potentially increasing the due diligence requirements and associated costs for messaging protocols.
## What This Means for Liquid Staking Yield Strategies
Liquid staking derivatives represent one of the most capital-efficient yield strategies in DeFi because they allow users to earn staking rewards while simultaneously deploying the derivative as collateral in lending markets, liquidity pools, or other yield-bearing protocols. The rsETH exploit demonstrates how cross-chain bridge failures can destroy this capital efficiency entirely. When the bridge was exploited and 116,500 rsETH was drained, users holding rsETH on the destination chain faced immediate liquidity constraints as the token de-pegged and withdrawal queues extended.
For yield strategists, the practical lesson is that cross-chain liquid staking positions carry bridge risk that is often invisible in the yield calculation. A user earning 4% staking yield plus 6% protocol incentives on their rsETH position might see that as a 10% annual return, but that calculation does not account for the probability-weighted expected loss from bridge exploits. The $292 million loss represents roughly 40% of the peak rsETH supply, meaning users who were deployed across the bridge lost not just their accumulated yield but a substantial portion of their principal.
The $650 million in withdrawals that followed the exploit also illustrates how bridge failures trigger liquidity cascades that eliminate future yield opportunities. As users withdrew from KelpDAO protocols, the total value locked declined, which reduced the protocol's ability to offer competitive incentives. This created a self-reinforcing cycle where declining yields prompted further withdrawals, which further reduced yields. For income-focused participants, this dynamic means that bridge exploits represent not just immediate capital loss but also the destruction of future yield surface in the affected protocols.
The lawsuit's outcome could influence how future liquid staking protocols structure their cross-chain integrations. If courts establish that messaging protocols bear liability for endorsed configurations, we may see more conservative bridge designs with multi-signature verifier setups as the default. That would likely increase bridge costs but reduce catastrophic failure risk, changing the risk-return profile for cross-chain yield strategies in a direction that favors capital preservation over marginal fee savings.
## Legal Precedent and Protocol Liability Questions
This lawsuit represents the first major legal action between DeFi protocols over cross-chain infrastructure liability, and its outcome will establish precedent for how responsibility is allocated when decentralized bridge security fails. The central legal question is whether LayerZero's alleged written endorsement of the 1-of-1 configuration creates liability when that configuration is subsequently exploited. If KelpDAO prevails, it would establish that protocol-level recommendations carry legal weight, even in nominally decentralized systems where the bridge operator makes final implementation decisions.
The practical implication for yield strategists is that protocol endorsements may gain enforceable meaning, which could change how infrastructure providers communicate about security configurations. If messaging protocols face liability for configurations they recommend, they will likely become more conservative in their guidance, potentially refusing to endorse any single-verifier setups regardless of the operational trade-offs. That would increase the baseline security standard for cross-chain bridges, but it might also reduce the diversity of configuration options available to bridge operators who are optimizing for different risk-return profiles.
The lawsuit also raises questions about disclosure requirements for cross-chain infrastructure. KelpDAO alleges that LayerZero failed to disclose related security risks when it endorsed the 1-of-1 configuration. If courts find that infrastructure protocols have a duty to disclose known risks associated with configurations they endorse, we may see more detailed security documentation emerge across the cross-chain messaging sector. For yield strategists, better disclosure would make bridge risk more visible and measurable, allowing for more accurate risk-adjusted return calculations.
Bryan Pellegrino's public response that the claim is "meritless" suggests LayerZero will argue that bridge operators bear full responsibility for security configuration decisions, regardless of any guidance the messaging protocol provided. This defense position, if successful, would leave the liability allocation framework unchanged: bridge operators remain solely responsible for security outcomes, and infrastructure protocols face no liability for endorsed configurations. That would preserve the current state where yield strategists must independently verify bridge security assumptions rather than relying on infrastructure-level endorsements.
## Bridge Security Due Diligence for Yield Deployment
The rsETH exploit provides a clear case study in the specific security checks yield strategists should run before deploying capital across cross-chain bridges. The first check is verifier configuration: how many independent nodes must sign off on a cross-chain message before it executes? Single-verifier setups like the 1-of-1 configuration allegedly used in the rsETH bridge represent unacceptable single points of failure for any serious capital deployment. Multi-signature configurations with at least three independent verifiers provide substantially better security, and configurations with five or more verifiers approach the security margins used by established cross-chain protocols.
The second check is verifier identity and independence. Even a 5-of-9 multi-signature setup provides limited security if all nine verifiers are controlled by the same entity or selected from a single trust set. Effective multi-signature security requires verifiers that are economically, operationally, and jurisdictionally independent, so that compromising the threshold number of verifiers requires separate attacks against separate entities. The lawsuit does not specify whether the single verifier in the rsETH bridge configuration was controlled by the bridge operator, the messaging protocol, or a third party, but that identity question matters enormously for security evaluation.
The third check is messaging protocol track record and security posture. [LayerZero has faced scrutiny](https://www.coindesk.com/business/2026/09/25/kelpdao-sues-layerzero-for-the-largest-exploit-2026-has-seen-so-far) over its security practices before, and the current lawsuit adds to that record. For yield strategists, protocol track record functions as a proxy for the quality of security guidance and the likelihood that endorsed configurations have been properly vetted. Protocols with clean security records and transparent security documentation provide higher confidence that their endorsed configurations reflect actual security analysis rather than operational convenience.
The fourth check is liquidity depth and withdrawal capacity on both sides of the bridge. Even if a bridge configuration appears secure, concentrated liquidity creates exit risk when exploits or de-peg events occur. The $650 million in withdrawals following the rsETH exploit demonstrates how quickly liquidity can drain when user confidence breaks. Yield strategists deploying significant capital should verify that bridge liquidity on both the source and destination chains can support their full position exit without material slippage, and should monitor that liquidity continuously rather than assuming it will remain stable.
## The Takeaway
The KelpDAO lawsuit against LayerZero over the $292 million rsETH bridge exploit establishes that cross-chain infrastructure liability is now a contested legal question with real financial stakes for DeFi yield strategists. The case tests whether messaging protocols bear responsibility for security configurations they endorse, and the outcome will determine whether yield strategists can rely on protocol-level guidance or must independently verify every bridge security assumption. For anyone deploying capital into liquid staking derivatives or other cross-chain yield strategies, the rsETH exploit demonstrates that bridge configuration details like verifier count and independence are not abstract technical questions but direct determinants of capital preservation. The specific check that matters most: verify the verifier configuration before you bridge, and if the answer is 1-of-1, the correct response is to find a different bridge or keep your capital on the source chain.
## Frequently Asked Questions
### What was the rsETH bridge exploit and how much was lost?
On April 18, 2026, an exploit targeting a bridge used by KelpDAO drained 116,500 rsETH worth approximately $292 million. The attack exploited a 1-of-1 verifier configuration in the LayerZero messaging protocol, allowing a single compromised verifier to authorize fraudulent cross-chain messages. This represents the largest exploit of 2026 and contributed to a broader DeFi liquidity crisis that erased $20 billion in total value locked across decentralized finance protocols.
### Why is KelpDAO suing LayerZero over the bridge exploit?
KelpDAO alleges that LayerZero reviewed and endorsed the bridge configuration that was later exploited, while failing to disclose related security risks. According to the lawsuit, LayerZero provided written communications in February 2024 stating there was no problem with the default verifier configuration, and in March 2024 directed the bridge operator to use the same 1-of-1 setup as another bridge. The lawsuit tests whether messaging protocols bear legal liability for security configurations they endorse, even when bridge operators make final implementation decisions.
### What is a 1-of-1 verifier configuration and why is it risky?
A 1-of-1 verifier configuration means a single node can authorize cross-chain message execution without requiring confirmation from other independent verifiers. This creates a single point of failure where compromise of one verifier enables complete bridge control. More secure configurations use multi-signature setups like 3-of-5 or 5-of-9, requiring multiple independent verifiers to approve each message. The security trade-off is substantial: 1-of-1 configurations offer lower costs and faster processing but expose the entire bridge to catastrophic loss if that single verifier is compromised.
### How did the exploit affect liquid staking yield strategies?
The exploit destroyed capital efficiency for users holding rsETH across the bridge by draining liquidity and triggering a de-peg event. Users earning staking yields plus protocol incentives lost access to both income streams when the token became difficult to exit and withdrawal queues extended. KelpDAO users subsequently withdrew more than $650 million in assets, creating a liquidity cascade that eliminated future yield opportunities as declining total value locked reduced the protocol's ability to offer competitive incentives. This demonstrates how bridge failures eliminate not just current positions but future yield surface.
### What security checks should yield strategists run before using cross-chain bridges?
First, verify the verifier configuration and require at least three independent nodes in a multi-signature setup. Second, check verifier identity and independence to ensure they are economically and operationally separate entities. Third, evaluate the messaging protocol's track record and security documentation to assess whether endorsed configurations reflect actual security analysis. Fourth, verify liquidity depth on both bridge sides can support full position exit without material slippage, and monitor that liquidity continuously. Single-verifier configurations represent unacceptable risk for serious capital deployment regardless of cost or speed advantages.
The Weekly Yield Report
You have just reviewed the $292 million bridge exploit that tested cross-chain security assumptions for liquid staking yields. The next configuration failure is already deployed somewhere in DeFi infrastructure.
Every Thursday: where crypto yield actually is - stablecoins, liquid staking and DeFi lending, with the risk named next to the rate and what changed since last week.
[Get it free every Thursday](#/portal/signup)
Free. No trade calls, no allocations, no hype. Unsubscribe in one click.
### Why 15%+ Stablecoin Yields Historically Don't Last
URL: https://altcoininvestor.com/why-high-stablecoin-yields-fail/
Last updated: 2026-09-26T02:06:27.000Z
## The Question That Should Have Been Asked Earlier

Anchor Protocol launched in 2021 advertising 19.45% annual interest on UST deposits, and at its height held more than $14 billion of UST. Celsius offered between 8% and 17% on stablecoin deposits. BlockFi paid 8% APY on USDC and USDT. By the end of 2022, all three had collapsed, taking billions of depositor capital with them. The question that matters now is not whether these yields were sustainable - history answered that conclusively - but whether the next 15% advertised rate will fail for the same reasons, and whether the warning signs will be visible before the collapse.
The answer is that high stablecoin yields fail for three identifiable reasons, each with its own timeline and set of leading indicators. Unsustainable subsidies, leverage stacking, and Ponzi-style recycling have accounted for every major stablecoin yield collapse in the last four years. What follows is the mechanism analysis of each, the specific market conditions that unwind them, and the signals that surfaced 60 to 90 days before each historical failure.
## Three Mechanisms That Produce Unsustainable Yield

The stablecoin yield collapses of 2022 were not random events. They were the predictable result of three specific structural mechanisms, each of which produces advertised yields that exceed what the underlying economic activity can support over time. The first is direct subsidy from a protocol reserve or foundation treasury. The second is leverage stacking, where a platform borrows at low cost and lends at higher rates while relying on collateral values that can fall. The third is Ponzi-style recycling, where new deposits fund the interest payments on older deposits rather than actual revenue-generating activity.
### Unsustainable Subsidies: The Anchor Protocol Model
Anchor Protocol paid 19.45% annual interest on UST by contributing extra payments from an on-chain reserve of UST. The protocol's borrowers paid interest on their loans, but that interest alone could not cover the 19.45% promised to depositors. At peak deposits of over $14 billion, Anchor needed to pay out more than $2.5 billion in annual interest. Borrower interest and yield reserve contributions combined fell short by approximately $1.8 billion per year.
By January 2022, the yield reserve held $34.13 million UST while the protocol was paying 19.88% on $13.3 billion in deposits. At that burn rate, the reserve would empty within weeks. By April 2022, the daily subsidy requirement reached $6 million, prompting the Terra community to pass a proposal to gradually decrease the 19.5% rate starting May 1, 2022\. The proposal never took effect. On May 12, 2022, when the Terra blockchain halted, Anchor held $2.124 billion in deposits and only $147 million borrowed. The math had become untenable three months earlier, but the collapse arrived within days once confidence broke.
The European parallel is the eurozone sovereign debt crisis of 2011 through 2013, when Greece, Portugal, and Ireland offered yields on government bonds that exceeded 10% and in some cases 20%. Those yields were not returns - they were market-priced estimates of default probability. When the underlying credibility of the sovereign borrower broke, the bonds did not pay their coupon. They defaulted, and the advertised yield became a loss that had been accruing all along. Anchor's 19.45% was the same: a number that reflected the protocol's inability to fund the promise, visible to anyone who compared deposits to reserve balances.
### Leverage Stacking: The Celsius and BlockFi Model
Celsius and BlockFi offered between 8% and 17% on stablecoin deposits by taking custody of those deposits and deploying them into lending, trading, and counterparty exposure that promised higher returns. Both platforms functioned as leveraged intermediaries. They borrowed from depositors at one rate and lent or traded at higher rates, capturing the spread. The model depends on three conditions: sufficient borrower demand at rates higher than the deposit rate, stable collateral values that can be liquidated if loans default, and access to liquidity when depositors withdraw.
All three conditions failed in 2022\. Celsius had lent to counterparties including Three Arrows Capital, which defaulted in June 2022\. BlockFi had extended a $400 million credit line to Three Arrows Capital as well. When crypto asset prices fell throughout 2022, the collateral backing those loans lost value faster than liquidation mechanisms could respond. Celsius froze withdrawals on June 12, 2022\. BlockFi filed for bankruptcy protection on November 28, 2022, days after FTX - its lender of last resort - collapsed.
The failure mode here is not insolvency through subsidy depletion, but insolvency through counterparty exposure and collateral decline. Both Celsius and BlockFi depended on perpetually rising asset prices to remain solvent. When prices fell and leverage unwound, liquidity disappeared. Depositors discovered that their stablecoin deposits had been treated as unsecured loans to platforms with undisclosed counterparty risk.
The European reference is the 2008 banking crisis, when institutions thought they were insulated from subprime mortgage exposure through layers of securitization and credit derivatives. When the underlying collateral - U.S. housing - declined in value, the entire chain of leveraged intermediaries discovered that liquidity and solvency were the same thing. Celsius and BlockFi were crypto's version of Northern Rock and Dexia: intermediaries that borrowed short and lent long, with insufficient liquidity buffers when confidence broke.
### Ponzi-Style Recycling: The General Pattern
The third mechanism is the simplest and the most common. If a protocol's revenue cannot cover the value of rewards distributed, the yield is being funded by new deposits or token dilution. The leading indicators of Ponzi-style recycling are APYs consistently above 50% with no clear revenue source, rewards paid entirely in newly launched governance tokens, and returns that depend on continuous new depositor inflows.
This pattern appeared in dozens of smaller protocols in 2021 and 2022, but the logic applies to any yield opportunity where the source of return is opaque or depends on token price appreciation. The warning sign is when the answer to "where does the yield come from" includes the phrase "incentive rewards" or "governance token distribution" without identifying the underlying revenue that will eventually buy those tokens back or sustain their value.
## The Leading Indicators That Surfaced Before Collapse

The retrospective view is that all three collapses were obvious. The forward-looking question is which signals were actually visible 60 to 90 days before depositors lost access to funds. Four indicators surfaced consistently across Anchor, Celsius, and BlockFi, and all four were observable on-chain or in public disclosures before the final failure.
### Yield Reserve Depletion and Burn Rate Acceleration
Anchor's yield reserve was visible on-chain. As UST deposits grew through late 2021 and early 2022, the reserve balance declined at an accelerating rate. By January 2022, when the reserve held $34.13 million against $13.3 billion in deposits, the implied runway at 19.88% APY was less than 60 days. The Luna Foundation Guard recapitalized the reserve with $450 million in February 2022, but that was a temporary patch for a structural deficit. The daily subsidy requirement reached $6 million in April, visible to anyone tracking the reserve address.
The lesson is that when active deposits exceed the yield reserve by a factor of 300 or more, and the stated yield rate implies a burn rate measured in millions per day, the math becomes untenable within weeks. This is not hindsight. It is arithmetic.
### Deposit-to-Borrow Imbalance
Anchor's second failure signal was the widening gap between deposits and borrowing. In a sustainable lending protocol, deposits roughly match borrows over time, because the interest paid by borrowers funds the yield paid to lenders. By early 2022, Anchor showed deposits growing while borrowing declined. At collapse, the protocol held $2.124 billion in deposits but only $147 million borrowed. The loan demand shortage exceeded 300%.
When deposits outstrip borrows by that margin, there are no borrowers to generate the yield. Only the reserve can fill the gap, and the reserve has a visible expiration date. This imbalance was on-chain and public 90 days before the May 2022 halt.
### Liquidity Profile Degradation
Celsius and BlockFi did not publish real-time on-chain reserve data, but both showed liquidity profile changes in the months before collapse. Celsius froze withdrawals on June 12, 2022, after weeks of rumors about exposure to Three Arrows Capital and declining asset values. BlockFi disclosed its exposure to FTX only after FTX filed for bankruptcy in November. The specific warning sign was not the exposure itself - that was hidden - but the platforms' increasing reliance on external credit lines and public statements reassuring depositors while privately negotiating rescue financing.
When a custodial platform begins issuing public reassurances about liquidity, the correct inference is that liquidity is already constrained. The timing of those reassurances, relative to withdrawal freezes, has been consistent: 30 to 60 days.
### Yield Compression in Comparable Protocols
The fourth signal is comparative. When transparent DeFi protocols with visible on-chain revenue pay 4% to 6% on stablecoins, and a custodial platform or subsidized protocol offers 15% or more, the difference is the risk premium or the unsustainable subsidy. In 2026, [reputable DeFi lending venues like Aave, Morpho, and Compound](https://altcoininvestor.com/how-to-earn-passive-income-stablecoins-2026/) pay between 3.57% and 6% on USDC and USDT. The Maker Dai Savings Rate offers 5% to 8% on DAI. [Ethena's sUSDe pays approximately 3.6%](https://altcoininvestor.com/how-ethena-yield-works/) as of May 2026, derived from basis trade funding rates and staking rewards.
When a protocol advertises 15% or higher, the question is not whether the rate is attractive. The question is what structural difference justifies the premium, and whether that difference will persist when market conditions change. In every historical case, the answer was no.
## What Current Market Conditions Reveal About Sustainability
The stablecoin yield environment of 2026 is instructive precisely because it is so much lower than 2021\. Aave v3 pays 3.57% on Ethereum and 3.65% on Base for USDC deposits. Compound v3 offers 4.51% on Ethereum. The Dai Savings Rate has compressed from 11% in early 2024 to between 5% and 8% in 2026\. These are not exciting numbers, but they are sustainable because they derive from borrower interest, protocol fees, and real economic activity.
The lesson from the 2021-2022 collapses is that sustainable yield originates from identifiable revenue: borrower interest, trading fees, funding rate arbitrage, or protocol take rates. When the source of yield is opaque, or when the advertised rate exceeds what transparent protocols pay by a factor of two or more, the difference is either custodial risk or structural unsustainability.
The U.S. GENIUS Act, signed into law in July 2025, prohibits payment stablecoin issuers from paying yield directly to holders. This regulatory shift has pushed yield generation into a separate layer - lending protocols, DeFi venues, and custodial platforms that are not themselves stablecoin issuers. The result is that yield transparency has improved slightly, because platforms must now disclose what they do with deposits in order to generate returns. But custodial risk remains, and the platforms offering the highest rates are still the ones taking the most counterparty exposure or deploying the most leverage.
## The Risk Screening Framework That Would Have Identified All Three Failures
A simple four-question framework would have surfaced the structural risk in Anchor, Celsius, and BlockFi 60 to 90 days before collapse. The questions are: where does the yield actually come from, can you verify the source on-chain or in audited financial statements, what is the deposit-to-borrow ratio or equivalent metric, and what is the liquidity profile if 20% of depositors withdraw in a single week?
For Anchor, the first question revealed that yield came from a depleting reserve, not from borrower interest. The third question showed deposits outstripping borrows by a factor of ten or more. The fourth question had no satisfactory answer, because the protocol had no mechanism to fund mass withdrawals once the reserve emptied. All three signals were public and on-chain in early 2022.
For Celsius and BlockFi, the first question had no public answer. Neither platform disclosed where depositor funds were deployed, which counterparties held loans, or how collateral was managed. The absence of transparency was itself the warning. The fourth question - liquidity under withdrawal pressure - became acute in June 2022 when both platforms began issuing reassurances and negotiating rescue credit lines. Depositors who asked the questions in April 2022 would have had 60 days to withdraw before the freezes.
In 2026, the same framework applies. [Protocols that pay 15% or more without clear revenue sources](https://altcoininvestor.com/stablecoin-yield-vs-money-market/) are either subsidizing yield from treasuries that will deplete, stacking leverage that will unwind, or relying on new deposits to fund old withdrawals. The historical precedent is unambiguous. High yields do not persist when the mechanism producing them depends on conditions that cannot hold.
## When Yield Reflects Risk, Not Return
The eurozone sovereign debt crisis taught European bond investors a lesson that crypto depositors learned in 2022: when a yield exceeds the risk-free rate by a wide margin, the excess is compensation for the probability of loss, not a gift. Greek government bonds offered 20% yields in 2011 because the market assigned a high probability to default. The yields were not returns. They were warnings, priced in basis points.
Stablecoin yields above 15% function the same way. They are not income opportunities. They are risk premiums, and the risk is that the mechanism producing the yield will fail before you withdraw. Anchor's 19.45% reflected the market's assessment that the protocol could not sustain the payout. Celsius's 17% reflected undisclosed counterparty exposure and leverage. BlockFi's 8% - lower than the others, but still double what transparent DeFi protocols offered - reflected custodial risk and dependence on perpetually rising collateral values.
The difference between 2022 and 2026 is that the market has already run the experiment. The protocols offering 15% or more today are not doing anything structurally different from Anchor, Celsius, or BlockFi. They are either subsidizing yield, stacking leverage, or obscuring the source of return. The warning signs are the same: opaque disclosures, deposit-to-borrow imbalances, burn rates that exceed reserve capacity, and reassurances issued when liquidity comes under pressure.
For depositors evaluating stablecoin yield opportunities in 2026, the relevant comparison is not the headline APY. It is the difference between the advertised rate and what [transparent DeFi protocols with visible on-chain revenue](https://altcoininvestor.com/evaluate-aave-v3-stablecoin-listing-30-days/) are paying on the same stablecoins. That difference is the risk premium, and history suggests it compensates for the probability of total loss within 12 months.
## The Takeaway
Every stablecoin yield above 15% that has been advertised in the last four years has either collapsed or compressed to single digits within 18 months. The mechanisms are identifiable: unsustainable subsidies that deplete visible reserves, leverage stacking that depends on rising collateral values, and Ponzi-style recycling where new deposits fund old withdrawals. The warning signs surface 60 to 90 days before failure, and they are visible in on-chain data, deposit-to-borrow ratios, reserve burn rates, and liquidity reassurances issued by platforms under stress. The lesson from Anchor, Celsius, and BlockFi is not that high yields are inherently fraudulent. It is that high yields reflect high risk, and the risk is structural collapse when the market conditions that sustain the mechanism change. In 2026, [sustainable stablecoin yields range from 3.5% to 9%](https://altcoininvestor.com/stablecoin-depeg-warning-signs/), sourced from borrower interest, protocol fees, and funding rate arbitrage. Anything meaningfully above that range is compensation for counterparty risk, leverage risk, or the probability that the yield will disappear before you withdraw. The question that matters is not whether today's 15% looks attractive. It is whether the mechanism producing it has already failed twice, and whether you will recognize the warning signs before the third collapse.
## Frequently Asked Questions
### What caused Anchor Protocol's 19.45% yield to collapse?
Anchor paid 19.45% by subsidizing depositor interest from an on-chain reserve of UST. Borrower interest could not cover the payouts. At peak deposits of $14 billion, the protocol needed to pay $2.5 billion annually but faced an $1.8 billion shortfall. By January 2022, the reserve held only $34 million against $13.3 billion in deposits. The burn rate reached $6 million daily by April 2022\. When the reserve depleted and confidence broke in May 2022, the protocol collapsed within days.
### How do you identify an unsustainable stablecoin yield before it collapses?
Ask four questions: where does the yield actually come from, can you verify the source on-chain or in audited statements, what is the deposit-to-borrow ratio, and what happens if 20% of depositors withdraw in one week. If the yield comes from a depleting reserve, deposits exceed borrows by 3x or more, or the platform cannot answer the liquidity question, those are 60-90 day warning signs. Compare the advertised rate to what transparent DeFi protocols pay. Differences above 2x the transparent rate reflect either custodial risk or structural unsustainability.
### Why did Celsius and BlockFi fail when their yields were lower than Anchor's?
Celsius offered 8-17% and BlockFi paid 8% by taking custody of deposits and lending to counterparties at higher rates. Both platforms stacked leverage and had undisclosed exposure to Three Arrows Capital, which defaulted in June 2022\. When crypto asset prices fell, collateral values declined faster than liquidation could respond. Both depended on rising asset prices to remain solvent. Celsius froze withdrawals June 12, 2022\. BlockFi filed for bankruptcy November 28, 2022, days after FTX collapsed. The failure mode was counterparty exposure and liquidity crisis, not reserve depletion.
### What stablecoin yields are sustainable in 2026?
Sustainable stablecoin yields in 2026 range from 3.5% to 9% APY. Aave v3 pays 3.57% on Ethereum and 3.65% on Base for USDC. Compound v3 offers 4.51%. The Maker Dai Savings Rate provides 5-8% on DAI. Ethena sUSDe pays approximately 3.6% from basis trade funding rates and staking rewards. These yields derive from borrower interest, protocol fees, and real economic activity. Rates above 10% in 2026 either carry custodial risk premiums or depend on mechanisms that have failed historically.
### What is the European monetary parallel to stablecoin yield collapses?
The eurozone sovereign debt crisis of 2011-2013 offers the closest parallel. Greek, Portuguese, and Irish government bonds offered yields exceeding 10% and in some cases 20%. Those yields were not returns but market-priced estimates of default probability. When sovereign credibility broke, bonds defaulted and advertised yields became losses. Anchor's 19.45%, Celsius's 17%, and BlockFi's 8% functioned the same way: high rates reflected the probability of mechanism failure, not sustainable income. Both cases demonstrate that yields meaningfully above risk-free rates compensate for structural risk, not opportunity.
The Weekly Yield Report
You have just examined three collapse mechanisms and the 60-90 day warning signs that surfaced before Anchor, Celsius, and BlockFi failed. Those mechanisms are being tested again in 2026.
Every Thursday: where crypto yield actually is - stablecoins, liquid staking and DeFi lending, with the risk named next to the rate and what changed since last week.
[Get it free every Thursday](#/portal/signup)
Free. No trade calls, no allocations, no hype. Unsubscribe in one click.
### What Are Gas Fees? Understanding Ethereum Transactions
URL: https://altcoininvestor.com/what-are-gas-fees/
Last updated: 2026-09-26T00:05:09.000Z
## What Gas Fees Actually Pay For

Every Ethereum transaction requires computational resources to execute. Gas fees pay for those resources. Specifically, they compensate validators for processing your transaction and prevent spam attacks that would otherwise overwhelm the network. Without gas, malicious actors could flood Ethereum with infinite loops or junk transactions at zero cost. Gas makes that attack financially prohibitive.
The fee structure has two components since EIP-1559 launched in August 2021\. First, a base fee set algorithmically by the protocol. Second, a priority fee (tip) you set to incentivize faster inclusion. The base fee is burned, removed from circulation entirely. The priority fee goes directly to the validator who includes your transaction in a block.
Gas fees do not pay for computation in the abstract. They pay for block space, a scarce resource. Ethereum targets roughly 30 million gas per block against a 60 million gas limit as of August 2026\. When demand exceeds that target, the base fee rises. When demand drops below it, the base fee falls. The mechanism self-regulates to keep blocks half full.
## How Gas Prices Are Set: EIP-1559 Mechanics
Before EIP-1559, you bid blindly in an auction. You guessed a gas price, submitted your transaction, and hoped it was high enough. If you bid too low, your transaction sat in the mempool for hours or days. If you bid too high, you overpaid. The model wasted capital and created unpredictable delays.
EIP-1559 replaced the auction with a structured fee model. The base fee adjusts block by block. When a block is more than 50% full, the base fee increases by up to 12.5% for the next block. When utilization drops below 50%, it decreases by up to 12.5%. The adjustment is capped, so the base fee cannot spike more than 12.5% between consecutive blocks. This creates predictability.
The priority fee is still user-set. During low congestion, a small tip of 0.01 to 0.1 gwei suffices. During high demand, higher tips buy faster inclusion. Validators prioritize transactions with higher tips when blocks are full. The tip is the only component you control directly.
The total cost calculation is: units of gas used × (base fee + priority fee). A simple ETH transfer uses 21,000 gas. An ERC-20 token transfer uses 45,000 to 65,000 gas because it must update the token contract's balance mapping. A Uniswap swap can use 150,000 to 200,000 gas depending on the routing and pool state. The gas used is determined by the transaction type, not by the fee you pay.
As of late 2026, base fees sit around 0.05 gwei during typical conditions. That is down from 5 to 11 gwei during 2021 congestion peaks. The same algorithmic adjustment plays out at a lower absolute level because [Layer 2 networks](https://altcoininvestor.com/what-is-layer-2-crypto/) have moved 60 to 70 percent of Ethereum transaction activity off mainnet. Less demand means lower base fees.
### Worked Example: Cost Before Signing
You want to transfer 100 USDC from your wallet to an exchange. The current base fee is 0.08 gwei. You set a priority fee of 0.02 gwei. The gas limit for an ERC-20 transfer is approximately 50,000 gas.
Total fee in gwei: 50,000 × (0.08 + 0.02) = 5,000 gwei.
Convert to ETH: 5,000 gwei = 0.000005 ETH.
Convert to USD at $3,000 per ETH: 0.000005 × 3,000 = $0.015.
The transaction costs $0.015, or about 1.5 cents. That is the calculation you run before signing. If the base fee spikes to 2 gwei and you keep the same priority fee, the cost rises to 50,000 × (2 + 0.02) = 101,000 gwei = 0.000101 ETH = $0.30\. The base fee matters more than the tip in most conditions.
## Why Gas Fees Spike: Network Congestion Mechanics

Gas prices rise when demand for block space exceeds the 30 million gas target. Specific events trigger congestion:
- NFT launches, especially high-profile drops where thousands of users compete to mint in the same block
- Token airdrops that require claiming transactions
- Market volatility that drives liquidation cascades in DeFi protocols
- US trading hours, particularly 14:00 to 22:00 UTC when US and European users overlap
During these spikes, the base fee can climb from 0.1 gwei to 5 gwei or higher within minutes. The 12.5% per-block cap means a sustained surge takes time to peak, but it also means the base fee does not collapse instantly when demand drops. The adjustment is gradual in both directions.
Gas prices are lowest between 02:00 and 05:00 UTC on weekends, when US and European users are least active. If you are batching transactions or moving large balances, timing them for off-peak windows can cut costs by 30 to 50 percent compared to weekday peaks.
Mempool dynamics complicate this. High-fee transactions are consistently prioritized. Low-fee transactions face delays or exclusion despite EIP-1559's intended improvements. If you set a priority fee below the prevailing rate during congestion, your transaction will sit unconfirmed until demand drops or you replace it with a higher fee.
## Layer 2 Solutions: Why They Exist and How They Reduce Fees
Ethereum mainnet is limited to roughly 30 transactions per second due to the 30 million gas target and the average gas cost per transaction. That throughput ceiling creates a scarcity bottleneck. When demand exceeds 30 TPS, fees spike. The bottleneck is structural, not a bug.
[Layer 2 networks](https://altcoininvestor.com/what-is-layer-2-crypto/) solve this by processing transactions off-chain and batching compressed data back to mainnet. They inherit Ethereum's security because the batch data is posted to mainnet and can be verified on-chain. But they avoid mainnet's per-transaction gas costs by spreading one mainnet transaction across hundreds or thousands of L2 transactions.
As of 2026, the dominant L2s are Arbitrum, Optimism, Base, Polygon, and zkSync Era. Arbitrum leads in total value locked at roughly $10 billion. zkSync offers the fastest finality. Base provides the easiest onboarding for users coming from Coinbase. Optimism powers the Superchain ecosystem, a federation of interoperable L2s.
Fee reductions are 90 to 99 percent compared to mainnet. Specific examples:
- DeFi swaps: $0.03 on Arbitrum vs. $0.50 to $2 on mainnet during typical conditions
- NFT minting: $0.05 on Arbitrum vs. $1 to $5 on mainnet
- Staking transactions: $0.02 on Arbitrum vs. $0.30 to $1 on mainnet
The Dencun upgrade in March 2024 introduced blob space via EIP-4844, a dedicated data area that reduced L2 data posting costs by around 60 percent. Blob space stores batch data from L2 networks without using conventional transaction calldata, which lowers the cost L2s pay to post data to mainnet. That cost reduction flows through to L2 users as lower transaction fees.
The trade-off is fragmentation. Each L2 is a separate execution environment. Moving assets between L2s requires bridging, which introduces delay and adds cost. If you need to [stake stablecoins for yield](https://altcoininvestor.com/passive-income-stablecoins/) on Arbitrum but your funds are on Base, you will pay bridging fees and wait for finality. The L2 ecosystem is not yet seamless.
## How to Reduce Gas Fees: Specific Strategies
First, set the gas limit correctly. The gas limit is the maximum gas you authorize for a transaction. If the transaction uses less, the unused gas is refunded. If it uses more, the transaction fails and you lose the fee paid for the gas consumed before failure. Setting the limit too high wastes nothing. Setting it too low causes failure. Wallets auto-suggest gas limits based on transaction type, and those suggestions are usually correct. Override them only if you understand the specific contract interaction.
Second, time transactions for off-peak periods. Check [Etherscan's Gas Tracker](https://etherscan.io/gastracker) or Blocknative in real time. If the base fee is above 1 gwei and your transaction is not urgent, wait. Gas prices drop reliably overnight UTC and on weekends.
Third, use L2 networks for routine actions. If you are swapping tokens, minting NFTs, or interacting with DeFi protocols, move those activities to Arbitrum, Optimism, or Base. The 90 to 99 percent fee reduction compounds quickly. A user who makes ten swaps per month at $0.03 per swap on Arbitrum pays $0.30 total. The same ten swaps on mainnet at $1 each cost $10\. Over a year, that is $3.60 vs. $120.
Fourth, batch transactions when possible. If you are moving multiple tokens or interacting with multiple contracts, batching them into a single transaction via a contract like Disperse or a batching-enabled wallet reduces the total gas cost. Each additional operation in the batch costs less than executing it as a separate transaction.
Fifth, monitor the mempool. Tools like Blocknative show pending transactions and the fee distribution. If you see a spike forming, you can delay your transaction or increase your priority fee to stay ahead of the surge. The mempool is transparent. Use it.
## What Happens to Gas: The ETH Burn Mechanism
The base fee is burned. Since EIP-1559 launched, over 4.52 million ETH has been burned through the base fee mechanism. That ETH is removed from supply permanently. It does not go to validators, does not go to the Ethereum Foundation, does not get redistributed. It is destroyed.
The burn creates deflationary pressure when the base fee times the total gas used per block exceeds the ETH issuance to validators. During high congestion periods in 2021 and 2022, Ethereum briefly became deflationary, with more ETH burned per block than issued. During low congestion, issuance exceeds burn and supply grows. The net effect depends on demand for block space.
The priority fee is not burned. It goes directly to validators as compensation for including your transaction. This is the incentive alignment. Validators earn more by including high-tip transactions. Users pay more to jump the queue. The mechanism is simple and it works.
## Edge Cases and Failure Modes
Setting the gas limit too low causes transaction failure. The transaction consumes gas up to the point of failure, then reverts. You lose the fee paid for that consumed gas. The failure does not refund the fee. This happens most often with complex DeFi interactions where the gas cost depends on contract state at execution time. If a Uniswap swap routes through multiple pools due to liquidity shifts, the gas used can exceed the wallet's auto-suggested limit. The transaction fails mid-execution.
Setting the priority fee too low during congestion causes indefinite delay. Your transaction sits in the mempool unconfirmed. It will eventually confirm if congestion drops and your fee becomes competitive again, but there is no guarantee of timing. If you need certainty, replace the transaction with a higher fee using the same nonce. Most wallets support this.
Gas price volatility during signature and broadcast creates a mismatch. You estimate the fee at 0.1 gwei base, then sign the transaction. Before it broadcasts, the base fee spikes to 2 gwei. Your transaction is now underpriced and may not confirm. Wallets that show real-time base fee updates reduce this risk, but the race condition exists.
## Gas Literacy Prevents Wasted Capital
Every on-chain income strategy requires gas literacy. If you are [earning yield on stablecoins](https://altcoininvestor.com/passive-income-stablecoins/), you will deposit and withdraw from vaults. Those transactions cost gas. If you are liquidity mining, you will claim rewards, compound positions, and rebalance. Each action costs gas. If you are minting NFTs to flip, the mint costs gas and the listing costs gas. Gas fees are overhead on every strategy.
A user who pays $2 per transaction on mainnet when the same transaction costs $0.03 on an L2 is giving up 98.5% of that capital to unnecessary overhead. Over a year of active DeFi participation, that compounds to hundreds or thousands of dollars in wasted fees. The difference between gas-literate and gas-blind execution is measurable in annual returns.
The specific literacy required:
- Knowing the gas cost of each transaction type before signing
- Understanding when to use mainnet vs. L2 for specific actions
- Timing non-urgent transactions for off-peak periods
- Setting priority fees based on current mempool state, not guesswork
- Recognizing when a transaction's gas cost exceeds its economic benefit
That last point matters most. If claiming a $5 staking reward costs $3 in gas, the net return is $2\. If you claim weekly, the annual gas overhead is $156\. If you claim monthly, the annual gas overhead is $36\. The claiming frequency is a gas optimization decision, not just a convenience preference. Gas-literate users optimize for net return after fees, not gross yield.
## The Takeaway
Gas fees exist to compensate validators and prevent spam. EIP-1559 replaced auction guesswork with a predictable base fee that adjusts block by block, capped at 12.5% per block. You control the priority fee, which buys faster inclusion during congestion. Total cost is gas used times base fee plus priority fee. Fees spike during NFT launches, airdrops, and market volatility, and drop during off-peak UTC hours. Layer 2 networks reduce fees by 90 to 99 percent by batching transactions off-chain and posting compressed data to mainnet. Gas literacy is prerequisite infrastructure for every on-chain income strategy. Users who understand gas mechanics, time transactions for low base fees, and route routine actions to L2s keep more of their yield. Users who ignore gas pay overhead that compounds to material capital loss over time. The mechanism is transparent. The data is public. Use it.
## Frequently Asked Questions
### What are gas fees on Ethereum?
Gas fees are payments required to execute transactions on Ethereum. They compensate validators for the computational resources used to process your transaction and prevent spam attacks by making network abuse financially prohibitive. Gas fees consist of a base fee (burned) and a priority fee (paid to validators). The total cost depends on transaction complexity, current network demand, and the priority fee you set.
### How are gas fees calculated?
Gas fees are calculated as: units of gas used × (base fee + priority fee). A simple ETH transfer uses 21,000 gas. ERC-20 token transfers use 45,000 to 65,000 gas. Complex DeFi interactions can use 150,000 to 300,000 gas. The base fee adjusts automatically based on network congestion, rising up to 12.5% per block when demand exceeds the 30 million gas target. You set the priority fee to incentivize faster inclusion.
### Why do gas fees spike during certain times?
Gas fees spike when demand for block space exceeds Ethereum's 30 million gas target. NFT launches, token airdrops, market volatility causing DeFi liquidations, and US trading hours (14:00 to 22:00 UTC) create congestion. When blocks are more than 50% full, the base fee increases by up to 12.5% for the next block. This continues until demand drops. Fees are lowest between 02:00 and 05:00 UTC on weekends.
### How do Layer 2 networks reduce gas fees?
Layer 2 networks process transactions off-chain and batch compressed data back to Ethereum mainnet. They spread one mainnet transaction across hundreds or thousands of L2 transactions, reducing per-transaction costs by 90 to 99 percent. Arbitrum, Optimism, Base, and zkSync Era are the dominant L2s. A swap costing $1 on mainnet costs $0.03 on Arbitrum. The March 2024 Dencun upgrade reduced L2 data posting costs by roughly 60 percent via blob space.
### What happens if I set the gas limit too low?
If you set the gas limit too low, the transaction fails mid-execution and you lose the fee paid for gas consumed before failure. The gas used up to the failure point is not refunded. This happens most often with complex DeFi interactions where gas cost depends on contract state at execution time. Setting the gas limit too high wastes nothing because unused gas is refunded. Wallets auto-suggest gas limits based on transaction type, and those estimates are usually correct.
The Weekly Yield Report
You have just decomposed gas fee mechanics, base fee adjustment, and L2 cost reductions. Those base fees will be different in six hours.
Every Thursday: where crypto yield actually is - stablecoins, liquid staking and DeFi lending, with the risk named next to the rate and what changed since last week.
[Get it free every Thursday](#/portal/signup)
Free. No trade calls, no allocations, no hype. Unsubscribe in one click.
### Stablecoin Yield vs Money Market Funds: A Sustainability Comparison
URL: https://altcoininvestor.com/stablecoin-yield-vs-money-market/
Last updated: 2026-09-25T23:04:45.000Z
## The Decision You Are Actually Making

You have cash-equivalent capital earning nothing, or earning something insufficient, and you are deciding whether to allocate it to a stablecoin yield strategy or a traditional money market fund. The nominal yields advertised are not materially different in 2026\. Top government money market funds yield approximately 3.7-4.5% APY. USDC and USDT lending on established DeFi protocols deliver 3.5-7% depending on utilization. Tokenized Treasury products pay 4-6%. The headline rates do not decide this allocation. What decides it is where each yield originates, what structural conditions can eliminate it, and how the collateral backing each system compares when you evaluate reserve quality with the rigor a bond investor would apply to sovereign debt.
The question worth answering is not which pays more. The question is which yield is sustainable, what can break it, and whether the incremental return justifies the incremental risk once you account for the different failure modes each system has already demonstrated.
## Where Each Yield Actually Comes From
Money market fund returns derive from short-term lending to investment-grade sovereign and corporate issuers. The fund holds a portfolio of Treasury bills, agency securities, repurchase agreements, and commercial paper with maturities typically under 90 days. The securities pay interest. The fund distributes that interest to shareholders as dividends, minus a management fee typically between 0.10% and 0.50%. The yield is mechanically tied to the federal funds rate. When the Fed raises rates, money market yields rise with a lag of days to weeks as the fund rolls maturing securities into new issues at higher rates. When the Fed cuts rates, yields compress accordingly. The effective federal funds rate sat at 3.63% on September 11, 2026\. Money market funds paying 3.7-4.5% reflect that anchor plus a small premium determined by the fund's credit exposure and the shape of the short-term yield curve.
Stablecoin yields originate from three primary economic activities, depending on which strategy you deploy. First, DeFi lending interest. When you supply USDC or USDT to Aave, Compound, or Morpho, you are extending collateralized loans to borrowers who deposit crypto assets worth more than the stablecoins they borrow. The protocol algorithmically adjusts the supply rate based on utilization. High borrowing demand pushes yields up. Low demand compresses them. In 2026, typical base lending yields on established protocols range from 3.5% to 7% APY, fluctuating with market conditions. This is real yield. It comes from borrowers paying interest on capital they have used.
Second, liquidity provision fees. When you deposit stablecoins into decentralized exchange liquidity pools, you earn a portion of the trading fees generated when users swap through that pool. Uniswap v3 USDC-USDT concentrated liquidity positions can generate 2-6% APY from fees alone, though the yield is highly variable depending on trading volume and the width of your liquidity range. This is also real yield, derived from genuine economic activity.
Third, basis trade arbitrage. Protocols like Ethena operate delta-neutral strategies that hold spot crypto collateral (staked ETH or other liquid staking tokens) while shorting an equivalent amount of perpetual futures. The yield comes from three sources: staking rewards on the collateral, funding rate payments from the perpetual short position, and in some implementations, returns on Treasury bills backing a portion of reserves. Ethena's sUSDe has advertised yields around 7% APY, though the sustainability of that rate depends entirely on perpetual funding rates remaining positive. When funding turns negative for extended periods, the yield compresses or disappears.
Tokenized Treasury products represent a fourth category. BlackRock's BUIDL and similar vehicles hold short-term U.S. government debt and distribute the Treasury yield to token holders, minus minimal management fees. The yield is mechanically identical to a government money market fund, just settled on-chain. These products typically pay 4-5% APY in the current rate environment.
The structural difference that matters is this: money market fund yields are entirely dependent on the creditworthiness of short-term sovereign and corporate issuers and the fed funds rate trajectory. Stablecoin yields depend on the sustainability of borrowing demand, trading volume, or perpetual funding dynamics, plus the integrity of the smart contracts mediating those activities, plus the continued solvency and peg maintenance of the stablecoin issuer itself. Each layer introduces a distinct risk that money market funds do not carry.
## What Can Break Each System

Money market funds face credit risk, though it is bounded by regulation. SEC Rule 2a-7 mandates that funds hold only high-quality securities rated in one of the two highest categories by nationally recognized statistical rating organizations. The weighted average maturity cannot exceed 60 days for government funds and is tightly constrained for prime funds. The weighted average life cannot exceed 120 days. These rules exist because money market funds broke in 2008\. When Lehman Brothers collapsed, the Reserve Primary Fund held $785 million in Lehman commercial paper. The fund "broke the buck," falling below $1.00 per share. Institutional redemptions accelerated. The U.S. Treasury intervened with a temporary guarantee program to stop the run. Post-crisis reforms imposed the maturity and quality constraints that now define the category.
The failure mode for a money market fund in 2026 is credit default by a large issuer of commercial paper or agency debt during a financial crisis severe enough that the fund cannot maintain its $1.00 net asset value. The probability is low because the collateral is investment-grade and the maturity is short, but it is not zero. The precedent exists. Rate risk also matters, though inversely: when yields fall, returns compress, but principal remains stable. There is no depeg risk in the crypto sense. A money market fund does not lose its peg to the dollar. It may lose purchasing power if inflation exceeds the yield, but the nominal dollar value per share is structurally stable under normal conditions.
Stablecoin yield strategies face five distinct categories of risk, each of which has already caused total or near-total losses in documented cases. First, depeg risk. The stablecoin itself can lose its peg to the dollar, either temporarily or permanently. The most catastrophic example remains UST in May 2022, which went from $1.00 to effectively zero in three days when the algorithmic stabilization mechanism collapsed under reflexive selling pressure. Even non-algorithmic stablecoins have experienced temporary depegs. USDC briefly traded as low as $0.87 on some venues in March 2023 when Silicon Valley Bank failed and $3.3 billion of USDC's reserves were disclosed as deposits at SVB. The peg recovered within days after the U.S. government backstopped SVB depositors, but the event demonstrated that reserve concentration risk is real. USDT experienced a brief depeg to approximately $0.95 in May 2022 during the Terra/Luna collapse before snapping back to $1.00.
Second, smart contract risk. DeFi lending protocols are complex software systems managing billions of dollars in collateral and loans. Despite rigorous audits, exploits occur. The Euler Finance hack in March 2023 resulted in $197 million stolen via a flash loan attack exploiting a flaw in the donation mechanism. Funds were later recovered through negotiation, but the episode illustrates that code is not law in the sense that law is enforceable. Code is law in the sense that code executes what it says, including vulnerabilities the developers did not intend.
Third, counterparty risk, particularly relevant for basis trade strategies. Ethena's delta-neutral model depends on maintaining short perpetual positions on centralized exchanges. If the exchange becomes insolvent or freezes withdrawals (as FTX did in November 2022), the hedge leg of the trade disappears. The protocol is left holding unhedged spot exposure. The yield mechanism collapses, and the stablecoin's backing becomes directionally exposed to crypto price movements, which is exactly what a stablecoin is supposed to avoid.
Fourth, yield-source sustainability. Perpetual funding rates are not structurally guaranteed to remain positive. During bear markets or periods of low speculative activity, funding can turn negative for weeks, meaning the basis trade pays out rather than collecting income. Lending yields also fluctuate. When borrowing demand collapses (as it did in late 2022 and early 2023), DeFi lending rates compress toward the risk-free rate or below. A strategy advertising 7% APY can deliver 2% or less if market conditions shift.
Fifth, regulatory reclassification. The GENIUS Act, passed in 2025, established federal reserve standards for payment stablecoins and explicitly excluded yield-bearing stablecoins from retail access. Issuers must maintain reserves backing tokens on at least a one-to-one basis using a narrow set of eligible assets: cash, FDIC-insured deposits, short-term U.S. government debt, reverse repos collateralized by Treasuries, and SEC-registered money market funds. The bill does not permit secured loans, gold, or bitcoin as reserve assets. Tether's current mix, which includes approximately $5 billion in non-compliant assets, would require restructuring to meet the standard. Regulatory pressure can force delisting, restructuring, or reclassification of yield products in ways that eliminate the income stream without warning.
The probability of total loss is materially higher for stablecoin strategies than for money market funds. The historical record includes multiple instances where stablecoin-based yield went to zero in days. Money market funds have broken the buck once in modern history, and regulatory reforms were implemented specifically to prevent recurrence. This asymmetry in tail risk is the central consideration for conservative allocations.
## Collateral Quality Differential
Money market funds disclose holdings daily. You can verify the exact securities the fund owns, their maturity dates, their credit ratings, and the weighted average maturity of the entire portfolio. Government money market funds hold exclusively U.S. Treasury securities and agency debt. Prime money market funds hold commercial paper and corporate notes, but only from issuers rated in the top two tiers by credit rating agencies. The transparency is regulatory, not voluntary. SEC filings are public and machine-readable.
USDC provides the highest transparency among major stablecoins. Circle publishes monthly attestations by Deloitte confirming that reserves match or exceed circulation. As of Q1 2026, USDC reserves totaled $76.7 billion against $76.5 billion in circulation. The reserves are held in two pools: the Circle Reserve Fund, managed by BlackRock and composed entirely of cash and short-term U.S. Treasury bills maturing within approximately three months, and overnight deposits at regulated financial institutions. Circle also files daily disclosures with the SEC under the new GENIUS Act framework. The reserve structure is functionally equivalent to a government money market fund, just administered by a private issuer rather than a mutual fund complex.
USDT publishes quarterly attestations by BDO, a mid-tier accounting firm. The latest reports show net reserves of approximately $189.77 billion backing $189.77 billion in circulation, but the asset composition is broader. Approximately 84% is held in cash, bank deposits, short-term Treasury bills, and reverse repos. The remaining $5 billion includes secured loans, precious metals (primarily gold), and bitcoin. Tether also reports an excess reserve buffer ranging between $6 billion and $8 billion in recent periods, which provides a cushion against asset value fluctuations. The quarterly cadence and the inclusion of non-traditional reserve assets introduce uncertainty that USDC's monthly Deloitte attestations do not carry.
The regulatory framework governing money market funds is more stringent than the framework governing stablecoin reserves, even after the GENIUS Act. Money market funds are subject to SEC Rule 2a-7, which mandates credit quality, maturity limits, liquidity requirements, and stress testing. Stablecoin issuers operating under the GENIUS Act must maintain one-to-one backing with eligible assets, but the oversight and enforcement mechanisms are newer and less tested than the money market fund regime, which has been in place since 1983 and was substantially reformed after 2008.
The collateral quality comparison resolves into three tiers. Government money market funds and USDC both hold exclusively cash and short-term Treasuries, with USDC offering slightly higher yields in some DeFi lending contexts due to the risk premium embedded in smart contract exposure. USDT holds a broader mix of assets, introducing commodity and credit risk that government funds do not carry, but compensates with an excess reserve buffer and has maintained its peg through multiple severe crypto market events. Algorithmic or under-collateralized stablecoins occupy a third tier with materially higher structural risk, and their yield mechanisms have failed catastrophically in documented cases.
## Risk-Adjusted Return Comparison
A government money market fund paying 3.7% APY with investment-grade Treasury collateral, daily liquidity, SEC oversight, and no depeg risk represents the baseline. The return is modest, but the structural risk is bounded. The failure mode requires either a U.S. sovereign default (which would reprice all dollar-denominated assets) or a procedural failure by the fund administrator (which is insured and regulated). For capital that must remain liquid and cannot tolerate principal loss, this is the correct allocation.
USDC or USDT lending on Aave or Compound at 3.5-7% APY introduces smart contract risk, custody risk (you must hold the stablecoins in a non-custodial wallet or accept exchange custody risk), and the residual possibility of a stablecoin depeg. The incremental yield of 0-3 percentage points compensates for those risks. Whether that compensation is adequate depends on your ability to evaluate smart contract audits, monitor protocol governance, and maintain custody securely. For participants who can do those things, the risk-adjusted return is favorable. For participants who cannot, the incremental yield does not justify the structural complexity.
Tokenized Treasury products like BlackRock's BUIDL paying 4-5% APY offer yields comparable to government money market funds with the advantage of blockchain settlement and 24/7 liquidity. The collateral is identical: short-term U.S. government debt. The risk is also comparable, with the addition of smart contract risk on the tokenization layer. The allocation decision here reduces to whether on-chain settlement provides value sufficient to justify the technical learning curve and the custody requirements.
Basis trade strategies like Ethena's sUSDe advertising 7% APY carry funding rate volatility and counterparty exposure that the other categories do not. The yield is real when funding rates are positive and the exchange counterparties remain solvent, but both of those conditions are variable. Funding rates have turned negative during bear markets. Exchanges have failed. The 7% yield is not structurally guaranteed. It is a market-driven return that can compress to 2% or go negative if conditions shift. For allocations that can tolerate that volatility and monitor the underlying positions daily, the incremental return may justify the risk. For allocations that cannot, it does not.
The risk-adjusted comparison depends on what you are optimizing for. If you require principal preservation with regulatory safeguards and institutional oversight, government money market funds are correct. If you can custody assets, evaluate protocol risk, and monitor smart contract governance, USDC or USDT lending on established DeFi protocols offers incrementally higher yield for incrementally higher structural risk. The spread between the two has narrowed substantially since the GENIUS Act imposed reserve transparency standards. In 2020, the yield differential between DeFi stablecoin lending and money market funds exceeded 10 percentage points. In 2026, it is 0 to 3 percentage points depending on market conditions. That compression reflects both the maturation of stablecoin reserve practices and the recognition that the structural risks embedded in DeFi yield strategies are real and have been demonstrated.
## Who Each Option Is Right For
Money market funds are correct for capital that must remain in the traditional financial system, either because of regulatory requirements, institutional mandates, or personal risk tolerance. If you are managing capital for an entity that cannot accept custody risk or smart contract risk, a government money market fund paying 3.7-4.5% is the allocation. If you require FDIC insurance or SEC-regulated disclosure, stablecoins do not provide it, even with the GENIUS Act framework. If you are unwilling to learn how to custody crypto assets securely or evaluate whether a DeFi protocol's governance has changed its risk parameters, the incremental 1-3 percentage points of yield is not worth the learning curve.
Stablecoin lending on established protocols is correct for participants who can custody assets in non-custodial wallets, understand how to verify smart contract audits, and monitor utilization rates and governance proposals. The incremental yield of 3.5-7% APY compensates for the structural risk, but only if you can evaluate that risk. If you are deploying capital you can afford to have locked in a smart contract for days during a governance delay or a network congestion event, and if you can monitor whether the protocol has changed its liquidation thresholds or collateral requirements, the allocation is rational. If you cannot do those things, it is not.
Tokenized Treasury products are correct for participants who want Treasury-equivalent yield with blockchain settlement and 24/7 liquidity. The use case is narrow but real: cross-border treasury management, on-chain settlement for decentralized organizations, or simply the preference for holding yield-bearing assets in a non-custodial wallet rather than a brokerage account. The yield is comparable to government money market funds. The structural risk is also comparable, with the addition of smart contract risk on the wrapper layer. The decision depends on whether on-chain settlement solves a problem for you that traditional brokerage custody does not solve.
Basis trade strategies are correct for participants who can monitor funding rates daily, understand perpetual futures mechanics, and tolerate yield volatility. The 7-12% advertised yields are real when conditions are favorable, but they are not guaranteed. Funding can turn negative. Exchanges can fail. The collateral backing the stablecoin can become directionally exposed if the hedge leg breaks. This is an active strategy, not a passive one. It requires daily monitoring. For participants who can provide that, the incremental return may justify the complexity. For participants who cannot, it does not.
## Recommendation: Match the Yield to the Capital's Purpose
If you are allocating capital that must remain in the traditional financial system or that cannot tolerate custody and smart contract risk, government money market funds paying 3.7-4.5% are the correct allocation. The yield is modest, but the structural risk is bounded by regulation and historical precedent. If you are allocating capital you can custody securely and you can evaluate protocol governance and smart contract audits, USDC or USDT lending on Aave, Compound, or Morpho at 3.5-7% offers incrementally higher yield for incrementally higher structural risk. The trade is rational if you can manage the risk. If you cannot, it is not worth 1-3 percentage points.
Tokenized Treasury products are appropriate for participants who need on-chain settlement or prefer non-custodial asset management and are comfortable with the technical requirements. The yield is comparable to money market funds. The risk is also comparable, with smart contract risk added. Basis trade strategies like Ethena require daily monitoring and tolerance for yield volatility. They are not passive income. They are active positions that happen to be wrapped in a stablecoin. The 7% yield is not guaranteed. It is a spread that exists when market conditions support it and compresses or disappears when they do not.
The decision is not which pays more. The decision is which failure modes you can tolerate and which structural risks you can evaluate. Money market funds have broken the buck once in modern history, and the regulatory response was to impose maturity and credit quality constraints that make recurrence unlikely. Stablecoin yield strategies have experienced multiple total-loss events in the last four years, including the UST collapse, the USDC depeg during the SVB failure, and numerous smart contract exploits. The frequency and severity of those failures are materially higher than the failure rate of money market funds. The incremental yield compensates for that risk only if you can monitor and manage it.
## The Takeaway
The yield differential between stablecoin strategies and money market funds has compressed from double digits in 2020 to low single digits in 2026\. That compression reflects the maturation of stablecoin reserve practices under the GENIUS Act and the recognition that structural risks in DeFi are real. The allocation decision reduces to whether you can custody assets, evaluate smart contract governance, and monitor protocol risk parameters. If you can, the incremental 1-3 percentage points of yield on established DeFi lending protocols is compensation for work you are capable of performing. If you cannot, that yield is compensation for risks you cannot evaluate, and the rational allocation is a government money market fund paying 3.7-4.5% with SEC oversight and investment-grade collateral. The eurozone spent 2011 through 2013 discovering that yields on peripheral sovereign debt reflected default probability rather than return of principal. When credibility broke, the yields stopped being yields and became losses that had been accruing all along. Every yield opportunity, whether in crypto or traditional finance, has one question that decides sustainability: where does the money actually come from, and what happens when the flow stops. For further context on deploying stablecoin capital across different risk tiers, see [How To Earn Passive Income From Stablecoins In 2026](https://altcoininvestor.com/how-to-earn-passive-income-stablecoins-2026/), which covers the step-by-step mechanics of accessing 3.8-9% APY on USDC, USDT, and DAI via CeFi platforms, DeFi lending, and yield-bearing tokens with specific gas cost and risk disclosures.
## Frequently Asked Questions
### What is the main difference between stablecoin yield and money market fund returns?
Money market fund returns derive exclusively from short-term lending to investment-grade sovereign and corporate issuers, mechanically tied to the federal funds rate. Stablecoin yields originate from multiple sources: DeFi lending interest (3-7% base), liquidity provision fees, perpetual funding arbitrage (6-12%), or tokenized Treasury earnings. The collateral backing differs materially. Money market funds hold portfolios of Treasury bills, agency securities, and investment-grade commercial paper regulated under SEC Rule 2a-7\. Stablecoin reserves vary from USDC's monthly Deloitte attestations showing 100% cash and short-term Treasuries to USDT's quarterly BDO reports including secured loans, gold, and bitcoin in the mix.
### Are stablecoin yields sustainable compared to money market rates?
Sustainability depends on the yield source. Tokenized Treasury products paying 4-5% APY are mechanically sustainable, tracking the federal funds rate minus minimal fees. DeFi lending yields on established protocols (Aave, Compound, Morpho) paying 3.5-7% reflect genuine borrower demand and have persisted across market cycles. Basis trade strategies like Ethena's 7% sUSDe are sustainable only when perpetual funding rates remain positive, which they have not always been. The screening test is simple: strip protocol token emissions from the headline APY and observe what remains. If the residual is competitive with Treasury bill benchmarks, the mechanism is durable. If the advertised yield collapses when incentive tokens are removed, you are earning dilution disguised as income.
### What can cause a stablecoin yield strategy to fail completely?
Five distinct failure modes exist. First, depeg risk: the stablecoin itself loses its dollar peg, as UST did in May 2022, going from one dollar to effectively zero in days. Second, smart contract exploits: billions in DeFi positions remain subject to code vulnerabilities despite audits. Third, counterparty failure: basis trade strategies depend on exchanges maintaining hedge positions; exchange insolvency eliminates the arbitrage. Fourth, collateral liquidation cascades: mass borrower defaults during severe crypto drawdowns can compress lending yields and trigger protocol insolvency. Fifth, regulatory reclassification: the GENIUS Act explicitly excludes yield-bearing stablecoins from retail access, potentially forcing delisting or restructuring. Money market funds face credit risk on commercial paper exposures, but SEC regulations mandate investment-grade quality and maturity limits that prevent the total-loss scenarios stablecoins have demonstrated.
### Which yields better on a risk-adjusted basis in 2026?
For principal preservation with yield, money market funds deliver 3.7-4.5% with investment-grade collateral, SEC oversight, and no depeg risk. For informed participants willing to monitor smart contract risk and maintain custody, USDC or USDT lending on established protocols delivers 3.5-7% with acceptable structural risk. Tokenized Treasury products offer comparable returns to money market funds with blockchain settlement advantages. Basis trade strategies advertising 7-12% carry funding rate volatility and counterparty exposure that most yield-seeking allocations cannot justify. The decision reduces to this: if you require the institutional safeguards and regulatory framework traditional finance provides, money market funds are correct. If you can custody assets, evaluate smart contract audits, and monitor protocol governance, stablecoin lending on established venues offers incrementally higher yield for incrementally higher structural risk. The spread between the two narrowed substantially after the 2025 GENIUS Act imposed reserve standards.
### How do I evaluate reserve quality for stablecoins versus money market funds?
Money market funds disclose holdings daily under SEC Rule 2a-7, with mandated investment-grade quality and weighted average maturity limits. You can verify the entire portfolio composition. USDC provides monthly Deloitte attestations and daily SEC filings showing reserves of approximately $76.7 billion against $76.5 billion in circulation, backed entirely by cash and Treasury bills maturing within three months. USDT publishes quarterly BDO attestations with broader asset categories including secured loans, gold, and bitcoin totaling roughly $5 billion in non-GENIUS-compliant assets. The evaluation method differs. For money market funds, verify the fund is government-only or prime, check the weighted average maturity, and confirm the credit rating. For stablecoins, verify the attestation frequency (monthly is superior to quarterly), the auditor reputation, the percentage held in cash versus short-term Treasuries versus other assets, and whether the issuer maintains an excess reserve buffer.
The Weekly Yield Report
You have just compared two yield systems paying 3.7% to 7% with materially different failure modes. The rates, the risks, and the regulatory framework will all be different in six months.
Every Thursday: where crypto yield actually is - stablecoins, liquid staking and DeFi lending, with the risk named next to the rate and what changed since last week.
[Get it free every Thursday](#/portal/signup)
Free. No trade calls, no allocations, no hype. Unsubscribe in one click.
### What Is A Layer 2? Rollups Explained Simply
URL: https://altcoininvestor.com/what-is-layer-2-crypto/
Last updated: 2026-09-25T22:03:25.000Z
## What Is Layer 2 In Crypto?
A [Layer 2](https://altcoininvestor.com/layer-2/) is a separate blockchain that processes transactions off Ethereum, then posts transaction data and a state commitment back to Ethereum for final settlement. Ethereum validates the commitment and guarantees the funds. You get faster confirmations and fees 10-100x cheaper than L1, while inheriting Ethereum's security guarantees through the proof system.
Ethereum processes over 1 million transactions daily. When demand spikes, gas prices rise substantially. A simple swap can cost $15-50 in gas during peak hours. Layer 2 rollups solve this by moving transaction execution off the main chain while keeping Ethereum as the final arbiter of what is valid.
The core question: how does a separate chain prove to Ethereum that its transactions are valid without Ethereum re-executing every transaction? Two proof mechanisms answer this question. Optimistic rollups assume every batch is valid and rely on fraud proofs plus a seven-day challenge window. ZK rollups attach a cryptographic validity proof to every batch that Ethereum verifies in milliseconds.
Both are Layer 2\. Both inherit Ethereum's security. The proof mechanism determines withdrawal time, finality guarantees, and computational overhead.
## How Layer 2 Rollups Actually Work

A rollup batches thousands of transactions offchain, compresses them, and submits three things to Ethereum:
1. Transaction data (inputs, outputs, signatures), posted to Ethereum as calldata or blob data.
2. A state root (a cryptographic hash representing the new account balances after the batch).
3. A proof (either implicit via fraud-proof mechanism or explicit via zero-knowledge proof) that the state root is the correct result of executing those transactions.
Ethereum stores the transaction data and the state root. This is the security anchor. If the rollup operator disappears, anyone can reconstruct the rollup state from the data Ethereum holds. If the operator submits an invalid state root, the proof mechanism catches it.
The rollup sequencer collects user transactions, orders them, executes them in a virtual machine (often EVM-compatible), and computes the new state root. The sequencer then posts the batch to Ethereum. Users interact with the rollup through wallets and dApps that connect to the rollup RPC, not Ethereum mainnet. Confirmations are near-instant on the rollup. Final settlement happens when Ethereum accepts the batch.
This architecture enables the scalability gain. Ethereum no longer executes every transaction. It only verifies proofs and stores compressed data. With EIP-4844 (introduced in the Dencun upgrade in 2024), the cost of posting Layer 2 data fell by more than 90%. Arbitrum, Base, and Optimism process transactions for cents instead of dollars as a result.
## Optimistic Rollups vs. ZK Rollups: The Security Model Divide
**Optimistic rollups** (Arbitrum, Optimism, Base) assume every batch is valid. The rollup posts transaction data and a state root to Ethereum. If the state root is incorrect, any honest validator can submit a fraud proof within a seven-day challenge window. The fraud proof re-executes the disputed transaction on Ethereum to determine the correct outcome. If fraud is proven, the malicious sequencer loses its bond and the incorrect state root is reverted.
The advantage: fraud proofs require only one honest node. As long as someone is watching the chain, invalid batches will be challenged. The disadvantage: withdrawals from the rollup to Ethereum take seven days unless you use a third-party bridge that fronts liquidity for a fee. Malicious actors can steal funds if no honest nodes challenge invalid transactions during the window.
**ZK rollups** (zkSync Era, Polygon zkEVM, Scroll, StarkNet) attach a cryptographic validity proof to every batch. The proof mathematically guarantees that the new state root is the correct result of executing the transactions. Ethereum verifies the proof in milliseconds. No challenge window is needed because the proof itself is the security guarantee.
The advantage: withdrawals finalize in under an hour. The proof provides instant cryptographic certainty without relying on human actors. The disadvantage: validity proofs require sophisticated hardware and specialized proving circuits. This can centralize sequencer and prover control in the hands of a few operators who determine transaction ordering.
Both models inherit Ethereum's security. Optimistic rollups rely on economic incentives and at least one honest challenger. ZK rollups rely on mathematics and cryptographic assumptions. Neither can steal user funds without Ethereum detecting it, as long as the security mechanism functions as designed.
## Why Sidechains Are Not Layer 2s
A sidechain has its own validator set and its own security budget, even if it bridges assets to and from Ethereum. Polygon PoS, for example, is a sidechain. It runs a proof-of-stake consensus with its own validators. If those validators collude, they can rewrite the sidechain state. Ethereum does not validate Polygon PoS blocks. Ethereum does not store Polygon PoS transaction data.
A rollup, by contrast, posts every transaction's data to Ethereum and submits every state root to Ethereum for validation. [Ethereum is the ultimate arbiter of what is final](https://ethereum.org/en/layer-2/). If a rollup operator tries to submit an invalid state root, Ethereum rejects it (via fraud proof or invalid validity proof). Sidechains do not have this property. Their security is independent of Ethereum.
The test: does the network store its data on the Ethereum main network? If yes, it is a rollup. If no, it is a sidechain or an independent chain, regardless of marketing claims. Projects that do not use Ethereum for data availability or security are not Layer 2.
## Current Layer 2 Landscape In 2026
Arbitrum One leads all networks with approximately $16 billion in TVL, representing roughly 40% of the entire Layer 2 market. Base holds second position at $11-13 billion TVL. OP Mainnet holds third at $5.6 billion. Together, these three optimistic rollups control roughly 80% of DeFi TVL and 77% of secured value across Layer 2s.
ZK rollups collectively represent about 10% of the Layer 2 market by TVL, with $3.5 billion distributed across zkSync Era, StarkNet, and Scroll. Despite lower absolute TVL, zkSync is carving out dominance in high-value transactions, institutional use cases, and privacy-sensitive applications. The architecture enables features impossible with optimistic rollups: instant finality without 7-day withdrawal delays, native privacy through zero-knowledge proofs, and granular control over data availability modes.
Fee differences have narrowed substantially. Typical ZK rollup transaction fees in 2026 sit in the single-digit cents range for simple transfers and tens of cents for moderately complex DeFi interactions. Optimistic rollup fees on Arbitrum and Optimism range from $0.01-0.03 for ETH transfers, $0.02-0.05 for ERC-20 transfers, and $0.05-0.15 for Uniswap-style swaps. With median fee differences below $0.05 per transaction across all major networks, optimizing for gas costs alone is not a rational primary criterion.
Security maturity varies. [Arbitrum One is the only optimistic rollup rated Stage 1 by L2Beat](https://l2beat.com/layer2s/summary) as of mid-2026\. Stage 1 requires permissionless fraud proofs and a Security Council that cannot unilaterally upgrade contracts. The other major rollups remain at Stage 0, where a multisig can pause contracts or upgrade the system without a delay. This is a trust assumption. If the multisig is compromised or colludes, user funds are at risk.
## When Layer 2 Matters For Income Strategies
Layer 2 understanding is prerequisite for income strategies with lower gas overhead. If you are deploying $500 into a yield position and gas costs $40 per interaction, two rebalances consume 16% of your capital. On a rollup, the same interactions cost under $1 total. This changes the feasibility threshold for small-position yield farming, [stablecoin yield strategies](https://altcoininvestor.com/passive-income-stablecoins/), and active LP management.
DeFi protocols on Layer 2 offer the same yield mechanisms as Ethereum mainnet (LP fees, staking rewards, lending interest, protocol incentives), but gas no longer erodes returns. A $2,000 position in an Arbitrum liquidity pool can be entered, rebalanced, and exited for under $0.50 total gas. On Ethereum mainnet, the same operations cost $60-150 depending on congestion. The yield mechanism is identical. The capital efficiency is not.
Specific income strategies enabled by Layer 2:
- **Active LP positions** with frequent rebalancing. Concentrated liquidity on Uniswap V3 requires periodic range adjustment. On L1, gas makes this impractical for positions under $10,000\. On L2, the threshold drops to $1,000.
- **Stablecoin yield farming** with weekly or monthly compounding. Manual compounding costs $20-40 on L1\. On L2, it costs under $0.10\. The difference turns a 6% APY into an effective 6.2% with weekly compounding instead of quarterly.
- **Small-position testing** of new protocols. Deploying $200 to test a new yield strategy costs $30 in gas on L1 (15% overhead). On L2, it costs $0.20 (0.1% overhead).
- **Cross-protocol yield optimization**. Moving capital between protocols to chase yield becomes economically rational at smaller amounts. On L1, migration gas costs lock you into a position. On L2, you can move $500 between venues for $0.15.
The mechanism does not change. The gas friction disappears. That changes the viable position size and rebalancing frequency for most DeFi income strategies. Understanding which rollup hosts which protocols, what the withdrawal time is, and what the security model guarantees becomes prerequisite knowledge for deploying capital efficiently.
## What Layer 2 Does Not Solve
Layer 2 does not eliminate smart contract risk. A buggy lending protocol on Arbitrum can drain funds just as easily as a buggy protocol on Ethereum. The rollup does not audit the dApp code. It only guarantees that transactions execute as submitted and that the state root Ethereum accepts is mathematically correct.
Layer 2 does not eliminate oracle risk, liquidation risk, or impermanent loss. These are protocol-level and market-level risks. A collateralized debt position on Optimism can still be liquidated if the oracle reports a price drop. An LP position on zkSync can still suffer [impermanent loss](https://altcoininvestor.com/what-is-impermanent-loss-3/) if the token pair diverges.
Layer 2 does not eliminate withdrawal risk during the challenge period for optimistic rollups. If you need to exit an Arbitrum position and withdraw to Ethereum, the canonical bridge requires seven days. Third-party bridges front liquidity for a fee (typically 0.1-0.3%), but this introduces counterparty risk. The bridge operator could fail or freeze withdrawals. ZK rollups eliminate the time risk but not the bridge contract risk.
Layer 2 does not eliminate sequencer centralization risk. Most rollups currently run a single centralized sequencer controlled by the project team. If the sequencer censors your transaction, you cannot interact with the rollup until the sequencer includes it or a decentralized fallback is available. Arbitrum and Optimism have published roadmaps for decentralized sequencing, but as of 2026, execution is still centralized.
## The Specific Stress Condition That Tests Each Model
For optimistic rollups, the stress condition is a coordinated fraud attempt during a period when no honest validators are monitoring the chain. If every fraud-proof watcher goes offline and the sequencer submits an invalid state root, the seven-day window passes unchallenged and the fraudulent state becomes final. This is why rollup operators and third-party services run redundant watchers. The mechanism assumes at least one honest node with sufficient capital to post a fraud proof.
For ZK rollups, the stress condition is a soundness break in the proof system or a vulnerability in the prover implementation. If the cryptographic proof can be forged or if the prover can be tricked into generating a valid proof for an invalid state transition, the rollup can finalize fraudulent batches without detection. This is why zkEVM teams conduct extensive audits of proving circuits and why [ecosystem maturity matters](https://altcoininvestor.com/best-layer-2-networks/) when evaluating ZK rollup security.
For both models, the stress condition is Ethereum itself failing or censoring rollup batches. If Ethereum stops accepting Layer 2 data postings or if validators collude to censor rollup transactions, the security inheritance breaks. This is the shared dependency. Rollups are only as secure as Ethereum's base layer consensus.
## The Takeaway
A Layer 2 rollup is a separate execution layer that posts transaction data and state commitments to Ethereum for final settlement. Optimistic rollups use fraud proofs and a seven-day challenge window. ZK rollups use cryptographic validity proofs verified in under an hour. Both inherit Ethereum's security by making Ethereum the final arbiter of state. Sidechains do not. The proof mechanism determines withdrawal time, trust assumptions, and the specific failure mode. For income strategies, Layer 2 eliminates gas friction without eliminating protocol risk, market risk, or bridge risk. The viable position size for yield farming and LP strategies drops from $10,000 on Ethereum to $1,000 on rollups purely due to gas cost reduction. The mechanism is the same. The capital efficiency is not.
You now know the difference between optimistic and ZK rollups, why sidechains are not Layer 2s, and what specific conditions would cause each proof system to fail. The next step is identifying which protocols on which rollups offer sustainable yield mechanisms and what the withdrawal path looks like under stress.
## Frequently Asked Questions
### What is the difference between Layer 2 and a sidechain?
A Layer 2 rollup posts all transaction data to Ethereum and uses Ethereum to validate state roots through fraud proofs or validity proofs. Ethereum is the final arbiter of what is valid. A sidechain has its own validator set and security budget. Ethereum does not validate sidechain blocks or store sidechain data. If sidechain validators collude, they can rewrite the chain state. Rollups cannot, because Ethereum would reject the invalid state root.
### How long does it take to withdraw from a Layer 2 to Ethereum?
ZK rollup withdrawals finalize in under an hour because the validity proof provides instant cryptographic certainty. Optimistic rollup withdrawals take seven days when using the canonical bridge, because the fraud-proof challenge window must expire before the withdrawal is final. Third-party bridges can front liquidity for a fee (typically 0.1-0.3%) to enable faster withdrawals, but this introduces bridge counterparty risk.
### Are Layer 2 transaction fees always cheaper than Ethereum?
Yes, by 10-100x in 2026\. A simple ETH transfer on Arbitrum or Optimism costs $0.01-0.03 versus $3-15 on Ethereum mainnet. A Uniswap swap costs $0.05-0.15 on Layer 2 versus $15-50 on L1 during peak congestion. ZK rollups like zkSync offer similar or lower fees. EIP-4844 reduced Layer 2 data costs by over 90%, making rollup fees consistently low even during Ethereum congestion spikes.
### Can a Layer 2 rollup steal my funds?
No, if the security mechanism works as designed. Optimistic rollups require at least one honest node to submit fraud proofs during the seven-day window. If all watchers go offline, fraudulent batches can finalize. ZK rollups require the cryptographic proof system to be sound. If the proof can be forged, invalid state can be accepted. Both models also depend on Ethereum not censoring rollup batches. The rollup cannot steal funds without Ethereum detecting it under normal operation.
### Do DeFi protocols on Layer 2 offer the same yields as Ethereum?
The yield mechanisms are identical (LP fees, lending interest, staking rewards, protocol incentives), but gas efficiency changes capital requirements. A yield strategy requiring weekly rebalancing costs $30-50 per interaction on Ethereum, making it impractical for positions under $10,000\. On Layer 2, the same rebalancing costs under $0.50, lowering the viable position size to $1,000\. The yield rate is the same. The capital efficiency and feasible position size are not.
The Weekly Yield Report
You have just compared optimistic rollups and ZK rollups across proof mechanisms, withdrawal times, and security models. Those architectures will evolve and new rollups will launch with different trade-offs.
Every Thursday: where crypto yield actually is - stablecoins, liquid staking and DeFi lending, with the risk named next to the rate and what changed since last week.
[Get it free every Thursday](#/portal/signup)
Free. No trade calls, no allocations, no hype. Unsubscribe in one click.
### The Terms Can Change After You Deposit. Here Is Where To Look
URL: https://altcoininvestor.com/defi-protocol-governance-changes-yield/
Last updated: 2026-09-25T21:06:51.000Z
## The Question Most Depositors Never Ask

You deposit USDC into Aave on Monday. The collateral factor is 75 percent and the interest rate is 4.2 percent APY. On Friday, you check your position and the collateral factor has been adjusted to 68 percent. Your loan-to-value ratio now sits at 71 percent, uncomfortably close to liquidation, and you received no email, no notification, no alert of any kind. The proposal that changed the parameter was public for six days before execution. The vote passed with 89 percent approval. You never saw it because you did not know where to look.
Most people treat a deposit into a DeFi protocol as a fixed contract, the way a bond carries a stated coupon and a maturity date. It is not. The economic terms of your position, the collateral factors determining your liquidation threshold, the fee splits determining your yield, the reward emissions that may have justified your entry in the first place, are all subject to change by governance vote. Those votes happen on public infrastructure, follow predictable timelines, and are documented in forums, on-chain contracts, and off-chain signaling platforms. The difference between losing 30 percent of your position in a liquidation and exiting cleanly is often nothing more than checking the governance forum twice a week.
## What European Sovereign Debt Taught Us About Changing Terms

The European sovereign debt crisis between 2010 and 2013 provides the most direct historical parallel for what governance-controlled parameter changes can do to a creditor. Greece, Ireland, Portugal, and Cyprus all entered their respective crises with outstanding bonds that paid stated coupons and promised full repayment at maturity. Then the terms changed. In March 2012, Greece imposed a retroactive collective action clause on existing bondholders, forcing acceptance of a restructuring that delivered losses exceeding 70 percent of face value. Bondholders who had purchased Greek debt years earlier under one set of terms found themselves subject to an entirely new contract, imposed by a sovereign government that rewrote the rules after the money had already been lent.
Cyprus went further in 2013\. The government imposed capital controls and a bail-in on uninsured depositors at Bank of Cyprus and Laiki Bank, converting deposits above the insured threshold into equity in a recapitalized institution. Depositors woke up to find that the terms under which they held money in a commercial bank had been rewritten overnight by emergency decree. The legal architecture permitted it. The depositors had no recourse. The lesson is straightforward: when the institution managing your capital has the power to change the terms of your position after you have committed your funds, the original agreement is provisional, and the risk you carry includes the possibility that governance will rewrite the deal.
DeFi governance operates on the same principle. When you deposit into a protocol controlled by token holders, you are subject to the decisions of those token holders, implemented through on-chain governance contracts. The protocol documentation may describe the current fee structure, the current collateral factors, the current reward emissions. Those are not guarantees. They are the parameters in force today, and governance can change them tomorrow.
## The Five Parameter Changes That Affect Your Position

Not every governance proposal carries the same economic consequence for depositors. Five categories of parameter changes directly affect the risk or return of an existing position, and understanding which proposals fall into these categories allows you to filter governance noise for the signals that matter.
### Fee Switch Activation and Adjustment
Uniswap activated its fee switch on Ethereum on December 28, 2025, redirecting approximately 17 percent of swap fees into a treasury used for UNI buybacks and burns. Uniswap v2 pools shifted from a 0.30 percent liquidity-provider fee to 0.25 percent for liquidity providers plus a 0.05 percent protocol fee. Selected Uniswap v3 pools route a portion of LP fees to the protocol depending on the pool's fee tier. Daily protocol revenue rose to about $325,000 from a prior run rate near $114,000\. Liquidity provider returns were affected by the fee redistribution, but not enough to trigger significant liquidity flight, as Uniswap v4's customizable hooks allow pool creators to compensate by adjusting their own fee tiers.
From the perspective of a liquidity provider already deployed in a Uniswap v2 pool, this change reduced yield by roughly 17 percent overnight. The proposal was discussed in governance forums for weeks before the vote, passed with strong support, and executed after the standard timelock delay. If you were monitoring governance channels, you had time to withdraw liquidity before the fee switch went live. If you were not, your yield dropped and you learned about it after the fact.
### Collateral Factors and Liquidation Thresholds
When a protocol decides an asset has become too risky, they might lower its collateral factor from 60 percent to 50 percent. If your aggregate borrow position exceeds the new aggregate loanable value, your collateral becomes immediately liquidatable by any network participant who repays your borrow position with a bonus obtained as the collateral they receive equals the value of the loan they repay times the liquidation incentive. Users whose positions were comfortably collateralized under the old parameters can find themselves underwater the moment the new parameters execute, not because the price of their collateral moved but because governance redefined the threshold.
Gauntlet currently suggests the risk parameters for [Aave and Compound](https://altcoininvestor.com/best-defi-protocols/) and maintains risk dashboards for these protocols, attempting to predict worst-case liquidation scenarios at times of market stress. When Gauntlet proposes a collateral factor adjustment for an asset like LINK or UNI, the proposal appears first in the Aave Governance Forum, then moves to Snapshot for a non-binding temperature check, then to on-chain voting, and finally to execution after a timelock delay. The entire process typically takes between three and seven days from initial forum post to on-chain execution. During that window, you can exit your position, add collateral, or repay debt to restore your health factor before the new parameters take effect.
### Reward Emissions Ending or Adjusting
Many DeFi protocols subsidize early liquidity provision with token emissions. The advertised APY on a stablecoin farm may be 22 percent, composed of 3 percent from actual fee revenue and 19 percent from newly-issued governance tokens distributed to liquidity providers. When emissions end or are reduced by governance vote, the headline yield collapses overnight. If the only reason you deposited was the subsidized yield, and the subsidy disappears, your position no longer makes economic sense. Governance votes to reduce or eliminate emissions follow the same timeline as other parameter changes: forum discussion, Snapshot vote, on-chain proposal, timelock, execution. You have the same three-to-seven-day window to react, if you are watching.
### Interest Rate Model Changes
Lending protocols use interest rate models to set borrow and supply rates dynamically based on utilization. Governance can change the parameters of those models, shifting the slope of the interest rate curve or adjusting the utilization thresholds at which rates jump. For a borrower, a change to the interest rate model can increase borrowing costs by 200 basis points or more without any change in market conditions. For a lender, it can reduce yield in the same proportion. These changes are proposed, voted on, and executed through the standard governance process, and they affect every open position the moment they go live.
### Protocol Fee Redistribution
Aave activated Aavenomics 3.0 on June 27, 2026, replacing the prior committee-driven buyback with an immutable, non-discretionary mechanism that routes all Aave Protocol and GHO revenue to AAVE purchases without requiring committee sign-off. This change did not affect the yield paid to lenders or the fees paid by borrowers directly, but it redirected protocol revenue from one use to another, changing the economic incentives for AAVE token holders and altering the expected future cash flows from holding the governance token. From the perspective of someone who deposited liquidity based on an expectation of how protocol fees would be used, the terms changed.
## Where Parameter Changes Are Announced Before They Take Effect
The governance process for most large DeFi protocols follows a predictable lifecycle, and each stage of that lifecycle is documented on public infrastructure. If you know where to look, you can see parameter changes coming days before they execute, giving you time to adjust or exit your position.
### Governance Forums
The initial discussion phase happens in protocol-specific governance forums. For Aave, that is governance.aave.com, where proposals are posted as "Aave Request for Comment" (ARC) threads before moving to a formal vote. These forums are public, indexed by search engines, and often contain detailed technical analysis from risk teams like Gauntlet explaining the rationale for a proposed parameter change. If you check the governance forum for the protocol where your funds are deployed once or twice per week, you will see most consequential proposals during their discussion phase, often several days before they move to a vote.
### Snapshot Voting
Snapshot is an off-chain voting platform used by most major DeFi protocols to gauge community sentiment before moving to binding on-chain votes. A Snapshot vote is non-binding, but it signals whether a proposal has sufficient support to proceed. If a proposal to reduce USDC's collateral factor on Aave passes with 85 percent support on Snapshot, it will almost certainly move to on-chain execution. Snapshot votes are visible at snapshot.org, searchable by protocol, and they provide advance notice of parameter changes that will likely take effect within days.
### On-Chain Governance Contracts
The binding vote happens on-chain. For Ethereum-based protocols, governance contracts follow the OpenZeppelin Governor standard, which defines a formal proposal lifecycle: proposal creation with a proposer threshold, a voting period during which token holders vote on specific blocks, a timelock queue with delay periods ranging from 48 hours to seven days, and execution, where anyone can execute the proposal after the delay once the proposal's calldata is ready. You can monitor on-chain governance contracts directly using block explorers like Etherscan, or through governance-specific front ends provided by each protocol. Once a proposal enters the timelock queue, you know exactly when it will execute, and you have until that timestamp to react.
### Protocol Documentation and Risk Dashboards
Risk parameter changes are often published in protocol documentation sites and risk dashboards maintained by third-party analytics firms. [DefiLlama](https://defillama.com/protocols/lending) tracks total value locked, fees, and revenue data across DeFi lending protocols, and while it does not push alerts for governance votes, it reflects parameter changes in real time once they execute, allowing you to verify whether a proposed change has gone live. Gauntlet maintains public dashboards showing current collateral factors, liquidation thresholds, and recommended adjustments for Aave and Compound. These dashboards are updated as proposals move through governance, and they provide a centralized view of risk parameters across multiple assets and protocols.
## The Timeline From Proposal to Execution
Understanding the timeline gives you a concrete sense of how much advance notice you have once a parameter change enters the governance pipeline. The exact timeline varies by protocol, but the structure is consistent.
A typical flow begins with a forum post in the governance discussion section, where a community member or core contributor proposes a parameter change and provides technical justification. This post remains open for comment for three to seven days. If the proposal receives positive feedback, it moves to Snapshot for an off-chain temperature check. The Snapshot vote runs for three to five days. If the Snapshot vote passes, the proposal is formalized into on-chain calldata and submitted to the governance contract on Ethereum or another execution layer. The on-chain vote runs for another three to five days. If the on-chain vote passes, the proposal enters the timelock queue, where it sits for 48 hours to seven days depending on the protocol's timelock configuration. After the timelock expires, anyone can execute the proposal, and the new parameters take effect immediately.
From initial forum post to on-chain execution, the entire process typically takes between 10 and 21 days for major protocols like Aave and Compound. For protocols with shorter governance cycles or emergency multisig powers, the timeline can compress to as little as 48 hours. The point is that parameter changes do not happen without warning. They happen through a public process that gives depositors multiple opportunities to notice and respond, if they are monitoring the right channels.
## When Governance Moves Faster Than You Can React
The standard governance timeline assumes normal market conditions and proposals that follow the formal process. Two failure modes break that assumption and can leave depositors with no time to react.
### Flash Loan Governance Attacks
An attacker can use flash loans to accumulate a supermajority of governance weight in a single transaction, bypassing the normal proposal lifecycle. In April 2022, an attacker used flash loans totaling over a billion dollars of assets from Aave to reach a supermajority of governance weight in Beanstalk and drained $182 million from the protocol. The attack executed in one block, with no advance notice, no forum discussion, and no timelock delay. This failure mode is specific to protocols with low voter participation or governance tokens that can be borrowed in size. It is rare, but it demonstrates that the timeline from proposal to execution can collapse to zero under adversarial conditions.
### Multisig Emergency Powers
Many DeFi protocols retain multisig emergency powers that allow a small group of core contributors to pause the protocol, change parameters, or upgrade contracts without going through the full governance process. These powers exist to respond to exploits, oracle failures, or other acute risks, but they also create a vector for parameter changes that execute faster than the standard timeline. If a protocol's multisig decides that an asset's collateral factor must be reduced immediately to prevent mass liquidations during a market crash, they can execute that change in hours, not days. From a depositor's perspective, this means that even if you monitor governance forums and Snapshot votes religiously, you can still wake up to find that your position's terms have changed overnight due to an emergency multisig action.
## What To Do When You See a Proposal That Affects Your Position
Once you identify a governance proposal that will change the economics of your position, you have three options, and the timeline determines which one makes sense.
If the proposal is still in the forum discussion phase and has not yet moved to Snapshot, you have time to participate in governance. You can comment on the forum thread, explain how the proposed change affects your position, and vote against it if you hold governance tokens. Participation does not guarantee that the proposal will fail, but governance forums are not purely symbolic. Well-reasoned objections from large depositors or liquidity providers have killed or modified proposals in the past, particularly when the objection identifies an unintended consequence the proposer did not consider.
If the proposal has passed Snapshot and is moving to on-chain voting, your window for participation is closing. You can still vote against it on-chain if you hold governance tokens, but the Snapshot result gives you a strong signal of whether the proposal will pass. At this stage, the more practical decision is whether to adjust your position before the change takes effect. If the proposal reduces your collateral factor, you can add collateral or repay debt to restore margin. If it reduces your yield by cutting emissions, you can begin withdrawing liquidity in stages to avoid competing with other liquidity providers who will exit for the same reason once the change goes live.
If the proposal has already passed on-chain voting and is sitting in the timelock queue, you know exactly when it will execute, and you have until that timestamp to exit or adjust. This is the last clear window. Once the timelock expires and the proposal executes, the new parameters are in force, and your position is subject to them immediately.
## Why Most Depositors Miss These Changes
The infrastructure for tracking governance proposals exists, it is public, and it is accessible to anyone with an internet connection. The reason most depositors miss parameter changes is not that the information is hidden. It is that checking governance forums, Snapshot votes, and on-chain proposals is not part of their routine, and DeFi protocols do not push notifications to depositors when a proposal affects their positions.
Traditional finance solves this problem through regulatory disclosure requirements. If a bond issuer wants to change the terms of an outstanding bond, they must notify bondholders directly and obtain consent through a formal bondholder vote. DeFi has no such requirement. Governance votes proceed whether or not affected depositors are aware of them, and the protocol has no obligation to send you an email when a proposal that will cut your yield in half enters the timelock queue. The responsibility for monitoring governance falls entirely on the depositor, and most depositors do not do it because they do not realize the terms can change.
The second reason is that most depositors do not hold governance tokens and therefore have no vote. If you deposit USDC into Aave, you do not automatically receive AAVE tokens, and without AAVE you cannot vote on proposals that change the parameters governing your USDC position. Governance is controlled by token holders, and in most large DeFi protocols, token holdings are highly concentrated. A small number of whales, core contributors, and institutional investors hold enough tokens to pass or block any proposal. Whale control, apathy, and short-term decision-making have made governance less effective than hoped, and they have also made it rational for small depositors to ignore governance entirely. If you cannot affect the outcome of a vote, why spend time monitoring proposals?
The answer is that even if you cannot change the outcome, knowing what is coming allows you to exit before the change takes effect. That edge, by itself, is worth the time.
## Multichain Deployments and Information Lag
For protocols deployed across multiple chains, governance adds another layer of complexity. Aave, for example, uses Ethereum Mainnet as the core network for governance voting, with execution networks where proposal payloads are executed across various Layer 1 and Layer 2 environments including Polygon, Avalanche, Arbitrum, and Optimism. The Aave Delivery Infrastructure relays governance decisions from Ethereum to execution networks, introducing communication delay that can range from minutes to hours depending on network congestion and bridge latency.
From a depositor's perspective, this means that a governance proposal that executes on Ethereum Mainnet at block height X may not take effect on Polygon until several blocks later. If you are monitoring governance on Ethereum and you see a parameter change execute, you have a brief window to adjust your position on a different chain before the bridged message arrives and the new parameters go live there as well. This is a narrow edge, but it exists, and sophisticated liquidity providers exploit it.
## The Takeaway
The terms of your DeFi position are not fixed. They are controlled by governance, and governance can change collateral factors, fee splits, reward emissions, and interest rate models while your funds remain deployed. Those changes follow a public process that typically takes 10 to 21 days from initial proposal to execution, and every stage of that process is documented in governance forums, Snapshot votes, and on-chain contracts. If you check the governance forum for the protocol where your funds are deployed twice per week, you will see most consequential proposals before they take effect, giving you time to exit, adjust, or participate in the vote. The difference between losing 30 percent of your position in a liquidation triggered by a collateral factor reduction and exiting cleanly is often nothing more than reading the governance forum on Tuesday instead of Saturday. The infrastructure exists. The information is public. The question is whether you are looking.
## Frequently Asked Questions
### How much advance notice do I get before a DeFi protocol changes its terms?
Most major DeFi protocols follow a governance timeline of 10 to 21 days from initial forum proposal to on-chain execution. The process moves through forum discussion (3-7 days), Snapshot voting (3-5 days), on-chain voting (3-5 days), and timelock delay (48 hours to 7 days). If you monitor governance forums weekly, you will typically see parameter changes during the discussion phase, giving you at least a week to react before execution.
### Where exactly do I check for governance proposals that might affect my position?
Check three places: the protocol's governance forum (such as governance.aave.com for Aave), Snapshot.org for off-chain temperature-check votes, and the protocol's on-chain governance contract via Etherscan or the protocol's governance dashboard. Forum posts appear first, Snapshot votes signal community support, and on-chain proposals entering the timelock queue tell you exactly when a change will execute.
### Can governance change my collateral factor and liquidate me immediately?
Governance can lower collateral factors, but you are not liquidated the instant the change executes. If the new collateral factor pushes your loan-to-value ratio above the allowed threshold, you cannot borrow more, but you have time to add collateral or repay debt before the next price movement triggers liquidation. The immediate risk is that you lose your margin buffer, not that you are liquidated on the spot.
### What happens if I do not hold governance tokens and cannot vote?
You cannot influence the outcome of the vote, but you can still monitor governance channels to see what changes are coming and exit or adjust your position before they take effect. Monitoring governance is useful even without voting power because it gives you advance notice of parameter changes that affect your yield, collateral requirements, or liquidation risk.
### Have DeFi protocols ever changed terms faster than the normal governance timeline?
Yes. Emergency multisig powers allow core teams to pause protocols or change parameters in hours rather than days during acute crises. Flash loan governance attacks can also bypass the normal process entirely, as happened with Beanstalk in 2022 when an attacker used borrowed tokens to gain a governance supermajority and drain the protocol in a single transaction. These cases are rare but demonstrate that the standard timeline is not guaranteed.
The Weekly Yield Report
You now know where to check for governance proposals that can halve your yield or trigger your liquidation. Those proposals are already being drafted for next week.
Every Thursday: where crypto yield actually is - stablecoins, liquid staking and DeFi lending, with the risk named next to the rate and what changed since last week.
[Get it free every Thursday](#/portal/signup)
Free. No trade calls, no allocations, no hype. Unsubscribe in one click.
### The Money You Already Have That Is Earning Nothing
URL: https://altcoininvestor.com/idle-crypto-earning-nothing/
Last updated: 2026-09-25T19:06:02.000Z
## What This Checklist Accomplishes
You will find capital that is earning nothing. Stablecoins sitting on exchanges, unwrapped tokens on origin chains, dust trapped by transaction fees, rewards that were never claimed, and positions in venues that quietly stopped paying.
The stablecoin market crossed $315 billion in 2026\. Galaxy Research estimates that more than 80 percent of all stablecoins earn no yield for owners. That is $252 billion sitting idle while Circle and Tether made billions from interest on reserves that never reached holders.
This is not about finding new capital. It is about putting the capital you already own to work. The checklist below can be worked through in twenty minutes. It covers four categories of idle capital and gives you the specific locations to check.
### Prerequisites
You need access to every wallet you have used in the past two years. That includes hardware wallets, browser extension wallets, and exchange accounts. You need the seed phrases, passwords, or 2FA codes that unlock those wallets. If you cannot access a wallet, the capital in it is idle by definition.
You also need a list of every chain you have used. Ethereum mainnet, Arbitrum, Optimism, Base, Polygon, Solana, BNB Chain, Avalanche. If you bridged assets once and forgot about it, there is a real chance the origin-chain tokens are still sitting there.
## Category One: Stablecoins On Exchanges
Open every exchange account you have used. Coinbase, Kraken, Binance, Bybit, whatever you signed up for during the last bull market. Check your spot wallet balances. Look for USDC, USDT, DAI, or any other stablecoin.
If those stablecoins are sitting in your spot wallet earning nothing, you are giving up 3-8% APY depending on where you move them. In 2026, the interesting range is 3.5-9% APY on reputable venues. Aave, Morpho, Compound, Spark, and Sky are the DeFi options. Ledn, Kraken's staking product, and Nexo are the CeFi options.
The arithmetic is simple. At $5,000 a 5% rate difference costs $250 annually. At $50,000 it costs $2,500\. [The opportunity cost of leaving capital in below-market venues](https://altcoininvestor.com/defi-yield-opportunity-cost-rate-difference/) compounds every year you do nothing.
### The Failure Mode
Platform insolvency risk. FTX collapsed in November 2022\. Celsius, BlockFi, Voyager, and Gemini Earn all froze withdrawals between June and November 2022\. Genesis halted redemptions in November 2022\. Every one of these platforms was offering yields above Tier 1 rates, and every one crystallized custody risk in a bear market.
CeFi yields above Tier 1 DeFi rates are compensation for custody risk. If a platform is offering 12% when Aave is paying 5%, you are being paid to take on the risk that the platform becomes insolvent and you lose access to your capital. That risk is not theoretical.
### What To Do
Move stablecoins off exchanges unless you are actively trading. If you want yield, [deposit them into a lending protocol or a stablecoin savings product](https://altcoininvestor.com/how-to-earn-passive-income-stablecoins-2026/). If you want zero risk, move them to a hardware wallet and accept zero yield. But do not leave them on an exchange earning nothing while the platform uses them to generate revenue you never see.
Check every exchange. Not just your primary account. Every account you opened to claim a signup bonus, to buy a token that was only listed there, or to try a new feature. Idle capital fragments across platforms, and most people forget about the smaller accounts.
## Category Two: Unwrapped And Wrapped Token Gaps

Bridging creates gaps. You bridge ETH from Ethereum mainnet to Arbitrum. You use the bridged ETH on Arbitrum. You forget that the original ETH is still sitting on mainnet, wrapped as wETH or held in a bridge contract waiting for you to complete the second half of the transaction.
This happens with every wrapped token. wBTC, wETH, wrapped SOL on Ethereum, wrapped MATIC on other chains. The wrapping process creates a token on the destination chain, but the origin-chain token does not disappear. It sits in a contract or a wallet, earning nothing.
### Where To Check
Open a block explorer for every chain you have used. Etherscan for Ethereum, Arbiscan for Arbitrum, Solscan for Solana. Paste your wallet address into the search bar. Look at your token balances. Not just the tokens you remember holding. Every token the wallet has ever received.
Look for small amounts of ETH, MATIC, BNB, or other native tokens. These are often leftover gas tokens from a bridge transaction you completed months ago. Look for wrapped versions of tokens you currently hold elsewhere. If you see wETH on Ethereum but your ETH is on Arbitrum, the wETH is idle.
Check your transaction history. Find the last bridge transaction you initiated. Did you complete the second step? Some bridges require you to claim the tokens on the destination chain manually. If you never claimed them, they are still sitting in the bridge contract.
### The Dust Problem
Dust is any amount of crypto too small to justify the transaction fee required to move it. If you have 0.0003 ETH on mainnet and gas costs 0.0005 ETH, the dust is trapped. You cannot move it without spending more than it is worth.
Dust traps capital. It also creates a privacy risk. Dusting attacks send microscopic amounts of crypto to thousands of addresses. When victims spend dust alongside regular funds, the transaction reveals that all inputs belong to the same person. TRM Labs documented this attack vector in October 2025 on the Tron blockchain, but it happens on every chain.
Aggregate your dust. If you have 0.0003 ETH on five different chains, that is 0.0015 ETH total. Still dust on a per-chain basis, but if you bridge it all to a low-cost chain like Arbitrum or Base, it becomes worth moving. Use a bridge aggregator that supports small amounts and check the fee before you initiate the transaction.
## Category Three: Unclaimed Rewards And Airdrops
If you have been active on-chain in the past two years, there is a real chance you are sitting on unclaimed crypto without knowing it. Protocol airdrops, liquidity mining rewards, staking rewards that were never withdrawn, governance tokens distributed to early users.
The problem is that most airdrops have claim deadlines. Unclaimed rewards after the deadline are retained by the protocol, not paid out late. Grass specified this in their airdrop terms. Optimism's RetroPGF rounds had claim windows. Arbitrum's airdrop had a six-month claim period. If you missed the window, the tokens are gone.
### How To Check
Use an airdrop eligibility checker. Two tools cover most chains. AirdropAlert supports Ethereum, Layer 2s, Solana, and Base. Drops.bot covers Ethereum, Arbitrum, Solana, Cosmos, Sui, Aptos, and Bitcoin. Paste your wallet address into both tools and check the results.
The tools will show you airdrops you are eligible for and airdrops with active claim windows. They will also show you airdrops that have closed. You cannot claim the closed ones, but you can use the list to identify protocols you interacted with. If one airdrop closed, there might be others from similar protocols that are still open.
Check each protocol's official claim page. Not a link someone sent you on Twitter. Not a DM. Go to the protocol's website, find the governance or airdrop section, and verify the claim page URL before you connect your wallet. Phishing links are common, and connecting your wallet to a malicious site can result in drained funds.
### The Verification Step
Before you claim anything, screenshot your wallet address and the claim page. This creates a record of what you owned before the claim, which matters for tax reporting. Airdrops are taxable as income in most jurisdictions, and you need documentation of the value at the time you received it.
Check the token contract address. Compare it to the address listed on the protocol's official documentation or on a reputable token tracker like CoinGecko or CoinMarketCap. If the addresses do not match, the token is fake and the claim page is a phishing attempt.
Verify the claim transaction in your wallet before you approve it. Look at what permissions the transaction is requesting. If it is asking for approval to spend all of your tokens, not just the airdrop, reject the transaction. Legitimate claim transactions request zero permissions because they are sending tokens to you, not taking tokens from you.
## Category Four: Positions That Stopped Paying
Protocols change their terms. Uniswap cut LP fees by 17% in certain pools. Aave changed liquidation thresholds, which altered the effective yield for some positions. Liquidity mining programs end, and the APY you were earning drops to near-zero overnight.
Most people do not notice until they check their balances weeks later. By then they have given up weeks or months of yield they could have earned elsewhere. The protocol did not notify you. The terms changed in a governance vote you did not read, and your position is now earning nothing.
### What To Check
Log into every DeFi position you hold. Aave, Compound, Curve, Uniswap, any liquidity pool, any lending position, any staking position. Check the current APY. Compare it to the APY when you opened the position.
If the APY has dropped by more than 20%, the terms changed or the incentives ended. Check the protocol's governance forum or announcement channel. Find out what changed and whether the new APY is permanent or temporary. If it is permanent, decide whether the new rate justifies the smart contract risk and gas cost of staying in the position.
Check your unclaimed rewards. Many protocols accumulate rewards in a separate contract that you must claim manually. Compound, Aave, and Curve all work this way. If you have been in a position for months and never claimed rewards, there is a balance waiting for you.
Claiming rewards costs gas. Do the math before you claim. If you have $20 in unclaimed COMP and gas costs $15, wait until the balance is higher or until gas prices drop. Set a reminder to check again in two weeks. Do not let unclaimed rewards sit indefinitely, but do not pay more in gas than the rewards are worth.
### The Token-Subsidized APY Trap
Some platforms subsidize yields with their own governance tokens. This can inflate APYs dramatically. You see 15% APY, but when you decompose it, 8% comes from stablecoin lending and 7% comes from protocol token emissions.
If the protocol token loses 80% of its value, which happened to dozens of tokens between 2022 and 2024, your effective yield collapses. You were earning 15% nominally, but in dollar terms you lost money because the token rewards were worth less than the opportunity cost of holding a different position.
Check what percentage of your yield comes from token emissions versus native yield. Native yield is interest paid in the same token you deposited. USDC deposits earning USDC interest. Token emissions are rewards paid in a different token. If more than 30% of your APY comes from emissions, you are taking on token price risk in addition to smart contract risk.
## The Twenty-Minute Checklist
Here is the procedure. Work through it in order. Do not skip steps.
One. Open every exchange account you have used in the past two years. Check spot wallet balances for stablecoins. Write down the amount and the platform.
Two. Open a block explorer for every chain you have used. Ethereum, Arbitrum, Optimism, Base, Polygon, Solana, BNB Chain, Avalanche. Paste your wallet address into each explorer. Check token balances. Write down every token with a balance above $10.
Three. Check for wrapped tokens. If you hold ETH on Arbitrum, check Etherscan for wETH on mainnet. If you hold MATIC on Ethereum, check Polygonscan for MATIC on Polygon. Wrapped tokens are idle unless you are actively using them.
Four. Paste your wallet address into AirdropAlert and Drops.bot. Check the results. Write down every airdrop with an active claim window.
Five. Log into every DeFi position you hold. Aave, Compound, Curve, Uniswap, any liquidity pool, any lending position. Check the current APY. Check your unclaimed rewards. Write down both numbers.
Six. Calculate the total idle capital. Stablecoins on exchanges plus unwrapped tokens plus unclaimed rewards. That is the amount earning nothing.
Seven. Calculate what that capital would earn at 5% APY. Multiply the total by 0.05\. That is the annual opportunity cost of leaving it idle.
Eight. Decide where to move it. DeFi lending if you are comfortable with smart contract risk. CeFi savings if you want custody at a regulated platform. Hardware wallet if you want zero yield and zero platform risk. But make the decision. Do not leave it idle because you have not decided yet.
## What To Do Next
Move the capital. If you found $10,000 in idle stablecoins, move them to a lending protocol or a savings product. If you found $500 in unclaimed rewards, claim them if gas costs are reasonable. If you found wrapped tokens on multiple chains, bridge them to a single chain where you can put them to work.
Gas costs matter. Do not spend $50 in gas to move $100 in capital. Wait for gas prices to drop, or batch your transactions so you are moving multiple assets in a single session. Check gas trackers like Etherscan's gas tracker or Blocknative before you initiate transactions.
Set a recurring reminder to repeat this checklist every quarter. Capital fragments over time. You will interact with new protocols, claim new airdrops, bridge to new chains. Every interaction creates potential idle capital. The audit you run today will find different results in three months.
Document everything for tax purposes. [Use crypto tax software](https://altcoininvestor.com/is-koinly-free/) to track your holdings, your claims, and your yield. Moving capital between wallets is not a taxable event in most jurisdictions, but claiming airdrops, earning yield, and selling tokens all are. If you do not track it, you will overpay when you file.
## The Stress Conditions
Every yield strategy has failure modes. Understand them before you move capital.
Smart contract risk. DeFi protocols can be exploited. Aave, Compound, and Curve have strong security track records, but no protocol is immune. If a protocol has a bug, hackers can drain the pool. Your capital is not FDIC-insured. If the pool is drained, you lose your deposit.
Custody risk. CeFi platforms can freeze withdrawals or become insolvent. [Stablecoin interest products on exchanges](https://www.kraken.com/learn/what-is-stablecoin-interest) are not bank accounts. The platform is using your capital to generate yield, and if the platform fails, you become an unsecured creditor in bankruptcy proceedings.
Regulatory risk. The SEC fined Kraken $30 million in February 2023 for failing to register its staking service. Staking and lending products face ongoing regulatory scrutiny. Platforms can shut down products with little notice, and when they do, you need to withdraw your capital or accept whatever new terms they impose.
Liquidation risk. If you use your idle capital as collateral for a loan, you take on liquidation risk. If the collateral value drops below the liquidation threshold, the protocol liquidates your position to repay the loan. This can happen in minutes during volatile markets, and you lose the collateral.
Gas cost risk. Moving capital costs gas. If gas prices spike, you might not be able to afford to move your capital even if you want to. This is especially true on Ethereum mainnet, where gas can exceed $50 per transaction during network congestion. Factor gas costs into every decision about where to move capital.
## The Takeaway
You just worked through the four categories of idle capital. Stablecoins on exchanges, unwrapped tokens, unclaimed rewards, and positions that stopped paying. If you found any, you now have a specific list of where it is and how much it totals.
The next step is to move it. Not tomorrow. Today. Because every day you leave capital idle, you give up the yield it could have earned. At 5% APY, $10,000 earns $1.37 per day. At $50,000 it earns $6.85 per day. Those numbers compound, and they only start compounding when you move the capital.
Run this checklist again in three months. Capital fragments. Protocols change. Airdrops launch. The audit you ran today will find different results next quarter, and the quarter after that. The highest-return action available is finding capital you already own that is earning nothing, because it requires no new capital and no additional risk decision. Just the decision to stop leaving it idle.
## Frequently Asked Questions
### How much idle crypto does the average person have?
Galaxy Research estimates that more than 80 percent of all stablecoins, representing over $252 billion of the $315 billion stablecoin market, earn no yield for owners. Individual holders typically have idle capital fragmented across multiple exchanges, unwrapped tokens on origin chains after bridging, unclaimed airdrop rewards with approaching deadlines, and positions in DeFi protocols that quietly reduced or stopped paying yield after governance changes.
### What is the biggest risk of moving idle crypto to earn yield?
Smart contract risk for DeFi protocols and custody risk for CeFi platforms represent the primary failure modes. DeFi protocols can be exploited through code vulnerabilities, resulting in total loss of deposited capital with no insurance. CeFi platforms can freeze withdrawals or become insolvent, as demonstrated by FTX, Celsius, BlockFi, Voyager, and Genesis between June and November 2022, converting depositors into unsecured creditors in bankruptcy proceedings.
### How do I know if an airdrop claim page is legitimate?
Go directly to the protocol's official website through a bookmark or verified URL, never through links from social media or direct messages. Compare the token contract address shown on the claim page to the address listed on the protocol's official documentation and reputable token trackers like CoinGecko. Verify the claim transaction requests zero token spending permissions, as legitimate claims only send tokens to you without requesting approval to spend your existing holdings.
### When does it make sense to leave crypto idle on an exchange?
Capital should remain on exchanges only when actively trading or when the amount is too small to justify gas costs for withdrawal. For amounts under $500, transaction fees to move assets off-chain can consume 2-10% of the value depending on network congestion. For active traders executing multiple transactions daily, keeping working capital on the exchange reduces cumulative gas costs, but long-term holdings earning zero yield represent pure opportunity cost.
### What happens to unclaimed airdrop rewards after the deadline?
Unclaimed rewards after protocol-specified deadlines are typically retained by the protocol treasury, not distributed later or reallocated to other users. Grass explicitly stated unclaimed rewards would not be paid out after expiration. Optimism RetroPGF rounds and Arbitrum airdrops had claim windows ranging from three to six months. Once the deadline passes, tokens become permanently inaccessible regardless of eligibility proof.
The Weekly Yield Report
You just identified four categories of idle capital and the specific locations to check. Those balances and claim windows will change next quarter.
Every Thursday: where crypto yield actually is - stablecoins, liquid staking and DeFi lending, with the risk named next to the rate and what changed since last week.
[Get it free every Thursday](#/portal/signup)
Free. No trade calls, no allocations, no hype. Unsubscribe in one click.
### How To Evaluate A Newly Listed Aave V3 Stablecoin In 30 Days
URL: https://altcoininvestor.com/evaluate-aave-v3-stablecoin-listing-30-days/
Last updated: 2026-09-25T17:10:16.000Z
## What You Will Accomplish
In April 2025, RLUSD appeared on Aave V3 at 4.98% APY with a $50 million supply cap and zero initial utilization. By May 2026, the stablecoin had grown to $1.78 billion in circulation and became a fixture of Ethereum mainnet DeFi.
That trajectory, from new listing to established asset, contains risk signals at every step.
This article provides a repeatable 30-day risk framework for evaluating newly listed stablecoins on Aave V3\. You will learn how to verify reserve quality in the first 72 hours, measure liquidity depth before scaling deposits, confirm oracle configuration against manipulation risk, and interpret early borrow demand as a sustainability signal.
The income mechanism here is straightforward. Early entry into a new listing can capture 4-5% yields before rates normalize to the 2-3% baseline most established stablecoins offer. But poor due diligence risks depeg exposure on six-figure positions. Your objective is to separate conservative launches from systemic failures before you deploy meaningful capital.
Prerequisites: You should already understand [how stablecoin lending generates yield](https://altcoininvestor.com/how-to-earn-passive-income-stablecoins-2026/) and have used Aave V3 at least once. You need enough capital to justify the time spent on this evaluation process. If you are testing with $500, skip to established stablecoins. If you are deploying $50,000 or more, this framework prevents costly mistakes.
## Step 1: Verify Reserve Composition Within 72 Hours
The first question is not whether the stablecoin is listed on Aave. The first question is whether the reserves backing the stablecoin are what the issuer claims they are, and whether those reserves can withstand a redemption run.
RLUSD is backed by USD deposits, cash equivalents, and short-term U.S. Treasuries, with custody held by The Bank of New York Mellon under monthly independent attestations. That structure places it at the conservative end of the stablecoin risk spectrum. But "monthly attestation" introduces a 30-day lag between what the issuer publishes and what the current reserve composition actually is.
Your 72-hour checklist:
- Cross-reference the latest published attestation at ripple.com/legal against the on-chain TVL visible on [Aave V3's DefiLlama page](https://defillama.com/protocol/aave-v3).
- Confirm the attestation is dated within the past 45 days. If the most recent report is older than that, the issuer has missed a scheduled disclosure.
- Check the reserve breakdown. Stablecoins backed entirely by short-duration Treasuries are safer than those holding corporate debt or repo agreements.
- Verify the custodian is a regulated institution. BNY Mellon custody is institutional-grade. A custodian you have not heard of requires additional research.
If the attestation is missing, outdated, or vague about asset composition, do not proceed. The 4.98% APY is not worth exposure to undisclosed reserve risk.
### Redemption Mechanism Test
A stablecoin's ability to maintain its peg depends on whether users can redeem tokens for dollars at a 1:1 ratio on demand. If the issuer cannot meet redemption requests due to illiquidity or insolvency, the perceived value of the token declines, and the on-chain price depegs.
Simulate a redemption request within the first week. This does not mean redeeming your entire position. It means initiating a small redemption through the issuer's official channels and documenting the confirmation time and workflow.
For RLUSD, redemption happens through Ripple's institutional interface, not through a retail-facing app. That structure is appropriate for a NYDFS-regulated stablecoin, but it also means retail users have less visibility into redemption speed. If you cannot easily determine how long a redemption takes or what the minimum threshold is, that opacity is a red flag.
## Step 2: Measure Liquidity Depth On Secondary Markets
A stablecoin can have perfect reserves and still depeg if secondary market liquidity is insufficient to absorb sell pressure. RLUSD is smaller than USDT and USDC, so liquidity can be thinner in some markets and trading pairs.
Liquidity measurement is not subjective. You are checking whether the stablecoin can handle your position size without material slippage.
Open Uniswap V3 and simulate a $100,000 swap from RLUSD to USDC. Note the slippage percentage. If slippage exceeds 0.5%, the liquidity pool is too shallow to support a six-figure exit without moving the price. That does not mean the stablecoin is unsafe. It means your position size exceeds the liquidity available, and you will face exit friction if you need to redeem quickly.
Compare that figure to the Aave V3 supply cap. If the supply cap is $50 million but Uniswap V3 liquidity for RLUSD/USDC is only $2 million, a mass exit from Aave would overwhelm the secondary market and create temporary depeg risk.
This is not a theoretical concern. On March 12, 2026, Aave V3 experienced an oracle manipulation incident involving $862,000\. The root cause was not reserve failure but price feed distortion in a low-liquidity environment. When secondary market depth is thin, oracle manipulation becomes easier and liquidation cascades become more severe.
### What Liquidity Depth Tells You About Maturity
Low liquidity in the first 30 days is not inherently bad. It signals a conservative launch. But liquidity should grow as TVL grows. If Aave TVL increases by 50% over 30 days but Uniswap liquidity remains flat, borrow demand is outpacing market-making incentives. That imbalance creates depeg risk.
Check liquidity depth on day 7, day 14, and day 30\. If liquidity is not scaling with TVL, governance has misjudged demand, and you are exposed to exit friction that more established stablecoins do not have.
## Step 3: Confirm Oracle Configuration And Manipulation Resistance
Aave V3 relies on Chainlink Price Feeds to determine the value of collateral and trigger liquidations. For stablecoins, the oracle's job is to confirm that $1.00 of RLUSD equals $1.00 of value. That sounds simple. It is not.
Oracle configuration determines how quickly Aave reacts to price deviations and how much tolerance exists before liquidations trigger. If the oracle is too slow to update, Aave may accept depegged collateral as if it were still worth $1.00\. If the oracle is too sensitive, minor liquidity fluctuations can trigger mass liquidations.
Ripple chose Chainlink Price Feeds for RLUSD to provide tamper-proof, reliable asset prices directly on-chain. That choice is sound, but implementation details matter.
Your oracle checklist:
- Verify the Chainlink feed for RLUSD on Ethereum mainnet at data.chain.link. Check the update frequency and deviation threshold.
- Confirm that the feed updates at least once per hour or whenever the price deviates by more than 0.5% from the last reported value.
- Check the staleness threshold. If the oracle allows a price that is more than 24 hours old to be used in liquidation logic, that lag creates manipulation risk.
- Identify whether Aave uses a single Chainlink feed or multiple price sources. Single-source oracles are more vulnerable to manipulation than multi-source aggregators.
If you cannot find this information in [Aave's asset listing documentation](https://github.com/aave/aave-asset-listing), the listing is not mature enough for large deposits.
### Isolation Mode vs. Core Market Exposure
Aave V3 introduced isolation mode to limit systemic risk when listing riskier assets. In isolation mode, a stablecoin can only be borrowed against isolated collateral, and it cannot be used as collateral for other assets.
RLUSD's listing parameters determine whether it was launched in isolation mode or added directly to the core market. If RLUSD is in the core market, Aave governance has determined that it meets the same risk standards as USDC and DAI. That is a strong endorsement. If RLUSD is in isolation mode, Aave considers it higher-risk, and your exposure should be calibrated accordingly.
Check governance.aave.com for the Technical Asset Listing Framework adopted in May 2026\. This framework standardizes the review process for new assets and makes isolation vs. core market decisions transparent. If RLUSD passed the technical review gates without isolation restrictions, that outcome signals lower risk.
## Step 4: Interpret Early Borrow Demand As A Sustainability Signal
RLUSD launched on Aave with zero initial utilization. That is normal. A conservative launch means supply enters the market before borrow demand, and rates remain low until arbitrage opportunities develop.
But if utilization remains at 0% after 30 days, that signal is concerning. It means no one is borrowing RLUSD, which means there is no organic demand for the asset outside of passive lending. Yield on Aave comes from borrowers paying interest. If no one borrows, your APY will stay near 0% regardless of what the supply cap allows.
Your borrow demand checklist:
- Monitor utilization on Aave V3 weekly. Healthy early-stage utilization is 5-15% by day 30.
- Compare RLUSD borrow APY to USDC and USDT borrow APY on the same platform. If USDC borrow rates are rising and RLUSD borrow rates remain flat, arbitrageurs are not using RLUSD because liquidity or redemption friction makes it less efficient.
- Check whether Aave or Ripple has activated any liquidity mining incentives for RLUSD borrowers. If incentives are live and utilization is still 0%, demand is structurally weak.
Low utilization in the first week is fine. Low utilization at day 30 means the market does not need this stablecoin yet, and you are better off deploying capital into USDC or DAI, where borrow demand is established and yields are predictable.
### Funding Rate Arbitrage As A Demand Proxy
Stablecoin borrow demand on Aave often comes from traders executing funding rate arbitrage on perpetual futures exchanges. When funding rates on ETH-PERP or BTC-PERP are positive, traders borrow stablecoins on Aave, open short positions on the perp, and collect funding payments while hedging their exposure.
If funding rates are positive and USDC borrow demand is high but RLUSD borrow demand is absent, the issue is not a lack of arbitrage opportunity. The issue is that RLUSD is not yet integrated into the trading workflows arbitrageurs use. That integration lag can persist for months, and during that period, your RLUSD deposits will earn minimal yield.
## Step 5: Assess Governance Control Risk And Admin Keys
Stablecoins are not immutable. Most stablecoin contracts include admin functions that allow the issuer to freeze accounts, pause transfers, or upgrade the contract. Those functions are necessary for regulatory compliance, but they also introduce governance risk.
For RLUSD, governance control sits with Ripple. The company operates under NYDFS regulation, which limits the discretion Ripple has to change contract behavior without regulatory approval. That structure is safer than a stablecoin governed by a multisig with no regulatory oversight.
But you still need to verify the governance setup:
- Check the RLUSD contract on Etherscan for admin functions. Identify whether Ripple can freeze individual accounts or pause the entire contract.
- Verify whether Ripple's admin controls have timelock delays. A timelock prevents the issuer from executing changes instantly and gives users time to exit if they disagree with a governance decision.
- Assess whether Ripple uses a multisig for admin control. Single-key control is riskier than a multisig requiring 3-of-5 signatures.
If admin keys are held by a single wallet with no timelock, that structure is higher-risk than a multisig with a 48-hour delay. Governance risk does not mean the stablecoin will fail. It means that your funds are subject to decisions you cannot influence, and you need to size your position accordingly.
### Multi-Chain Bridge Risk
RLUSD operates on Ethereum mainnet and the XRP Ledger, with expansions to Layer-2 networks including Base, Optimism, Unichain, and Ink through a partnership with Wormhole. Multi-chain deployment increases utility but also increases attack surface.
Bridge exploits are one of the largest sources of loss in DeFi. If RLUSD is bridged to Layer-2 and the bridge contract is exploited, tokens minted on the Layer-2 may not resolve to mainnet custody. That discrepancy creates temporary depeg risk until the issuer intervenes.
During the first 30 days, confirm that Aave's RLUSD integration is using native Ethereum mainnet RLUSD, not bridged tokens. If Aave lists bridged RLUSD, you are exposed to both stablecoin reserve risk and bridge exploit risk.
## Step 6: Monitor Supply Cap Dynamics And Governance Response
RLUSD launched on Aave with a $50 million supply cap and a $5 million borrow cap. Those caps are conservative by design, but they also create a governance bottleneck if demand exceeds expectations.
If supply reaches 90% of the cap within 30 days, that outcome signals strong demand. But it also means new deposits are blocked until governance votes to raise the cap. Governance votes on Aave take 5-7 days from proposal to execution. During that window, you cannot add to your position, and yield may compress as existing suppliers compete for limited borrow demand.
Your supply cap checklist:
- Check Aave V3 supply metrics weekly. If supply exceeds 80% of the cap, governance is behind demand.
- Monitor governance.aave.com for RLUSD cap increase proposals. If no proposal appears after supply reaches 90%, governance is unresponsive, and the listing is not scaling as planned.
- Verify that the borrow cap is scaling proportionally with the supply cap. A $50 million supply cap with a $5 million borrow cap means maximum utilization is 10%. If the borrow cap does not increase, yields will remain compressed regardless of how much capital enters the pool.
If governance is slow to raise caps, that delay is not necessarily a red flag. It may reflect caution. But it does mean the opportunity to capture early-stage yield is closing faster than you expected, and you should adjust your allocation timeline.
## Common Failure Modes And How To Spot Them
Most newly listed stablecoins do not fail catastrophically. They fail quietly by underperforming expectations. Here are the specific failure modes you are screening for.
### Reserve Opacity
If the issuer publishes attestations irregularly or provides vague descriptions of reserve composition, that opacity is a leading indicator of reserve quality problems. Established stablecoins like USDC publish reserve breakdowns monthly with specific percentages allocated to each asset class. New stablecoins that avoid that level of disclosure are hiding something.
### Liquidity Stagnation
If Uniswap liquidity for the stablecoin does not grow as Aave TVL grows, market makers are not incentivized to provide liquidity. That imbalance creates depeg risk during periods of high withdrawal demand.
### Oracle Lag
If the Chainlink feed for the stablecoin updates less frequently than once per hour, or if the staleness threshold is set above 24 hours, the oracle is too slow to react to depeg events. That lag exposes Aave to accepting depegged collateral as if it were still worth $1.00.
### Persistent Zero Utilization
If utilization remains at 0% for 30 days, no one is borrowing the stablecoin. That outcome means your deposits will earn minimal yield, and the listing has not achieved product-market fit.
### Governance Unresponsiveness
If supply reaches the cap and governance does not propose a cap increase within 10 days, Aave governance is either unaware of demand or unwilling to expand exposure. Either scenario is a negative signal.
## What To Do Next
If RLUSD or any newly listed stablecoin passes the 30-day checklist, your next step is to scale your position gradually. Do not deploy your full allocation on day 31\. Deploy 25% of your intended allocation and monitor for another 30 days. If utilization remains healthy, liquidity continues to grow, and governance responds promptly to supply cap constraints, scale to 50%, then 75%, then 100%.
If the stablecoin fails any of the checklist items, do not deploy additional capital. Move to an established stablecoin with a longer track record and accept the lower yield. The 1-2% yield premium on a new listing is not worth the risk of a 5-10% depeg if reserves, liquidity, or governance fail.
For readers deploying six-figure positions, this framework is not optional. The difference between a 4.98% yield and a 3.5% yield is $1,480 per year on $100,000\. The cost of a 5% depeg is $5,000\. One failure erases three years of outperformance. The math favors caution, and caution requires process.
## The Takeaway
RLUSD's launch on Aave V3 at 4.98% APY looked attractive. It still might be. But "attractive" is not the same as "safe," and yield is not the same as return. Return is yield minus losses, and losses come from skipping the steps outlined here.
The most common mistake retail DeFi users make is treating all stablecoins as equivalent because they all claim to be worth $1.00\. They are not equivalent. Reserve composition, liquidity depth, oracle configuration, borrow demand sustainability, and governance responsiveness all vary, and those variables determine whether a newly listed stablecoin will hold its peg under stress.
The next time a stablecoin launches on Aave V3 at an elevated yield, run this checklist before you deposit. You are not looking for perfection. You are looking for evidence that the issuer, governance, and market infrastructure are prepared for the scale the listing will reach. If that evidence is missing, wait. The opportunity to earn 4-5% today is not worth the risk of explaining to yourself later why you ignored the signals that were visible from the beginning.
## Frequently Asked Questions
### Is RLUSD safe to deposit on Aave V3?
RLUSD is backed by USD deposits, cash equivalents, and short-term U.S. Treasuries with BNY Mellon custody and NYDFS regulation. Those fundamentals place it at the conservative end of stablecoin risk. However, newly listed stablecoins require 30 days of monitoring to verify liquidity depth, oracle configuration, and borrow demand sustainability before deploying large positions. Start with 25% of your intended allocation and scale gradually after confirming reserve attestations are current, secondary market liquidity supports your position size, and utilization is growing.
### How long should I wait before depositing into a newly listed Aave stablecoin?
Wait at least 7 days to verify reserve composition and redemption mechanisms, then monitor for 30 days to assess liquidity growth, borrow demand, and governance responsiveness. Deploy capital in stages: 25% after day 7 if reserves and oracles check out, another 25% after day 30 if utilization reaches 5-15%, and scale to full allocation only after 60 days if liquidity depth and governance response remain healthy. Rushing into a new listing to capture early yield risks depeg exposure that erases months of outperformance.
### What is a safe utilization rate for a new stablecoin on Aave?
Healthy early-stage utilization is 5-15% by day 30\. Zero utilization after 30 days signals weak borrow demand and means yields will remain near zero regardless of supply cap. Utilization above 80% in the first 30 days signals strong demand but also creates liquidation risk if borrowers are concentrated in leveraged positions. Target 10-20% utilization for the first 90 days as a sign of organic growth without excess leverage risk.
### How do I check if a stablecoin oracle on Aave is vulnerable to manipulation?
Verify the Chainlink feed at data.chain.link for update frequency, deviation threshold, and staleness limit. The feed should update at least once per hour or whenever price deviates by more than 0.5%. Staleness thresholds above 24 hours create manipulation risk because Aave may accept outdated prices during depeg events. Check Aave's asset listing documentation for whether the protocol uses a single Chainlink feed or multiple price sources. Single-source oracles are more vulnerable than multi-source aggregators.
### What reserve composition is safest for a new stablecoin?
The safest reserve structure is 100% short-duration U.S. Treasuries and cash held by a regulated custodian like BNY Mellon, with monthly third-party attestations published within 30 days. Avoid stablecoins backed by corporate debt, repo agreements, or reserves described vaguely as 'cash equivalents' without specific percentages. If the most recent attestation is older than 45 days or does not break down reserve composition by asset class, the issuer is not meeting transparency standards established by USDC and should be treated as higher-risk.
The Weekly Yield Report
You have just reviewed a 30-day checklist for RLUSD and other newly listed stablecoins. Those risk parameters change with every new listing and every governance vote.
Every Thursday: where crypto yield actually is - stablecoins, liquid staking and DeFi lending, with the risk named next to the rate and what changed since last week.
[Get it free every Thursday](#/portal/signup)
Free. No trade calls, no allocations, no hype. Unsubscribe in one click.
### How To Extract Income From NFT Trait Rarity Without Selling
URL: https://altcoininvestor.com/how-to-earn-income-from-rare-nft-traits/
Last updated: 2026-09-25T16:03:39.000Z
## What This Article Covers
If you hold an NFT with rare traits, you typically face a binary choice: keep it and enjoy the status, or sell it and take the profit. This guide shows how to extract income from trait rarity without selling the asset.
The methods covered are collateralized lending against rare traits for higher loan-to-value ratios, rental income premiums driven by rarity, trait-specific airdrop eligibility, and derivative positions tied to trait value. You will see which collections support these mechanisms, what the yields actually look like, and where the failure modes occur.
Prerequisites: You need a wallet capable of interacting with lending and rental protocols, and an NFT from a collection with documented rarity data. Blue-chip collections on Ethereum or Solana work best because their trait hierarchies are well-established and priced into secondary markets.
## Step 1: Determine Whether Your NFT's Traits Command a Measurable Premium

Rarity scores do not automatically translate into higher lending or rental income. The market determines which traits matter. On average, rarer NFTs sell for higher prices, trade less frequently, and exhibit lower downside volatility according to a peer-reviewed study of 3.7 million NFT transactions. But that pattern holds only when the collection has active demand and established rarity infrastructure.
Start by checking whether your collection is indexed on rarity tools. For Ethereum NFTs, Rarity Tools and Rarity Sniffer provide trait rankings. Solana collections use HowRare.is, which integrates directly with Magic Eden. If your NFT ranks in the top 10% by rarity score and the collection has sustained floor price activity over the past 30 days, trait premiums are likely priced in.
Next, confirm that premium in the market. Filter your collection by rarity score on OpenSea or Magic Eden, then sort by recent sales. If top 5% rarity NFTs are selling at 1.5x to 3x floor price, the premium is real. If rare traits are listed at floor with no takers, the rarity is not valued by current buyers.
CryptoPunk #5822, which holds two rare traits (Alien type and Bandana accessory), sold for 8,000 ETH in February 2022\. That sale reflects the upper bound of trait premium in a collection where both the base type and accessory scarcity align. Most collections will not replicate that magnitude, but the logic is the same: documented scarcity plus buyer demand equals measurable premium.
If your NFT does not pass this test, the income methods below will not work. Lenders and renters price based on floor value and liquidity, not rarity scores that the market ignores.
## Step 2: Use Trait Rarity To Secure Higher LTV Ratios in Collateralized Loans
NFT-backed lending platforms issued over $2 billion in loans as of 2026\. The two dominant models are peer-to-peer (P2P) and pool-based. P2P platforms like NFTfi and Arcade let lenders set custom terms for individual NFTs. Pool-based platforms like BendDAO and Blend offer instant liquidity from pooled reserves but rely on algorithmic pricing tied to floor value.
Trait rarity matters more in the P2P model because lenders can manually evaluate your NFT and offer better terms if they believe the trait premium provides downside protection. Standard LTV ratios range from 30% to 50% of floor price. If your NFT has documented rare traits, you can negotiate closer to 60% LTV with lenders who specialize in that collection.
Here is how to approach it. List your NFT as collateral on NFTfi or Arcade. In the listing description, include the rarity rank, specific traits, and recent comparable sales. Lenders who track that collection will see the rank and adjust their offer. If your NFT is valued at $20,000 based on its traits and the floor is $12,000, a lender might offer $12,000 at 60% LTV relative to trait-adjusted value rather than $6,000 at 50% LTV relative to floor.
Interest rates on NFT loans range from 10% APR for blue-chip assets to over 60% for niche collections. NFTfi takes a 5% cut of interest earned by lenders. Loan terms typically run 30 to 90 days. The key risk is liquidation. If the floor price drops 30% during your loan term and your LTV crosses the liquidation threshold (usually 80% to 90% depending on platform), the lender can seize your NFT.
Borrowing at low LTV (30% or below) provides a safety buffer. Even if the floor drops 50%, your LTV stays under 60%, well below liquidation risk. That conservative approach sacrifices liquidity but preserves the asset. The [income strategy for flipping NFTs](https://altcoininvestor.com/how-to-flip-nfts-for-profit-2/) requires selling at the right moment, but collateralized lending lets you access liquidity while retaining upside exposure.
Pool-based lending through BendDAO offers faster execution but less flexibility. BendDAO provides up to 40% LTV based on algorithmically determined floor price, with instant liquidity from their reserve pool. Rare traits do not influence the LTV calculation because the system prices all NFTs in a collection identically. Use pool lending when speed matters more than maximizing loan size.
## Step 3: Monetize Rare Traits Through Rental Income Premiums
NFT rental markets allow you to lease usage rights without transferring ownership. The renter gains access to whatever utility the NFT provides (gaming benefits, token-gated communities, metaverse land usage) while the NFT remains in escrow. Rental income for most NFTs ranges from 1% to 5% of the NFT's value annually. High-demand or rare NFTs can earn 10% to 20% annually.
Trait rarity drives rental premiums in three scenarios: gaming NFTs with rare stats that improve earning potential, metaverse land parcels in high-traffic locations, and membership or access passes for exclusive communities. The strongest rental use cases deliver time-sensitive value that renters can extract during a defined period.
Gaming NFTs provide the highest rental yields because renters can measure the expected earnings from play-to-earn mechanics. If a rare weapon or character NFT allows a player to earn $50 per week in a game, renters will pay a meaningful percentage of that expected income to access the asset. [NFT rental income through utility assets](https://altcoininvestor.com/how-to-rent-out-nfts-for-income/) works when both parties understand what benefits transfer during the rental period.
Rental platforms like reNFT and IQ Protocol handle the smart contract escrow and usage rights enforcement. Renters pay upfront or in installments depending on the rental duration. The renter never gains ownership. At the end of the rental period, the NFT automatically returns to your wallet.
Earnings vary widely based on demand, platform fees, and utilization rate. Compare recent rental history for similar NFTs in your collection. If floor-price NFTs are renting at 2% monthly yield and your rare-trait NFT is listed at the same rate, you are underpricing. Adjust the rental price upward by 50% to 100% if your traits are in the top 10% by rarity and the collection has active rental demand.
The failure mode here is listing on a platform with no active renters for your collection. Before listing, check whether comparable NFTs have rented in the past 30 days. If rental activity is zero, the market does not exist yet. You will pay gas fees to list and earn nothing.
## Step 4: Capture Trait-Specific Airdrop Eligibility
Some NFT projects distribute airdrops based on trait rarity rather than simple holder status. Doodles and Moonbirds have both rewarded holders with exclusive NFT drops, and in some cases those drops were weighted by trait rarity or holder tenure. The logic is that projects want to reward long-term holders of high-value assets within their ecosystem.
Airdrop income is speculative and inconsistent. A study of airdrop tokens found that 88% lose value within three months of distribution. The income opportunity exists at the moment of distribution, not six months later. If you receive a trait-gated airdrop, the decision is whether to sell immediately or hold for potential appreciation. The data suggests selling is the higher-probability outcome.
To position for trait-based airdrops, hold rare NFTs in collections with active development teams and upcoming product launches. Monitor project announcements and community governance proposals for signals that airdrops are planned. Projects building games, metaverse platforms, or token economies are more likely to reward holders with new assets tied to those ecosystems.
The NFT airdrop strategy is sometimes called "NFT ambush" in crypto markets. As more projects target NFT holders for airdrops, demand for equity NFTs with potential airdrop expectations has increased. That demand inflates floor prices before the airdrop occurs, which means you might capture value by selling the expectation rather than holding through the actual distribution. [Earning crypto airdrops](https://altcoininvestor.com/how-to-earn-crypto-airdrops/) across protocols requires months of interaction and careful cost accounting, and the same discipline applies to NFT-based airdrops.
One thing worth noting: airdrop eligibility often requires holding the NFT in a non-custodial wallet at a snapshot date. If your NFT is collateralized in a lending protocol or listed for rental, you might not qualify. Check eligibility requirements before locking your asset in a smart contract.
## Common Failure Modes
Floor price crashes are the primary liquidation risk in NFT-backed lending. If your collection's floor drops 40% overnight due to a market-wide NFT downturn or project-specific bad news, your LTV spikes immediately. Protocols trigger liquidation when LTV crosses their threshold, typically 80% to 90%. Once liquidated, you lose the NFT and any upside from trait rarity.
Low collection support is the second failure mode. Not all collections are supported by lending and rental platforms. Before listing, confirm that your collection is recognized by the protocol and that there are active lenders or renters. Do not assume that a well-known platform supports your specific NFT. Check comparable listings and recent loan or rental activity.
Rental platforms sometimes lack enforcement mechanisms for usage rights. If the protocol cannot reliably prevent the renter from selling or transferring the NFT during the rental period, you face counterparty risk. Stick to platforms with documented smart contract escrow and a track record of rental completion without disputes.
Airdrop depreciation is a risk when you hold through distribution instead of selling immediately. The historical data shows that most airdrop tokens lose value quickly. If you receive a trait-gated airdrop worth $500 at distribution, selling that day captures more value than holding for three months in 88% of cases.
Chain-specific infrastructure differences matter. Ethereum has the most developed rarity analysis tools and the deepest lending markets. Solana has strong rarity tooling through HowRare.is and active lending through platforms like CitrusDAO, but overall liquidity is lower. If your NFT is on a chain with weak rarity infrastructure or limited lending platform support, the income methods described here will not work.
## What to Watch
Monitor your LTV ratio daily if you have an active NFT-backed loan. Set alerts for floor price drops of 10% or more. If your LTV approaches 70%, consider repaying part of the loan to reduce liquidation risk.
Track rental utilization rates for your collection. If rental demand is increasing, raise your rental price incrementally. If demand drops and your NFT sits unlisted for 60 days, lower the price or remove the listing to avoid signaling that your asset is unwanted.
Watch project governance channels and developer activity for signals of upcoming airdrops. The earlier you position, the less competition you face from airdrop farmers who pile into a collection after airdrop rumors circulate.
Compare lending terms across platforms every 30 days. Interest rates and LTV ratios shift based on platform liquidity and market conditions. If a new lender offers 50% LTV at 12% APR and your current loan is 40% LTV at 18% APR, refinancing might make sense.
## The Takeaway
Rare NFT traits generate income through higher LTV ratios in collateralized loans, rental premiums for utility-driven assets, and trait-specific airdrop eligibility. The methods work when your collection has active demand, established rarity infrastructure, and platform support for lending or rentals.
The market determines which traits command premiums. Rarity scores alone do not guarantee income unless buyers, lenders, and renters price that rarity into their offers. Blue-chip collections on Ethereum and Solana provide the most reliable infrastructure for trait-based income extraction.
Borrowing against rare NFTs avoids the taxable event of a sale while providing liquidity. Rental income provides ongoing yield without transferring ownership. Trait-gated airdrops offer speculative upside, but the data shows that selling immediately after distribution captures more value than holding.
The risks are liquidation from floor price crashes, low platform support for niche collections, and airdrop depreciation. Conservative LTV ratios, active monitoring of rental demand, and disciplined airdrop exit timing reduce those risks.
External research on NFT rarity and transaction data is available through [peer-reviewed studies of 3.7 million trades](https://arxiv.org/pdf/2312.05346), which document the relationship between trait rarity and price premiums across multiple collections.
## Frequently Asked Questions
### Do rare NFT traits automatically qualify for higher lending amounts?
No. Trait rarity only increases lending amounts when lenders manually evaluate your NFT and price the premium into their offer. Peer-to-peer platforms like NFTfi allow custom terms based on rarity, while pool-based platforms like BendDAO use algorithmic floor pricing that ignores trait differences. You must demonstrate that your traits command measurable market premiums through recent comparable sales to negotiate higher loan-to-value ratios.
### What rental income can I expect from a rare NFT?
Most NFTs earn 1% to 5% of their value annually from rentals. Rare or high-demand NFTs can earn 10% to 20% annually if they provide measurable utility like gaming advantages or metaverse access. Gaming NFTs with rare stats that improve play-to-earn income provide the highest rental yields because renters can quantify expected earnings. Rental income depends on active platform demand for your specific collection and trait combination.
### How do I avoid liquidation when borrowing against a rare NFT?
Borrow at low loan-to-value ratios of 30% or below to create a safety buffer against floor price drops. Monitor your LTV daily and set alerts for 10% or greater floor price declines. If your LTV approaches 70%, repay part of the loan to reduce liquidation risk. Conservative LTV positioning allows your NFT to survive 50% floor drops without crossing the 80% to 90% liquidation threshold most platforms enforce.
### Are trait-based NFT airdrops worth holding for income?
Historical data shows that 88% of airdrop tokens lose value within three months of distribution. Selling immediately after receiving a trait-gated airdrop captures more value than holding in most cases. Position for airdrops by holding rare NFTs in collections with active development and upcoming launches, but plan to exit the airdrop token on distribution day rather than speculating on long-term appreciation.
### Which blockchain has the best infrastructure for rare trait income?
Ethereum has the most developed rarity analysis tools, deepest lending markets, and widest platform support for NFT-backed loans and rentals. Blue-chip Ethereum collections like CryptoPunks and Bored Ape Yacht Club have well-documented trait hierarchies that lenders and renters price accurately. Solana offers strong rarity tooling through HowRare.is and active lending platforms, but overall liquidity and collection depth remain lower than Ethereum as of 2026.
The Weekly Yield Report
You just reviewed four income methods for rare NFT traits with yields ranging from 1% to 60% APR. Those rates and collection support levels change with market conditions every month.
Every Thursday: where crypto yield actually is - stablecoins, liquid staking and DeFi lending, with the risk named next to the rate and what changed since last week.
[Get it free every Thursday](#/portal/signup)
Free. No trade calls, no allocations, no hype. Unsubscribe in one click.
### Best Layer 2 Networks Compared: Which to Use in 2026
URL: https://altcoininvestor.com/best-layer-2-networks/
Last updated: 2026-09-25T15:06:08.000Z
## Why Layer 2 Networks Matter for Income Strategies

Ethereum mainnet charges $8-$15 per transaction. That makes small-balance yield strategies uneconomical. A $500 position in an Aave market costs $30 in gas to deposit and withdraw, consuming 6% of principal before earning a single basis point.
[Layer 2 networks](https://altcoininvestor.com/layer-2/) solve this. Post-EIP-4844, transactions on Arbitrum, Base, and Optimism cost $0.02-$0.09\. That makes sub-$1,000 positions viable for lending, liquidity provision, and yield aggregator strategies that would bleed capital on L1.
The income test is simple: can you deposit, earn, and withdraw without gas costs eating your returns? On mainnet, no. On the right L2, yes.
But the Layer 2 landscape is fragmented. Arbitrum holds $17B in TVL. Starknet holds under $200M. Both are technically sound. The difference is ecosystem depth, security model, and where the applications you need actually live.
This comparison covers six networks: Arbitrum One, Optimism, Base, zkSync Era, Starknet, and Polygon zkEVM. Each has a different security architecture, fee model, and application focus. The right choice depends on what you're doing.
## Arbitrum One: DeFi Depth and Stylus

Arbitrum One leads every TVL metric. As of mid-2026, it holds $17B in total value locked, representing roughly 40% of the entire Layer 2 market. That TVL is concentrated in lending markets (Aave, Compound), decentralized exchanges (Uniswap, Camelot, Trader Joe), and yield aggregators (Yearn, Beefy).
If you're deploying capital into [DeFi protocols](https://altcoininvestor.com/best-defi-protocols/), Arbitrum has the deepest liquidity pools, the lowest slippage, and the widest protocol selection. GMX, the leading perpetuals DEX, processes over $1B in weekly volume exclusively on Arbitrum. That is ecosystem gravity.
**Security model:** Optimistic rollup, Stage 1\. Arbitrum shipped BOLD permissionless validation in late 2025\. That means fraud proofs no longer depend on a centralized operator. Any validator can challenge a fraudulent state root. The 7-day withdrawal window remains, but the trust assumption is lower than zkSync Era's Stage 0 multisig.
**Fee structure:** Arbitrum enforces a 0.01 GWei base fee floor when demand falls below its speed limit. This explains why Arbitrum blocks often show unused headroom compared to Base and Optimism, which allow fees to decline arbitrarily under the EIP-1559 model. Average transaction cost: $0.09.
**Developer tooling:** Arbitrum runs Stylus, which allows developers to deploy smart contracts in Rust and C++ alongside Solidity. This matters for compute-heavy applications like on-chain AI inference or complex derivatives pricing. Stylus contracts compile to WebAssembly, which runs faster than EVM bytecode.
**Failure mode:** Centralized sequencer. In December 2023, Arbitrum suffered a 1.5-hour outage when inscription-related traffic consumed 90% of network capacity. Secondary nodes failed to take over due to a concurrent software upgrade conflict. The sequencer is a single point of failure even at Stage 1.
**Who it's for:** DeFi users deploying $1,000+ into lending, LP positions, or yield aggregators. If the protocol you need is on Arbitrum, use Arbitrum. The liquidity and ecosystem depth justify the marginally higher fees.
## Base: Consumer Apps and Coinbase Integration
Base holds $11.2B in TVL and is the second-largest L2 by market share. It is an OP Stack rollup built and operated by Coinbase. The defining characteristic is Coinbase integration: Base supports 1-click deposits from Coinbase accounts, and Coinbase Wallet treats Base as a first-class network.
This makes Base the lowest-friction onramp for users new to Layer 2\. If you hold funds on Coinbase and want to access [yield-bearing stablecoins](https://altcoininvestor.com/passive-income-stablecoins/), Base is the path of least resistance.
**Security model:** Optimistic rollup, Stage 1\. Base shares the OP Stack fraud-proof system with Optimism. The sequencer is centralized and operated by Coinbase. Withdrawal window: 7 days to Ethereum mainnet.
**Fee structure:** Base consistently posts the lowest transaction fees among optimistic rollups, averaging $0.05 per transaction. This is because Base follows the EIP-1559 model and allows fees to decline to near-zero when demand is below the gas target. Base blocks appear full compared to target utilization, but that fullness is by design.
**Ecosystem focus:** Consumer applications. Friend.tech, the SocialFi app, launched on Base and drove significant user adoption in 2023-2024\. Base also hosts onchain games, NFT marketplaces, and prediction markets. DeFi depth is growing but still trails Arbitrum.
**Failure mode:** Same as Arbitrum: centralized sequencer. Coinbase operates the sequencer, and if Coinbase infrastructure fails, Base halts. This is a trust assumption in a regulated entity.
**Who it's for:** Coinbase users deploying small to mid-size positions ($100-$5,000) into consumer apps or stablecoin yield strategies. If your capital is already on Coinbase and you need cheap access to L2 DeFi, Base is the most direct route.
## Optimism: The OP Stack and Superchain Vision
Optimism holds roughly $4B in TVL, making it the fourth-largest L2\. But TVL understates Optimism's strategic position. The OP Stack, Optimism's open-source rollup framework, powers Base, World Chain (Worldcoin), and dozens of other L2s. Optimism is not just a network. It is the infrastructure provider for an interconnected web of rollups.
**Security model:** Optimistic rollup, Stage 1\. Identical to Base. Fraud-proof system is permissionless. Sequencer is centralized and operated by the Optimism Foundation. Withdrawal window: 7 days.
**Fee structure:** $0.09 average transaction cost, slightly higher than Base but comparable to Arbitrum. Optimism blocks follow EIP-1559, so fees decline when demand is low.
**Ecosystem focus:** Superchain. Optimism's long-term thesis is that many app-specific L2s will launch using the OP Stack and share liquidity through native [cross-chain bridges](https://altcoininvestor.com/best-crypto-bridges/). If this vision succeeds, Optimism becomes the canonical bridge hub. If it fails, Optimism is a mid-tier L2 with less DeFi depth than Arbitrum and less consumer traction than Base.
Velodrome, Optimism's native DEX, processes significant volume and offers liquidity incentives for OP-denominated pairs. Aave, Uniswap, and Synthetix all have active deployments on Optimism.
**Failure mode:** Centralized sequencer, same as Arbitrum and Base. The Superchain vision also introduces a new risk: if OP Stack rollups fail to gain traction, Optimism's strategic differentiation evaporates.
**Who it's for:** Users who believe the Superchain thesis and want exposure to OP governance. Also: users deploying capital into Velodrome or Synthetix, which have deeper liquidity on Optimism than on other L2s.
## zkSync Era: ZK Proofs with EVM Compatibility
zkSync Era is the largest zero-knowledge rollup by TVL, though it remains at Stage 0 on L2BEAT's decentralization framework. That means the sequencer and proof generation are centralized, and withdrawal processing depends on a multisig controlled by zkSync's core team.
**Security model:** ZK rollup, Stage 0\. zkSync uses SNARKs (Succinct Non-Interactive Arguments of Knowledge) to generate cryptographic proofs of transaction validity. These proofs are posted to Ethereum, where they are verified by a smart contract. The proof system is sound, but the infrastructure is centralized.
zkSync's team has committed to decentralizing the prover network by 2027\. Until that happens, users trust the multisig.
**Fee structure:** $0.07 average transaction cost. ZK rollups have historically been more expensive than optimistic rollups due to the computational cost of proof generation, but post-Dencun (EIP-4844), zkSync's fees have converged with Arbitrum's.
**Ecosystem focus:** EVM-compatible DeFi. zkSync supports Solidity contracts with minimal modification, which makes it easy for existing Ethereum protocols to deploy. SyncSwap, zkSync's native DEX, offers competitive liquidity. Aave, Uniswap, and Yearn are all live on zkSync Era.
**Developer experience:** zkSync is EVM-compatible, meaning if you use MetaMask or a dApp like Uniswap, the experience feels identical to Ethereum. Developers can deploy Solidity contracts without learning a new language.
**Failure mode:** Centralized multisig. If the zkSync team's multisig is compromised, the rollup can be drained. This is a Stage 0 risk that does not exist on Stage 1 optimistic rollups.
**Who it's for:** Users who want ZK rollup security with EVM compatibility and are willing to accept Stage 0 centralization risk in exchange for lower fees and faster finality than Ethereum mainnet.
## Starknet: Cairo, Account Abstraction, and Decentralized Sequencing
Starknet is the only production rollup with a decentralized sequencer. As of early 2026, three sequencers rotate block production, and full decentralization (permissionless sequencer participation) is slated for later in the year. This is a structural advantage over every other L2 on this list.
**Security model:** ZK rollup, Type-4\. Starknet is not EVM-compatible. It runs its own virtual machine and uses Cairo, a custom programming language designed specifically for STARK proofs. STARKs (Scalable Transparent Arguments of Knowledge) do not require a trusted setup, which purists consider a higher form of decentralization than SNARKs.
**Fee structure:** $0.05-$0.19 depending on proof load. Starknet's fees are variable because proof generation cost depends on the complexity of the Cairo programs being executed.
**Ecosystem focus:** Cairo-native applications. Starknet's TVL is under $200M, significantly smaller than Arbitrum or Base. This is not a failure signal. Starknet is built for developers willing to learn Cairo in exchange for access to account abstraction, native randomness, and more expressive smart contract primitives.
Every deployed contract on Starknet is an account. Every account is a smart contract. This enables features like social recovery, gas sponsorship, and multi-signature wallets without third-party contracts.
**Developer experience:** Cairo has a steeper learning curve than Solidity, resembling Rust in syntax and design philosophy. But Cairo allows for computations that are not possible within the EVM structure. If you need on-chain randomness, recursive proofs, or complex cryptographic operations, Starknet is the only production rollup that can run them efficiently.
**Failure mode:** Ecosystem risk. If developers do not adopt Cairo, Starknet remains a technically sound but underutilized rollup. The decentralized sequencer is an advantage only if applications exist to use it.
**Who it's for:** Developers building Cairo-native applications and users who prioritize sequencer decentralization above ecosystem depth. If you need account abstraction or on-chain randomness, Starknet is the only production option.
## Polygon zkEVM: Deprecated as of July 2026
Polygon zkEVM shut down on July 1, 2026\. The sequencer is off, applications stopped working, and wallet balances were snapshotted for claiming on Ethereum. Alchemy retired its Polygon zkEVM endpoints at the same time.
This is worth documenting because it illustrates the failure mode of mid-tier L2s. Polygon zkEVM had sound ZK technology, but it could not sustain ecosystem gravity once liquidity incentives expired. Capital migrated to Arbitrum, Base, and zkSync Era.
Polygon zkEVM also suffered a 10-14 hour outage in March 2024 when an L1 block reorganization caused the L2 synchronizer to produce batches with corrupted timestamps. L1 rejected the batches, halting proof generation entirely. This is a ZK-specific failure mode: if the synchronizer fails, the prover cannot generate valid proofs, and the rollup halts.
**Lesson:** ZK rollups are not immune to infrastructure failure. Synchronizer logic is a single point of failure. And small-TVL rollups that rely on token emissions to retain users will die when emissions stop.
## How to Choose Among Them
The right Layer 2 depends on what you're doing.
**If you need DeFi depth:** Arbitrum. $17B in TVL, the widest protocol selection, and the deepest liquidity pools. If the protocol you need is on Arbitrum, use Arbitrum.
**If you're onboarding from Coinbase:** Base. 1-click deposits, $0.05 average fees, and growing DeFi support. Base is the lowest-friction path from fiat to L2 yield.
**If you believe the Superchain thesis:** Optimism. The OP Stack powers Base, World Chain, and dozens of other rollups. If native cross-chain liquidity becomes the standard, Optimism is the hub.
**If you want ZK proofs with EVM compatibility:** zkSync Era. Stage 0 centralization risk, but lower fees and faster finality than Ethereum mainnet. Ecosystem depth is growing.
**If you prioritize sequencer decentralization:** Starknet. The only production rollup with rotating sequencers. Small TVL, steep learning curve, but structurally more decentralized than every other option.
Do not choose based on fees alone. Post-Dencun, fees across all six networks converged to $0.02-$0.09\. The marginal cost difference does not matter. What matters is whether the applications you need exist on the network and whether the security model matches your risk tolerance.
## What Changes Over Time
Layer 2 infrastructure is not static. Three variables change the ranking over time.
First, sequencer decentralization. Arbitrum, Base, and Optimism all run centralized sequencers. If any of them ship decentralized sequencing, the trust assumption drops and the security model improves. Starknet already did this. The others have not committed to a timeline.
Second, ecosystem depth. Base's TVL grew from $1B to $11.2B in eighteen months. That growth came from Coinbase integration and consumer app adoption. If Base continues to grow, it will eventually match Arbitrum's DeFi depth. If it stalls, it remains a consumer-app L2 with shallow liquidity.
Third, ZK prover throughput. ZK rollups were historically more expensive than optimistic rollups because proof generation consumed significant compute resources. But Linea's prover throughput crossed 70 TPS in Q1 2026, and zkSync's proof costs dropped 40% post-Dencun. If ZK proof generation becomes cheaper, ZK rollups will dominate on both security and cost.
The current ranking is Arbitrum for DeFi, Base for consumer apps, zkSync for ZK with EVM, and Starknet for decentralization. That ranking will change as infrastructure matures.
## The Takeaway
You need a Layer 2 to run income strategies below $10,000 in position size. Ethereum mainnet gas costs make small-balance DeFi uneconomical.
Arbitrum has the liquidity. Base has the Coinbase onramp. zkSync has ZK proofs with EVM. Starknet has decentralized sequencing. The right choice depends on which applications you need and which trust assumptions you accept.
Check [DeFiLlama](https://defillama.com/) for current TVL by protocol and network. Check [L2BEAT](https://l2beat.com/) for security stage and decentralization progress. Do not trust marketing claims. Read the contract state.
The network with the highest APY is not always the best network. The network where the protocol you need has the deepest liquidity is.
## Frequently Asked Questions
### Which Layer 2 network has the lowest transaction fees?
Base averages $0.05 per transaction as of mid-2026, the lowest among major Layer 2 networks. Starknet ranges from $0.05 to $0.19 depending on proof load. zkSync Era averages $0.07, while Arbitrum and Optimism average $0.09\. Post-EIP-4844, all major L2s converged to sub-$0.10 fees, so the cost difference is marginal. Choose based on ecosystem depth and application availability, not fees alone.
### What is the difference between optimistic rollups and ZK rollups?
Optimistic rollups (Arbitrum, Base, Optimism) assume transactions are valid by default and use a 7-day challenge window for fraud proofs. ZK rollups (zkSync, Starknet) generate cryptographic proofs of transaction validity and post them to Ethereum, enabling faster finality. Optimistic rollups currently dominate TVL and ecosystem depth. ZK rollups offer stronger cryptographic security but historically higher fees, though that gap is closing post-Dencun.
### Why does Arbitrum have higher TVL than other Layer 2 networks?
Arbitrum launched earlier and attracted the deepest DeFi ecosystem. It holds $17B in TVL as of mid-2026, concentrated in lending markets (Aave, Compound), DEXs (Uniswap, Camelot), and perpetuals (GMX). Liquidity attracts more liquidity. Protocols deploy where users are, and users go where protocols have the deepest pools. Arbitrum reached critical mass first and maintains ecosystem gravity through network effects.
### Is it safe to bridge assets to Layer 2 networks?
Bridging carries smart contract risk and sequencer trust assumptions. Official bridges (Arbitrum Bridge, Base Bridge) have the strongest security guarantees but enforce 7-day withdrawal windows for optimistic rollups. Third-party bridges like Across and Stargate offer faster withdrawals but introduce additional smart contract risk. Bridges have lost $328M in 2026 alone across all chains. Use official bridges for large amounts and verify contract addresses before transferring.
### Which Layer 2 is best for small DeFi positions under $1,000?
Base or Arbitrum. Base has the lowest fees ($0.05 average) and easiest Coinbase onramp. Arbitrum has deeper DeFi liquidity but slightly higher fees ($0.09 average). For positions under $1,000, the fee difference is $0.40 per round trip, which is negligible. Choose based on where the protocol you need has the most liquidity. Check DeFiLlama for TVL by protocol and network before depositing.
The Weekly Yield Report
You just compared six Layer 2 networks by TVL, fees, and security model. By next quarter, two of those numbers will have shifted by double digits.
Every Thursday: where crypto yield actually is - stablecoins, liquid staking and DeFi lending, with the risk named next to the rate and what changed since last week.
[Get it free every Thursday](#/portal/signup)
Free. No trade calls, no allocations, no hype. Unsubscribe in one click.
### Chainlink Surges 12.0% in 24 Hours After Infosys Deal Selloff
URL: https://altcoininvestor.com/chainlink-surge-12-percent-infosys-whale-buying/
Last updated: 2026-09-25T14:03:18.000Z
## Chainlink Rallies 12.0% Following Infosys Partnership Reversal

Chainlink rose 12.0% in the 24 hours to September 25, 2026, reaching $14.0, per CoinGecko. The move brings the token to a market capitalization of $10.48 billion, ranking it 13th among all cryptocurrencies. The 24-hour gain extends a 19.2% rise over seven days and a 23.6% gain over 30 days, though LINK remains 73.4% below its May 2021 all-time high of $52.7.
The rally came after a sharp reversal. On September 22, 2026, Chainlink announced a partnership with Infosys, the $40 billion IT services provider whose digital banking platform supports 1.7 billion customer accounts worldwide. LINK fell 4.4% within 24 hours of the news, according to reports from Yahoo Finance and CoinMarketCap dated September 24, 2026\. The announcement named six Chainlink products that Infosys plans to standardize but specified no participating banks, no implementation timeline, and no fee structure tying the token to the deal.
By September 25, 2026, the direction had reversed. InteractiveCrypto reported that LINK surged 14.09% to $13.92 on September 25, 2026, driven by $13 million in ETF inflows and $120 million in whale accumulation. The same source noted 24-hour trading volume of $880.7 million, representing 8.46% of LINK's $10.4 billion market cap as of that date. The rebound suggests institutional buyers stepped in after retail traders sold the Infosys news.
## What Actually Happened and Why the Market Sold First

The Infosys partnership is a software standardization agreement, not a confirmed deployment. Infosys will integrate six Chainlink services into its Finacle banking platform, including the Cross-Chain Interoperability Protocol for token transfers and Proof of Reserve for asset verification. The announcement framed access to 1.7 billion accounts but named no bank, no launch date, and no commercial terms.
On-chain data showed muted response. Santiment recorded 1,344 new LINK addresses on September 22, 2026, down from 1,556 the day before and below the September average, per reports dated September 23 to September 24, 2026\. The Infosys deal creates a distribution channel but not immediate adoption, and Chainlink's Payment Abstraction system allows institutions to pay fees in fiat or stablecoins without holding LINK, per multiple reports from U.Today and CryptoTicker dated September 23 to September 24, 2026.
The September 25, 2026 rally followed two simultaneous developments. On September 24, 2026, Hamco launched a tokenized Pan-Asia private equity fund using Chainlink's CCIP, and Paxos Labs introduced a gold-backed token using the same protocol, per CoinMarketCap. On the same day, Circle's institutional blockchain Arc, which launched its public mainnet on September 16, 2026, with Chainlink as its official oracle partner, saw founding validators including BlackRock, DTCC, and Visa go live, per CoinMarketCap dated September 2026.
The buying pressure came from institutional wallets, not retail addresses. The reversal appears driven by whale accumulation and ETF inflows rather than new protocol developments or changes to staking yields.
## The Infosys Deal Does Not Change LINK Staking Yields
Chainlink's staking mechanism offers yield to token holders who lock LINK to secure oracle services. The current staking version, v0.2, launched in November 2023 with a pool cap of 45 million LINK and a baseline community staking reward of approximately 4.75% per year, per Chainlink's official blog dated December 2022 and November 2023\. The Infosys partnership does not alter the staking pool size, the reward rate, or the unbonding period.
For holders earning from LINK, the Infosys deal is a future distribution channel, not a current income event. Standardization at a software supplier is a precondition for adoption, not evidence of it, per CryptoTicker dated September 24, 2026\. The next material signal would be a named bank with a production launch date or a fee structure that routes institutional payments through LINK token demand.
The Arc mainnet launch on September 16, 2026, represents a stronger income signal. Chainlink Data Streams went live on Arc on September 15, 2026, and CCIP followed on September 16, 2026, providing real-time price data and cross-chain transfers for tokenized real-world assets, per CoinMarketCap. The DTCC, the world's largest securities clearinghouse, selected Chainlink in May 2026 to build a collateral management system with a targeted launch in Q4 2026, per the same source. Those integrations could generate recurring service demand paid in fees, a portion of which may flow to stakers under future reward structures.
### What 12.0% in 24 Hours Means for Positioning Risk
A 12.0% move in one day signals crowded positioning. When price rises faster than adoption metrics, the gap is usually leverage. Fast moves attract fast exits. The September 22, 2026 Infosys announcement triggered a 4.4% drop within 24 hours because traders sold when the details disappointed. The September 25, 2026 rally of 14.09% came on whale buying, which can reverse as quickly as it arrived.
For the move to hold, the Infosys partnership would need to produce a named bank deployment with a launch date, or the DTCC collateral system would need to go live in Q4 2026 as planned, or a fee structure would need to emerge that ties institutional Chainlink usage to LINK token demand. Without one of those, the rally is a positioning event, not a fundamental repricing.
If any of those catalysts fail to materialize, or if whale wallets reverse their September 25, 2026 accumulation, LINK could retrace the 12.0% gain as fast as it posted it. Liquidation risk rises with speed. A token that moves 12.0% up in 24 hours on institutional buying can move 12.0% down in 24 hours if those same wallets sell.
## What the Rally Does Not Mean for Staking Income
A 12.0% price move does not mean staking yields have changed. Chainlink staking pays approximately 4.75% per year in LINK, and that rate is set by protocol parameters, not by price. A holder who staked 1,000 LINK on September 24, 2026 at $12.5 and woke up on September 25, 2026 to see $14.0 did not earn 12.0% in staking rewards. They earned 12.0% in price appreciation, which can reverse, and they continue to earn 4.75% annually in staking rewards, which does not change unless the protocol upgrades.
The Infosys partnership could eventually increase demand for Chainlink services, which could eventually increase the fees collected by the protocol, which could eventually increase the reward pool for stakers. That chain is three steps long, and none of the steps have happened yet. The September 22, 2026 announcement was step zero: standardization at a software vendor. Step one would be a bank going live. Step two would be measurable fee volume. Step three would be a protocol upgrade that routes those fees to stakers.
The Arc mainnet and the DTCC collateral system are further along that chain. Arc went live on September 16, 2026 with Chainlink as infrastructure, and DTCC selected Chainlink in May 2026 with a Q4 2026 target. Those are production deployments, not framework agreements. If either generates material fee volume, and if a future staking upgrade routes a portion of those fees to LINK stakers, the income case strengthens. Until then, staking yields remain where they were on September 21, 2026, before the Infosys news broke.
### The Specific Risk That Would Break This Move
The move breaks if the Q4 2026 DTCC launch does not happen, or if it launches but generates no material fee volume, or if Infosys fails to name a bank deployment within the next two quarters. The move also breaks if whale wallets reverse their September 25, 2026 buying, which on-chain records show totaled approximately $120 million.
Another risk is comparison to other oracle protocols. Chainlink's staking yield of approximately 4.75% per year is fixed by the v0.2 protocol, which launched in November 2023\. If a competing oracle network launches a staking mechanism with higher yields and comparable security, LINK holders may rotate capital. The September 25, 2026 rally came from whale buying, not from stakers locking tokens for yield, which means the capital that drove the move can exit as quickly as it entered.
The Charles Schwab listing that drove LINK from approximately $8.30 to nearly $12.50 in late August and early September 2026, per CryptoNews dated September 2026, gave retail investors direct access to LINK through a major U.S. brokerage. That event increased the buyer base, which supports price. The Infosys deal does not increase the buyer base; it increases the potential distribution channel for enterprise adoption, which is a different variable. If Schwab buyers decide the Infosys news was priced in and sell, the September 25, 2026 rally reverses.
## Who This Move Matters For and Who It Does Not
This move matters for holders deciding whether the September 22, 2026 Infosys partnership changes the staking case for LINK. It does not. The partnership is a software standardization agreement without a named bank, a timeline, or a fee structure. The on-chain data from September 22, 2026 showed new address creation below the daily average, and Chainlink's Payment Abstraction system allows institutions to use the protocol without holding LINK.
The move matters more for holders watching the Arc mainnet and the DTCC collateral system. Arc went live on September 16, 2026 with Chainlink as the official oracle and cross-chain infrastructure, and DTCC targeted Q4 2026 for its collateral platform. Those are production deployments with named institutions and public timelines. If either generates fee volume and if a future protocol upgrade routes fees to stakers, the income case improves.
The move does not matter for holders who base allocation on staking yield. Chainlink's staking reward rate of approximately 4.75% per year in LINK has not changed. The v0.2 staking pool holds 45 million LINK with a maximum of 15,000 LINK per wallet, per Chainlink's official documentation dated November 2023\. The Infosys partnership does not expand the pool, raise the yield, or shorten the unbonding period.
The move also does not matter for holders who are comparing LINK to other income-generating crypto assets. A 12.0% gain in 24 hours is price volatility, not yield. Staking yields are measured in annual percentage rates, and those rates are set by protocol parameters. A holder choosing between LINK staking at 4.75% and another protocol offering 6.0% should compare the two rates, the security of each staking mechanism, and the likelihood that each protocol will generate fees that increase future rewards. The September 25, 2026 price move does not change any of those variables.
You have just seen a 12.0% rally reverse a 4.4% selloff, both driven by the same partnership announcement. The pattern will repeat the next time a deal names a number but not a date.
The Weekly Yield Report
You have just seen a 12.0% rally reverse a 4.4% selloff, both driven by the same partnership announcement. The pattern will repeat the next time a deal names a number but not a date.
Every Thursday: where crypto yield actually is - stablecoins, liquid staking and DeFi lending, with the risk named next to the rate and what changed since last week.
[Get it free every Thursday](#/portal/signup)
Free. No trade calls, no allocations, no hype. Unsubscribe in one click.
### Bitget's $351.6M Backend Breach and What It Means for DeFi
URL: https://altcoininvestor.com/bitget-backend-breach-defi-counterparty-risk/
Last updated: 2026-09-28T18:00:05.000Z
## The Attack Vector: Spoofed Transfer Data, Not Stolen Keys

Bitget confirmed a $351.6 million hot and warm wallet breach detected at 18:31 UTC on September 24, 2026\. CEO Gracy Chen stated that private key compromise has been ruled out. The attackers spoofed transfer data through a breached backend system.
This is a different failure mode than most exchange hacks.
When an attacker steals private keys, the breach point is cryptographic. The wallet's security model breaks. When an attacker spoofs backend transfer data, the breach point is in the authorization layer above the keys. The backend system tells the wallet to execute a legitimate-looking transfer. The wallet complies. The keys themselves never leave secure storage.
More than $170 million in assets were moved and swapped into ETH during the attack. The swaps indicate the attackers needed liquidity in a single asset for exit purposes. ETH provides deep liquidity across centralized and decentralized venues.
CryptoSlate calculated that Bitget's losses would lift September's reported total above $684 million, overtaking April as the costliest month of 2026\. The breach ranks among the largest confirmed exchange security incidents this year.
## The Immediate Consequence: Frozen Withdrawals and Counterparty Risk

Withdrawals remain frozen across the platform while the investigation proceeds.
This creates immediate counterparty risk for any user holding assets on Bitget, including users who were not directly affected by the breach. You cannot move your funds. You cannot deploy them. You cannot exit your position. The exchange controls access.
For [DeFi protocol](https://altcoininvestor.com/best-defi-protocols/) users, this is the exact scenario that self-custody is designed to prevent. If your assets sit in your own wallet, no one can freeze your withdrawals. If your assets sit on an exchange, you are exposed to the exchange's operational and security decisions, even when your specific funds were not part of the breach.
Bitget's User Protection Fund holds more than $464 million. The exchange also holds over $1 billion in proprietary capital. These reserves exceed the breach amount. The firm has stated it intends to cover the loss.
But coverage and access are separate issues.
Coverage means the exchange will make you whole eventually. Access means you can use your funds now. During the frozen withdrawal period, you have coverage claims but no access. If you were planning to deploy those funds into a time-sensitive yield opportunity, you miss the window. If you were planning to exit a position before a market move, you cannot.
## Backend System Compromise as an Evolving Threat Vector

The spoofed backend transfer method represents an evolving threat vector against centralized infrastructure. It targets the authorization layer between the user interface and the on-chain execution layer.
In a traditional private key compromise, the attacker must extract the key material from secure storage. Hardware security modules, multi-party computation setups, and cold storage all make this harder. These defenses work. They raise the cost of the attack.
In a backend compromise, the attacker bypasses those defenses. The keys stay secure. The attacker convinces the backend system to issue a transfer order that looks legitimate to the wallet. The wallet signs it. The transaction executes.
This is a higher-level exploit. It does not break the cryptography. It breaks the trust model between the backend system and the wallet infrastructure.
For centralized exchanges, this threat vector is harder to defend against than key theft. Key theft has a known set of mitigations: hardware security modules, cold storage, multi-signature schemes, threshold cryptography. Backend compromise requires securing every component that has the authority to issue transfer orders. That includes internal APIs, admin panels, database access, and any service that can trigger a wallet operation.
The attack surface is larger.
## What This Means for DeFi Users Who Keep CEX Balances
Many DeFi users keep balances on centralized exchanges for specific purposes: fiat on-ramps, liquidity access, stablecoin purchases, or arbitrage positions. The Bitget breach clarifies the risk profile of that strategy.
When you hold assets on an exchange, you are exposed to:
- Private key compromise (traditional exchange hack risk)
- Backend system compromise (the Bitget scenario)
- Regulatory freeze (government-ordered asset seizure or withdrawal restrictions)
- Liquidity crisis (the exchange becomes insolvent and cannot meet withdrawal requests)
- Operational freeze (the exchange halts withdrawals during an investigation, even if your funds are safe)
The last risk is what Bitget users are experiencing now. Their funds may be fully covered. They still cannot access them.
For someone using a centralized exchange as a temporary holding point before deploying into DeFi, this is the failure mode to plan for. The exchange may freeze withdrawals at any time, for reasons unrelated to your specific account. If you were planning to move $10,000 to [a self-custody wallet](https://altcoininvestor.com/hot-wallet-vs-cold-wallet/) and then into a yield opportunity, and the exchange freezes withdrawals the day before you planned to move, you miss the opportunity.
The mitigation is simple: minimize exchange exposure time. Buy your stablecoins, move them to self-custody immediately, then deploy. Do not leave assets on the exchange waiting for the right moment to deploy. The right moment may arrive during a withdrawal freeze.
## How to Verify Exchange Security Posture Before Depositing
Most exchange security reviews focus on historical breach data and insurance fund balances. Those matter. But the Bitget breach exposes a different dimension: backend system security.
Here is what you can check before depositing funds on a centralized exchange:
**Proof of reserves.** Does the exchange publish on-chain proof of reserves? Can you verify that the exchange controls the wallet addresses it claims to control? If the exchange does not publish verifiable proof of reserves, you cannot confirm that it holds the assets it claims to hold.
**Insurance fund size relative to hot wallet exposure.** How much of the exchange's total assets are held in hot wallets versus cold storage? What percentage of the hot wallet balance does the insurance fund cover? Bitget's $464 million User Protection Fund covered the $351.6 million breach. That is 137% coverage. An exchange with a $100 million insurance fund and $500 million in hot wallets has 20% coverage. If the hot wallets are fully drained, the insurance fund covers one-fifth of the loss.
**Withdrawal processing time.** How long does the exchange take to process a withdrawal under normal conditions? Exchanges that batch withdrawals once or twice per day have longer operational risk windows than exchanges that process withdrawals in real time. If you need to exit quickly, a 12-hour withdrawal batch cycle is a 12-hour window where you are exposed to exchange operational risk.
**Historical response to security incidents.** How has the exchange handled prior breaches or operational issues? Did it freeze withdrawals? For how long? Did it make users whole? How transparent was the communication during the incident?
These checks do not eliminate counterparty risk. They clarify the magnitude of the risk you are accepting when you deposit funds.
## The Income Angle: CEX Yield Products and Frozen Withdrawal Risk
Some centralized exchanges offer yield products: staking services, lending programs, or liquidity provision pools. These products pay interest on deposited assets. The yield comes from the exchange's use of your assets, usually for lending to margin traders or staking on proof-of-stake networks.
When you deposit into a CEX yield product, you add another layer of counterparty risk on top of the base exchange risk.
If the exchange freezes withdrawals due to a security breach, you cannot withdraw your principal or your accrued yield. If the breach drains the exchange's reserves, your yield claim becomes an unsecured creditor claim in a potential bankruptcy proceeding. If the exchange's lending book becomes insolvent because borrowers default during a market crash, your deposited assets may not be fully recoverable.
The risk-adjusted return on CEX yield products must account for these failure modes. A 5% APY on deposited stablecoins is not comparable to a 5% APY in a [DeFi lending protocol](https://altcoininvestor.com/best-crypto-wallet-for-defi/) where you control the keys. The DeFi protocol has smart contract risk and oracle risk. The CEX product has smart contract risk (if the exchange uses DeFi infrastructure under the hood), oracle risk, backend security risk, liquidity risk, and regulatory risk.
The DeFi option has fewer points of failure.
For users deploying capital into income-generating strategies, the Bitget breach is a reminder: centralized exchange yield products carry counterparty risk that can freeze your capital at any time, regardless of the product's stated terms. If the exchange halts withdrawals, your yield accrues but you cannot access it. If the freeze lasts weeks or months, you miss other opportunities.
## What to Check Now If You Hold Funds on Bitget
If you currently hold funds on Bitget, here is what you can verify:
**Asset coverage status.** Bitget has stated that its User Protection Fund and proprietary capital exceed the breach amount. Monitor official communications from the exchange for updates on the timeline for withdrawal resumption. The exchange's public statements are your primary source of information during the freeze.
**Proof of reserves updates.** If Bitget publishes updated proof of reserves after the breach, verify that the on-chain wallet balances still match the claimed reserves. A gap between claimed reserves and on-chain balances would indicate that the breach was larger than disclosed or that additional funds have been moved.
**Alternative exit routes.** Some exchanges allow internal transfers between users even when withdrawals are frozen. If you know another Bitget user who can receive your funds and withdraw them on your behalf once the freeze lifts, that may provide faster access. This is not a substitute for self-custody, but it may reduce the duration of your frozen capital.
**Communication from the exchange.** Bitget's response time and transparency during this incident will tell you whether the exchange is a reliable counterparty for future use. Exchanges that communicate clearly, provide regular updates, and resume withdrawals quickly demonstrate better operational resilience than exchanges that go silent or extend freezes indefinitely.
If you do not hold funds on Bitget but use other centralized exchanges for DeFi on-ramps or stablecoin purchases, the same checks apply. Proof of reserves, insurance fund size, and historical incident response are the three factors that determine how much risk you accept when you deposit.
## The Takeaway
Bitget's $351.6 million breach happened through backend system compromise, not private key theft. This is a different attack vector with a larger surface area. Withdrawals remain frozen, creating immediate counterparty risk for all users on the platform, not just those whose funds were stolen.
The breach clarifies the risk profile of holding assets on centralized exchanges, even temporarily. If you plan to move funds from an exchange to a [self-custody wallet](https://altcoininvestor.com/crypto-wallet/) and deploy them into a yield opportunity, minimize the time between deposit and withdrawal. A frozen withdrawal window can last days or weeks, and you cannot access your capital during that period, regardless of whether the exchange has sufficient reserves to cover the loss.
Backend security is harder to verify than cold storage practices. Check proof of reserves, insurance fund coverage relative to hot wallet size, and historical incident response before depositing. Those three factors determine how much risk you are accepting.
For income strategies, centralized exchange yield products carry layered counterparty risk that DeFi alternatives do not. A 5% APY with frozen withdrawal risk is not the same as a 5% APY in a protocol where you control the keys. The failure modes are different.
## Frequently Asked Questions
### How is the Bitget breach different from a typical exchange hack?
Most exchange hacks involve stolen private keys. The Bitget breach involved spoofed backend transfer data. The attackers compromised the authorization layer that tells wallets to execute transfers, not the cryptographic keys themselves. The wallet signed legitimate-looking transactions because the backend system was compromised. This is a higher-level exploit with a larger attack surface than traditional key theft.
### Can Bitget users access their funds right now?
No. Bitget froze all withdrawals on September 24, 2026, following the breach. The freeze remains in effect while the investigation proceeds. Users cannot move funds off the platform, even if their specific assets were not part of the breach. Bitget has stated it has sufficient reserves to cover the loss, but coverage and access are separate. Users have coverage claims but no current access to their capital.
### What should I check before depositing funds on a centralized exchange?
Check three things: proof of reserves (can you verify on-chain that the exchange controls the wallets it claims?), insurance fund size relative to hot wallet exposure (what percentage of hot wallet risk does the insurance fund cover?), and historical incident response (how has the exchange handled prior breaches or operational issues?). These checks clarify the magnitude of counterparty risk you accept when depositing.
### Are centralized exchange yield products safe after this breach?
CEX yield products carry layered counterparty risk: backend security risk, liquidity risk, regulatory risk, and the base exchange operational risk. When an exchange freezes withdrawals, you cannot access your principal or accrued yield, regardless of the product's stated terms. A 5% APY with frozen withdrawal risk is not comparable to a 5% APY in a DeFi protocol where you control the keys. The failure modes are structurally different.
### How long will Bitget withdrawals remain frozen?
Bitget has not provided a specific timeline for withdrawal resumption. Freezes typically last from several days to several weeks, depending on investigation complexity and coordination with law enforcement. Monitor official communications from Bitget for updates. If you hold funds on the platform, you cannot plan deployment timelines until the freeze lifts. This is the operational risk of centralized custody.
Tool mentioned above
Ledger
Ledger devices display the full transaction on their own screen before you approve it, which is what stops an approval exploit at the point it matters.
[See Ledger devices](https://shop.ledger.com/?r=90612ff43561)
We may earn a commission if you sign up through this link, at no cost to you. It does not change what gets recommended.
The Weekly Yield Report
You have just read a decomposition of backend breach mechanics and five exchange security checks. Next month's breach will test different infrastructure, but the verification process remains the same.
Every Thursday: where crypto yield actually is - stablecoins, liquid staking and DeFi lending, with the risk named next to the rate and what changed since last week.
[Get it free every Thursday](#/portal/signup)
Free. No trade calls, no allocations, no hype. Unsubscribe in one click.
### Grant Programs And Retroactive Funding: Earning As A Contributor
URL: https://altcoininvestor.com/crypto-grants-retroactive-funding/
Last updated: 2026-09-25T00:07:22.000Z
## What Crypto Grants Actually Pay

Optimism RetroPGF Round 3 distributed 30 million OP tokens across 501 contributors. When OP traded between $2 and $4, the median recipient earned roughly $60,000 for work already completed. No vesting schedule. No milestone negotiations. No equity dilution.
Arbitrum DAO grants operate on a different model. Foundation grants typically range from $20,000 to $150,000 in ARB tokens, paid in tranches tied to milestones. One documented case study shows a perpetuals protocol that received $1.5 million in ARB to build on Arbitrum's infrastructure.
The Ethereum Foundation distributed $32.6 million in grants during the first quarter of 2025 alone. In 2024, it supported 105 projects with approximately $3 million total. The 2025 Academic Grants Round allocated up to $1.5 million across selected research initiatives.
These are not speculative token allocations for future promises. They are non-dilutive payments for demonstrable contributions to public infrastructure, developer tooling, community education, or ecosystem growth.
## Two Models: Retroactive Versus Milestone-Based

Retroactive public goods funding works backward. You build something useful, document the impact, then apply for funding based on what you already delivered. Optimism pioneered this model at scale. Badgeholders (a curated group of ecosystem experts) evaluate completed work and vote on allocations. No promises. No pitch decks. Just evidence.
This structure solves a problem familiar from traditional venture capital: funding based on narrative rather than results. In TradFi, you would never pay a contractor the full amount before seeing the deliverable. Retroactive funding applies that logic to public goods.
Milestone-based grants function more like traditional contracts. You submit a proposal with specific deliverables, timelines, and budget requests. If approved, funds are disbursed in stages as you hit predefined milestones. Arbitrum Foundation grants and many Ethereum Foundation programs follow this structure.
Both models share one characteristic: they are non-repayable and non-dilutive. You do not give up equity. You do not owe the money back if the project fails. But you do assume token price risk, since grants are typically paid in the ecosystem's native token, not stablecoins.
### Why Retroactive Funding Exists
Public goods produce value that benefits many people but is difficult to monetize directly. Developer documentation, open-source libraries, security audits, and educational content all fall into this category. A well-maintained Ethereum client benefits the entire ecosystem, but the maintainer cannot charge transaction fees.
Retroactive funding addresses this by treating impact as the product. You build the tooling, gather usage data, then present that data to funders. If the data shows meaningful ecosystem adoption, you get paid. It is closer to performance-based compensation than speculative investment.
## How To Qualify: Evaluation Criteria That Matter

Grant programs publish public criteria, but the weighting is subjective. Badgeholder voting in Optimism's RetroPGF relies on qualitative assessment as much as quantitative metrics. Arbitrum Foundation grants emphasize technical feasibility and team capability. Ethereum Foundation programs prioritize alignment with long-term protocol development goals.
Across all programs, five categories consistently influence funding decisions.
### Onchain Activity and User Retention
If you built a tool, how many people use it? How often? Do they come back? Programs measure this through transaction volume, unique wallet addresses, repeat usage rates, and time-series data showing growth or stagnation.
A dashboard that logged 500 transactions in its first month, then dropped to 50 the next month, signals weak product-market fit. A library integrated by 20 protocols with consistent weekly commits shows sustained demand.
User retention matters more than vanity metrics. A project that attracted 10,000 users via airdrop incentives but retained only 200 after rewards ended will score lower than one with 500 organic, recurring users.
### Developer Contributions and Code Quality
Open-source contributions are trackable. Programs review GitHub activity: commit frequency, code review participation, issue resolution, documentation quality, and integration by other projects. A library with 50 stars and 2 forks is less compelling than one with 300 stars, 40 forks, and active pull requests from external contributors.
Code quality matters as much as quantity. Readable documentation, test coverage, and security audit history all strengthen an application. If your contribution requires other developers to reverse-engineer functionality, evaluators notice.
### Ecosystem Composability
Does your work integrate with existing infrastructure? A new wallet interface that only supports one protocol has limited impact. A gas optimization library that works across multiple Ethereum clients has broader utility.
Composability signals durability. Projects that become dependencies for other teams generate compounding value. If five other grant recipients cite your tooling as foundational to their work, your next application becomes significantly stronger.
### Community and Educational Impact
Not all valuable contributions are code. Educational content, community management, onboarding documentation, and localization work all qualify. Optimism RetroPGF Round 3 funded builders, writers, creators, and educators alongside protocol developers.
Evaluation here is harder to quantify. Programs look for content that reduced friction: tutorials that lowered the learning curve, forums that answered recurring questions, or translation work that expanded geographic reach. If you wrote a guide that 5,000 developers referenced while building on the ecosystem, that is measurable impact.
### Sustainability Without Ongoing Subsidies
Can your project survive without continuous grant funding? Programs want to fund work that becomes self-sustaining or generates follow-on contributions, not create dependencies on perpetual subsidies.
A developer tool that attracts paid contributors or a community initiative that transitions to DAO governance demonstrates long-term viability. A project that requires a new grant every quarter to stay operational raises concerns about structural sustainability.
## The Application Process: What Actually Happens
Each program has distinct submission requirements, but the underlying evaluation flow is similar. Understanding the structure helps you prepare evidence before you apply.
### Step 1: Document Completed Work (Retroactive) or Build a Proposal (Milestone-Based)
For retroactive programs like Optimism RetroPGF, you submit a portfolio of completed work. Include links to deployed contracts, GitHub repositories, published content, or usage dashboards. Quantify impact wherever possible: transaction counts, active users, protocol integrations, or community engagement metrics.
For milestone-based grants like Arbitrum Foundation programs, you submit a detailed proposal. Specify what you will build, why it matters to the ecosystem, what resources you need, and what deliverables you will produce at each milestone. Include a timeline and budget breakdown denominated in the ecosystem's native token.
Both formats require evidence of credibility. Past contributions, technical track records, public repositories, or previous successful deliveries all strengthen your case.
### Step 2: Due Diligence and Technical Review
Programs conduct technical reviews, especially for milestone-based grants. Expect questions about architecture, security, scalability, and team composition. Some programs require video interviews or detailed technical documentation before advancing to the voting phase.
This is where weak proposals fail. If your technical plan is vague, your budget is inflated relative to deliverables, or your team lacks demonstrable expertise, evaluators will notice. Specificity matters. "We will build a better DEX" is insufficient. "We will implement an AMM with concentrated liquidity and integrate Chainlink price feeds for reduced slippage on long-tail assets" is specific.
### Step 3: Badgeholder or Committee Voting
In Optimism's model, badgeholders vote on allocations after reviewing all submissions. Voting is public, and allocations are determined by consensus weighting. Some badgeholders prioritize developer tooling, others emphasize education or community work. You cannot predict individual preferences, but you can ensure your submission provides clear evidence across multiple impact categories.
Milestone-based programs use committee review instead. A smaller group of ecosystem experts evaluates proposals based on strategic alignment, technical feasibility, and budget efficiency. Decisions are less transparent than badgeholder voting, but programs typically publish high-level rationales for funded projects.
### Step 4: Disbursement and Reporting Requirements
Retroactive grants are typically paid as a single lump sum in the ecosystem's native token. No vesting. No clawback. You receive the allocation and can sell immediately if you choose, though that decision carries reputational cost within the ecosystem.
Milestone-based grants are disbursed in tranches. You receive the first installment upon approval, subsequent payments upon milestone completion. Programs require progress updates: technical documentation, public dashboards, or blog posts demonstrating advancement. If you miss milestones without explanation, future tranches may be withheld.
Reporting varies by program. Ethereum Foundation grants typically require quarterly updates. Arbitrum programs may request onchain activity data or integration reports. Optimism's continuous reward model (launched in 2025) shifts from discrete rounds to ongoing impact measurement, meaning reporting becomes more frequent but less formal.
## Failure Modes You Need To Understand
Grant programs are not free money. They come with structural risks that most contributors underestimate.
### Token Price Volatility
You receive grants in the ecosystem's native token, not stablecoins. If you are awarded $100,000 worth of ARB and the token drops 40% before you can sell, you netted $60,000\. Some programs prohibit immediate sales to prevent price pressure, creating forced holding periods that amplify volatility risk.
If you depend on grant income to cover operating costs, you need a hedging strategy. Some contributors sell a portion immediately to cover fixed expenses, hold the remainder for long-term alignment. Others negotiate stablecoin payments for specific cost categories, though most programs resist this.
### Follow-On Funding Is Not Guaranteed
Over half of funded projects struggle to secure follow-on grants. A large allocation in one round does not predict future funding. Ecosystem priorities shift. Evaluation criteria evolve. New contributors enter the pool. If your project requires multi-year funding to reach sustainability, one-time retroactive grants are insufficient.
You saw this dynamic in Filecoin's RetroPGF program. Round 1 distributed 200,000 FIL. Round 3 distributed 585,000 FIL. But individual project allocations varied significantly between rounds. A project funded in Round 1 might receive nothing in Round 2 if badgeholder priorities shifted toward different impact categories.
### Attribution and Impact Measurement Are Subjective
How do you prove your documentation improved onboarding? How do you isolate the effect of your educational content from broader ecosystem growth? Attribution is hard, and evaluators know it.
If ten projects contribute to a 50% increase in protocol usage, allocating credit becomes subjective. Badgeholders rely on qualitative judgment as much as data. This creates variance: two identical contributions might receive different allocations depending on which badgeholders reviewed them and what narrative resonated.
You cannot eliminate this risk. You can reduce it by quantifying impact wherever possible and providing direct evidence (testimonials from other developers, integration data, usage analytics) rather than relying on correlation.
### Geographic and Regulatory Constraints
Most programs require KYC (Know Your Customer) or KYB (Know Your Business) verification. If you cannot pass compliance checks due to jurisdiction, prior sanctions exposure, or identity verification issues, you will not receive funding even if your contribution is strong.
Some contributors use entity structures (DAOs, foundations, offshore entities) to navigate this, but that introduces legal and tax complexity. If you are building as an individual in a restricted jurisdiction, check eligibility requirements before investing months of work.
## Multi-Round Income Potential
The largest contributors earn across multiple rounds and multiple ecosystems. If you build credibility in one program, your subsequent applications start with stronger evidence.
A developer who received $40,000 in Optimism RetroPGF Round 2, then continued contributing and received $80,000 in Round 3, has demonstrated sustained impact. That track record strengthens applications to Arbitrum, Ethereum Foundation, or smaller ecosystem programs.
The shift toward continuous reward models (Optimism's 2025 framework) changes this dynamic. Instead of discrete annual rounds, contributors receive ongoing evaluation and regular disbursements. If your work generates consistent onchain usage, you could earn quarterly or monthly rather than waiting for the next funding cycle.
This model resembles recurring revenue more than one-time contracts. If you treat grants as a primary income source, continuous models reduce cash flow volatility and allow better financial planning.
## What To Do Next
If you want to earn through grants, start by contributing before you apply. Retroactive programs fund past work, not future promises. Build something useful, gather evidence of adoption, then submit.
Choose an ecosystem where your skills align with stated priorities. Optimism emphasizes public goods and ecosystem tooling. Arbitrum funds protocol development and DeFi infrastructure. Ethereum Foundation prioritizes core protocol research and long-term scalability. Read past funding announcements to understand what gets funded.
Track your impact as you build. If you are writing educational content, monitor page views and referral sources. If you are developing open-source tooling, track GitHub stars, forks, and downstream integrations. If you are building onchain infrastructure, monitor transaction volume and unique users. You will need this data when you apply.
Do not wait for the perfect project. The strongest applications come from contributors who built something small, saw adoption, then iterated. A well-documented prototype with 100 active users is more fundable than a grand vision with no deployed code.
Understand the [fee structures and costs](https://altcoininvestor.com/compare-crypto-platform-fees/) of receiving and managing token grants. Gas fees, exchange withdrawal minimums, and conversion costs all reduce your net income. If you receive a $50,000 grant in a low-liquidity token, selling without slippage requires planning.
Consider [tax reporting requirements](https://altcoininvestor.com/koinly-review/) before you apply. Grant income is taxable in most jurisdictions, and token-denominated grants create cost basis tracking complexity. If you receive 20,000 tokens worth $50,000 at receipt, then sell six months later for $35,000, you have a taxable event at receipt and a capital loss at sale. Document everything.
If you are serious about contributor income, treat it like a business. Budget for token volatility. Diversify across multiple ecosystems. Build public credibility through open-source contributions and documentation. And recognize that the best-funded contributors are those who built infrastructure other developers depend on, not those who wrote the best grant application.
## The Takeaway
The largest difference between grant income and other crypto earning strategies is this: you get paid for work that benefits many people but monetizes poorly through traditional business models. If you can build developer tooling, write clear documentation, or create educational resources that lower ecosystem friction, grants convert that public value into direct income. But only if you document impact quantitatively, apply to ecosystems where your work aligns with stated priorities, and structure your finances to handle token volatility. The contributors earning $60,000 to $150,000+ annually through this route are not the ones who write the best proposals. They are the ones who built something other people use, then applied after the usage data proved it.
## Frequently Asked Questions
### How much can you realistically earn from crypto grants?
Optimism RetroPGF Round 3 paid roughly $60,000 median per recipient across 501 contributors. Arbitrum Foundation grants range from $20,000 to $150,000 for milestone-based projects, with documented cases reaching $1.5 million for larger infrastructure work. Ethereum Foundation distributed $32.6 million in Q1 2025 alone. Earnings depend on impact evidence, ecosystem alignment, and token price volatility at disbursement.
### What is the difference between retroactive and milestone-based grants?
Retroactive grants like Optimism RetroPGF fund completed work. You build first, document impact, then apply. Payment is a lump sum with no vesting. Milestone-based grants like Arbitrum Foundation programs fund future work in tranches tied to deliverables. You submit a proposal, get approved, then receive payments as you hit predefined milestones. Retroactive eliminates promises; milestone-based requires ongoing reporting.
### Do you need to be a developer to receive crypto grants?
No. Optimism RetroPGF Round 3 funded builders, writers, creators, educators, and community contributors. Educational content, onboarding documentation, community management, and localization work all qualify if they demonstrate measurable ecosystem impact. Ethereum Foundation and Arbitrum also fund non-code contributions. Evidence of adoption matters more than technical skill, though developer tooling and infrastructure receive the largest allocations.
### How do grant programs measure impact for non-code contributions?
Programs track content views, tutorial completion rates, community engagement metrics, and downstream adoption. If you wrote documentation that 5,000 developers referenced, that is quantifiable. If you translated materials that expanded geographic reach, programs measure new user onboarding from those regions. Attribution is subjective, so direct evidence (testimonials, integration reports, usage analytics) strengthens applications more than correlation.
### What happens if the token price drops after you receive a grant?
You bear the price risk. Grants are paid in ecosystem native tokens, not stablecoins. If you receive $100,000 worth of ARB and it drops 40% before you sell, you net $60,000\. Some programs discourage immediate sales, creating forced holding periods. Contributors typically sell a portion to cover fixed costs, hold the remainder for alignment. Hedging strategies or stablecoin negotiation are options, though most programs resist the latter.
The Weekly Yield Report
You just reviewed five ecosystems distributing $30M to $1.5M per program, with specific qualification criteria and application processes. Those allocations and priorities shift every quarter.
Every Thursday: where crypto yield actually is - stablecoins, liquid staking and DeFi lending, with the risk named next to the rate and what changed since last week.
[Get it free every Thursday](#/portal/signup)
Free. No trade calls, no allocations, no hype. Unsubscribe in one click.
### Usual USD0 Rate Jump From 3.56% To 6.06%: Real Or Incentive?
URL: https://altcoininvestor.com/usual-usd0-apy-increase-real/
Last updated: 2026-09-24T23:07:21.000Z
## The Question: Is This Yield From Treasury Bills Or Token Printing?
Usual's USD0 stablecoin rate moved from 3.56% to 6.06% between Q1 and Q3 2026\. That's a 2.5 percentage point increase applied to $503 million in TVL. A $400,000 allocation now earns $10,000 more annually at 6.06% than it did at 3.56%.
The question you came here to answer: is that yield backed by real assets generating real revenue, or is it funded by USUAL token emissions that will evaporate when the protocol decides to slow its incentive budget?
The difference is not academic. RWA yield is sticky. It tracks the fed funds rate and T-bill market yield, both of which move slowly and predictably. Token emission yield can be cut to zero at a governance vote. It carries price risk from a reward token you never intended to hold. [Stablecoin income strategies](https://altcoininvestor.com/how-to-earn-passive-income-stablecoins-2026/) that rely on emissions typically collapse when the token drops or the protocol pivots.
Here is how to separate the two.
## What USD0's Yield Actually Comes From (According To The Protocol)

USD0 is a Liquid Deposit Token backed 1:1 by tokenized US Treasury Bills. The protocol sources RWAs from institutional providers: Hashnote USYC, M0, and Superstate. These are on-chain representations of short-term Treasury securities, currently yielding between 4.0% and 5.2% based on September 2026 market rates and a fed funds target range of 3.75% to 4.00%.
Usual's model redistributes 100% of the collateral yield it collects. That is unusual in stablecoin design. Tether and Circle capture the full yield from reserves and do not share any of it. Sky Protocol (formerly MakerDAO) shares some yield but gates it through governance. Usual's distribution formula is fixed: 30% flows weekly to holders who lock the USUAL governance token into USUALx, paid in USD0\. The other 70% goes to the DAO treasury to fund operations and protocol development.
USD0 itself does not pay yield while idle. To earn, you must either lock it into bUSD0 (which requires a four-year commitment) or deposit it into a third-party lending protocol like Aave, Morpho, or Compound. The advertised APY reflects what you can earn by lending USD0 into the highest-yielding venue available at that moment.
The protocol's documentation states clearly: no opaque bank deposits, no periodic attestations. Anyone can audit reserves in real time on-chain. The collateral wallets are public. The Treasury Bill tokens they hold are verifiable.
## How This Compares To Other RWA Stablecoin Yield

Three other RWA-backed yield products sit in the same market.
**Sky Protocol's sUSDS** reached $5.52 billion in supply in Q2 2026\. The protocol generates yield from a portfolio of tokenized T-bills and overcollateralized loans. Its savings rate is set by governance and sat at 3.75% in April, then moved into the 5% to 7% range by September. That yield is reliable but administratively determined, not market-driven. When governance votes to adjust the rate, it adjusts.
**Ethena's sUSDe** pays between 6% and 12% in positive funding environments. That yield is not RWA-backed. It comes from a delta-neutral basis trade: the protocol holds spot ETH and shorts ETH perpetual futures. The spread between those two positions generates the yield. The problem: [Ethena's yield compresses or inverts](https://altcoininvestor.com/how-ethena-yield-works/) when funding rates turn negative. In October 2024, sUSDe yield went negative. It recovered, but the mechanism has no floor.
Morpho blue-chip vaults offer between 4.5% and 6.5% depending on curator risk selection. Those yields are market-driven, pulled from DeFi lending demand across Aave, Compound, and Euler. But they fluctuate daily based on borrowing activity. In August 2026, Aave Base USDC was around 3.6%, Moonwell USDC approximately 7.5%, and Compound approximately 5.9%. The range is wide because each venue has different collateral requirements and liquidation risk.
Usual's 6.06% sits near the top of the RWA peer set and above the median DeFi lending rate. That placement is suspicious unless the protocol is either (a) lending into high-demand markets, or (b) supplementing T-bill yield with something else.
## Breaking Down The 6.06% Rate Into Components
Start with the base. US Treasury Bills with maturities under one year currently yield between 4.0% and 5.2%. The exact rate depends on auction timing and duration. Hashnote USYC, one of Usual's primary collateral providers, tracks short-duration Treasuries closely. M0 and Superstate follow similar strategies. That gives us a baseline: the protocol is collecting approximately 4.5% to 5.0% from its RWA collateral.
The advertised 6.06% rate is higher than that baseline.
Two explanations are possible. First: USD0 is being loaned into DeFi lending markets that are currently paying above Treasury rates. In September 2026, Moonwell USDC on Base was around 7.5% and some Morpho vaults were in the 6% to 8% range for aggressive curators. If a significant portion of USD0 supply is deposited into those venues, the blended rate could reach 6.06%.
Second: the protocol is supplementing RWA yield with USUAL token emissions to bootstrap liquidity. This is standard practice in DeFi. You launch with high incentive APY to attract TVL, then taper emissions as the protocol matures. The question is whether that is happening here.
Usual's token issuance is TVL-linked. New USUAL tokens are minted only when USD0++ tokens are created, and the issuance rate per dollar decreases as TVL grows. That is a deflationary design intended to make emissions scarce over time. But it does not tell us whether current USUAL distributions are funding part of the advertised yield.
The protocol's documentation emphasizes that 100% of yield comes from collateral, not token printing. If that is accurate, the 6.06% rate must be explained entirely by (a) T-bill yield and (b) lending market passthrough. The arithmetic supports that claim if USD0 is being actively lent into high-demand DeFi markets.
Here is the sensitivity: if borrowing demand drops and DeFi lending rates compress back toward the 3.6% Aave baseline, the blended USD0 rate would fall to approximately 4.0% to 4.5%, even with no change in T-bill collateral yield. That is a 1.6pp to 2.0pp haircut from the current advertised rate.
### Where To Verify The Numbers Yourself
Usual's reserve composition is auditable on-chain. The protocol publishes wallet addresses for its collateral holdings. You can verify the allocation to Hashnote, M0, and Superstate tokens directly. Check the percentage of USD0 supply that is deposited into Aave, Morpho, or Compound by searching for USD0 token holders on Etherscan and filtering by known lending protocol contracts.
[DefiLlama](https://docs.defillama.com/) tracks TVL and yield metrics for most major protocols, including Usual. The dashboard will show you current APY, TVL history, and protocol revenue if available. Cross-reference that data with the on-chain wallet activity to confirm whether the advertised yield matches the observable lending activity.
If the protocol is distributing USUAL tokens as part of the yield package, those transactions will appear as token transfers from the treasury or an emissions contract. Look for recurring USUAL transfers to USD0 or bUSD0 holders. If you do not see them, the yield is entirely RWA-backed and lending-market driven.
## Durability: How Long This Rate Will Hold
Two forces control the durability of USD0's yield: Treasury Bill rates and DeFi borrowing demand.
T-bill rates move with Federal Reserve policy. The fed funds rate sat at 3.75% to 4.00% in September 2026\. If the Fed cuts rates in Q4 2026 or Q1 2027, T-bill yields will follow. A 50 basis point cut would reduce the RWA baseline from 4.5% to approximately 4.0%. That compression would flow directly through to USD0's yield unless offset by higher lending rates.
DeFi lending rates are more volatile. In early 2026, crypto lending rates fell to around 2.6% on the largest platforms as demand cooled. By September, rates had recovered to the 4% to 8% range depending on venue and collateral type. But that recovery is fragile. If risk appetite declines or stablecoin supply increases faster than borrowing demand, rates will compress again.
[Chasing yield between platforms](https://altcoininvestor.com/is-it-worth-moving-defi-position/) introduces gas costs, slippage, and tax events that often wipe out the rate differential. A 6.06% rate that requires monthly repositioning across Morpho vaults may net less after costs than a 5.5% rate that holds steady for six months.
The most durable component of USD0's yield is the T-bill collateral. That portion is insulated from DeFi volatility and moves on a predictable schedule tied to macroeconomic policy. The least durable component is the lending market passthrough, which can halve in 30 days if market conditions shift.
If you are evaluating USD0 for a position larger than $100,000, model the downside scenario: assume DeFi lending rates compress to 4.0% and T-bill rates decline by 50 basis points. That gives you a floor yield around 3.5% to 4.0%. If that return is acceptable, the position survives a downturn. If you need the full 6.06% to justify the allocation, you are taking duration risk on DeFi lending markets.
## Who This Yield Is Right For (And Who Should Skip It)
USD0 works for allocators who want RWA-backed yield without custody lock-up and who are comfortable with DeFi smart contract risk.
You should consider USD0 if:
- You want exposure to Treasury Bill yield without holding tokens directly on a centralized platform
- You are already active in DeFi and can monitor lending rates across Aave, Morpho, and Compound
- You prefer transparent, on-chain collateral over opaque bank attestations
- You can tolerate rate volatility of 1.5pp to 2.0pp depending on borrowing demand
- You understand smart contract risk and have vetted the Usual protocol contracts
You should skip USD0 if:
- You need a fixed rate for budgeting or liability matching
- You want set-and-forget yield that does not require repositioning every 30 to 60 days
- You are allocating funds that cannot tolerate smart contract exploit risk
- You prefer custody solutions with insurance (FDIC, SIPC, or private coverage)
- You need liquidity without a four-year lock (bUSD0 requires that commitment; USD0 itself is liquid but earns nothing while idle)
[Other yield-bearing stablecoins](https://altcoininvestor.com/best-yield-bearing-stablecoins/) like sUSDS or USDY offer more predictable rates at the cost of either governance risk or lower APY. The trade-off is rate stability versus rate ceiling.
## My Recommendation: Take The Base Yield, Ignore The Top-Tick
The 6.06% rate is real, but it is also the current peak. You should not build a position assuming that rate holds for 12 months.
Model your allocation assuming a 4.0% to 4.5% floor. That is the yield you can reasonably expect if DeFi lending rates compress and T-bill yields decline modestly. If that return justifies the position size and the smart contract risk, proceed. If you need the full 6.06% to make the position work, you are betting on sustained DeFi borrowing demand, which is not a safe assumption.
The advantage of USD0 over competitors is transparency. The collateral is auditable. The yield distribution is programmatic. There are no governance votes that can cut your rate overnight. But the yield itself is market-dependent, and markets compress.
Use USD0 for the portion of your stablecoin allocation where you want RWA backing and are comfortable with rate variability. Pair it with a fixed-rate product like sUSDS or a CeFi account paying 4.5% to 5.0% to smooth out the volatility. Do not concentrate your full yield stack in a single protocol that pays the highest current rate.
If the rate drops to 4.0% in Q1 2027, you will still have a position that outperforms idle USDC. That is the correct mental model.
## The Takeaway: Decision Rule For USD0 Allocation
Allocate to USD0 if you can tolerate a floor yield of 4.0% and prefer transparent RWA collateral over fixed governance rates. Skip it if you need rate certainty or cannot accept DeFi smart contract risk. The 6.06% rate is real today but will compress when borrowing demand falls. Position size accordingly. Verify the collateral wallets and lending market deposits on-chain before committing capital above $50,000\. The blockchain does not lie, but the advertised APY will.
## Frequently Asked Questions
### Is Usual USD0's 6.06% APY backed by real assets or token emissions?
USD0's yield is backed by tokenized US Treasury Bills from Hashnote, M0, and Superstate, which currently yield 4.0% to 5.2%. The protocol claims 100% of yield comes from collateral, not USUAL token printing. The advertised 6.06% rate includes passthrough from DeFi lending markets where USD0 is deposited. Verify by checking on-chain collateral wallets and USD0 deposits in Aave, Morpho, or Compound contracts on Etherscan.
### How much of USD0's yield comes from Treasury Bills versus DeFi lending?
Treasury Bills backing USD0 yield approximately 4.5% to 5.0% based on September 2026 rates. The additional 1.0pp to 1.5pp reaching the advertised 6.06% comes from USD0 deposited into DeFi lending protocols paying 6% to 8%. The exact split depends on how much USD0 supply is actively lent versus held idle. That ratio is visible on-chain by tracking USD0 token holders in lending protocol contracts.
### Will USD0's 6.06% rate hold if DeFi lending demand drops?
No. If DeFi borrowing demand compresses lending rates back to the 3.6% Aave baseline, USD0's blended yield would fall to approximately 4.0% to 4.5%, even with no change in Treasury collateral. The T-bill component is durable and tracks Fed policy, but the lending passthrough is volatile. Model a 4.0% floor yield when sizing positions for 12-month hold periods.
### How does USD0's yield compare to Sky Protocol sUSDS and Ethena sUSDe?
sUSDS pays 5% to 7% but is governance-set and can be adjusted by vote. sUSDe pays 6% to 12% from basis trading but inverts in negative funding environments. USD0's 6.06% is market-driven, not governance-gated, and has a 4.0% to 4.5% floor from Treasury collateral. USD0 is more transparent than sUSDS and more stable than sUSDe, but offers less upside than sUSDe in high-funding regimes.
### What is the minimum allocation size where USD0 yield makes sense after costs?
At $400,000, USD0 at 6.06% earns $10,000 more annually than 3.56%. Gas costs for depositing, repositioning across lending venues, and withdrawing typically run $50 to $200 depending on network congestion. Below $10,000 allocation, those costs eat meaningful portions of yield. At $50,000 or above, entry and exit costs become negligible relative to annual return, especially if you hold for six months or longer without repositioning.
The Weekly Yield Report
You just separated a 6.06% headline rate into 4.5% RWA yield and 1.5pp DeFi lending passthrough. That mix will shift every 30 days.
Every Thursday: where crypto yield actually is - stablecoins, liquid staking and DeFi lending, with the risk named next to the rate and what changed since last week.
[Get it free every Thursday](#/portal/signup)
Free. No trade calls, no allocations, no hype. Unsubscribe in one click.
### How To Evaluate An ICO Or IDO Before You Commit Capital
URL: https://altcoininvestor.com/how-to-evaluate-ico-ido/
Last updated: 2026-09-24T22:05:32.000Z
## What You Will Accomplish

Fewer than 22% of IDOs launched in 2026 maintained their launch price after 30 days. Only 11% held value after 90 days. Projects displaying three or more red flags had a 94% probability of losing over half their value within 90 days.
This article gives you a 15-minute evaluation checklist that filters out rug pulls, unsustainable tokenomics, and exit-ready teams before you commit capital. You will learn how to verify teams, decode unlock schedules, flag allocation risks, and benchmark comparable projects using on-chain metrics. This is the framework that separates [low-cap speculation](https://altcoininvestor.com/how-to-screen-low-cap-token/) from informed participation in early-stage token sales.
Prerequisites: You need access to a blockchain explorer (Etherscan, BSCScan, or equivalent), a project's whitepaper, and basic familiarity with reading wallet transactions. If you are not yet comfortable with that, read [How To Read A Crypto Transaction Before You Click Approve](https://altcoininvestor.com/how-to-check-crypto-transaction-before-signing/) first.
## Step 1: Verify The Team In Five Minutes
Start with LinkedIn. Cross-reference every named team member. If a founder claims a senior role at a major company but there is no public trace of that employment, treat it as a serious concern. Look for endorsements from colleagues, posts about projects, and recommendations. Fake profiles are common. Scammers create convincing LinkedIn pages with stolen photos and fabricated job histories.
Run reverse image searches on team photos. If the same face appears on unrelated profiles or stock photography sites, you have a problem.
Next, check GitHub. Do the claimed developers have commit history? Are their repositories active, with recent pushes and substantive code? A profile with no commits or only forked repos raises questions. Real engineers leave a trail. Anonymous teams are not automatically fraudulent, especially in privacy-focused projects, but they require elevated scrutiny. Pseudonymous with a verifiable build history is a different risk from anonymous with none.
Finally, search for prior projects. Has this team launched anything before? Did it survive? Did they deliver on promises or abandon the project? Public records, old Medium posts, archived websites, and community discussion threads often reveal past failures. If you cannot find real identities behind the project, the risk of a rug pull increases dramatically. Legitimate founders put their names and reputations on the line. Scammers hide behind cartoon avatars and pseudonyms.
### What To Watch For
No LinkedIn profiles or profiles with fewer than 50 connections. No GitHub activity or repositories with only documentation, no code. Claims of employment at major firms (Google, Coinbase, a16z) with no corroboration. Team members who appear on multiple unrelated projects launched in the same quarter. Stock photos or images that reverse-search to unrelated people.
If any two of these appear together, stop. Move on.
## Step 2: Decode Tokenomics And Vesting In Five Minutes
Pull the whitepaper or tokenomics documentation. You need four numbers: total supply, circulating supply at launch, team allocation, and vesting schedule. If team allocation exceeds 20% of total supply or unlocks faster than 24 months, that is elevated risk.
Look for cliff periods. Industry benchmarks show 85% of credible projects enforce a 12-month cliff for founders and core team, and a 6-to-12-month cliff for early investors. A cliff means tokens do not begin unlocking until a set period has passed. Projects with no cliff allow immediate selling post-launch. That structure invites dumping.
TGE unlock percentage matters. Analysis of 200+ token launches shows that projects with TGE unlocks exceeding 25% experience median first-year price declines of 72%, compared to 38% for those with sub-15% unlocks. High initial circulating supply dilutes price support and gives early holders an immediate exit.
Calculate monthly unlock percentages for the first six months. If the vesting schedule releases more than 5% of total supply per month during that window, price pressure is structural, not speculative. Compare the entry price available to you against the cost basis of team and investor allocations. If insiders bought at one-tenth your price and are sitting on large paper gains with unlocks starting soon, you are buying their exit liquidity.
### Red Flag Combinations
Team plus investor allocation exceeds 40% of total supply. Vesting schedules shorter than 18 months. No cliff period for team tokens. TGE unlock above 25%. Any project that shows three of these four has a 94% historical failure rate within 90 days.
Find the vesting contract address in the tokenomics documentation, then read its parameters on a block explorer. For standard OpenZeppelin vesting contracts, the vestedAmount() function shows how many tokens have accrued at any given timestamp. Compare on-chain data with published schedules to verify accuracy. If the numbers do not match, someone is lying.
## Step 3: Analyze Unlock Schedules Using On-Chain Data
Do not rely on what the whitepaper says. Verify it on-chain. Navigate to the project's token contract on Etherscan or the relevant block explorer. Look for vesting contract addresses, typically disclosed in the project's official documentation or Telegram channel.
Read the contract functions. Most vesting contracts expose start time, cliff duration, vesting duration, and beneficiary addresses. You can query these parameters directly. If the vesting contract is not public or the functions are obfuscated, that is a red flag on its own.
Use tools like [CoinMarketCap Token Unlocks](https://coinmarketcap.com/token-unlocks/) or DefiLlama to track scheduled unlock events. These platforms aggregate vesting data and display upcoming liquidity events by date and magnitude. A project with a 10% supply unlock in 30 days should trade differently than one with gradual monthly releases of 1%.
Compare the project's current fully diluted valuation against its market cap. If FDV is 10x market cap and most of that gap unlocks in the next six months, you are betting that demand will absorb massive new supply. That is a harder trade than it sounds.
### Example: The Catastrophic Unlock
A project trades at $2 with a $20M market cap and a $200M fully diluted valuation. Forty percent of supply went to the team and early investors, who bought in at $0.20\. The vesting schedule shows a one-year cliff ending in two months, after which insider tokens unlock at 5% of total supply per month. Those insiders hold a 10x gain at current prices. When their tokens unlock, they have every incentive to sell. You are buying at $2 what they bought at $0.20, right before they gain the ability to exit.
This is not speculation. This is math.
## Step 4: Benchmark Against Comparable Projects
Fees are what end users pay, including payment fees, borrowing interest, trading fees, and issuance charges. Compare 30-day and annualized fee growth against user and volume growth. Fee-generating activity is stronger evidence of product-market fit than subsidized activity or airdrop farming.
Pull on-chain metrics for comparable projects at similar stages. Daily active addresses, transaction volume, and total value locked (if the project is DeFi) provide context. A project with high transaction volume but low unique addresses might indicate bot activity or wash trading. Look at GitHub activity: commit frequency, number of contributors, and recency of code updates. Networks with declining developer activity struggle with innovation and security updates.
Developer activity metrics from platforms like GitHub and Electric Capital's developer reports show ecosystem health and long-term viability. If a project claims strong fundamentals but has fewer than five active contributors or no commits in the past month, the fundamentals are not strong.
Compare token unlock schedules and allocation structures across similar projects. If every credible project in a category locks team tokens for 24 months and the one you are evaluating unlocks in 12, ask why. If the answer is not convincing, move on.
### What Comparable Analysis Reveals
A DeFi protocol that generates $50K in monthly fees while offering 40% APY is subsidizing yield with inflation or investor capital. That is not sustainable. A layer-one blockchain with 500 daily active addresses and a $100M valuation is priced for speculation, not usage. An NFT marketplace with $10K in weekly trading volume does not justify a $50M token market cap.
Price and valuation reflect sentiment. Metrics reflect reality. [Yield opportunities](https://altcoininvestor.com/how-to-evaluate-crypto-yield/) that do not pass the comparable test rarely survive bear markets.
## Step 5: Run The Rug Pull Checklist
Rug pulls are the most common fraud in DeFi. According to CipherTrace, exit scams and rug pulls accounted for 99% of all DeFi fraud cases in 2020\. The mechanics have evolved, but the warning signs remain consistent.
Check liquidity lock status. If the project creators hold most of the liquidity pool tokens and have not locked them in a time-locked contract, they can withdraw liquidity at any time and crash the market. Legitimate projects lock liquidity for at least six months, often longer.
Read the token contract. Look for functions that allow minting of new tokens, transfer restrictions, or pausable transfers. Some contracts give the owner the ability to mint infinite supply, blacklist addresses, or halt trading. If those permissions exist and are not renounced or transferred to a multisig or DAO, the project can rug at will.
Examine marketing and promises. A whitepaper full of buzzwords with no specific technical architecture or go-to-market plan is a red flag regardless of which exchange is hosting the sale. Unrealistic promises, vague roadmaps, and anonymous teams with no track record combine to form the profile of a rug pull.
Soft rug pulls involve gradual exits. Developers reduce involvement, slow updates, stop responding to the community, and sell tokens over weeks or months. Hard rug pulls are immediate: liquidity is withdrawn, the website goes offline, and the team disappears. Both are detectable in advance if you know what to look for.
### The 12-Point Rug Pull Checklist
Anonymous team with no verifiable history. No liquidity lock or lock period under 90 days. Token contract with mint, pause, or blacklist functions controlled by a single address. No external audit of the smart contract. Whitepaper with no technical detail or copied text from other projects. Social media accounts created within the past 60 days. No GitHub repository or repository with no substantive code. Promises of guaranteed returns or fixed APYs with no disclosed revenue source. TGE unlock above 30%. Vesting schedule under 12 months. Marketing focused on price targets and "moon" language. Refusal or inability to answer basic questions about tokenomics or code.
No single flag disqualifies a project. Three or more together should stop you cold.
## Common Failure Modes
Price does not equal quality. A token can increase 500% in 60 days with no change in actual usage, developer activity, or revenue. Always compare price movements against on-chain data to understand whether price reflects real growth or pure speculation.
High valuations at launch often mask poor fundamentals. A project that raises $20M at a $200M valuation and launches with a $500M fully diluted valuation is not demonstrating strength. It is creating a structure where early investors and the team hold most of the supply at a fraction of your entry price. You become exit liquidity.
Whitepapers and roadmaps are marketing documents. What matters is what the contract says, what the vesting schedule enforces, and what the on-chain data shows. If those three do not align with the narrative, trust the data.
Anonymous teams are not automatically fraudulent, but they do require heightened scrutiny. Privacy-focused projects, controversial applications, or teams in restrictive jurisdictions may have valid reasons for anonymity. In those cases, verification shifts to other channels: prior builds under the same pseudonym, [public code contributions](https://altcoininvestor.com/how-to-research-crypto-team-background/), endorsements from known figures, and audits by reputable firms.
## What To Do Next
Run this checklist on every ICO or IDO before you commit capital. Set a timer for 15 minutes. If you cannot complete the checklist in that time, the information you need is not available. That alone is a signal.
Document your findings. Write down the team verification results, the unlock schedule, the allocation structure, and the comparable project benchmarks. If you decide to participate, those notes become your thesis. If the thesis breaks, you have [an exit condition](https://altcoininvestor.com/when-to-sell-low-cap-crypto/).
Track unlock events using CoinMarketCap, DefiLlama, or Tokenomist. Set calendar reminders for major unlocks. Price action around those events is predictable if you are paying attention.
Compare your evaluation against other participants. If the project has an active community, ask questions about tokenomics, vesting, and team history. Legitimate projects welcome scrutiny. Rug pulls deflect, obfuscate, or ban questioners.
## The Takeaway
More than half of IDO tokens launched in 2026 fell 99% or more from their initial prices. The projects that survived had verifiable teams, sustainable tokenomics, and transparent vesting schedules. The ones that collapsed displayed the same patterns: high insider allocation, short vesting, no cliff, and anonymous teams with no track record. This checklist does not guarantee success. It filters out the 94% of projects with three or more red flags that historically lose half their value in 90 days. That is enough to change your outcome distribution.
## Frequently Asked Questions
### What is the most important metric when evaluating an ICO or IDO?
Team allocation and vesting schedule. If team allocation exceeds 20% of total supply or unlocks faster than 24 months, risk is elevated. Analysis of 200+ launches shows projects with TGE unlocks above 25% experience 72% median first-year declines, versus 38% for sub-15% unlocks. Verify the vesting contract on-chain, do not rely on whitepaper claims alone.
### How do I verify a crypto project team is legitimate?
Cross-reference LinkedIn profiles for employment history confirmed by colleagues and endorsements. Check GitHub for active commit history and substantive code, not just forks or documentation. Search for prior projects and outcomes. Run reverse image searches on team photos to detect stolen images. Anonymous teams require elevated scrutiny through other channels like prior pseudonymous builds, public code contributions, and third-party audits.
### What percentage of IDOs maintain their launch price after 30 days?
Fewer than 22% of IDOs launched in 2026 maintained their launch price after 30 days, and only 11% held value after 90 days. Projects displaying three or more red flags had a 94% probability of losing over half their value within 90 days. More than half of IDO tokens launched in 2026 fell 99% or more from their initial prices.
### What are the biggest tokenomics red flags in an ICO or IDO?
Team plus investor allocation exceeding 40% of total supply, vesting schedules shorter than 18 months, no cliff period for team tokens, and TGE unlock above 25%. Projects showing three of these four have a 94% historical failure rate within 90 days. Also watch for monthly unlock rates above 5% of total supply in the first six months, which creates structural price pressure.
### How can I detect a rug pull before it happens?
Check for anonymous teams with no verifiable history, unlocked or short-locked liquidity (under 90 days), token contracts with mint or pause functions controlled by a single address, no external audit, social media accounts under 60 days old, and no substantive GitHub code. Three or more of these signals together indicate high rug pull risk. Always verify liquidity lock status and contract permissions on-chain.
The Weekly Yield Report
You now have the 15-minute checklist that filtered 94% of high-risk projects in 2026\. Next quarter's ICO landscape will show different numbers and new failure modes.
Every Thursday: where crypto yield actually is - stablecoins, liquid staking and DeFi lending, with the risk named next to the rate and what changed since last week.
[Get it free every Thursday](#/portal/signup)
Free. No trade calls, no allocations, no hype. Unsubscribe in one click.
### The Break-Even On Chasing A Higher Yield
URL: https://altcoininvestor.com/is-it-worth-moving-defi-position/
Last updated: 2026-09-25T00:20:37.000Z
## When Moving Is Worth It (And When It Costs More Than It Earns)

Every "best yields" aggregator shows you a list. Aave pays 3.2%. Morpho pays 5.5%. The implication is obvious: move. The arithmetic tells a different story. Most position moves cost more than they earn, and the threshold where they start making sense is higher than the content implies.
The question is not whether a higher yield exists. The question is whether the cost to access it is smaller than the value it generates over the time you intend to hold the position. That cost has five components: gas on exit, gas on entry, slippage on exit, slippage on entry, and the tax event created by moving an appreciated position. Some strategies add a sixth: opportunity cost during unbonding periods when your capital earns nothing.
The break-even calculation is simple. Total cost to move divided by position size gives you the percentage return required to recover that cost. Multiply by 12 to annualize it. If the APY spread between your current position and the target position is smaller than that number, the move loses money.
## The Cost Components (And How They Stack)

Gas costs on Layer 2 networks now range from $0.001 to $0.05 per transaction. Exit and entry together cost $0.06 to $0.10 on Arbitrum or Base for a standard DeFi position. At a $1,000 position size, that is 0.6% to 1% of capital before you earn anything. To recover that cost in one month requires a 7.2% to 12% annualized APY spread. Most lending protocol spreads are 1% to 3%.
Slippage depends on pool depth and position size. On liquid pairs with deep TVL, slippage is negligible below $5,000\. On shallow pools, slippage can hit 1% to 3% on a $10,000 position. Exit slippage and entry slippage compound. If you exit a low-liquidity pool at 2% slippage and enter another at 1.5%, you have just paid 3.5% in total slippage. At $10,000, that is $350\. To recover that cost over six months requires a 7% APY spread.
Tax events are the hidden cost most yield chasers ignore. Under IRS guidance, depositing tokens into a liquidity pool is treated as a taxable exchange. If your position has appreciated since you acquired it, you owe capital gains tax at the time of deposit. That tax is due regardless of whether you sold anything. The tax liability is based on the fair market value of the tokens at deposit minus your cost basis.
Example: You bought 1 ETH at $2,000\. It is now worth $3,000\. You deposit it into a new LP pool. You owe capital gains tax on $1,000 of appreciation. At a 20% long-term capital gains rate, that is $200 in tax owed immediately. At a $3,000 position, that is a 6.67% cost. To recover that cost over 12 months requires a 6.67% APY spread just to break even on the tax event alone.
Unbonding periods apply to staking positions and some liquid staking protocols. Traditional staking on Ethereum or Cosmos-based chains has unbonding windows of 7 to 28 days. During that window, your capital earns nothing. If you are moving from a 3% APY position to a 5.5% APY position, the 21-day unbonding window costs you 21 days of 3% yield, which is approximately 0.17% of your position. Add that to gas and slippage.
Liquid staking tokens like stETH eliminate the unbonding window by issuing receipt tokens that remain tradable. But exiting a liquid staking position introduces different costs: bridge fees if the protocol is on a different chain, withdrawal queue risk if you need to exit during high demand, and potential basis risk if the liquid staking token trades below par during market stress.
## The Position Size Thresholds

Below $1,000, gas costs alone make most moves unprofitable. A $0.10 total gas cost represents 1% of a $1,000 position. To recover that in one month requires a 12% annualized APY spread. Lending protocol spreads rarely exceed 3%. You would need to hold the position for four months just to recover the gas cost, assuming zero slippage and no tax event.
Between $1,000 and $10,000, slippage and tax liability dominate the cost equation. Gas becomes negligible as a percentage of the position, but slippage on shallow pools can hit 1% to 3%, and tax events on appreciated positions can add 5% to 10% in immediate tax liability. A $5,000 move with 2% total slippage and $300 in tax liability costs $400 total, or 8% of the position. To recover that over six months requires a 16% APY spread. Very few stable yield opportunities offer that spread.
Between $10,000 and $100,000, all costs matter equally. Gas is still negligible. Slippage starts to curve upward on positions above $20,000 unless you are moving between highly liquid pools. Tax events can represent significant dollar amounts even if the percentage is moderate. Unbonding periods represent meaningful opportunity cost. A $50,000 position earning 3% during a 21-day unbonding window loses approximately $86 in yield. Add $0.10 in gas, $500 in slippage (1% total), and $2,000 in tax liability (4%), and the total cost is $2,586, or 5.17% of the position. To recover that over 12 months requires a 5.17% APY spread.
Above $100,000, slippage dominates unless you are moving between the deepest pools on the largest protocols. Impermanent loss becomes the primary risk for LP positions. Tax events can represent tens of thousands of dollars in immediate liability. The break-even analysis must account for not just the APY spread, but the volatility of that APY over time and the structural risk of the higher-yield protocol.
For a detailed comparison of current lending protocol yields and their structural differences, see [Best DeFi Protocols By Category: Lending, DEX, Derivatives](https://altcoininvestor.com/best-defi-protocols/).
## Worked Example: Moving From Aave To Morpho
Aave V3 currently pays 3.2% APY on USDC. Morpho pays 5.5% APY on the same asset. The spread is 2.3%. Should you move?
Position size: $10,000\. Exit gas: $0.03\. Entry gas: $0.03\. Total gas: $0.06\. Slippage on exit: 0.1% ($10). Slippage on entry: 0.1% ($10). Total slippage: $20\. Tax event: assume you are moving stablecoins with no appreciation, so zero tax liability. Unbonding period: none for lending positions. Total cost: $20.06.
Break-even APY spread: $20.06 / $10,000 = 0.2006%. Annualized: 0.2006% x 12 = 2.4072%. The APY spread is 2.3%, which is less than the break-even threshold. The move loses money unless you hold for more than one year. Over 12 months, the Morpho position earns $550 and the Aave position earns $320, a difference of $230\. Subtract the $20.06 cost and you net $209.94 over 12 months. The move becomes profitable after approximately 13 months.
If the position had appreciated and triggered a tax event, the calculation changes. Assume you deposited ETH instead of stablecoins, and the position appreciated 50% since acquisition. Tax liability at 20% long-term capital gains rate: 20% x ($5,000 appreciation) = $1,000\. Total cost: $1,020.06\. Break-even APY spread: $1,020.06 / $10,000 = 10.2%. Annualized: 122.4%. The move never makes sense at a 2.3% APY spread.
The lesson is clear: tax events on appreciated positions dominate the cost structure. Before moving any position, calculate the unrealized gain and the tax liability. If the tax liability exceeds the expected earnings from the APY spread over your holding period, do not move.
## When Advertised APY Is Not Actual APY
Yield aggregators display gross APY, not net APY. The number you see is the maximum possible return assuming zero costs, zero impermanent loss, and infinite holding period. None of those conditions apply in practice.
Liquidity pool yields advertised at 50% or higher are almost always driven by governance token emissions. Those emissions are subsidies, not structural income. When the subsidy ends, the APY collapses to the base trading fee yield, which is typically 0.5% to 2% on mature pools. A 2021 study found that approximately 50% of Uniswap v3 liquidity providers had negative returns compared to simply holding the underlying assets, because impermanent loss exceeded the trading fees earned.
Impermanent loss is the permanent cost of providing liquidity to volatile pairs. If the price ratio of the two tokens in the pool changes, you withdraw fewer of the appreciated token and more of the depreciated token than you deposited. A 5x price movement in one token results in approximately 25.5% impermanent loss compared to holding. That loss is realized when you withdraw, and it is not offset by advertised APY unless the fees and rewards you earned exceed 25.5% over the same period.
Most yield aggregators do not subtract impermanent loss from advertised APY. They show the fee income and token rewards, but they do not show the net position value after accounting for IL. The result is that the advertised APY is often higher than the actual return, and in some cases, the actual return is negative despite a high advertised yield.
For an analysis of how specific yield mechanisms work and where they fail, see [How Ethena's Yield Works (And Why It Might Not Last)](https://altcoininvestor.com/how-ethena-yield-works/).
## The Opportunity Cost Of Unbonding
Traditional staking positions on Ethereum, Cosmos, Polkadot, and other Proof-of-Stake chains have unbonding periods ranging from 7 to 28 days. During the unbonding period, your capital is locked and earns zero yield. If you are moving from a staking position paying 3% APY to a higher-yield position paying 6% APY, the opportunity cost of the unbonding period must be subtracted from the expected gain.
Example: $20,000 staked at 3% APY. Unbonding period: 21 days. Daily yield: $20,000 x 0.03 / 365 = $1.64\. Lost yield during unbonding: $1.64 x 21 = $34.52\. New position pays 6% APY. Daily yield: $20,000 x 0.06 / 365 = $3.29\. Incremental daily yield: $3.29 - $1.64 = $1.65\. Time to recover the lost unbonding yield: $34.52 / $1.65 = 20.9 days. Total break-even period: 21 days (unbonding) + 20.9 days (recovery) = 41.9 days. If you hold the new position for less than 42 days, the move loses money.
Liquid staking protocols like Lido eliminate the unbonding window by issuing transferable receipt tokens. You deposit ETH and receive stETH, which continues earning yield and can be traded or used as collateral in other DeFi protocols. The trade-off is basis risk: stETH sometimes trades below the value of ETH during market stress or liquidity crunches. If you need to exit during one of those periods, you realize a loss on the basis spread in addition to any other costs.
Bridge delays add similar opportunity costs when moving positions across Layer 2 networks or between chains. Optimistic rollup bridges have reduced exit times from days to minutes for most user-facing flows, but delays still exist during periods of high congestion or bridge validator downtime. If your capital is locked in a bridge for 12 hours and your current position earns 5% APY, the opportunity cost is approximately $0.68 per $10,000 position. Small in absolute terms, but it adds to the total cost.
## Tax Events Compound Faster Than You Think
A single liquidity pool migration creates multiple taxable events. Withdrawing from the old pool triggers impermanent loss realization, which is a capital gain or loss. Selling one of the withdrawn tokens to rebalance for the new pool is a second taxable event. Depositing into the new pool is a third taxable event if the IRS treats the deposit as an exchange. Each event must be tracked separately for cost basis and tax reporting.
If you move positions frequently, the tax reporting burden becomes significant. One study found that a single yield farming position can create five or more taxable events when accounting for deposits, withdrawals, reward claims, token swaps, and compounding. Multiply that across multiple protocols and multiple chains, and the reporting complexity grows exponentially. Most tax software handles simple exchange trades, but few handle autocompounding, LP rebalancing, or cross-chain bridges correctly.
For tools that can handle multi-protocol yield tax reporting, see [Best Crypto Tax Software For DeFi Yield And Staking Income](https://altcoininvestor.com/best-crypto-tax-software-defi-yield-staking/).
The tax liability from moving an appreciated position is due immediately, even if you do not realize cash from the move. That means you must have sufficient liquidity outside the position to pay the tax. If you do not, you must sell part of the position to cover the tax, which creates an additional taxable event and reduces the capital earning yield in the new position. The compounding effect of tax-driven position reduction is rarely accounted for in break-even calculations, but it materially reduces the net return.
## When The Move Actually Makes Sense
The move makes sense when the total cost is a small fraction of the expected incremental earnings over your intended holding period. That threshold varies by position size, but the general rule is: if the break-even period is longer than half your intended holding period, do not move.
Specific conditions where moving is justified:
- Position size above $10,000 and APY spread above 5%
- Holding period longer than 12 months
- No tax event because the position has not appreciated or you are moving stablecoins
- No unbonding period or the unbonding opportunity cost is less than 1% of the position
- Slippage is negligible because both protocols have deep liquidity
- The higher-yield protocol has comparable or lower risk than the current protocol
The last condition is the most important. A 5% APY spread does not matter if the higher-yield protocol has unaudited contracts, low TVL, a history of exploits, or governance token emissions that will disappear in three months. Yield is not return. Return is yield minus costs minus risk-adjusted losses.
The correct decision framework is not "which protocol pays more" but "does the incremental yield justify the cost and risk of moving, given my position size and holding period." The answer is no more often than it is yes, especially below $10,000 position sizes.
For more on when to exit a yield position and when to stay, see [When To Exit A Yield Position (And When Not To)](https://altcoininvestor.com/when-to-exit-defi-position/).
## The Arithmetic Nobody Shows You
The yield aggregator shows you today's rate. It does not show you the break-even holding period after accounting for gas, slippage, tax, and unbonding. That calculation is simple, but it inverts the decision most of the time.
Total cost = exit gas + entry gas + exit slippage + entry slippage + tax liability + unbonding opportunity cost. Divide by position size to get the percentage cost. Divide the percentage cost by the APY spread to get the break-even holding period in years. Multiply by 12 to get months.
Example: $5,000 position. APY spread: 3%. Total cost: $100 gas + slippage, $200 tax liability, $10 unbonding cost = $310\. Percentage cost: $310 / $5,000 = 6.2%. Break-even holding period: 6.2% / 3% = 2.07 years. If you do not intend to hold for two years, the move loses money.
The aggregator implied you should move. The arithmetic says you should not. The difference is that the aggregator shows gross yield and assumes zero costs. The arithmetic includes the costs. The costs are real. The gross yield is not.
For a calculator that includes all costs and shows net yield, see [Crypto Yield Calculator: What A Position Actually Nets](https://altcoininvestor.com/crypto-yield-calculator/).
## The Takeaway
Most yield position moves are not worth it. Below $10,000, the combination of gas, slippage, tax events, and unbonding costs exceeds the incremental earnings from a 2% to 4% APY spread unless you hold for 12 months or longer. Above $10,000, the move becomes viable only if the APY spread is 5% or higher, the holding period is 12 months or longer, and the tax liability is zero or minimal. Advertised APY is gross yield. Break-even analysis requires net yield after all costs. The aggregator shows the former. You must calculate the latter before moving.
## Frequently Asked Questions
### How much does it cost to move a DeFi position in 2026?
Layer 2 gas costs range from $0.06 to $0.10 for exit and entry combined. Slippage adds 0.2% to 3% depending on pool depth and position size. Tax events on appreciated positions add 15% to 20% of the unrealized gain. Unbonding periods cost 7 to 28 days of foregone yield. For a $10,000 position with no appreciation, total cost is typically $20 to $300\. With a tax event on 50% appreciation, total cost can exceed $1,000.
### What APY spread justifies moving a yield position?
For positions under $10,000, you need a 5% or higher APY spread and a 12-month holding period to recover costs. For positions above $10,000, a 3% to 5% spread works if you hold for 6 to 12 months and have no tax event. Below $5,000, most moves are unprofitable unless the spread exceeds 10% and you hold for multiple years. The break-even threshold depends on total costs divided by position size and time.
### Do tax events from moving a DeFi position matter?
Yes. Depositing appreciated tokens into a new protocol is treated as a taxable exchange under IRS guidance. If your position appreciated 50% and you owe 20% capital gains tax, that is a 10% immediate cost on your position. At $10,000, that is $1,000 owed in tax. To recover that cost requires a very large APY spread held for a long period. Most moves below $20,000 become unprofitable once tax liability is included.
### How do I calculate if a yield move is worth it?
Add exit gas, entry gas, exit slippage, entry slippage, tax liability, and unbonding opportunity cost. Divide by your position size to get percentage cost. Divide percentage cost by the APY spread to get break-even holding period in years. Multiply by 12 for months. If the break-even period is longer than half your intended holding period, do not move. Use a net yield calculator that includes all costs rather than relying on aggregator gross APY.
### What is the opportunity cost of an unbonding period?
Unbonding periods on staking positions last 7 to 28 days depending on the chain. During that time, your capital earns zero yield. For a $20,000 position earning 3% APY, a 21-day unbonding period costs approximately $34.52 in foregone yield. You must recover that cost through higher yield in the new position, which adds to the break-even timeline. Liquid staking eliminates unbonding but introduces basis risk and bridge delays.
Tool mentioned above
Koinly
Koinly imports from 800+ exchanges and wallets and handles the DeFi cases most tools get wrong - rebasing tokens, LP positions, staking rewards.
[Try Koinly](https://koinly.io/?via=F6E2E35A&utm%5Fsource=affiliate)
We may earn a commission if you sign up through this link, at no cost to you. It does not change what gets recommended.
The Weekly Yield Report
You now have the break-even math for gas, slippage, unbonding, and tax costs at five position sizes. Those thresholds will shift as Layer 2 costs and lending spreads change.
Every Thursday: where crypto yield actually is - stablecoins, liquid staking and DeFi lending, with the risk named next to the rate and what changed since last week.
[Get it free every Thursday](#/portal/signup)
Free. No trade calls, no allocations, no hype. Unsubscribe in one click.
### Launchpad Platforms Compared: CoinList vs DAO Maker vs Fjord
URL: https://altcoininvestor.com/best-launchpad-platforms-crypto/
Last updated: 2026-09-24T19:05:48.000Z
## The Decision You Are Making
You want early-stage token allocations before exchange listings. The income mechanism is straightforward: buy below market, sell after liquidity arrives. The platform you choose determines which projects you see, what you pay to participate, and whether you can access the sale at all.
Three platforms matter. CoinList ran the Solana and Filecoin sales and maintains the strongest compliance posture. DAO Maker offers the largest deal flow with a lottery-based allocation model. Fjord Foundry uses Liquidity Bootstrapping Pools to turn launches into price-discovery events instead of allocation races.
The comparison below covers access requirements, participation mechanics, historical project quality, and the specific failure modes that separate a working strategy from an expensive education.
## Access Requirements and Costs
CoinList is free to register. The real costs are strict KYC, token lockups on most sales, and geography. US persons are excluded from the majority of offerings, though qualified investors occasionally gain access to specific deals. The platform uses a five-tier Karma system (Rust to Platinum) that increases your odds of presale allocations. Karma accumulates through platform activity, not token purchases.
No native-token stake is required. Participation fees are typically low or absent, which makes CoinList cheaper on a per-sale basis than most competitors.
DAO Maker requires 2,000 DAO tokens to participate in Strong Holder Offerings. At recent prices, that entry ticket costs approximately $72\. The platform reports 315,000 KYCed users and 1.1 million connected wallets. It uses a lottery model: holding more DAO tokens increases allocation size but does not guarantee participation. Higher tiers improve odds and increase potential allocation, but the SHO structure means you can stake the minimum and still miss a sale entirely.
Fjord Foundry has no token-staking requirement. LBP participation is open to any wallet that can connect and transact on supported chains, which include Ethereum, Base, BNB Chain, Solana, Blast, Arbitrum, and Optimism. The barrier is not financial; it is operational. Understanding how LBPs work is the cost of entry. Buying too early in a descending-price auction means overpaying. Waiting too long can mean missing your desired allocation if demand arrives before the sale ends.
If you are a US retail investor, CoinList is mostly unavailable. If you want open access without staking requirements, Fjord is the only option. If you accept tiering in exchange for curated deal flow, [DAO Maker](https://coinmarketcap.com/currencies/dao-maker/) fits.
## Participation Mechanics

CoinList sale formats vary by launch. Some use first-come-first-served, others use auctions, and a few use hybrid models. Each launch is effectively its own homework assignment. You need to read the announcement, understand the allocation rules, confirm your tier, and set reminders for the participation window. Lockups are common. Vesting schedules can stretch months. Token distributions have been delayed in some cases, and user reviews frequently cite slow withdrawals and unresponsive support.
The platform closed 2025 with 21 token sales. Early 2026 launches included Zama, Flying Tulip, and USD.AI. The Karma-based tier system means your history on the platform matters more than your wallet size.
DAO Maker's launchpad centers on SHOs and Dynamic Coin Offerings (DYCOs). The SHO model is a lottery in which investors with platform history and token holdings receive priority. DYCOs include a mechanism intended to promote price stability and limit speculation: the project commits to buying back tokens at specific price floors during designated windows. The model is designed to reduce the risk of sharp post-launch dumps, though execution depends entirely on project treasury management.
The platform offers incubation, operations, and advisory services alongside token sales. [DAO Maker's research profile](https://messari.io/project/dao-maker) shows $90 million-plus total raised, $2 billion-plus total fully diluted valuation across launches, and a broad multi-chain strategy primarily anchored on Ethereum.
Fjord Foundry uses LBPs as its core sale mechanism. The model functions like a Dutch auction: the token price starts high and gradually decreases over the sale period. This mitigates bot influence and reduces the advantage held by large buyers. The descending price curve rewards patience and penalizes front-running.
Fjord supports zero-liquidity LBPs. You do not need to deposit real collateral at the beginning. Instead, the project defines a virtual collateral amount (synthetic liquidity) used to generate the price curve. The first real participant deposit merges into the pool and activates the pricing mechanism. This lowers the capital barrier for launching teams and reduces upfront liquidity risk.
For participants, the LBP model requires attention. Buying immediately at launch almost always means paying the highest price. The optimal entry point depends on the rate of price decline, the level of participant demand, and the sale duration. There is no guaranteed allocation and no tier system. Allocation goes to whoever buys during the sale window. If you understand the mechanics, you control your entry price. If you do not, you overpay or miss the sale.
## Historical Project Quality
CoinList came out of AngelList in 2017, built with Protocol Labs to run the Filecoin sale. That sale raised over $200 million and was the largest token offering of its era. In March 2020, CoinList ran Solana's public auction: 8 million SOL at $0.22, approximately $1.76 million, in one day. That history is why serious teams still choose the platform when they want a compliant public round.
Other notable launches include Ondo, which has become a significant player in tokenized real-world assets. CoinList's compliance posture is its product. The platform decides whether you exist before any sale does. In December 2023, CoinList paid a $1.2 million OFAC settlement over 989 transactions by Crimea-resident users. That penalty reflects the regulatory scrutiny the platform operates under.
The trade-off is clear: CoinList offers access to high-quality projects that prioritize regulatory clarity, but geography and lockups limit liquidity and exclude large segments of retail.
DAO Maker is considered one of the oldest launchpad platforms in existence. It has enabled many well-known projects to enter the market, though project quality is more variable than on CoinList. The platform's deal flow is larger, which means more opportunities and more variance. Some launches perform well. Others do not. Data from CoinGecko shows that approximately 85% of new tokens drop in price after launch. That statistic applies broadly across launchpads, not just DAO Maker, but it underscores the risk inherent in any allocation-based income strategy.
DAO Maker's main weakness is that DAO trades like a low-liquidity small-cap token despite the platform's history. If the platform token itself carries execution risk, that creates a second layer of exposure for participants who must hold DAO to access sales.
Fjord Foundry has facilitated over $1 billion in total funds raised, with swap volume exceeding $1.5 billion. The platform has launched 717 LBPs and attracted 106,762 participants. Total fees generated exceed $30 million. The platform charges a 2% fee on contributions.
The biggest launch on Fjord was GF Copper, which raised $139.8 million in 2021\. More recent activity has been smaller in scale but consistent. Fjord is favored by protocol-native developers and long-term communities. The LBP model aligns well with projects that prioritize fair distribution over hype-driven launches.
Fjord does not score higher on project quality because liquidity is thin, deal flow needs to prove durability, and the LBP participation model is too complex for many casual users. The platform is more compelling than its native token (FJO) market currently suggests, but FJO remains very high risk. Treat it as a speculative ecosystem token, not a conservative launchpad exposure.
## Failure Modes and Edge Cases
CoinList's most common user complaints center on delayed token distributions, slow or blocked withdrawals, high fees on certain transactions, and unresponsive or automated support. Some users report account closures without clear explanation. Others describe confusion around withdrawals requiring memos, with expensive recovery charges when memos are missing.
The platform's compliance posture creates friction. That friction is the price of operating within US and European regulatory frameworks. If you value access to high-quality projects and accept lockups and KYC, the friction is tolerable. If you want speed and flexibility, CoinList will frustrate you.
DAO Maker's failure mode is allocation variance. The lottery model means you can hold the required tokens, pass KYC, and still receive no allocation. If you are calculating expected returns based on consistent access, DAO Maker does not deliver that. The platform works for users who treat each SHO as an independent lottery ticket, not a guaranteed income stream.
The platform token itself introduces risk. If DAO drops in price or liquidity dries up, your entry cost increases or exit flexibility decreases. That creates a form of lockin that does not exist on CoinList or Fjord.
Fjord's failure mode is user error. LBPs reward understanding and penalize impatience. If you buy at the wrong time, you overpay. If you wait too long, you miss the allocation. There is no safety net and no support ticket that fixes a poorly timed purchase. The LBP model is fair, but fairness does not mean easy.
Liquidity is another risk. Many Fjord launches are smaller in scale than CoinList or DAO Maker sales. That means lower post-launch liquidity, wider spreads, and higher slippage when you exit. If your strategy depends on flipping allocations quickly, thin liquidity can erase expected gains.
None of these platforms protect you from project failure. A clean launch mechanism does not guarantee a working protocol. [On-chain signals that separate winners from rugs](https://altcoininvestor.com/spot-rug-pull-on-chain-2/) matter more than which launchpad hosted the sale.
## Who Each Platform Is Right For
CoinList fits users who prioritize project quality over frequency, accept lockups and vesting schedules, and can navigate strict KYC. If you are outside the US or qualify as an accredited investor, CoinList offers the strongest historical track record. If you want to participate in projects that will list on major exchanges and survive regulatory scrutiny, this is the platform.
It does not fit users who want high-frequency participation, fast liquidity, or flexible exit. It does not fit US retail investors at all.
DAO Maker fits users who accept lottery-based allocation in exchange for broader deal flow. The platform works for participants who can hold 2,000 DAO tokens without liquidity concern and who treat each SHO as a separate opportunity rather than a guaranteed income stream. If you want more chances to participate and can accept variable project quality, DAO Maker delivers volume.
It does not fit users who need allocation certainty or who cannot tolerate platform-token price risk.
Fjord Foundry fits users who understand LBP mechanics, value fair price discovery, and can monitor sales actively. The platform works for participants who prefer open access over tiered systems and who are comfortable with the operational complexity of Dutch auctions. If you want to avoid staking requirements and participate across multiple chains, Fjord is the only platform that supports Ethereum, Base, BNB Chain, Solana, Arbitrum, Optimism, and Blast in a single interface.
It does not fit users who want simple one-click participation or guaranteed allocations. It does not fit users who need high post-launch liquidity.
## The Recommendation
If you can access CoinList legally and can accept lockups, start there. The historical project quality justifies the friction. Solana at $0.22 and Filecoin at presale prices represent the kind of outcome no other platform has matched consistently.
If you are a US retail investor or need faster liquidity, Fjord Foundry is the better choice. The LBP model is harder to execute, but it eliminates staking requirements and opens access to a broader range of chains. The learning curve is real. Budget time to understand how descending-price auctions work before committing capital.
DAO Maker is the fallback. It offers the largest deal flow and the lowest entry cost, but allocation is not guaranteed and project quality is inconsistent. Treat it as a volume play, not a quality filter.
None of these platforms replace due diligence. The launchpad is the distribution venue, not the investment thesis. If the project does not generate [sustainable fees](https://altcoininvestor.com/crypto-loan-rates-compared/) or solve a real problem, the allocation is worthless regardless of where you bought it.
## The Takeaway
Launchpad selection is access selection. CoinList offers the highest historical project quality but excludes most US retail investors and imposes lockups that delay liquidity. DAO Maker offers the most frequent participation opportunities but uses a lottery model that does not guarantee allocation even when you hold the required tokens. Fjord Foundry offers the fairest price-discovery mechanism but requires active monitoring and understanding of Dutch auction dynamics. The platform you choose determines which projects you see, not whether those projects succeed. Pick the platform that matches your legal jurisdiction, liquidity timeline, and operational capacity. Then focus on the project, not the venue.
## Frequently Asked Questions
### What is the minimum cost to participate in DAO Maker token sales?
DAO Maker requires 2,000 DAO tokens to participate in Strong Holder Offerings (SHOs). At recent prices, that entry ticket costs approximately seventy-two dollars. Higher token holdings increase your potential allocation size and improve lottery odds, but the minimum 2,000 DAO stake is required for any participation. This differs from CoinList, which has no native-token requirement, and Fjord Foundry, which requires no staking at all.
### Can US investors participate in CoinList token sales?
Most CoinList token sales exclude US persons due to regulatory restrictions. Qualified investors (accredited investors meeting specific income or net-worth thresholds) occasionally gain access to specific deals, but the majority of CoinList offerings are unavailable to US retail investors. This geographic restriction is a direct result of CoinList's compliance posture and its focus on operating within US and European regulatory frameworks.
### How do Liquidity Bootstrapping Pools work on Fjord Foundry?
Fjord Foundry uses LBPs as a Dutch auction mechanism. The token price starts high and gradually decreases over the sale period. Buyers who enter early pay higher prices; those who wait benefit from lower prices but risk missing their desired allocation if demand arrives. The descending price curve mitigates bot influence and reduces whale advantage. Fjord also supports zero-liquidity LBPs, where projects define virtual collateral to generate the price curve without depositing real assets upfront.
### Which launchpad has the best historical project quality?
CoinList has the strongest historical track record, having hosted the Solana public auction (8 million SOL at 0.22 dollars in March 2020) and the Filecoin sale (over 200 million dollars raised). Other notable launches include Ondo. CoinList's compliance posture attracts projects that prioritize regulatory clarity, which historically correlates with higher project quality. DAO Maker and Fjord Foundry offer broader deal flow but with more variable project quality and smaller-scale launches.
### What are the main risks of using launchpad platforms for token allocations?
The primary risks include allocation uncertainty (lottery models do not guarantee participation), lockups and vesting schedules that delay liquidity, platform-token price risk (for platforms like DAO Maker that require token staking), user error in complex sale mechanics (especially LBPs), and project failure regardless of launch venue. Approximately eighty-five percent of new tokens drop in price after launch according to CoinGecko data. The launchpad is the distribution venue, not the investment thesis.
Tool mentioned above
CoinLedger
CoinLedger generates tax reports that import straight into TurboTax and TaxAct, and its free tier lets you see the calculation before paying.
[Try CoinLedger](https://coinledger.io?fpr=dlr3ye)
We may earn a commission if you sign up through this link, at no cost to you. It does not change what gets recommended.
The Weekly Yield Report
You just compared three launchpads with different access models, allocation mechanics, and historical project quality. Those platforms will add new features, change tiers, and host different projects next quarter.
Every Thursday: where crypto yield actually is - stablecoins, liquid staking and DeFi lending, with the risk named next to the rate and what changed since last week.
[Get it free every Thursday](#/portal/signup)
Free. No trade calls, no allocations, no hype. Unsubscribe in one click.
### Which Crypto Tax Tools Handle DeFi Correctly
URL: https://altcoininvestor.com/crypto-tax-software-defi/
Last updated: 2026-09-24T17:12:52.000Z
## The Question Every DeFi User Eventually Asks

The question usually arrives in late January, after the wallet imports are complete and the tax software has finished processing. Your liquidity pool deposit shows as a taxable swap. Your stETH balance, which grew daily all year, is either unreported or listed hundreds of times as income. The bridge transaction from Ethereum to Arbitrum appears as a sale and repurchase, triggering capital gains where you moved nothing but chain context. The calculator produced a number, but the number makes no sense.
What you are encountering is not a bug. It is the structural reality that most crypto tax platforms were designed to handle exchange trades, not the recursive, multi-step, continuously-accruing income patterns that define DeFi. Where centralized exchange activity produces one taxable event per trade, a year of providing liquidity to Curve or holding rebasing liquid staking tokens can produce thousands of separate income entries, each requiring a fair market value calculation at the moment of receipt and a cost basis that carries forward into every subsequent transaction.
This article documents what each major platform states in its published help documentation about the six DeFi situations that consistently break tax software. The method is straightforward: every capability claim below cites the vendor's official documentation or pricing page as of September 2026, and nothing here reflects hands-on testing. Where a platform is silent on a particular DeFi mechanism, that silence is noted. Silence in documentation is itself informative, because it signals that the platform either does not handle the case or expects you to classify transactions manually.
## Liquidity Pool Entry and Exit

Depositing two tokens into a Uniswap or Curve pool and receiving LP tokens in return is treated by most practitioners as a taxable disposal of both underlying tokens. You exchanged ETH and USDC for a new asset, the LP token, and that exchange is a realization event under existing IRS guidance. The same logic applies in reverse when you withdraw: burning the LP token and receiving back the underlying assets constitutes a taxable event, and any change in the ratio of tokens returned reflects impermanent loss, which becomes realized and deductible at that moment.
Koinly's documentation states that DeFi and liquidity pools require deeper transaction classification and that auto-labeling needs manual review. Negative balance warnings, which appear frequently when LP transactions import as simple sends and receives rather than structured swaps, confuse users across platforms. No major vendor publicly documents automated calculation of impermanent loss as a separately-tracked, deductible capital loss. The implication is that you will need to calculate impermanent loss yourself, compare the value of tokens withdrawn to the value of the LP token burned, and manually adjust the transaction classification if the software has not recognized the structure.
CoinLedger and CoinTracker both import LP transactions but treat them as wallet activity unless you manually reclassify. Summ's approach, documented in its help center, is to import outgoing and incoming components from two different chain-specific wallets and group them as a structured event if they meet defined criteria. That grouping depends on timing, amounts, and whether both halves of the transaction imported correctly, which does not always occur when one half of the bridge or pool deposit fails to sync.
The key point for users is this: if your tax report shows a liquidity pool deposit as a simple transfer rather than a taxable swap, the report is wrong, and you are underreporting capital gains. Most vendors import the data but do not classify it correctly without manual intervention.
## Rebasing Tokens Like stETH

Lido's stETH is a rebasing token. Your balance increases each day as staking rewards accrue, and each increase is treated by most practitioners as ordinary income at the fair market value of the additional tokens on the date received. A full year of holding stETH can produce 365 separate income entries, each with its own cost basis that must carry forward into any future sale or exchange of that portion of the token.
The complexity multiplies when you consider that some DeFi protocols distribute rewards per block. [Platforms like Aave or Curve](https://altcoininvestor.com/best-defi-protocols/) can generate hundreds of separate accrual events per day, and manually tracking fair market value at receipt for each event is not practical at scale. This is where a crypto tax calculator becomes essential, because the alternative is a spreadsheet with thousands of rows, each requiring a separate price lookup and cost basis calculation.
TokenTax's published documentation from September 2026 acknowledges that practitioners are taking different positions on liquid staking tax treatment, and the difference can amount to tens of thousands of dollars in income recognition timing for an active staker. The conservative position treats each rebase as income. The alternative view, less widely adopted, argues that no income occurs until you redeem stETH back to ETH, at which point the entire gain is recognized.
Most crypto tax software treats the initial ETH-to-stETH exchange as a taxable trade. You disposed of ETH and acquired stETH, triggering capital gains or loss on the ETH disposed. The software then imports each daily rebase as a separate deposit, and if the platform's pricing API has coverage for stETH on each rebase date, it will calculate income automatically. If pricing data is incomplete, the rebase imports as a transaction with zero cost basis, and you must manually research and input fair market value for each.
No vendor publicly documents what happens when historical pricing data for a rebasing token is unavailable. This is a known edge case that affects smaller or newer liquid staking derivatives, and the lack of documentation suggests that users are expected to handle it manually or accept zero-basis reporting, which overstates taxable income.
## Liquid Staking Derivatives: rETH versus stETH
Not all liquid staking tokens rebase. Rocket Pool's rETH maintains a fixed token count, and the value of each token appreciates relative to ETH as rewards accrue. This structure produces a different tax outcome: no daily income events, but a larger capital gain when you eventually sell or redeem rETH back to ETH.
The initial swap of ETH for rETH is treated by most platforms as a taxable disposal, identical to the stETH case. You exchanged one token for another, the transaction is a realization event, and any gain or loss on the ETH disposed is reportable. What differs is the ongoing treatment. Because rETH does not rebase, there are no daily income entries. The entire appreciation is unrealized until you dispose of the rETH, at which point it is reported as a capital gain rather than ordinary income.
For users in jurisdictions where ordinary income is taxed at higher rates than long-term capital gains, this structural difference matters significantly. A year of holding stETH might produce $5,000 in ordinary income across 365 rebase events, while a year of holding rETH produces zero income and a $5,000 capital gain on eventual sale, taxed at the lower long-term rate if held beyond one year. The yield is identical; the tax treatment is not.
The challenge for tax software is correctly identifying which liquid staking tokens rebase and which appreciate. Platforms that rely on automated transaction labeling often misclassify lesser-known derivatives, treating non-rebasing tokens as rebasing or vice versa. Koinly and CoinTracker have the most comprehensive token databases as of September 2026, but even these platforms occasionally misclassify newer assets, requiring manual correction.
## Cross-Chain Bridges
Bridging ETH from Ethereum to Arbitrum involves locking ETH on the source chain and receiving an equivalent token on the destination chain. The IRS has not issued specific guidance on whether this transaction is taxable. The conservative practitioner position, documented by CountDeFi in September 2026, treats most L1-to-L1 bridge transactions as Section 1001 dispositions because the destination-chain token is materially different property. The alternative view contends that bridging is equivalent to transferring crypto between two wallets you own, not a disposal, and therefore not taxable.
The problem is that vendor crypto tax software often treats bridge transactions as wallet-to-wallet transfers, which aligns with the more aggressive interpretation. Koinly's documentation states that most bridge transfers are handled automatically and appear as transfers, not disposals. Summ's help center describes the same structure: an outgoing component on the source chain and an incoming component on the destination chain, grouped as a bridge if timing and amounts match.
That classification gap drives recurring under-reporting across active multi-chain portfolios. If you bridge frequently and your software treats each bridge as a non-taxable transfer, but your tax preparer or auditor later applies the conservative position and treats each bridge as a taxable disposal, you will owe back taxes and potentially penalties on gains you did not report.
The correct approach depends on your risk tolerance and jurisdiction. In the absence of clear IRS guidance, the safer course is to treat bridges as taxable disposals, recognize any gain or loss at the time of bridging, and establish a new cost basis for the bridged token on the destination chain. If your software does not do this automatically, you will need to manually reclassify bridge transactions, which can involve dozens or hundreds of entries for a user active across Ethereum, Arbitrum, Optimism, Polygon, and Base.
## Reward Tokens Claimed At Stale Price
Airdrops and protocol reward claims present a specific documentation gap: the token is claimed on a particular date, but the historical price feed used by your tax software may not have coverage for that token on that date. The software imports the claim transaction, records it as income, but assigns a fair market value of zero because no price data exists. The result is zero reported income at claim and an artificially high capital gain when you later sell, because your cost basis was recorded as zero.
No major platform publicly documents how it handles reward claims where historical pricing is unavailable. The research notes indicate that platforms pull on-chain data and price each event to generate income reports automatically, but historical pricing data gaps are not addressed in any vendor's help documentation as of September 2026\. The implication is that when pricing fails, the user is responsible for researching fair market value at the date of receipt and manually entering it.
For high-frequency DeFi users who claim rewards from multiple protocols weekly, this becomes a significant manual workload. A year of weekly claims from three protocols produces 156 separate income events, and if even 20 percent lack automated pricing, you are manually researching and inputting fair market value for 31 transactions. The alternative is to accept zero-basis reporting, which overstates your eventual capital gains and results in overpayment of tax.
The platforms with the most comprehensive historical pricing coverage as of September 2026 are Koinly and CoinTracker, but even these occasionally fail on smaller or newer tokens. Blockstats, priced starting at $99 per year for 1,000 transactions, is noted in the research material as excelling at accurately classifying staking rewards as income and tracking reward emissions from Uniswap, Curve, and similar protocols, but its documentation does not address the stale-price edge case either.
## Which Platform Documents What
Koinly is described in the research material as the best crypto tax software for DeFi in 2026, with CoinTracker a close second. Koinly's help documentation acknowledges that DeFi auto-labeling requires manual review and that negative balance warnings are common. Pricing starts at $49 for the Hobbyist plan, which covers 100 transactions, but Koinly counts transactions cumulatively across your entire history, not per year. A wallet imported in 2021 still counts against your tier in 2026, which can push active DeFi users into higher-priced plans quickly.
CoinTracker's current pricing as of September 2026 lists the Base plan at about $59 for 100 transactions, with higher tiers around $199 to $249 at 1,000 transactions and a top self-service tier around $599 for 10,000 transactions. CoinTracker's strength is integration depth with major centralized exchanges and Coinbase in particular, but its DeFi handling is less thoroughly documented than Koinly's.
CoinLedger, priced starting at $49, ranges up to an Unlimited plan at $499 per year supporting unlimited transactions. CoinLedger's documentation emphasizes TurboTax integration, making it the shortest path from import to filing for U.S. users who already use TurboTax, but its DeFi-specific capabilities are less detailed in public documentation than Koinly's.
Summ is noted in the research compilation as ranking first based on real-world reconciliation strength for high-activity wallets and multi-chain users. Summ consistently produces cleaner starting outputs than most competitors, but its documentation on specific DeFi edge cases like rebasing tokens and stale reward pricing is not publicly detailed.
TokenTax, ZenLedger, and CoinTracking all start at $49 per tax year as of September 2026, but none publicly document handling of rebasing tokens, impermanent loss calculation, or reward token pricing gaps in detail. The absence of documentation does not mean these platforms fail to handle the cases, but it does mean that users cannot verify handling before committing to a paid plan.
## The Structural Problem: Cost Basis Compounding
The reason correct DeFi handling matters is not the current year's tax return. It is the cost basis that carries forward into every subsequent year. If your tax software incorrectly treats a liquidity pool deposit as a non-taxable transfer in 2024, your cost basis for the LP token is wrong. When you withdraw from the pool in 2026, the software calculates gain or loss based on that incorrect basis, and the error compounds.
A wrong cost basis on an LP position established in 2024 affects your 2024 return, your 2025 return if you claimed rewards, and your 2026 return when you exited the position. If the IRS questions any of those years, you will need to reconstruct the correct basis, amend multiple returns, and potentially pay penalties on the under-reported gains.
This is where DeFi tax reporting differs from exchange trading. An error on a Coinbase trade affects one tax year. An error on a Curve LP position can affect three or four years, because the position generates ongoing rewards, those rewards establish new cost basis, and the final withdrawal gain or loss depends on the cumulative accuracy of every prior transaction.
The research compilation notes that [DeFi staking rewards from platforms like Aave or Curve distribute per block in some cases](https://altcoininvestor.com/crypto-tax-calculator/), creating hundreds of income events per day, and that manually tracking this at scale is not practical. The implication is that if your software does not handle per-block reward accrual automatically, you either accept incomplete reporting or hire a specialist firm to reconstruct it manually, which costs significantly more than any software subscription.
## What Each Vendor Costs At Realistic DeFi Volume
Transaction volume matters more for DeFi users than for exchange traders because every liquidity pool interaction, every reward claim, and every rebase or per-block accrual counts as a separate transaction. A user who makes 50 trades per year on Coinbase might import 50 transactions. A user who provides liquidity to one Curve pool and holds stETH might import 800 transactions: 365 stETH rebases, 365 Curve reward accruals, and 70 deposits, withdrawals, and reward claims combined.
At that volume, Koinly's $49 Hobbyist plan, which supports 100 transactions, is insufficient. You need at least the Trader plan, which supports 1,000 transactions, but Koinly's pricing for that tier is not listed on the public pricing page referenced in the research compilation. CoinTracker's $199 to $249 tier supports 1,000 transactions, which covers a moderately active DeFi user. CoinLedger's Pro+ plan at $299 supports 10,000 transactions, and the Unlimited plan at $499 removes transaction limits entirely.
The cumulative counting structure Koinly uses is particularly punitive for DeFi users. If you imported a wallet in 2021 that has been continuously active in DeFi since then, every transaction from 2021 forward counts against your current tier. Five years of stETH rebasing is 1,825 transactions before you add a single trade or liquidity pool interaction. [This makes Koinly's effective cost significantly higher](https://altcoininvestor.com/koinly-pricing/) for long-term DeFi users than for users who start fresh each year.
## Who Each Platform Is Right For
Koinly is the documented best choice for users whose DeFi activity centers on Ethereum mainnet, who hold rebasing liquid staking tokens, and who are willing to manually review auto-labeled transactions to ensure correct classification. Koinly's token database is the most comprehensive, its documentation the most explicit about what requires manual review, and its pricing structure transparent about cumulative transaction counting. If you have been active in DeFi since 2021 and need a platform that can reconstruct historical cost basis correctly, Koinly is the platform to start with.
CoinTracker is right for users whose DeFi activity is secondary to centralized exchange trading and who prioritize integration depth with Coinbase and other U.S. exchanges. CoinTracker's DeFi documentation is less detailed than Koinly's, but its user interface is more polished, and its pricing structure is more predictable for users who do not need to import five years of cumulative history.
CoinLedger is the correct choice for U.S. users who file with TurboTax and want the most direct integration path from import to filing. CoinLedger's Unlimited plan at $499 removes transaction-count concerns entirely, making it cost-effective for very high-volume DeFi users, but its DeFi-specific documentation does not match Koinly's depth.
Summ is right for users with high-activity wallets across multiple chains who need the cleanest possible starting reconciliation. Summ's strength is reducing the manual cleanup workload for complex multi-chain portfolios, but its documentation on specific DeFi edge cases is less public than Koinly's, so you are relying on the platform's reconciliation algorithms to handle cases that are not explicitly documented.
## The Recommendation
Start with Koinly if your DeFi activity includes liquidity pools, rebasing tokens, or frequent cross-chain bridging. Koinly's documentation is the most explicit about what it handles automatically and what requires manual review, and that transparency is more valuable than a polished interface when your cost basis accuracy depends on correct classification of hundreds of transactions.
If Koinly's cumulative transaction counting pushes you into a higher pricing tier than you are willing to pay, CoinLedger's Unlimited plan at $499 is the next best option for high-volume users. For users who prioritize ease of use over exhaustive DeFi documentation, CoinTracker is a defensible second choice, but expect to spend more time on manual reclassification than you would with Koinly.
For users active across Ethereum, Arbitrum, Optimism, Polygon, and Base, consider running Summ in parallel with Koinly for the first import. Summ's reconciliation strength can catch bridge transactions and cross-chain transfers that Koinly's automated labeling misses, and comparing the two outputs will surface discrepancies that require manual correction before you finalize your tax report.
## What The Vendors Do Not Document
No platform publicly documents automated impermanent loss calculation. The research compilation states that no vendor lists this capability on official pricing pages or in help documentation, which means you are expected to calculate impermanent loss manually and adjust transaction classifications accordingly.
No platform publicly documents handling of reward token claims where historical pricing is unavailable. When a token claim imports but the pricing API has no data for that token on that date, the documentation is silent on whether the platform assigns zero value, estimates from nearby dates, or flags the transaction for manual input. This gap affects every DeFi user who claims rewards from newer or smaller protocols.
No platform publicly documents its position on cross-chain bridge tax treatment. Koinly and Summ both state that bridges are treated as transfers by default, but neither documentation page addresses the conservative practitioner position that treats bridges as taxable disposals. [The classification gap is left for the user to resolve](https://altcoininvestor.com/best-hardware-wallet-for-defi/), either by accepting the software's default or by manually overriding every bridge transaction to treat it as a disposal.
## The Takeaway
DeFi tax reporting is not a software problem that will be solved by better user interfaces or cheaper pricing tiers. It is a documentation problem. The vendors that explicitly document what they handle automatically, what requires manual review, and where their pricing APIs have coverage gaps are the vendors whose outputs you can trust. Koinly's willingness to state in public documentation that DeFi auto-labeling needs manual review and that negative balance warnings are common is more valuable than a competitor's polished dashboard that hides the same problems behind automated processing that fails silently. The cost of a wrong cost basis on a liquidity pool position established in 2024 is not the subscription fee you pay in 2026\. It is the compounding error that affects three years of returns and the penalty the IRS assesses when the discrepancy is eventually discovered.
## Frequently Asked Questions
### Does crypto tax software automatically calculate impermanent loss from liquidity pools?
No major vendor publicly documents automated impermanent loss calculation as of September 2026\. Liquidity pool deposits and withdrawals import as transactions, but the software does not automatically compare the value of tokens deposited to the value of tokens withdrawn and report the difference as a deductible capital loss. You must calculate impermanent loss manually and adjust transaction classifications to reflect the realized loss when you exit the pool. This is a significant gap for active liquidity providers.
### How do tax platforms handle stETH daily rebasing for income reporting?
Most platforms treat each daily stETH rebase as a separate income event, importing it as a deposit and calculating fair market value at the time of receipt using the platform's pricing API. A full year of holding stETH produces 365 income entries. If the pricing API has complete coverage for stETH on each rebase date, income is calculated automatically. If pricing data is missing for any date, that rebase may import with zero cost basis, requiring manual research and input of fair market value.
### Are cross-chain bridge transactions taxable disposals or just transfers?
The IRS has not issued specific guidance. The conservative practitioner position treats most layer-1 to layer-1 bridge transactions as taxable disposals under Section 1001, because the destination-chain token is legally distinct property. The alternative view treats bridging as a non-taxable transfer between wallets you own. Most crypto tax software defaults to the transfer treatment, but that creates audit risk if your preparer or the IRS later applies the conservative position. The safer approach is to manually reclassify bridges as disposals.
### What happens when tax software cannot find historical price data for a reward token I claimed?
No vendor publicly documents this scenario. When a reward claim imports but the pricing API has no data for that token on the claim date, the transaction typically records with zero fair market value. This results in zero reported income at claim and an artificially high capital gain when you sell, because your cost basis was zero. You must manually research the token's fair market value on the claim date and input it to avoid overstating capital gains and overpaying tax.
### Why does transaction volume matter more for DeFi users than exchange traders?
Every liquidity pool interaction, reward claim, and rebasing token accrual counts as a separate transaction. A user making 50 exchange trades per year imports 50 transactions. A user providing liquidity to one Curve pool and holding stETH might import 800 transactions in the same year: 365 stETH rebases, 365 Curve reward accruals, and 70 deposits, withdrawals, and claims. Pricing tiers that seem adequate for exchange trading become insufficient quickly once DeFi activity is added, especially on platforms like Koinly that count transactions cumulatively across all years.
Tool mentioned above
Koinly
Koinly imports from 800+ exchanges and wallets and handles the DeFi cases most tools get wrong - rebasing tokens, LP positions, staking rewards.
[Try Koinly](https://koinly.io/?via=F6E2E35A&utm%5Fsource=affiliate)
We may earn a commission if you sign up through this link, at no cost to you. It does not change what gets recommended.
The Weekly Yield Report
You have just reviewed the documented DeFi handling capabilities of eight platforms as of September 2026\. Those capabilities and pricing structures will change by next tax season.
Every Thursday: where crypto yield actually is - stablecoins, liquid staking and DeFi lending, with the risk named next to the rate and what changed since last week.
[Get it free every Thursday](#/portal/signup)
Free. No trade calls, no allocations, no hype. Unsubscribe in one click.
### NFT Rental Platforms Compared: reNFT vs IQ vs Double
URL: https://altcoininvestor.com/best-nft-rental-platform-comparison/
Last updated: 2026-09-24T16:06:38.000Z
## Fee Structure: What You Pay To List And What You Keep
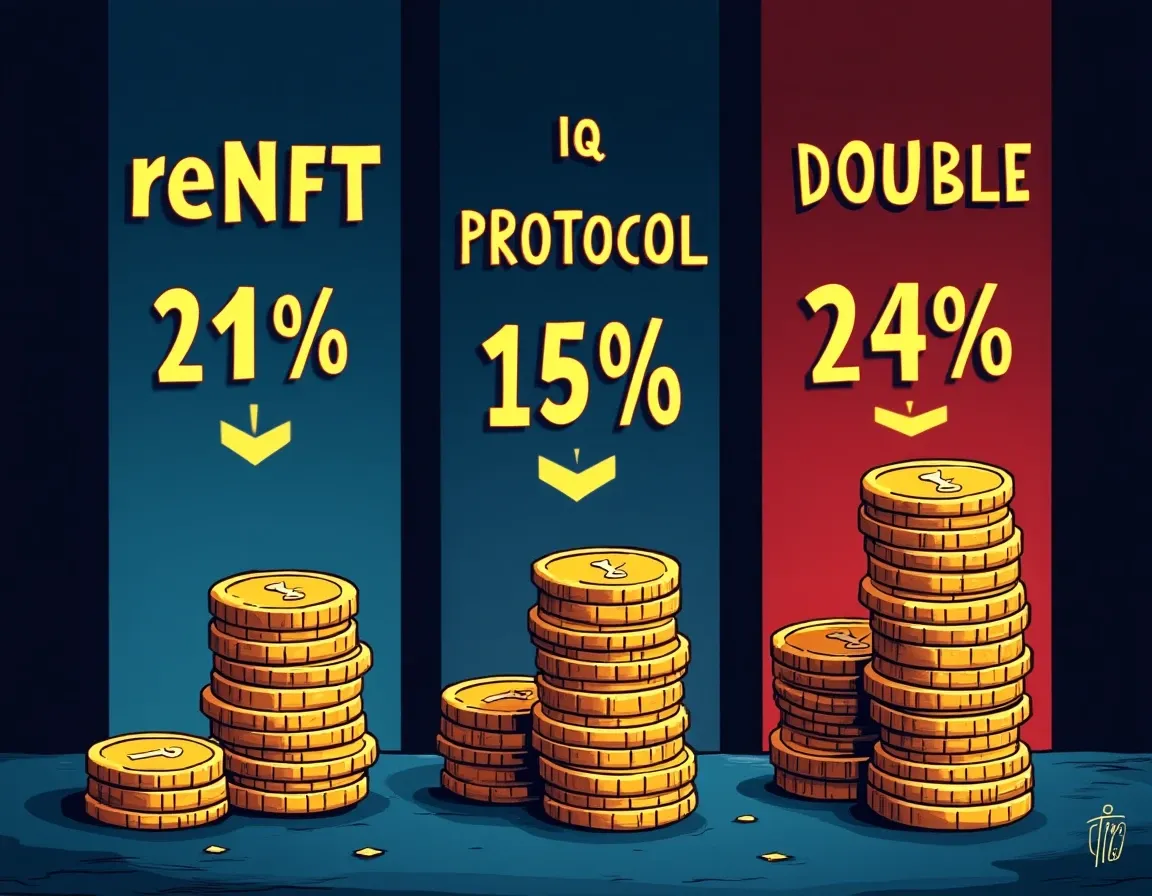
reNFT charges zero fees as of May 2025\. The protocol eliminated all transaction fees to drive adoption across gaming and metaverse projects. According to the official reNFT documentation, future fees will be percentage-based with revenue shared between the protocol and integrated projects, but no launch date or rate has been published.
That makes reNFT the cheapest option today, but not necessarily tomorrow.
IQ Protocol does not publish a global platform fee. Instead, IQVerse (the marketplace layer) allows customizable rental fees, payment tokens, and revenue splits. Lenders set the rental price. The protocol then distributes revenue across three parties: the IQVerse operator, the NFT holder, and the protocol treasury. The exact split varies by integration and is visible per listing on the IQ Market interface.
Double Protocol uses a performance-based pricing model where rental fees adjust based on the NFT's earning potential. The protocol does not publish a fixed platform fee. Lenders set rental fees, and the platform tracks yield data to ensure fair compensation. Double also offers a unique "rental pool" feature where multiple users collectively rent expensive NFTs and split the utility cost.
On the numbers: if you rent a gaming NFT generating 8% monthly yield, reNFT currently lets you keep 100% of what the renter pays (zero platform fee). IQ Protocol's revenue split might reduce that to 85-92% depending on the IQVerse configuration. Double Protocol's performance-based model adjusts the rental price dynamically, so your net income depends on how accurately the protocol tracks and prices the underlying yield.
One thing worth noting: reNFT's zero-fee advantage disappears the moment the protocol activates its planned fee structure. If you're building a long-term [NFT rental income](https://altcoininvestor.com/how-to-rent-out-nfts-for-income/) stream, assume reNFT will eventually charge fees comparable to IQ and Double.
## Collateral Requirements: Who Holds The Risk
reNFT offers two paths. The first is collateral-free, where the renter pays the rental fee and receives use rights without depositing collateral. This path only works if the NFT's project integrates reNFT's rental registry. If the game, metaverse, or gated app does not check the registry to verify who currently holds use rights, the renter gains nothing and the rental fails.
The second path is collateralized. The lender sets a collateral amount, typically pegged to the NFT's floor price or replacement cost. The renter deposits that collateral, receives the NFT for the rental period, and must return it to reclaim the collateral. If the floor price rises during the rental, the renter has an incentive to keep the NFT and forfeit the collateral.
That creates a floor-price arbitrage risk that the lender must actively monitor.
IQ Protocol eliminates collateral entirely through the Warper pattern. The original NFT is locked in a smart contract. The renter receives a wrapped expirable version (the Warper) that contains all metadata and utility but expires at the end of the rental period. The renter cannot sell or transfer the original NFT because they never hold it. When the rental expires, the Warper becomes worthless and the original automatically returns to the lender's wallet.
Default is structurally impossible.
Double Protocol uses a similar model. Ownership never transfers to the renter. Instead, a doNFT (a token containing all the original's metadata) is transferred to the renter. As long as rental payments continue, the doNFT remains active and mapped to the original. If the renter stops paying, the doNFT expires automatically and permissions are revoked across all integrated dApps. The protocol is built on ERC-4907 and ERC-5006 standards, which define dual-role architecture: the owner holds the asset, the user holds the rental right.
Measured by collateral exposure: reNFT's collateralized path places full floor-price risk on the lender. IQ and Double shift that risk to the protocol's expiration mechanism. The trade-off is smart contract risk (if the Warper or doNFT expiration logic fails, the lender could lose the NFT) versus manual monitoring risk (if the lender misprices collateral on reNFT, they lose money).
The interesting variable is whether you trust the protocol's code more than you trust your ability to track floor prices in real time.
## Rental Default Mechanics: What Happens When Things Break
On reNFT's collateralized path, default is a manual process. If the renter does not return the NFT by the agreed end date, the lender claims the collateral. The lender must actively monitor the rental period and floor price. If the NFT's value rises above the collateral amount during the rental, the renter profits by keeping the NFT and forfeiting the lower-value collateral.
This happened multiple times in 2023 when gaming NFTs spiked 40-60% during unexpected game updates or tournament announcements.
On reNFT's collateral-free path, there is no default mechanism because the NFT never leaves the lender's wallet. The renter receives use rights via the registry. If the project does not integrate the registry, the renter has no functional access and the rental is worthless, but no asset is at risk.
IQ Protocol makes traditional default impossible. The renter holds a Warper, not the original NFT. The Warper expires at the end of the rental period and becomes non-functional. The original NFT is released from the smart contract escrow and returns to the lender's wallet automatically. There is no return transaction for the renter to skip.
Double Protocol uses the same auto-expiration model. The doNFT expires when the rental period ends or when the renter stops paying. Permissions are revoked instantly across all integrated dApps. The lender does not need to reclaim anything because ownership never transferred in the first place.
Worth watching: both IQ and Double depend on the expiration mechanism executing correctly. If a smart contract bug delays or blocks expiration, the lender's NFT remains locked. reNFT's collateralized model avoids that risk but introduces the manual monitoring burden. The trade is automated convenience versus manual control.
## Supported Chains And Integration Depth
reNFT operates on Ethereum, Polygon, and Avalanche. The protocol uses role-based access in its v2 architecture, where a registry contract assigns a "renter role" to the wallet holding use rights. Integration is minimal for projects: a simple SDK ping or API check to verify who currently holds the renter role. reNFT also integrates with Gnosis Safe and Seaport for advanced custody and marketplace functionality.
The [GitHub repository](https://github.com/re-nft) shows active development across all three chains, with recent commits focused on gas optimization and SDK improvements.
IQ Protocol supports Polygon and BNB Chain as of May 2025\. The roadmap published in Q1 2024 listed Arbitrum, Avalanche, and Solana as planned additions, though no firm deployment dates were announced. Integration is more complex than reNFT: each project must deploy a Warper contract specific to the NFT collection and utility. That Warper defines how the wrapped expirable version behaves, what metadata it carries, and which permissions it grants.
The protocol has 30-plus active partnerships, which demonstrates that the integration effort is manageable for serious projects.
Double Protocol is deployed on Ethereum and BNB Chain. The platform authored the ERC-4907 and ERC-5006 standards, which means any project adopting those standards natively supports Double Protocol rentals. Current integrations include Decentraland (virtual land) and Warena (in-game assets). Integration requires ERC-4907 compliance, which older NFT collections do not support without a contract upgrade or wrapper.
Measured by coverage: reNFT has the broadest current chain support. IQ has the most aggressive expansion roadmap. Double has the structural advantage of owning the rental standards, which gives it long-term interoperability if ERC-4907 adoption grows.
## Asset Type Fit: Which Platform Works For Which NFT
reNFT fits utility NFTs where the project integrates the rental registry. Gaming assets, metaverse land, and membership passes work well if the game or dApp checks the registry to verify use rights. The collateralized path also works for generalized P2P rentals where trust is low and floor price is stable. If you're renting out a Bored Ape for an event appearance, the collateral model makes sense.
If the NFT has no utility or the project does not integrate reNFT, the platform adds no value.
IQ Protocol is strongest for GameFi and in-game assets where revenue-sharing makes sense. The Warper model allows renters to earn yield from the NFT (staking rewards, tournament prizes, guild income) and split that yield with the lender. The platform supports three pricing models: fixed fee, reward sharing, or a combination. That flexibility fits assets with variable or performance-based income.
One thing worth noting: the Warper can only be used in recognized IQVerse integrations. If you try to use the wrapped NFT in an external platform that does not recognize the Warper contract, it will not function.
Double Protocol fits structured utility NFTs where ownership and usage are clearly separated. In-game items, virtual land, and access keys work well because the doNFT can carry all metadata and permissions while the original remains locked. The protocol's performance-based pricing model works best when the NFT's earning potential is trackable (staking yield, rental income from metaverse land, access fee revenue).
Double's rental pool feature is unique: multiple users can collectively rent a high-value NFT and split the utility. That fits expensive metaverse land or rare gaming assets where individual rental cost is prohibitive.
Historically, the highest rental yields come from utility NFTs in active games or metaverses. Data from Q3 2024 showed gaming NFTs on Polygon generating 6-12% monthly rental income, with metaverse land on Ethereum averaging 3-8%. Those numbers only materialize when the platform integrates with the project and the renter can actually use the NFT.
If you're building rental income from NFTs, [flipping strategies](https://altcoininvestor.com/how-to-flip-nfts-for-profit-2/) and [royalty income](https://altcoininvestor.com/how-do-nft-royalties-work-2/) are alternative paths worth comparing.
## Revenue And Incentive Models: How You Actually Get Paid
reNFT uses direct P2P payment. The renter pays the lender the agreed rental fee for the rental period. If the rental is reward-share (where the renter and lender split income generated by the NFT), both parties agree to the split upfront and the protocol facilitates distribution. The lender receives payment in the token agreed upon at listing (ETH, USDC, or project-specific tokens).
No intermediary fee currently applies, so the lender keeps 100% of the rental fee minus gas costs.
IQ Protocol splits revenue across three parties: the IQVerse operator, the NFT holder (lender), and the protocol treasury. The exact split is configurable per IQVerse and visible at the listing level. Revenue is distributed immediately at the end of the rental period. The protocol supports multiple payment tokens, and revenue can be converted to other assets via integrated DEX swaps.
The three-party split reduces net income compared to reNFT's direct model, but the trade-off is deeper integration and yield-tracking across GameFi ecosystems.
Double Protocol lets lenders set rental fees and offers a unique sub-rental feature. A renter can re-rent the doNFT to another user and earn the spread between what they pay and what they charge. That creates a secondary rental market where liquidity providers can earn without owning the original NFT. The protocol does not publish a fee-sharing model, so net income depends on the lender's pricing and the renter's ability to sub-rent.
Measured by take-home income: reNFT currently offers the highest net percentage (100% minus gas). IQ reduces that by 8-15% depending on the IQVerse split. Double's net income varies based on sub-rental activity and performance-based pricing adjustments.
## Edge Cases And Failure Modes: Where Each Platform Breaks
reNFT's collateralized model fails when the lender sets collateral too low and the NFT's floor price rises during rental. A gaming NFT worth 0.5 ETH at rental start might spike to 0.9 ETH during a tournament. If the collateral was set at 0.5 ETH, the renter profits by keeping the NFT and forfeiting the collateral. The lender loses the NFT and receives only the original collateral value.
This requires active monitoring and dynamic collateral adjustment, which most lenders do not perform.
reNFT's collateral-free model fails when the project does not integrate the rental registry. The renter pays the fee but receives no functional access because the game or dApp does not check who holds use rights. The rental generates zero value. That risk disappears if you verify integration before listing, but many lenders skip that step.
IQ Protocol's Warper model fails if the wrapped NFT is used outside a recognized IQVerse. The Warper carries metadata but not universal interoperability. If the renter tries to use the Warper in an external platform or game that does not recognize the IQ Protocol contract, it will not function. That limits utility to IQ-integrated ecosystems.
There is also revenue-share exploit potential: if the renter bypasses the platform and claims 100% of yield directly from the game or staking contract, the lender receives nothing. That depends on whether the game enforces yield splits via the Warper contract or trusts off-chain reporting.
Double Protocol's doNFT model fails if the NFT collection does not comply with ERC-4907 or ERC-5006\. Older NFT collections built on standard ERC-721 cannot use Double Protocol without a contract upgrade or wrapper deployment. That excludes a large portion of legacy NFTs from the platform.
The performance-based pricing model also introduces oracle risk. If the protocol relies on external data feeds to track the NFT's earning potential, a feed failure or manipulation can misprice rentals and reduce lender income. Double has not published details on how yield data is sourced or validated.
One thing worth noting across all three platforms: smart contract risk is universal. A bug in the rental contract, escrow mechanism, or expiration logic can lock NFTs or fail to distribute payments. reNFT, IQ, and Double have all undergone audits, but code vulnerabilities remain the primary failure mode for any DeFi protocol.
If you're evaluating protocol risk more broadly, [multisig governance audits](https://altcoininvestor.com/how-to-check-protocol-multisig-before-depositing/) and [protocol terms monitoring](https://altcoininvestor.com/how-to-check-if-defi-protocol-changed-terms-3/) are relevant checks.
## Who Each Platform Is Right For
Use reNFT if you want zero fees today and are willing to manage collateral or verify project integration. The platform fits lenders who rent gaming NFTs or metaverse land in projects that have integrated the reNFT registry. It also fits collateralized rentals where you trust your ability to monitor floor prices and adjust collateral in real time.
Avoid reNFT if the NFT's project has not integrated the registry and you're relying on collateral-free rentals. Verify integration before listing.
Use IQ Protocol if you rent GameFi assets with variable yield and want automated revenue splits. The Warper model fits renters who earn staking rewards, tournament prizes, or guild income and need the protocol to enforce yield-sharing. IQ works well for lenders who want zero collateral exposure and are comfortable with the three-party revenue split.
Avoid IQ if your NFT is on a chain IQ does not support (anything outside Polygon and BNB Chain as of May 2025) or if the project has not deployed a Warper contract.
Use Double Protocol if you rent NFTs that comply with ERC-4907 or ERC-5006 and want performance-based pricing. The platform fits metaverse land, in-game items, and membership passes where earning potential is trackable. Double's rental pool feature is the only option if you want to collectively rent high-value NFTs with other users.
Avoid Double if your NFT is a legacy ERC-721 collection without ERC-4907 compliance or if you need broad chain coverage beyond Ethereum and BNB.
## Recommendation: Which Platform To Use First
Start with reNFT if your NFT is on Ethereum, Polygon, or Avalanche and the project has integrated the rental registry. The zero-fee structure maximizes net income during the current adoption phase. Use the collateral-free path if integration is confirmed. Use the collateralized path only if you can monitor floor prices daily and adjust collateral before spikes.
If the project has not integrated reNFT or you want to avoid collateral management, use IQ Protocol. The Warper model eliminates default risk and works well for GameFi assets on Polygon or BNB Chain. Accept the 8-15% revenue split as the cost of automated expiration and yield enforcement.
If your NFT complies with ERC-4907 and generates trackable yield, use Double Protocol. The performance-based pricing model ensures you're compensated fairly as the asset's earning potential changes. The rental pool feature is valuable for expensive NFTs where individual rental demand is low but collective demand is high.
Do not spread rentals across all three platforms simultaneously. Each platform requires listing effort, integration verification, and ongoing monitoring. Pick the one that fits your NFT's chain, standard, and integration status, then measure income over 30 days before expanding.
## The Takeaway: Fee Structure And Default Risk Are Not Separable
The platform with the lowest fee is not necessarily the one that nets you the most income. reNFT charges zero today but shifts all default risk to the lender via collateral management or integration dependency. IQ charges 8-15% but eliminates default through expiration. Double uses dynamic pricing but excludes legacy NFTs. The decision rule is simple: if the NFT's project integrates reNFT and you can monitor collateral, use reNFT. If the NFT generates variable GameFi yield on Polygon or BNB, use IQ. If the NFT complies with ERC-4907 and earns trackable yield, use Double. The platform that fits your asset's chain, standard, and integration is the one that works.
## Frequently Asked Questions
### Which NFT rental platform has the lowest fees?
reNFT currently charges zero fees to stimulate adoption, though a percentage-based fee structure is planned for the future. IQ Protocol and Double Protocol use configurable fee models where lenders set rental prices and revenue splits vary by platform integration. The lowest-fee option depends on whether reNFT's free period is still active when you list your NFT.
### Do I need collateral to rent out NFTs on these platforms?
IQ Protocol and Double Protocol require zero collateral for all rentals because the original NFT never leaves your wallet. reNFT offers both collateral-free rentals (when the project integrates reNFT's registry) and collateralized rentals where you set the collateral amount. Collateral-free doesn't eliminate risk; it shifts risk from the renter's wallet to the smart contract's expiration mechanism.
### What happens if a renter doesn't return my NFT?
On reNFT's collateralized path, you claim the collateral if the renter fails to return the NFT by the agreed date. On IQ Protocol, the renter receives a wrapped expirable version that automatically returns the original to your wallet when the rental period ends. Double Protocol uses the same auto-expiration model via doNFT tokens that expire and revoke permissions without requiring the renter to return anything.
### Which chains do these NFT rental platforms support?
reNFT supports Ethereum, Polygon, and Avalanche. IQ Protocol currently operates on Polygon and BNB Chain, with a 2024 roadmap including Arbitrum, Avalanche, and Solana. Double Protocol is deployed on Ethereum and BNB Chain. If your NFT is on a chain not supported by a platform, you cannot rent it through that protocol.
### Can I earn rental income from any NFT on these platforms?
No. Rental income depends on the NFT having utility that persists during rental (gaming assets, metaverse land, membership access). On reNFT, collateral-free rentals require the project to integrate reNFT's registry. On IQ Protocol, the project must deploy a Warper contract. On Double Protocol, the NFT must comply with ERC-4907 or ERC-5006 standards. Random art NFTs without project integration generate no rental demand.
The Weekly Yield Report
You just compared three platforms with fee structures ranging from zero to performance-based and collateral models spanning manual to auto-expiring. Those mechanics and integrations will shift as protocols compete.
Every Thursday: where crypto yield actually is - stablecoins, liquid staking and DeFi lending, with the risk named next to the rate and what changed since last week.
[Get it free every Thursday](#/portal/signup)
Free. No trade calls, no allocations, no hype. Unsubscribe in one click.
### How Ethena's Yield Works (And Why It Might Not Last)
URL: https://altcoininvestor.com/how-ethena-yield-works/
Last updated: 2026-09-24T15:10:15.000Z
## The Mechanism: Delta-Neutral Basis Trading
The Ethena protocol advertises approximately 7% APY on sUSDe as of June 2026, down from 9.4% in April and 18% during 2024\. The question worth answering is where that yield actually comes from - and what happens when the underlying mechanism inverts.
Ethena's USDe is a synthetic dollar backed by a delta-neutral basis trade. The protocol holds long staked ETH and liquid restaking collateral, then shorts an equivalent notional value of ETH perpetual futures. The hedge cancels directional price exposure: when ETH's price rises, the long position gains while the short position loses by the same amount, keeping the portfolio's USD value constant. When ETH falls, the inverse occurs. The result is a stablecoin whose collateral backing moves with the market but whose net value does not.
To earn yield on this structure, you stake USDe for sUSDe through an ERC-4626 vault. Staking one USDe mints one sUSDe; burning one sUSDe redeems one USDe after a seven-day cooldown period. The cooldown was added in 2024 to manage redemption queues during stress events. Instead of distributing new tokens as interest, each sUSDe gradually accrues more USDe in value as yield compounds. The protocol does not pass negative revenue to stakers; when funding rates flip negative, the insurance fund absorbs losses before stakers see any reduction in value.
Where the European Central Bank has moved cautiously on stablecoin regulation under MiCA, Ethena operates outside those guardrails entirely. The protocol's collateral is held by Off-Exchange Settlement custodians - Copper, Ceffu, and Cobo - who execute perpetual futures positions across Binance, Bybit, OKX, and Deribit. Roughly 48% to 50% of Ethena's short positions are on Binance alone. That concentration carries counterparty risk of the sort European banking union rules were designed to mitigate: a single exchange failure, liquidity freeze, or margin call cascade can compromise half the protocol's hedging capacity.
## Where the 7% to 18% APY Actually Comes From

Ethena's yield derives from three sources, with variable contribution depending on market conditions: funding rates from short perpetual futures positions, ETH staking rewards from liquid staking tokens held as collateral, and interest on stablecoins and tokenized Treasury products used to backstop the system during low-funding periods.
The largest component is perpetual funding. During bull markets, when traders queue up to go long on ETH and BTC, demand for long positions drives funding rates high - sometimes above 30% annualized during peak periods. Ethena, holding the short side of those contracts, collects those payments and distributes them as sUSDe yield. Historical data shows ETH perpetual funding returned approximately 16% in 2021, 0.6% in 2022, 9% in 2023, and 13% in 2024 on an open-interest-weighted basis. Across the full dataset, 17.5% of days showed negative cumulative funding for ETH perpetuals, with an average return over the entire period of 9.15%.
ETH staking rewards add a second layer. The protocol's collateral basket includes liquid staking tokens such as stETH, which earn the underlying Ethereum network's staking yield - currently between 3% and 4% annually. This component is relatively stable and independent of funding rate volatility, providing a baseline yield floor in most market environments.
The third source, introduced as a buffer during compressed funding environments, is interest from liquid stablecoins and tokenized Treasury products, including BlackRock's BUIDL fund. In May 2026, Ethena routed additional collateral to BUIDL, lifting the Treasury-bill share of reserves above 15% for the first time. During periods of low or negative perpetual funding, more of USDe's backing assets shift into these liquid stables earning approximately the U.S. Treasury rate. This dynamic allocation reduces exposure to negative funding and lessens the probability that the reserve fund is drawn down.
The interplay of these three sources explains why sUSDe's APY has ranged from 4% to 60% since launch. When funding rates compress, as they did through Q2 2026, the protocol leans more heavily on staking yield and T-bill income, bringing the effective APY down to the mid-single digits. When funding spikes during bull runs, the short perp leg dominates, pushing yields into the teens or higher. [Understanding where yield originates](https://altcoininvestor.com/best-defi-protocols/) is the difference between recognizing a sustainable mechanism and mistaking token emissions for income.
## The Specific Conditions That Break the Mechanism

Ethena's yield structure works as long as perpetual funding remains neutral to positive and the delta hedge holds. Two failure modes matter: sustained negative funding rates, and counterparty or liquidity collapse that prevents the protocol from maintaining the hedge.
During bear markets, the dynamic reverses. Traders want short exposure, demand for shorts rises, and funding rates turn negative. The protocol's short perp positions then pay funding rather than receive it, draining the insurance fund. Historically, BTC perpetual funding turned deeply negative during the 2022 bear market, particularly around the Terra/UST collapse in May 2022, when market participants rushed to hedge or short. When funding rates stay negative for extended periods - several weeks or longer - the reserve fund begins to deplete. Ethena's own V1 stress test estimated that the fund, which stood at approximately 1.4% of USDe supply during the test, would exhaust in roughly 52 days under moderately bearish conditions.
October 2025 provided a real-world stress case. A $19 billion crypto liquidation cascade triggered $8 billion in USDe outflows and a brief depeg to $0.65 on Binance. USDe supply fell from $14.8 billion to $3.8 billion over the following months - a 74% contraction. The insurance fund, which stood at $73 million in late 2026 (approximately 1.7% of supply), absorbed losses during the initial shock, but the protocol's pro-cyclical supply dynamics amplified the downturn: as yield compressed and negative funding persisted, users redeemed en masse, forcing the protocol to unwind positions into an illiquid and hostile market.
The second failure mode is counterparty risk. USDe's peg is maintained by the delta-neutral hedge; if the short perp positions cannot be maintained - due to exchange insolvency, mass liquidation cascades, or extreme negative funding that exhausts margin - the peg can break. Ethena's concentration on Binance, which holds roughly half the protocol's short positions, means that a liquidity freeze, regulatory action, or technical failure at that single exchange could compromise the entire hedging structure. European banking regulations impose concentration limits and capital adequacy requirements specifically to prevent single points of failure of this kind; Ethena operates without equivalent constraints.
The reserve fund is too small to absorb extended stress. At $73 million against $4.4 billion in USDe supply, it covers 1.7% - enough to buffer short-term volatility or brief funding inversions, but insufficient for a multi-week bear market with sustained negative funding and mass redemptions. The protocol's dynamic allocation to Treasury products mitigates but does not eliminate this risk; if funding turns sharply negative while markets are illiquid, the reallocation itself may be delayed or incomplete.
## Historical Basis Rate Data and Realistic Yield Expectations
European monetary history offers a parallel for what Ethena advertises. Greek sovereign bonds in 2010 and 2011 paid yields significantly above German Bunds - not because Greece was more creditworthy, but because the spread reflected default risk. The advertised yield was not a return; it was compensation for the probability that principal would not be returned. When credibility broke in 2012, those yields stopped being yields and became disclosed losses.
Ethena's 18% to 60% APY during 2024 and early 2025 was not a sustainable equilibrium; it was the result of high funding rates during a bull market, compounded by the protocol's early-stage capital inflows and relatively small total supply. As USDe supply scaled and funding rates normalized through 2025 and 2026, yields compressed to a range between 4% and 15%. The June 2026 trailing seven-day APY of 7.1% is closer to the structural yield floor: a blend of mid-single-digit funding carry, 3% to 4% staking yield, and Treasury-rate income on reallocated collateral.
Over the next 12 months, expect sUSDe yields to track perpetual funding volatility. In a sideways or mildly bullish market, mid-single-digit yields (4% to 8%) are plausible. If a fresh bull market drives funding rates higher, yields could return to the low teens temporarily. If markets turn bearish and funding inverts for weeks, yields will compress toward zero or turn negative internally, with the insurance fund absorbing losses until it depletes or users redeem en masse. The October 2025 case study demonstrated that supply can contract by 70% or more when conditions turn hostile, and that brief depegs are possible during extreme liquidation cascades.
Comparing Ethena's yield to traditional savings clarifies the opportunity cost. A holder keeping $1 million in USDC at 0% while sUSDe pays 4% and USDY pays 4.5% on the same chain implicitly surrenders $40,000 to $45,000 in annual yield. That visible gap, not protocol hype, drove $22.7 billion into yield-bearing DeFi structures. But the gap exists because the risk stack differs: USDC carries custodial and regulatory risk but no funding-rate exposure or delta-hedge counterparty risk; sUSDe carries all of those, plus the structural risk that the basis trade inverts and the insurance fund proves inadequate.
[Real-time collateral composition and reserve fund data](https://defillama.com/protocol/ethena) are published on Ethena's transparency dashboard. Monitoring funding rates, collateral allocation shifts, and insurance fund balance is the only way to assess whether current yields remain supported by the underlying mechanism or are being paid down from reserves.
## What This Means for Your Yield Position
Ethena tokenized a basis trade that institutional desks have run for decades. The innovation is making it accessible at retail scale and wrapping it in an ERC-4626 vault that auto-compounds. The risk is that the mechanism depends on market conditions - specifically, that perpetual funding remains neutral to positive and that exchanges remain liquid and solvent.
If you hold sUSDe, you are long a delta-neutral strategy with three embedded risks: funding-rate inversion, counterparty failure, and insufficient reserve coverage during extended stress. The 7% APY currently advertised is credible in the present funding environment, but it is not guaranteed. October 2025 demonstrated that yields can vanish, supply can contract by three-quarters, and brief depegs are possible when liquidation cascades overwhelm the hedge.
Position sizing matters. The appropriate allocation to sUSDe is the amount where a total loss would be annoying rather than catastrophic. Position-sizing frameworks by portfolio size and [exit condition monitoring](https://altcoininvestor.com/when-to-exit-defi-position/) are worth reviewing before depositing capital. If you are earning 7% on sUSDe while holding the rest of your stablecoin portfolio in 0% USDC, you are making a choice: you are trading custodial simplicity and zero market-condition risk for a 700-basis-point spread that exists because the underlying mechanism can fail.
The seven-day cooldown on unstaking is worth remembering. If funding rates flip negative and you decide to exit, you will wait a week before your sUSDe converts back to USDe. In a fast-moving market, that delay can matter. During the October 2025 event, users who initiated unstaking during the initial cascade faced a week of price uncertainty before redemption completed.
Tax reporting for sUSDe follows the same rules as other yield-bearing tokens. Each sUSDe accrues more USDe in value rather than distributing new tokens, which may create taxable events on an ongoing basis depending on jurisdiction. [DeFi yield tax-reporting requirements](https://altcoininvestor.com/defi-yield-tax-reporting/) vary by country, and the difference between rebasing tokens and value-accruing vaults can change how and when income is recognized.
Security hygiene remains essential. sUSDe is an ERC-20 token; if you have granted unlimited approvals to DeFi protocols in the past, those approvals remain active until explicitly revoked. [Revoking token approvals](https://altcoininvestor.com/how-to-revoke-token-approvals/) and [securing yield positions without making them unusable](https://altcoininvestor.com/how-to-secure-defi-wallet/) are baseline practices for anyone holding yield-bearing assets.
## The Takeaway
Ethena's sUSDe yield is credible in the current market environment, but it is not structural. The 7% APY reflects neutral-to-positive perpetual funding, stable staking rewards, and a functioning delta hedge across multiple exchanges. The mechanism worked through most of 2024 and 2025, delivering mid-to-high single-digit yields with brief spikes above 15% during bullish periods. It broke in October 2025 when funding inverted, supply contracted by 74%, and the peg briefly failed on Binance.
The question that matters is not whether the current yield is real - it is - but whether the mechanism producing it will remain intact over the holding period you intend. If perpetual funding stays neutral or positive and exchanges remain liquid, the basis trade continues to function and yields persist. If funding inverts for weeks, the insurance fund depletes, and the protocol enters the same stress loop that drove $8 billion in outflows last autumn. European monetary history has tested basis trades, peg-maintenance mechanisms, and reserve-fund adequacy under stress repeatedly. The lesson is always the same: advertised yields reflect risk, and when the underlying credibility breaks, yields become disclosed losses.
## Frequently Asked Questions
### How does Ethena generate yield on sUSDe?
Ethena runs a delta-neutral basis trade: long staked ETH collateral, short an equivalent notional value of ETH perpetual futures. Yield comes from three sources - funding payments from the short perp positions (largest component), ETH staking rewards from liquid staking tokens in the collateral basket, and interest on stablecoins and tokenized Treasury products such as BlackRock BUIDL. The mix shifts dynamically based on funding-rate conditions.
### Why did sUSDe yield drop from 18% to 7% between 2024 and mid-2026?
Perpetual funding rates compressed as the bull market moderated and USDe supply scaled. The 18% to 60% yields in 2024 reflected high funding during a strong bull market and relatively small protocol supply. As markets normalized through 2025 and 2026, funding rates fell, and the protocol's dynamic allocation shifted more collateral into Treasury products earning the risk-free rate, bringing blended yields down to mid-single digits.
### What happens if perpetual funding rates turn negative for an extended period?
Ethena's short perp positions pay funding instead of receiving it, draining the $73 million insurance fund. The fund covers roughly 1.7% of USDe supply and, under the protocol's own stress test, would deplete in approximately 52 days during moderately bearish conditions. Once exhausted, users would face losses or the protocol would need to halt or restructure. October 2025 saw supply contract 74% when funding inverted and triggered mass redemptions.
### Is the 7% sUSDe APY sustainable over the next 12 months?
It depends on perpetual funding-rate behavior. In a sideways or mildly bullish market, mid-single-digit yields of 4% to 8% are plausible, supported by funding carry, staking rewards, and Treasury income. A fresh bull market could push yields back into the low teens temporarily. A prolonged bear market with negative funding would compress yields toward zero internally, with the insurance fund absorbing losses until depleted or mass redemptions force supply contraction.
### What are the main risks of holding sUSDe?
Three risks dominate: funding-rate inversion draining the insurance fund, counterparty failure or liquidity freeze at an exchange (48% to 50% of short positions are on Binance), and insufficient reserve coverage during extended stress. The seven-day unstaking cooldown means you cannot exit instantly if conditions deteriorate. October 2025 demonstrated that brief depegs to $0.65 are possible during extreme liquidation cascades, and supply can contract by three-quarters within months.
The Weekly Yield Report
You have just examined a 7% yield mechanism that contracted by 74% in a single stress event. Those conditions will return, and the insurance fund has not grown enough to prevent it.
Every Thursday: where crypto yield actually is - stablecoins, liquid staking and DeFi lending, with the risk named next to the rate and what changed since last week.
[Get it free every Thursday](#/portal/signup)
Free. No trade calls, no allocations, no hype. Unsubscribe in one click.
### Weekly Yield Report: 24 September 2026
URL: https://altcoininvestor.com/weekly-yield-report-24-september-2026/
Last updated: 2026-09-24T15:01:38.000Z
Two major LP venues lost nearly half their trading-fee yield in seven days. Uniswap v3 USDC-WETH dropped from 19.4% to 10.13%, and Uniswap v4 ETH-USDC fell from 27.64% to 19.12%. That volume moved somewhere, or it stopped. Either way, the narrative that DEX fee income is stable has taken another hit.
## Stablecoin Yields
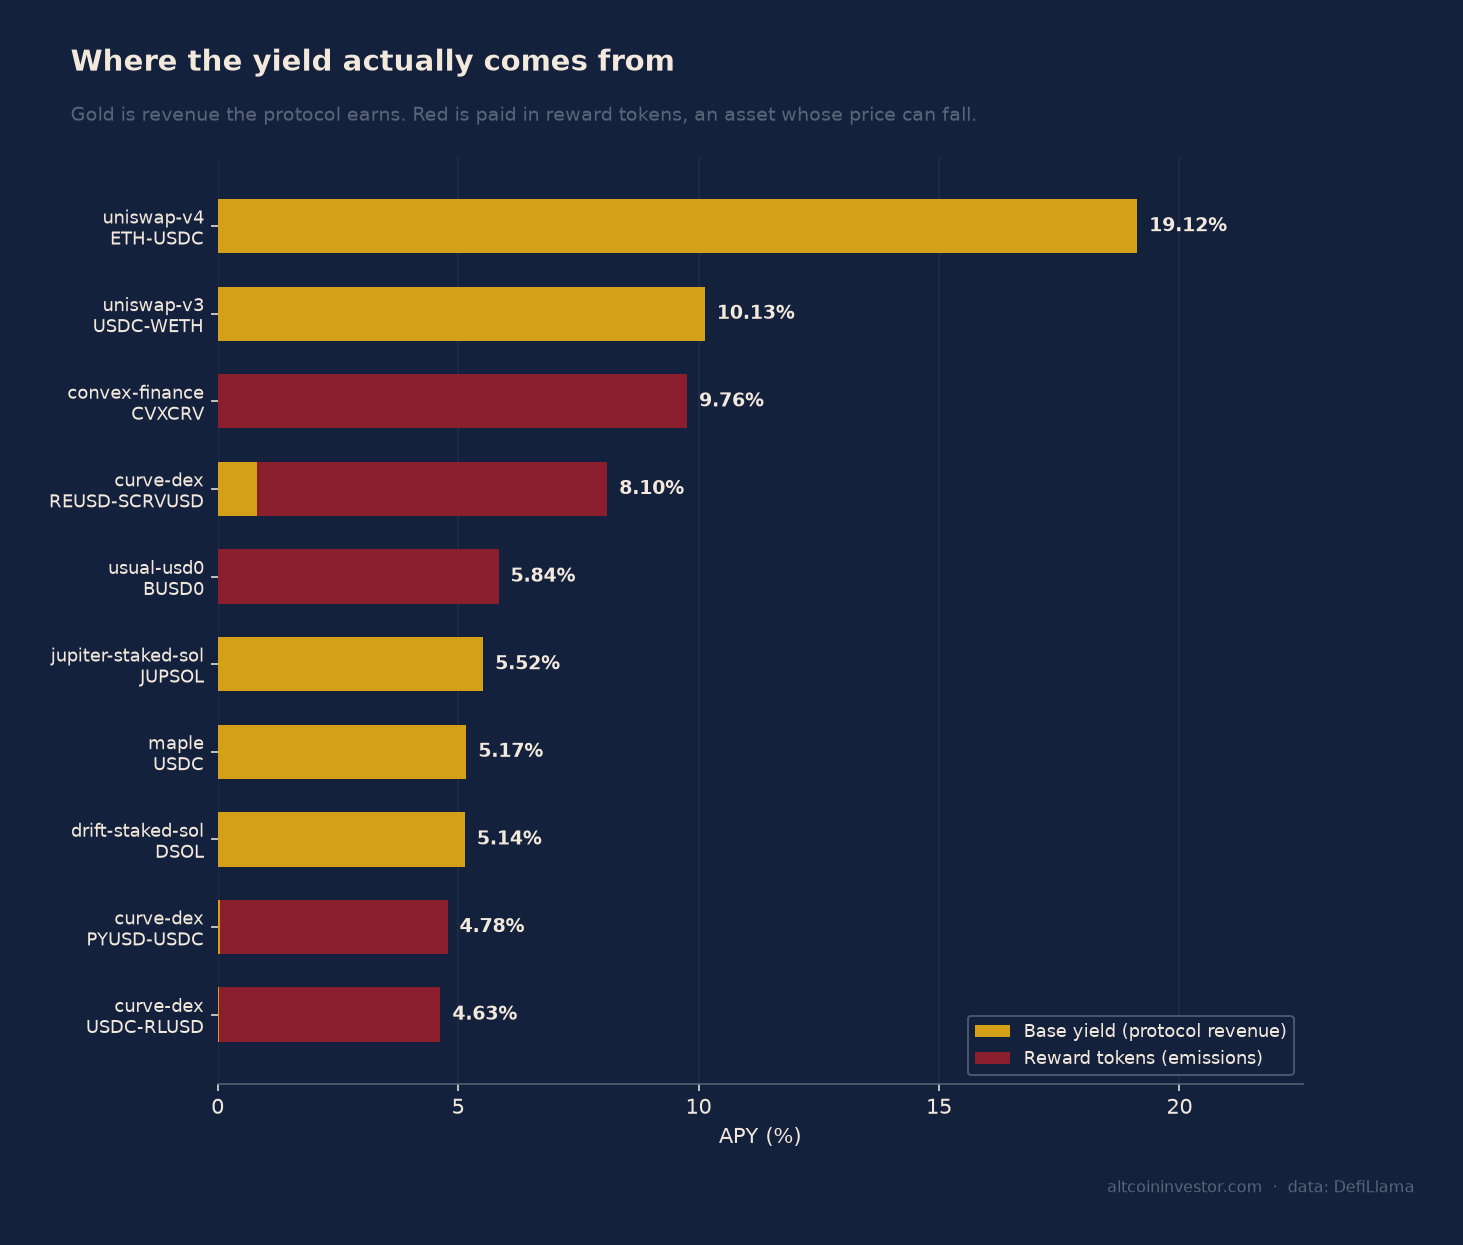
The core venues remain narrow and predictable. [Sky Lending sUSDS](https://defillama.com/yields/pool/d8c4eff5-c8a9-46fc-a888-057c4c668e72) pays 3.6% across Ethereum and Arbitrum, backed by $4,817M in TVL and 580 days of history. [Spark Savings USDC](https://defillama.com/yields/pool/c5c74dd1-995c-4445-9d84-3e710bad7d52) offers 3.6% on Ethereum with $304M TVL. [Aave v3 USDC](https://defillama.com/yields/pool/aa70268e-4b52-42bf-a116-608b370f9501) sits at 3.61% across Ethereum, Base, Arbitrum and Polygon, while [Aave v3 USDT](https://defillama.com/yields/pool/f981a304-bb6c-45b8-b0c5-fd2f515ad23a) on Ethereum delivers 3.68%. Spark Savings USDT on Ethereum pays 3.5% with $389M TVL. All figures are as of 24 September 2026.
Aave v3 sGHO on Ethereum pays 4.5% with $163M TVL and 131 days of history. Compound v3 USDC on Ethereum dropped to 3.23%, down from 5.76% a week earlier. Compound v3 USDT sits at 3.0% with $28M TVL. Sparklend DAI, newly added this week, pays 2.71% on Ethereum with $86M TVL and an 830-day track record.
The yields requiring mechanism explanation: [Ethena sUSDe](https://defillama.com/yields/pool/66985a81-9c51-46ca-9977-42b4fe7bc6df) pays 4.67% on Ethereum with $1,331M TVL. That yield is funding-rate dependent and can go negative in a bear market. Sparklend USDS on Ethereum delivers 4.22%, but 100% of that APY comes from emissions, not base yield. It carries $973M TVL and 206 days of history.
Morpho Blue steakUSDC pays 4.43% across Base and Ethereum with $764M TVL. Risk parameters are set by the curator, not algorithmically. Morpho Blue gtUSDcp offers the same 4.43% with $668M TVL under the same structure. Jupiter Lend USDC on Solana pays 4.91%, composed of 4.53% base and 0.38% reward, with $470M TVL. That carries Solana chain risk, which is a different profile from Ethereum.
Fluid Lending USDC across Ethereum, Arbitrum and Base pays 4.5% with $216M TVL. It is a newer lending design with a shorter track record than Aave. Aave v3 USDe on Ethereum sits at just 0.54% despite $536M TVL. Sky Lending sDAI on Ethereum pays 1.25% with $202M TVL and a 1,385-day history.
## Tokenised Treasuries And Credit
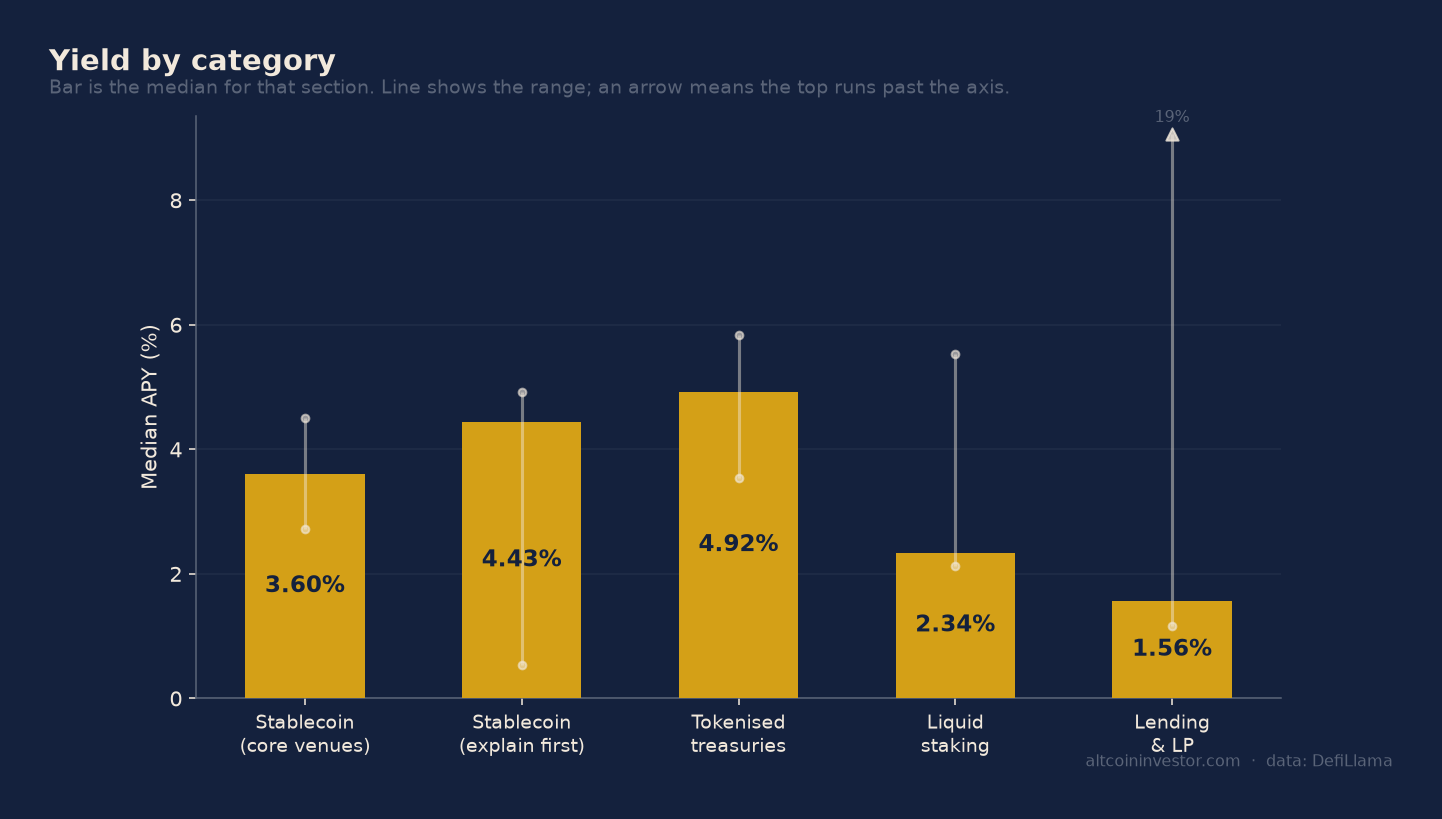
Maple USDC on Ethereum pays 5.17% with $2,908M TVL and 423 days of history. This is institutional credit. It carries real borrower default risk, not just smart-contract risk. Maple USDT on the same chain offers 4.92% with $633M TVL under the same credit structure. Maple USDG delivers 5.04% with $435M TVL and only 104 days of history.
BlackRock BUIDL, tokenised US Treasuries, pays 3.76% across Solana and Ethereum with $1,436M TVL and 181 days of history. Ondo USDY, also tokenised Treasuries, offers 3.59% across Ethereum and Solana with $1,372M TVL. Invesco USTB on Ethereum sits at 3.55% with $542M TVL and 174 days of history.
Usual USD0 (bUSD0) on Ethereum pays 5.84%, but 100% of that yield is emissions. It is treasury-backed with a token incentive layer. TVL stands at $504M with 654 days of history. The rate climbed 2.16 percentage points since last week. Centrifuge Protocol USDS on Ethereum offers 3.53% with $327M TVL. This is tokenised real-world credit, not Treasuries.
## Liquid Staking
[Lido stETH](https://defillama.com/yields/pool/747c1d2a-c668-4682-b9f9-296708a3dd90) on Ethereum pays 2.25% with $26,057M TVL and a 1,573-day track record. Binance Staked ETH (wBETH) sits at 2.2% with $9,375M TVL but carries exchange-operated custodial counterparty risk. Ether.fi weETH pays 2.28% on Ethereum and Base with $5,990M TVL and includes restaking exposure on top of staking. Rocket Pool rETH offers 2.13% with $1,391M TVL. Coinbase Wrapped Staked ETH (cbETH) pays 2.34% with $509M TVL. Stakewise v3 osETH delivers 2.33% with $421M TVL and 1,002 days of history.
Solana liquid staking rates are structurally higher because of MEV rewards and network design. Jupiter Staked SOL (jupSOL) pays 5.52% with $593M TVL and 575 days of history. Drift Staked SOL (dSOL) offers 5.14% with $323M TVL. Jito jitoSOL and Marinade mSOL both sit at 4.98%, with $1,189M and $261M TVL respectively. All Solana venues carry the different chain risk profile inherent to Solana versus Ethereum.
## What Changed
Four pools disappeared from the dataset entirely: Curve DOLA-sUSDe (was 4.09%), Curve crvUSD-cbBTC (was 7.85%), Curve frxUSD-crvUSD (was 3.97%) and Curve apyUSD-apxUSD (was 7.44%). None now meet the reporting bars. Two venues were added: Sparklend DAI at 2.71% and Curve OETH-WETH at 1.56%.
The largest move was Uniswap v3 USDC-WETH, down 9.27 percentage points to 10.13%. Uniswap v4 ETH-USDC fell 8.52 points to 19.12%. Compound v3 USDC dropped 2.53 points to 3.23%. Fluid Lending ETH declined 1.36 points to 1.94%. On the upside, Usual USD0 bUSD0 climbed 2.16 points to 5.84%, and Centrifuge Protocol USDS rose 1.16 points to 3.53%.
The drops in Uniswap pools are large enough to matter. A venue losing half its yield in a week means the volume that generated those fees either evaporated or migrated. If it migrated, it is not showing up in the surviving dataset. If it evaporated, the assumption that LP fee income is durable needs revising.
## Where The Yield Is Not Real
Convex Finance cvxCRV on Ethereum pays 9.76%, but 100% of that is reward tokens. TVL is $50M with 1,464 days of history, and the pool carries impermanent loss risk on top of emissions dependence. Curve rEUSD-scrvUSD delivers 8.1%, of which 90% is emissions. Base yield is just 0.81%. TVL stands at $28M.
Usual USD0 bUSD0 appears in both the treasury section and here. Its 5.84% is entirely emissions, despite being treasury-backed. The token incentive layer is doing all the work. Aave v3 RLUSD on Ethereum pays 4.98%, but 64% of that (3.17 percentage points) is rewards. Only 1.81% is base. A separate Aave v3 WETH pool on Ethereum shows 4.93%, of which 71% is emissions.
[Curve PYUSD-USDC](https://defillama.com/yields/pool/14681aee-05c9-4733-acd0-7b2c84616209) on Ethereum pays 4.78%, but 99% of that is rewards. Base yield is 0.05%. Curve USDC-RLUSD offers 4.63%, also 99% emissions with a 0.03% base. These are not yield venues. They are token distribution mechanisms dressed as lending pools.
Sparklend USDS on Ethereum, mentioned earlier, pays 4.22% in full from emissions. No base yield. $973M TVL and 206 days of history do not change the fact that the APY disappears if the reward programme stops.
## How To Verify Any Of This
Every pool in this report links directly to its DefiLlama page. [Sky Lending sUSDS](https://defillama.com/yields/pool/d8c4eff5-c8a9-46fc-a888-057c4c668e72), [Spark Savings USDC](https://defillama.com/yields/pool/c5c74dd1-995c-4445-9d84-3e710bad7d52), [Aave v3 USDC](https://defillama.com/yields/pool/aa70268e-4b52-42bf-a116-608b370f9501), [Ethena sUSDe](https://defillama.com/yields/pool/66985a81-9c51-46ca-9977-42b4fe7bc6df), [Lido stETH](https://defillama.com/yields/pool/747c1d2a-c668-4682-b9f9-296708a3dd90) and [Curve PYUSD-USDC](https://defillama.com/yields/pool/14681aee-05c9-4733-acd0-7b2c84616209) can all be checked in one click. Yields change daily. These figures are a snapshot as of 24 September 2026\. If a number looks wrong, the verification link is there to prove it or correct it. That is the mechanism that keeps this report honest.
### Frgmnt Wraps DeFi Yield Inside Institutional Custody
URL: https://altcoininvestor.com/frgmnt-defi-yield-institutional-custody/
Last updated: 2026-09-27T18:00:06.000Z
## The Structure That Unlocks Institutional DeFi Access
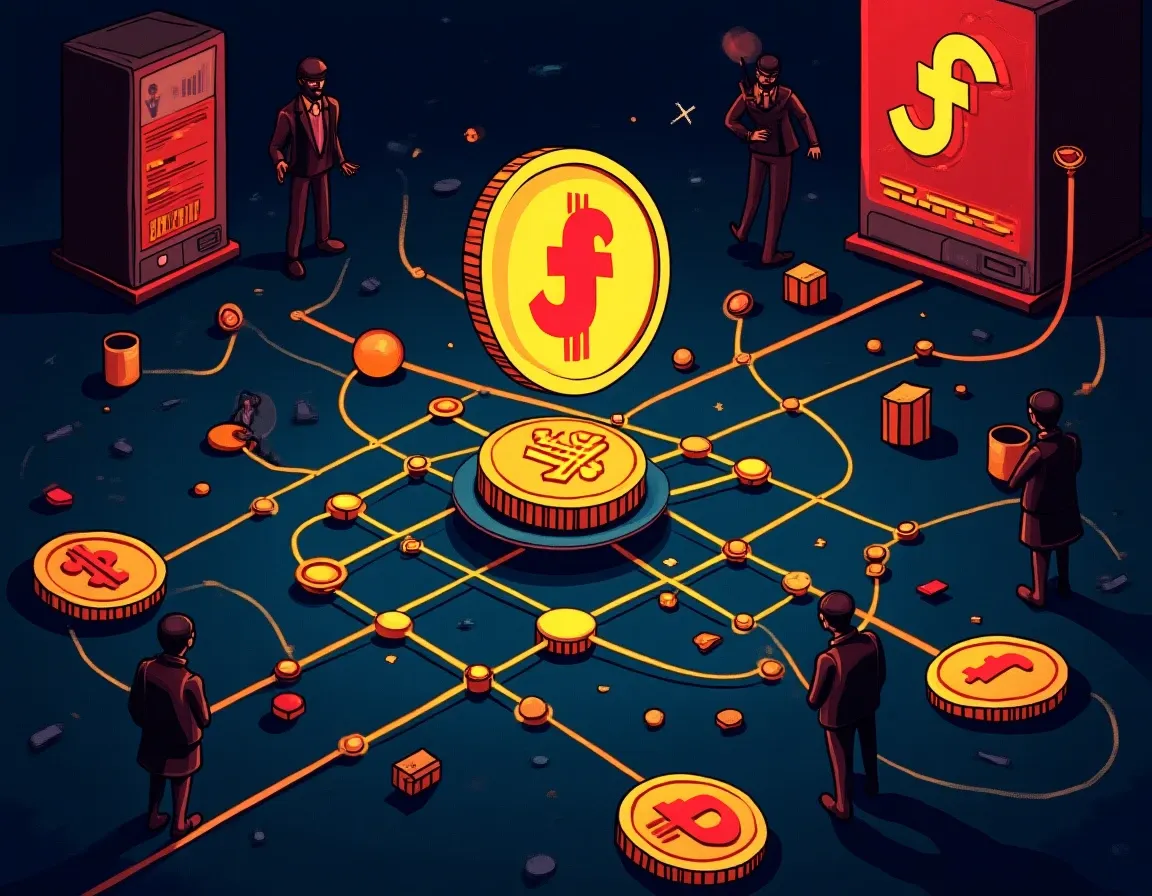
Frgmnt announced on September 11 that its fUSD stablecoin and yield-bearing sfUSD infrastructure are now accessible through institutional custody rails. This is the first time a regulated custody environment has wrapped DeFi yield mechanics inside a compliance-friendly structure without requiring institutions to establish separate wallet infrastructure.
The integration matters because it removes the custody barrier that has kept corporate treasuries and funds from deploying capital into on-chain lending markets. If you are running a fintech or managing institutional capital, you now have a direct route to DeFi yield that fits inside your existing compliance framework.
## How the Yield Mechanism Works
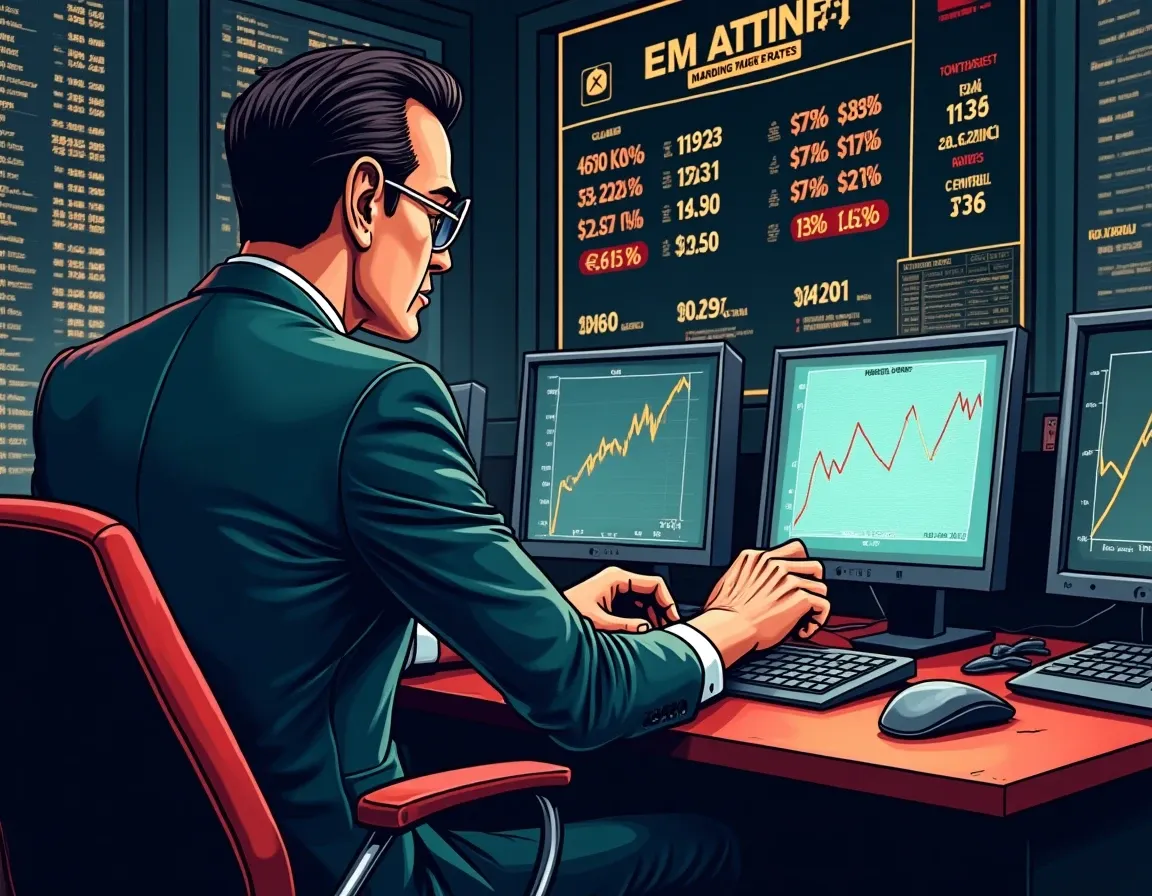
Frgmnt mints fUSD on a 1:1 basis against USDC. That stablecoin is then deployed across selected on-chain lending markets. Holders who stake fUSD receive sfUSD, which earns rewards tied to those lending market conditions.
As of September 4, sfUSD was generating 13.32% in protocol staking rewards from on-chain lending markets. That is the number institutions see when they access the protocol through custody rails. The yield comes from real borrower demand in DeFi lending markets, not token emissions or speculative trading.
The protocol operates under a capped, invite-only beta with approximately $100,000 in total value locked. That is a small deployment, but the mechanics are what matter at this stage, not the scale.
## Why Custody Integration Changes the Access Equation

Most institutions cannot touch DeFi yield because their compliance frameworks do not allow them to manage private keys or interact directly with smart contracts. Custody providers handle that problem for traditional assets, but DeFi yield has lived outside those rails.
Frgmnt's integration means a fund or corporate treasury can access on-chain lending yield the same way they access any other custody-held asset. The custody provider handles the wallet infrastructure. The institution gets exposure to the yield without stepping outside its compliance perimeter.
This is not a wrapped product where the yield is repackaged and sold at a discount. The institution is accessing the actual on-chain lending markets through a custody intermediary. The yield generated by sfUSD is the yield the institution earns, minus whatever fees the custody provider charges for the infrastructure.
For those tracking [best DeFi protocols](https://altcoininvestor.com/best-defi-protocols/) in the lending category, the structural shift here is not about Frgmnt's specific performance. It is about the precedent. If custody providers can wrap DeFi yield mechanics inside their infrastructure, other protocols will follow the same path.
## The Revenue Model Under the Surface
Frgmnt earns by deploying fUSD into lending markets and distributing a portion of the interest income to sfUSD holders. The protocol retains the remainder as revenue. That is a straightforward fee structure, comparable to a money market fund taking a management fee on the interest spread.
At 13.32% gross yield, the unit economics depend on how much of that yield Frgmnt passes through to sfUSD holders and how much it retains. The research notes do not specify the split, but the model is sustainable if borrower demand in the underlying lending markets holds up. If demand falls, the yield falls. That is the same risk you would see in any lending business.
The $100,000 in total value locked means Frgmnt is generating minimal absolute revenue today. But the integration with custody rails gives the protocol a distribution channel that most DeFi projects lack. Institutional capital moves slowly, but it moves in size. If Frgmnt can prove the mechanics work at small scale, the TVL can grow quickly once institutions allocate.
## What This Means for Institutional Yield Strategies
If you manage institutional capital and have been watching DeFi yields from the sidelines, this integration gives you a path in. The 13.32% yield is higher than most money market alternatives, assuming the underlying lending markets remain liquid and the protocol does not introduce hidden risks.
The risks you need to assess are the same risks you would assess in any lending exposure. What is the credit quality of the borrowers? What happens if a lending market experiences a liquidation cascade? How does the protocol handle de-pegging risk if USDC wobbles?
Frgmnt operates on Base, which means you are also taking Layer 2 infrastructure risk. If Base experiences downtime or a bridge exploit, your ability to redeem fUSD could be delayed or impaired. That is not a hypothetical risk. Layer 2 bridges have been exploited before.
The invite-only beta structure suggests Frgmnt is onboarding institutions carefully. That is the right approach for a new protocol with novel mechanics. If you are considering an allocation, the questions to ask are the same questions you would ask of any fund manager. Show me your track record. Show me your liquidation procedures. Show me your insurance coverage.
## Precedent for Other DeFi Protocols
Frgmnt is not the only protocol that could integrate with institutional custody rails, but it is the first to announce it. If the model works, expect other yield-bearing stablecoin protocols to pursue similar integrations.
The constraint has always been custody provider willingness. Most custody providers do not want to touch DeFi because the compliance overhead is high and the client demand has been unclear. Frgmnt's integration suggests at least one custody provider decided the demand is real.
That changes the calculation for other protocols. If you are building a yield product and you can demonstrate sustainable revenue and audited smart contracts, custody providers now have a template for how to integrate your mechanics. The door is open. It was not open two months ago.
For more on how [DeFi yield bifurcation](https://github.com/Ricosworks1/market-intelligence-reports/releases/tag/market-intel-defi-yield-bifurcation-20260919) is playing out across institutional and retail markets, the broader trend is clear. Yield products that can fit inside compliance frameworks will capture institutional capital. Products that cannot will remain retail-only.
## The Takeaway
Frgmnt's custody integration is not about one protocol delivering 13.32% yield. It is about the structural precedent. Institutional custody providers can now wrap on-chain lending yield inside their compliance infrastructure, which means the access barrier that has kept institutional capital out of DeFi just dropped. If you manage capital or build yield products, the path to institutional distribution just became clearer. The protocols that can demonstrate sustainable revenue, audited contracts, and reliable redemption mechanics will be next in line.
## Frequently Asked Questions
### How does Frgmnt deliver DeFi yield through institutional custody?
Frgmnt mints fUSD against USDC and deploys it into on-chain lending markets. Users who stake fUSD receive sfUSD, earning yield tied to lending market conditions. The custody integration allows institutions to access this yield through their existing custody providers without managing private keys or interacting directly with smart contracts. The custody provider handles wallet infrastructure while the institution earns the underlying DeFi lending yield.
### What yield is Frgmnt currently generating?
As of September 4, 2026, sfUSD was generating 13.32% in protocol staking rewards from on-chain lending markets. This yield comes from real borrower demand in DeFi lending protocols, not token emissions. The actual yield an institution receives depends on the portion Frgmnt passes through to sfUSD holders and any fees charged by the custody provider for infrastructure services.
### What risks do institutions face when accessing DeFi yield through Frgmnt?
Institutions face lending market credit risk, liquidation cascade risk in underlying protocols, USDC de-pegging risk, and Layer 2 infrastructure risk since Frgmnt operates on Base. Bridge exploits or Base downtime could delay redemptions. The invite-only beta structure suggests careful onboarding, but institutions should assess Frgmnt's liquidation procedures, insurance coverage, and track record the same way they would evaluate any fund manager before allocating capital.
### Why has institutional capital avoided DeFi yield until now?
Most institutional compliance frameworks do not permit direct management of private keys or interaction with smart contracts. Custody providers handle asset security for traditional investments, but DeFi yield has lived outside regulated custody rails. Without a custody solution that wraps DeFi mechanics inside a compliance-friendly structure, institutions could not access on-chain lending yields without violating their own operational and regulatory requirements.
### Will other DeFi protocols follow Frgmnt's custody integration model?
Likely yes. Frgmnt's integration proves at least one custody provider is willing to wrap DeFi yield mechanics inside institutional infrastructure. This template changes the calculation for other yield protocols. Any project with sustainable revenue, audited smart contracts, and reliable redemption mechanics can now approach custody providers with a proven integration model. The door to institutional distribution just opened for protocols that can meet compliance standards.
Tool mentioned above
Ledger
Ledger devices display the full transaction on their own screen before you approve it, which is what stops an approval exploit at the point it matters.
[See Ledger devices](https://shop.ledger.com/?r=90612ff43561)
We may earn a commission if you sign up through this link, at no cost to you. It does not change what gets recommended.
The Weekly Yield Report
You just reviewed the first custody-wrapped DeFi yield protocol generating 13.32% from lending markets. That yield changes daily, and new protocols will follow this template.
Every Thursday: where crypto yield actually is - stablecoins, liquid staking and DeFi lending, with the risk named next to the rate and what changed since last week.
[Get it free every Thursday](#/portal/signup)
Free. No trade calls, no allocations, no hype. Unsubscribe in one click.
### How To Earn Free Bitcoin: What Actually Works In 2026
URL: https://altcoininvestor.com/how-to-earn-free-bitcoins/
Last updated: 2026-09-24T00:03:37.000Z
## What 'Free Bitcoin' Actually Means

When people search for free Bitcoin, they're asking whether you can accumulate BTC without buying it directly. The answer is yes, but the economics are blunt: most methods pay the equivalent of $0.25 to $2 per hour of effort. That's functionally zero after time cost.
The phrase 'free Bitcoin' is misleading. You're trading time, attention, capital deployment, or purchasing behavior. Nothing is free. The question is whether the exchange rate between what you give and what you receive is worth it.
This article measures five categories of methods by their effective hourly rate: faucets, learn-and-earn programs, cashback cards, browser mining, and exchange sign-up bonuses. The numbers are current for 2026\. The conclusions are blunt.
## Bitcoin Faucets: $0.25 to $0.65 Per Hour

Bitcoin faucets distribute small amounts of satoshis in exchange for completing captchas, watching ads, or clicking through pages. They're named after the metaphor of a leaky tap: small drips over time.
High-performing faucets distribute 20 to 100 satoshis per claim. Users can claim once every 15 to 60 minutes. At current Bitcoin valuations, that's $0.01 to $0.05 per claim. Dedicated faucet users spending 2 to 3 hours daily across multiple platforms earn $15 to $40 monthly. That translates to an effective hourly rate of $0.25 to $0.65.
Here's the time cost in practice. A faucet distributing 50 satoshis per claim with a 50,000 satoshi withdrawal threshold requires 1,000 claims before payout. At one claim per hour, that's 42 days of consistent participation to withdraw anything at all.
FreeBitcoin and Cointiply are the highest-paying platforms still active in 2026\. FreeBitcoin can pay up to 200 satoshis per hourly roll. Even at that rate, you're earning approximately $1.20 per hour if you claim consistently every hour, all day.
The only case for faucets is educational. If you've never held Bitcoin and want to learn how wallets and transactions work without risking real money, faucets let you accumulate enough satoshis to send a transaction and pay a fee. Beyond that, they're a waste of time.
## Learn-and-Earn Programs: $5 to $15 Per Hour, One-Time Only
Learn-and-earn programs are the highest hourly-rate way to earn free crypto in 2026\. Platforms pay you $3 to $10 for watching a 5-minute video and completing a short quiz. That translates to $5 to $15 per hour, substantially higher than faucets.
The limitation is availability. Learn-and-earn programs are one-time. Once you've completed all available courses on a platform, you can't repeat them. Realistically, you can earn $60 to $130 total across all active 2026 programs if you complete every one.
Coinbase discontinued its classic Learn and Earn program in May 2025\. The platform has shifted focus to on-chain 'Quests' in their Wallet app. Those involve real on-chain transactions, and you can actually lose money if you mess up by paying $10 in gas for a $3 reward.
Binance has taken the top spot in 2026 with the most frequent and reliable reward pools. The effective hourly rate is usually $5 to $15, which is lower than a job but higher than doing nothing. The main benefit is learning about new crypto projects while accumulating small amounts of tokens that could appreciate.
Geographic location heavily influences earning potential. Some programs restrict participation by country. Exchange learning programs offer superior time-to-earning ratios compared to faucets. Completing a 10-minute educational module for $5 worth of cryptocurrency translates to $30 per hour.
The strategy is simple: complete every available learn-and-earn program across Binance, remaining Coinbase Quests, and smaller exchange platforms, then stop. This is a one-time windfall, not a recurring income stream.
## Crypto Cashback Cards: 1% to 8% Back, Requires Spending
Crypto cashback cards are the only method on this list that delivers real value at scale. They pay 1% to 8% back in cryptocurrency on purchases you're already making. The catch is that you need existing capital to spend in order to earn rewards. This isn't 'free Bitcoin' in the faucet sense. It's a return on spending behavior.
The Crypto.com Visa Card offers 1% to 5% back in CRO depending on your staking level. The Nexo Card is a zero-fee card powered by Mastercard that earns 2% unlimited cash back on purchases. The COCA Visa Card packs 8% cashback, 0% foreign exchange fees, and 5% APY.
The COCA Elite earns 8% on eligible spend, but withdrawals are metered at $350 per month. Below about $700 per month in spending, the fee structure outruns the cashback and free cards earn more. Nexo lets you deposit cryptocurrency to earn up to 20% APY on certain cryptos, and interest accrues daily.
For most people who simply want their crypto and cash to work together, earning yield while staying liquid with no native token to manage and no staking gymnastics, the Brighty Card is the most practical all-rounder. It links a unified fiat-crypto account to a card that spends from balances already earning up to 10% APY. The rate has moved twice in 2026, down in the restructure and doubled in July, so treat it as current pricing rather than a guarantee.
Cashback cards require existing capital to earn rewards. There's no true 'free Bitcoin' angle unless you already spend money. But if you're spending $1,000 per month on groceries, bills, and discretionary purchases, a 2% cashback card delivers $20 per month in crypto. That's $240 per year. Over five years, it's $1,200\. That's real value.
If you're looking for ways to put existing capital to work, [stablecoin yield strategies](https://altcoininvestor.com/passive-income-stablecoins/) offer another angle worth understanding.
## Browser Mining: Functionally Dead for Profit
Browser mining refers to scripts that use a visitor's CPU power to perform hashing functions for smaller proof-of-work chains or testnets. In 2026, browser mining for Ethereum is not profitable or even possible on the mainnet. Ethereum uses a proof-of-stake consensus mechanism, which relies on validators who lock up ETH rather than miners who solve cryptographic puzzles.
Browser mining is not a goldmine. In 2026, a typical desktop visitor running MinotaurX contributes roughly 1,800 to 2,000 H/s across 7 threads. A laptop averages 700 to 800 H/s. Mobile devices contribute 250 to 350 H/s. Average blended hashrate is around 500 to 700 H/s per active session.
For a site with 10,000 daily visitors, you might earn $50 to $200 per month from mining. That's a supplemental revenue stream for site operators, not a replacement for display ads. For individual users attempting to mine Bitcoin through a browser, the returns are under $1 to $3 per month per device.
Browser mining is a supplemental revenue stream, not a replacement for ads. For a site with 10,000 daily visitors, you might earn $50 to $200 per month from mining versus $300 to $1,000 per month from display ads. But mining revenue has zero marginal cost. It does not degrade user experience, it does not get blocked, and it does not require user interaction.
For individual users, browser mining is not a viable way to earn Bitcoin. The electricity cost of running your device likely exceeds the value of the cryptocurrency earned. If you're interested in actual mining income, [cloud mining platforms](https://altcoininvestor.com/cloud-mining-earn-crypto-passively/) are a separate category worth evaluating on their own terms.
## Exchange Sign-Up Bonuses: $20 to $50 Per Account, One-Time
Exchange sign-up bonuses are legitimate but limited. Platforms advertise anywhere from $100 to $40,000 USDT in welcome rewards, but the gap between what's advertised and what actually lands in your account has never been wider.
For a beginner depositing $50 to $100, expect to earn $20 to $50 in actual rewards. Binance offers the most trusted platform with a solid $100 bonus. Platforms like Bybit, offering up to $30,100 in rewards, and Gate.io, with bonuses reaching $40,000, stand out for their high-value incentives.
Most bonuses must be claimed within 7 to 30 days of registration. Minimum deposit is usually $50 to $100\. Depositing less means no bonus. Some bonuses require $500 or more in trading volume, and bonus funds may not be withdrawable until you trade a certain volume, such as 10 times the bonus amount.
Real-world value: $20 to $50 for a $50 to $100 deposit is a 20% to 50% instant return on a single transaction. That's not sustainable, but it's legitimate. The strategy is to register on multiple exchanges, meet the minimum deposit and trading volume requirements, claim the bonus, and withdraw.
Crypto sign-up bonuses are generally taxable. They are considered income in most jurisdictions. If you earn $200 across four exchange bonuses, that's $200 of taxable income. Keep records. If you're tracking multiple small earnings events, [free-tier crypto tax software](https://altcoininvestor.com/is-koinly-free/) can handle the initial organization.
Exchange bonuses require capital. You're not earning free Bitcoin from zero. You're earning a one-time percentage return on capital you already have. For someone with $500 to deploy across five exchanges, this can realistically net $100 to $250\. That's meaningful, but it's a one-time event.
## What The Numbers Actually Say
Here's the effective hourly rate for each method, calculated using 2026 data:
- Faucets: $0.25 to $0.65 per hour
- Learn-and-earn: $5 to $15 per hour, one-time only, $60 to $130 lifetime per platform
- Browser mining: under $1 to $3 per month per user, not viable
- Cashback cards: 1% to 8% on actual spending, real value if you spend anyway, not 'free'
- Exchange bonuses: $20 to $50 per account, one-time, requires $50 to $100 capital
The only methods worth your time are learn-and-earn programs as a one-time sweep and cashback cards if you're already spending money. Everything else pays below minimum wage or requires capital deployment that changes the definition of 'free.'
If you're serious about earning Bitcoin, the question shifts from 'free' to 'effective.' [OKX's guide to earning Bitcoin](https://www.okx.com/en-us/learn/bitcoin/earn-free-bitcoin) covers additional strategies that involve capital deployment, staking, and [yield-bearing Bitcoin products](https://altcoininvestor.com/how-to-earn-yield-on-bitcoin/).
## When 'Free Bitcoin' Is Worth It
There are three scenarios where earning free Bitcoin makes sense:
**Educational use.** If you've never owned Bitcoin and want to learn how wallets, transactions, and fees work without risking real money, faucets give you enough satoshis to experiment. You'll earn functionally zero, but you'll understand the mechanics.
**One-time windfall.** Learn-and-earn programs are the highest hourly-rate method available. If you complete every available program across all platforms, you can realistically earn $60 to $130\. That's meaningful for a few hours of effort, but it's one-time only.
**Capital you're already spending.** Cashback cards deliver real value if you're already making purchases. A 2% cashback card on $1,000 per month in spending is $20 per month in crypto, $240 per year. That compounds over time.
Outside of these scenarios, 'free Bitcoin' is a losing trade. Your time is worth more than $0.65 per hour.
## The Takeaway
Most methods to earn free Bitcoin pay under $2 per hour equivalent after time cost. Faucets are functionally zero. Browser mining is dead for individual users. Learn-and-earn programs pay $5 to $15 per hour but are one-time only. Cashback cards deliver real value but require existing spending. Exchange bonuses are legitimate but one-time and require capital.
If you're holding Bitcoin long-term, the question shifts from 'free' to 'yield.' [Real Bitcoin yield strategies](https://altcoininvestor.com/how-to-earn-yield-on-bitcoin/) involve wrapped BTC in DeFi, Babylon staking, CEX accounts, and Lightning network channels. Those aren't free, but they're effective.
The blockchain doesn't care whether you earned your Bitcoin for free or bought it. It cares whether you hold the private key. Focus on accumulation strategies that respect the value of your time.
## Frequently Asked Questions
### Can you actually earn free Bitcoin without investing money?
Yes, but the amounts are minimal. Bitcoin faucets pay $0.25 to $0.65 per hour. Learn-and-earn programs pay $5 to $15 per hour but are one-time only, capped at $60 to $130 lifetime per platform. Browser mining earns under $3 per month. Exchange bonuses and cashback cards require existing capital. If you're looking for truly zero-capital methods, only faucets and learn-and-earn programs qualify, and only learn-and-earn pays above minimum wage.
### What is the fastest way to earn free Bitcoin in 2026?
Learn-and-earn programs offer the highest effective hourly rate at $5 to $15 per hour. Binance has the most frequent and reliable reward pools in 2026 after Coinbase discontinued its classic program. You can realistically earn $60 to $130 total across all platforms by completing every available course. This is a one-time windfall, not a recurring income stream. After you've exhausted learn-and-earn, exchange sign-up bonuses are the next-fastest, delivering $20 to $50 per account.
### Are Bitcoin faucets worth the time in 2026?
No, unless your goal is purely educational. High-performing faucets pay 20 to 100 satoshis per claim, translating to $0.01 to $0.05 per claim. Dedicated users spending 2 to 3 hours daily earn $15 to $40 monthly, or $0.25 to $0.65 per hour. A faucet distributing 50 satoshis per claim with a 50,000 satoshi withdrawal threshold requires 1,000 claims and 42 days of participation. Your time is worth more than $0.65 per hour.
### Do crypto cashback cards actually give you free Bitcoin?
Crypto cashback cards deliver real value, but they require existing spending, so they're not 'free' in the faucet sense. Cards pay 1% to 8% back in cryptocurrency on purchases. A 2% cashback card on $1,000 per month in spending delivers $20 per month in crypto, or $240 per year. The COCA Visa Card offers 8% cashback but limits withdrawals to $350 per month. Below $700 per month in spending, fee structure outruns cashback and free cards earn more.
### Are exchange sign-up bonuses taxable income?
Yes, crypto sign-up bonuses are generally taxable as income in most jurisdictions. If you earn $200 across four exchange bonuses, that's $200 of taxable income you must report. Platforms advertise $100 to $40,000 in welcome rewards, but realistic earnings for a beginner depositing $50 to $100 are $20 to $50 per account. Most bonuses require minimum deposits of $50 to $100 and trading volume of 10 times the bonus amount before withdrawal. Keep records for tax reporting.
The Weekly Yield Report
You just reviewed five methods paying between $0.25 and $15 per hour, plus cashback rates that change quarterly. Those numbers will shift before the next halving.
Every Thursday: where crypto yield actually is - stablecoins, liquid staking and DeFi lending, with the risk named next to the rate and what changed since last week.
[Get it free every Thursday](#/portal/signup)
Free. No trade calls, no allocations, no hype. Unsubscribe in one click.
### Where The Profits In Crypto Trading Bots Actually Come From
URL: https://altcoininvestor.com/how-do-crypto-trading-bots-make-money/
Last updated: 2026-09-23T23:06:11.000Z
## The Profit Source Question
Most retail traders ask whether crypto trading bots are profitable. Wrong question. The right question is: where does this specific bot category extract profit, and under what market conditions does that mechanism fail?
Bot profitability breaks down into three distinct profit sources. Some bots capture spreads from price oscillation. Some extract funding rate differentials between spot and futures markets. Some sell you subscription access while your capital sits idle. The profit mechanism determines the failure mode.
Here's the decomposition by category.
## Spread Capture Mechanisms
[Grid bots](https://altcoininvestor.com/how-grid-trading-bots-work/) operate on a single profit source: buy-sell spread capture from price oscillation within a defined range. The bot places a ladder of buy and sell orders at fixed price intervals. Price moves up, sell orders execute. Price moves down, buy orders execute. Each completed cycle captures the spread between grid levels.
The profit per cycle is small. A typical grid with 20 orders across a 10% range captures roughly 0.5% per full oscillation cycle. That compounds if price oscillates dozens of times through the range. Grid strategies showed effectiveness during sideways market phases that characterized approximately 60-70% of cryptocurrency market conditions between 2024 and 2026.
Grid bots generated annualized returns between 15-40% during 2025 in ranging markets with 10-20% price fluctuations. That's the mechanical upper bound when the mechanism works correctly.
### The Specific Failure Mode
Grid bots fail in trending markets. If an asset breaks its range and starts a swift trend, the bot continues placing buy orders during the downtrend. The strategy averages down into losses. The bot holds an increasingly large position at an increasingly poor average entry price.
A grid configured for $30,000-$33,000 on BTC will place its full ladder of buy orders as price falls through $28,000, then $25,000, then lower. The bot has no mechanism to recognize that the range has broken. It executes the programmed strategy regardless of regime change.
The spread capture mechanism assumes oscillation. Remove oscillation, and the bot bleeds capital.
## Funding Rate Extraction
Arbitrage bots extract profit from three distinct mechanisms. Spatial arbitrage captures price discrepancies between exchanges. Triangular arbitrage cycles through three trading pairs on the same platform to end up with more of the starting asset. Funding-rate arbitrage exploits the spread between perpetual futures and spot pricing within a single venue.
Spatial arbitrage spreads narrowed from 2-5% in 2021 to typically under 0.5% by 2026\. Manual arbitrage is effectively dead in 2026 because price discrepancies between exchanges close in milliseconds. Thousands of [crypto arbitrage bots](https://altcoininvestor.com/how-to-arbitrage-crypto/) already hunt the same gaps. Firms like Jump Trading and Wintermute dominate the space with infrastructure built for microsecond execution and direct connections to major exchanges.
Funding-rate arbitrage remains viable for retail users with sufficient capital. The strategy holds a long spot position while shorting perpetual futures contracts in equal size. The position is delta-neutral. Price movement does not affect P&L. The profit comes from collecting funding rate payments.
In bull markets, longs pay shorts. Funding rates typically range from 0.01% to 0.05% per 8-hour funding period. That compounds to roughly 11-55% annually if funding rates remain consistently positive.
### The Specific Failure Mode
Funding rates invert during short squeezes or sharp downturns. When funding flips negative, shorts pay longs. The arbitrage position bleeds capital. Funding cost accrues continuously on the open position, independent of whether the trade is currently winning.
During the May 2021 crash, funding rates on major perpetual contracts turned deeply negative for weeks. Arbitrage strategies that were profitable in Q1 2021 became loss-making in Q2\. The mechanism didn't break because of poor execution. It broke because the funding differential reversed.
Funding-rate extraction works only when funding is consistently positive and large enough to exceed trading fees, slippage, and withdrawal costs. When funding inverts, the strategy becomes a net cost.
## The Subscription Revenue Model
Most retail [crypto trading bots](https://altcoininvestor.com/what-is-a-crypto-trading-bot/) operate on a subscription model. You pay monthly. The platform provides software access. Your capital is deployed by the bot's strategy. The platform earns regardless of whether your net position is profitable.
Subscription bots such as Bitsgap, 3Commas, WunderTrading, Cryptohopper, Altrady, CryptoHero and TradeSanta charge between $20 and $140 per month depending on the plan tier. You pay the same whether you profit $5,000 or lose $2,000.
At $12,000 starting capital with $130 per month in platform fees, you're paying 15.6% of your starting capital annually in subscription costs alone. That's before exchange trading fees, slippage, or funding costs.
Exchange trading fees typically run 0.1% per trade for maker/taker. A strategy executing 5 trades per day accumulates roughly 36.5% in annual fee drag on traded volume. A bot pulling in around 1% daily by flipping small trades eventually sees about 0.8% disappear after exchange fees, slippage, and funding cost. Profit is close to nothing.
### The Alternative Fee Structures
Some platforms drop the subscription model. Pionex does not charge a separate bot subscription fee. Users pay only trading fees, with spot trading fee commonly listed at 0.05%. Mizar charges by trading volume instead, with centralized exchanges the volume fee capped at 0.1% per trade and can be cut by up to roughly 95% by staking its MZR token.
Performance-fee models take a percentage of realized profits, typically 10-30%. There is no upfront subscription cost. AlgosOne charges up to 25% commission on profitable trades. The fee structure creates a misalignment. The vendor profits whether or not your net position after all costs is positive.
The subscription revenue model is where the bot software company makes money, not where the trader does. This is not a critique. It's a mechanical observation. The platform's profit source is subscription revenue. The trader's profit source is whatever strategy the bot executes, net of all fees.
## Position Accumulation Without Realized Profit
DCA bots do not generate profit while running. They accumulate a position over time by making systematic purchases at fixed intervals or price thresholds. The profit source is capital appreciation from long-term position building, not the bot itself.
DCA strategies demonstrated consistent performance during 2024-2026, with systematic accumulation outperforming lump-sum investments in approximately 65% of tested scenarios across major cryptocurrencies. That's a timing comparison, not a profit mechanism.
Unlike [grid trading bots](https://altcoininvestor.com/trading-bots-crypto/), DCA bots cannot release profit while running. The position is always open. Profit exists only if price recovers above average entry, not above the original entry. If price never recovers within the position's remaining capital to average further, this scenario ends in an open loss.
### The Specific Failure Mode
DCA bots run out of dry powder before recovery. A bot configured to deploy $10,000 over 100 purchases will complete its allocation after 100 buy executions. If price continues falling after the bot exhausts its capital, the position is stuck in unrealized loss with no remaining capital to average down further.
The strategy removes timing risk but increases exposure to downside. A lump-sum buyer who mistimes entry loses on one purchase. A DCA bot that exhausts capital in a downtrend loses on every incremental purchase.
## Real Performance After All Costs
Industry estimates suggest that 70-80% of retail trading bots lose money over a 12-month period. Experienced traders running well-configured bots typically achieve net annual returns in the range of 5-25% above buy-and-hold for the same asset.
That's not passive income. It requires active monitoring, regime awareness, and reconfiguration when market conditions shift. The single biggest differentiator between bots that survive and bots that blow up is regime awareness. A bot that trades the same way in a bull market and a bear market is a bot that loses money.
Markets cycle through trending, range-bound, high-volatility, low-volatility regimes. A bot that's profitable in trending markets will lose money in choppy conditions. Grid bots work in ranges, fail in trends. DCA works in recoveries, fails in sustained downturns. Funding arbitrage works in bull markets, fails when funding inverts.
### Capital Requirements
Most experienced traders recommend having at least a few hundred to a few thousand dollars in trading capital so the monthly subscription cost does not eat too heavily into potential returns. At $500 starting capital with $50 per month in subscription fees, you're paying 120% of your capital annually in subscription costs. The math doesn't work.
While some exchanges allow starting with $100, a well-thought-out grid usually requires $500 to $1,000 to allow for enough orders to cover the range effectively. Below that threshold, the bot cannot place enough orders to capture meaningful spread.
## Overfitting And Model Drift
Many bots aren't forward-tested properly, leading to failures in live trading. Common AI failure modes include model drift, where relationships learned during training gradually weaken, and feature decay, where previously useful signals lose predictive power.
A grid bot backtested on 2024 data during a calm sideways market will fail when deployed in 2026 if volatility increases. The bot was optimized for a specific regime. That regime no longer exists. The bot continues executing the same strategy in a market that no longer rewards it.
Overly complex or aggressive methods, like Martingale or grid trading without stop-loss logic, often result in significant losses. The backtest showed consistent profits. Live deployment shows consistent losses. The difference is regime change.
## Execution Failures And Hidden Costs
Technical issues such as API connectivity drops, exchange downtime, or high latency can prevent a bot from exiting a losing position. Slippage occurs where the price at which the trade is executed is different from the expected price. A market order to sell at $30,000 executes at $29,850 during high volatility.
VPS hosting for self-hosted bots costs $5-$20 per month for a reliable virtual private server. Bots like Gunbot run on your own infrastructure and require 24/7 uptime. That's an additional cost layer beyond subscription and trading fees.
Under the EU's DAC8 framework, every arbitrage leg is a taxable event from January 2026 onward for EU-based traders. A spatial arbitrage executing 50 trades per day creates 18,250 taxable events annually. That's a reporting burden, not just a tax liability.
### Counterparty And Custody Risk
Bots require API keys with trading permissions. That grants the platform or software the ability to execute trades on your behalf. Bybit experienced a hack in February 2025\. Users running bots with API keys were exposed to counterparty risk beyond the bot's strategy risk.
Exchange downtime, withdrawal freezes, or insolvency events can lock capital that the bot is actively managing. The bot doesn't care. It continues executing orders. But the capital is stuck on a platform that may not honor withdrawals.
## The Competitive Reality
Retail bots compete against institutional infrastructure built for microsecond execution. Their systems are co-located with exchange servers, reducing latency to nearly zero. Retail users running bots from a home setup are hundreds of times slower.
Capital scale matters. A retail trader running a $5,000 grid earns $750 at 15% annual return. An institutional desk running a $5 million arbitrage strategy earns $250,000 at 5% annual return. The institutional desk can afford better infrastructure, lower fee tiers, and more sophisticated strategies because the absolute profit justifies the cost.
Spread opportunities that used to last minutes now last milliseconds. Funding-rate differentials that used to persist for days now compress within hours as more capital chases the same yield. The environment is more competitive in 2026 than it was in 2020.
## The Takeaway
Bot profitability decomposes into three profit sources. Spread capture works in ranging markets, fails in trends. Funding rate extraction works when funding is positive, fails when funding inverts. Subscription revenue works for the platform regardless of trader P&L.
The question is not whether bots are profitable. The question is: which specific mechanism does this bot use to extract profit, under what market conditions does that mechanism work, and what specific regime change causes it to fail?
Most retail bots lose money because they execute the same strategy across all market regimes. The 20-30% that survive do so because they recognize regime shifts and reconfigure before the failure cascade begins. That requires monitoring. It is not passive.
If you cannot decompose the profit source, you cannot identify the failure mode. If you cannot identify the failure mode, you cannot monitor for the conditions that would trigger it. That is not a strategy. That is hope.
## Frequently Asked Questions
### What is the most common profit source for crypto trading bots?
Spread capture through grid trading is the most common retail bot mechanism. These bots place buy and sell orders at fixed intervals within a price range and profit from oscillation. Grid bots generated 15-40% annualized returns in 2025 during ranging markets, but they fail in trending markets when price breaks the configured range and the bot averages down into losses.
### Do most crypto trading bots actually make money?
Industry estimates suggest 70-80% of retail trading bots lose money over 12 months. Experienced traders running well-configured bots typically achieve 5-25% net annual returns above buy-and-hold. The difference comes down to regime awareness. Bots that execute the same strategy in all market conditions fail. Bots that reconfigure when regimes shift survive.
### How much capital do you need to run a profitable trading bot?
Most experienced traders recommend at least $1,000 to $3,000 in trading capital so subscription fees don't consume returns. At $500 capital with $50 monthly subscription, you pay 120% of capital annually in fees. Well-configured grid bots need $500-$1,000 minimum to place enough orders across a range to capture meaningful spread. Below that threshold, fee drag eliminates edge.
### What causes arbitrage bots to stop being profitable?
Arbitrage profit depends on price discrepancies or funding rate differentials. Spatial arbitrage spreads collapsed from 2-5% in 2021 to under 0.5% by 2026 as institutional bots eliminated opportunities in milliseconds. Funding-rate arbitrage fails when funding rates invert during short squeezes or bear markets. When shorts start paying longs instead of longs paying shorts, the strategy bleeds capital.
### Are DCA bots actually profitable?
DCA bots do not generate profit while running. They accumulate a position over time. Profit exists only if price recovers above the average entry price. The bot removes timing risk but increases downside exposure. If price continues falling after the bot exhausts its allocated capital, the position is stuck in unrealized loss with no remaining capital to average down further.
The Weekly Yield Report
You just decomposed spread capture, funding extraction, and subscription models across five bot categories. Those mechanisms and failure modes will shift as market structure evolves.
Every Thursday: where crypto yield actually is - stablecoins, liquid staking and DeFi lending, with the risk named next to the rate and what changed since last week.
[Get it free every Thursday](#/portal/signup)
Free. No trade calls, no allocations, no hype. Unsubscribe in one click.
### Same Risk, Better Rate: Where The Gaps Are
URL: https://altcoininvestor.com/best-stablecoin-yield-comparison/
Last updated: 2026-09-23T22:04:45.000Z
## The Decision You Are Trying To Make

You hold USDC. You want yield. You see three venues: one pays 3.5%, one pays 3.8%, one pays 4.7%. Which do you choose?
The correct answer depends on whether the rate difference reflects a risk difference or something else. A higher rate at higher risk is not found money. It is a different trade. The cleanest yield improvement is moving to a comparable-risk venue paying more, because nothing about the exposure changes.
This comparison decomposes the rate gaps that persist between venues carrying substantially the same risk profile. The gap exists because of brand inertia, integration depth, fee opacity, or simple unawareness. Not because one platform is doing something riskier with your capital.
The mechanism is simple: move to a comparable-risk venue paying more. The return improvement comes entirely from closing the gap, not from taking additional risk.
## What Risk Profile Actually Means
Risk profile decomposes into four components: counterparty risk, collateral risk, smart contract risk, and custody model. Two venues match on risk profile when these four components are substantively identical.
**Counterparty risk:** Who issues the stablecoin backing your deposit, and what reserves back it. USDC is backed by Circle's reserves. USDT is backed by Tether's reserves. A venue lending out USDC and a venue lending out USDT carry different counterparty risk, even if both are custodial exchanges.
**Collateral risk:** What borrowers post as collateral, and whether a collateral failure cascades into your position. Aave V3 and Morpho both use overcollateralized loans, but the collateral composition differs by market. A Morpho vault accepting only wstETH collateral carries different liquidation cascade risk than an Aave market accepting 15 collateral types.
**Smart contract risk:** Whether the platform holding your funds is governed by audited immutable code or by a centralized entity that can freeze, redirect, or lose your deposit. DeFi lending protocols like Aave and Morpho carry smart contract risk. CeFi platforms like Coinbase and KuCoin carry platform custody risk. These are structurally different failure modes.
**Custody model:** Whether you hold the private key or the platform does. Non-custodial DeFi means you deposit from your wallet and can withdraw anytime. Custodial CeFi means the platform holds your funds and you trust their solvency. Celsius, BlockFi, and Voyager failed in 2022-2023\. The custody model matters.
For the purpose of this comparison, two venues match on risk when all four components are substantively identical. A rate gap between matched venues is the signal. A rate gap between mismatched venues is noise.
## DeFi Lending: Aave vs Morpho vs Spark on USDC
Aave V3 on Ethereum pays 3.7% APY on USDC as of September 2026, with a 30-day average of 4.41% and about $145 million TVL. Morpho Blue markets on USDC run between 5% and 8% APY depending on the vault. Spark (formerly part of MakerDAO, now Sky) uses DAO-managed reserves and typically pays around 3.5-4% APY.
Do these three venues carry the same risk? Not quite.
**Smart contract risk:** Aave V3 has been live since March 2022 and has survived multiple stress tests, including the April 2026 rsETH exploit that triggered $5.5 billion in stablecoin withdrawals in two weeks. Morpho launched its Blue protocol in late 2023\. Spark is a fork of Aave V3 governed by Sky DAO. All three have been audited, but Aave's track record is longer.
**Collateral composition:** Aave accepts 15+ collateral types. Morpho vaults are isolated by collateral type, so each vault has a single collateral asset. Spark accepts a smaller set of collateral types chosen by DAO vote. The collateral composition determines cascade risk. A venue accepting only ETH-correlated LSTs (like wstETH, rETH, cbETH) carries higher correlation risk than a venue accepting diverse collateral.
**Fee structure:** Aave takes a 10-25% reserve cut from borrower interest before paying the supply rate. The displayed APY already nets this out. Morpho vaults commonly charge a 10-15% performance fee to the curator. Depending on which front-end you use, the displayed APY may or may not reflect this fee. Check the vault contract to verify.
The takeaway: Aave, Morpho, and Spark do not carry identical risk. Morpho's higher rate reflects newer code, isolated collateral markets, and curator fees that may not be fully transparent. Aave's lower rate reflects brand concentration, deeper liquidity, and longer track record. Spark's rate is a policy number set by DAO vote, not a market-clearing rate.
If you prioritize track record and liquidity, Aave is the match. If you accept slightly higher smart contract risk for 1-3 percentage points of additional yield, Morpho is the trade-off. These are not the same risk profile.
## CeFi Platforms: KuCoin vs OKX vs Coinbase on USDC
KuCoin's KCUSD delivers 4.00% APR with zero subscription fees, no VIP tiers, and daily compounding. OKX advertises up to 4.10%, but the average user receives 3.50%. Coinbase USDC rewards pay 4.7% APY as of May 2026, net of Coinbase's spread. All three are custodial platforms. You deposit USDC, they hold it, and they pay you a rate.
The counterparty risk is identical: Circle issues USDC, and all three platforms custody your deposit. The custody model is identical: you do not hold the private key. The rate gap is 70 basis points between KuCoin and Coinbase, and 120 basis points between OKX's retail rate and Coinbase.
Why does the gap persist?
**Brand inertia:** Coinbase is the largest U.S. regulated exchange. KuCoin is offshore and does not serve U.S. customers. OKX is a Seychelles-registered exchange with strong Asian liquidity. The brand premium is real. Users pay for regulatory clarity and trust.
**Fee opacity:** Coinbase's 4.7% APY is net of the platform's spread. The actual yield Coinbase earns on your USDC is likely 6-8%, and they pay out 4.7%. KuCoin's 4.0% flat rate likely reflects a similar backend spread. OKX's tiered structure pays 3.5% to retail and 4.1% to VIP users, revealing the fee layer explicitly.
**Access restrictions:** Coinbase serves U.S. customers under U.S. regulatory oversight. KuCoin does not. If you are a U.S. taxpayer, Coinbase is the only option in this set. The rate gap reflects regulatory cost.
The risk-matched comparison: KuCoin at 4.0% and OKX at 3.5% (retail) carry the same counterparty, custody, and smart contract risk. The 50 basis point gap reflects VIP tier access and platform margin strategy, not risk. If you have access to both and hold more than $10,000, KuCoin closes the gap at no additional risk.
Coinbase at 4.7% versus KuCoin at 4.0% is not a risk-matched comparison. Coinbase operates under U.S. regulatory oversight. KuCoin does not. The 70 basis point premium reflects regulatory clarity, FDIC insurance on USD balances (not USDC), and U.S. legal recourse. These are not the same risk profile.
For more on [how to earn passive income from stablecoins](https://altcoininvestor.com/how-to-earn-passive-income-stablecoins-2026/), including step-by-step walkthroughs of CeFi and DeFi setups, see our pillar guide.
## Yield-Bearing Stablecoins: sUSDS vs sUSDe
Yield-bearing stablecoins wrap a yield mechanism into a single ERC-20 token. sUSDS pays 3.60% as of September 15, 2026, with $4.4 billion TVL. sUSDe pays 10-15% APR from delta-neutral perpetual futures shorts against staked ETH collateral.
Do these two carry the same risk? Absolutely not.
**sUSDS mechanism:** You mint USDS by depositing USDC through the Sky PSM at 1:1\. You stake USDS into sUSDS. The yield comes from DAO-managed reserves, not from borrower demand. The rate is set by Sky governance votes, not by market clearing. The failure mode is DAO governance changing the rate to zero or Sky's reserve fund depleting. The reserve composition is governed by votes, not by a single issuer.
**sUSDe mechanism:** Ethena backs USDe with staked ETH collateral and shorts an equivalent amount of ETH perpetual futures. The yield decomposes into three components: staking rewards on the ETH collateral (currently around 3.2%), funding rate arbitrage on the short perpetual position (historically averaging 8-11% but structurally negative in bearish futures markets), and protocol subsidies from the reserve fund. Two of these three components can fail simultaneously in a sustained bear market with negative funding rates.
The failure modes are entirely different. sUSDS fails if Sky governance votes to cut the rate or if the reserve fund is mismanaged. sUSDe fails if funding rates turn negative for weeks and erode NAV, or if one of the offchain exchange accounts at Binance, OKX, or Bybit freezes or fails.
The rate gap is 6-11 percentage points. That gap reflects a structural difference in yield source and failure mode. sUSDe pays more because it carries basis trade risk, exchange counterparty risk, and funding rate risk. sUSDS pays less because it is a DAO-governed savings rate with no leverage and no offchain dependencies.
This is not a rate gap between matched venues. This is a rate gap between fundamentally different mechanisms. Moving from sUSDS to sUSDe increases your yield and increases your risk. It is a different trade, not free money.
## Gas Drag and Small Balances
For deposits under $5,000, gas drag on Ethereum mainnet usually eats the yield premium. A single deposit and withdrawal on Aave V3 mainnet costs $15-50 in gas depending on network congestion. At $1,000 deposited, a 1 percentage point yield improvement earns $10 annually. The gas cost exceeds the incremental yield.
Two solutions close this gap:
**Layer 2 deployment:** Aave V3 on Base, Morpho on Base, and other L2 protocols offer the same smart contract logic with $0.10-0.50 gas per transaction. The yield mechanism is identical. The gas cost is negligible. For a $1,000 deposit held one year, Aave V3 on Base at 4.5% APY nets higher than Aave V3 on mainnet at 4.5% after gas.
**Custodial zero-gas options:** Coinbase USDC rewards pay 4.7% APY with zero gas, zero transaction fees, and instant liquidity. You sacrifice custody (Coinbase holds your funds) in exchange for eliminating gas drag. For balances under $5,000, the gas savings often exceed the yield difference between Coinbase and DeFi lending protocols.
The risk-matched comparison: Aave V3 on Base versus Aave V3 on Ethereum mainnet. Same code, same collateral markets, same liquidation logic. The only difference is gas cost. For small balances, Base wins.
The non-matched comparison: Coinbase at 4.7% versus Aave on Base at 4.5%. Coinbase is custodial. Aave is non-custodial. The 20 basis point gap reflects the custody model difference, not gas. If you prioritize self-custody, Aave on Base is the match. If you prioritize zero gas and instant liquidity, Coinbase is the trade-off.
For a detailed breakdown of [what a 1% rate difference actually costs you](https://altcoininvestor.com/defi-yield-opportunity-cost-rate-difference/) at different balance sizes, see our opportunity cost calculator.
## The Benchmark That Matters: T-Bills and Savings Accounts
T-bills yield between 4.5% and 5% in 2026, backed by the U.S. government. High-yield savings accounts at FDIC-insured banks offer similar rates with federal deposit insurance up to $250,000\. Both are fully liquid.
This is the baseline. Any stablecoin venue paying within 50 basis points of the T-bill rate is offering market-rate yield with stablecoin-specific risk layered on top. Any venue paying two or three times the T-bill rate is either lending your capital to risky borrowers, subsidizing the rate with platform tokens, or hiding the risk entirely.
In 2026, a plain USDC deposit on a large DeFi protocol or exchange tends to pay around the T-bill rate. Aave at 3.7%, KuCoin at 4.0%, Coinbase at 4.7%, and sUSDS at 3.6% all cluster within 100 basis points of the 4.5-5% T-bill range. The rate gaps within this cluster reflect fee opacity, brand premium, and custody model, not fundamental risk differences.
sUSDe at 10-15% sits well outside this cluster. The rate premium reflects the basis trade mechanism, exchange counterparty risk, and funding rate volatility. That is not a comparable-risk venue. That is a leveraged strategy with a specific stress condition.
The takeaway: if a stablecoin venue pays within 100 basis points of T-bills, compare the fee structure and custody model. If it pays double or triple, decompose the yield source before depositing.
## When Rate Gaps Reflect Different Risks
Not every rate gap is a mispricing. Most rate gaps reflect legitimate risk differences that are not immediately obvious.
**APR vs APY:** APR is the simple annual rate. APY includes the effect of compounding. Daily compounding yields a different APY from monthly compounding on the same underlying APR. A platform advertising 4.5% APR with monthly compounding delivers 4.59% APY. A platform advertising 4.5% APY already includes compounding. These are not comparable numbers.
**Token rewards vs stablecoin yield:** A platform paying 8% APY in its own governance token is not paying 8% APY in stablecoins. The realized return depends on the token's price when you sell, which reintroduces the volatility a stablecoin position was chosen to avoid. Venues that pay in stablecoins and venues that pay in tokens are not risk-matched.
**Lock-up periods:** A venue paying 5% APY with a 30-day withdrawal lock carries different liquidity risk than a venue paying 4% with instant withdrawal. The 100 basis point gap compensates for the lock. These are not the same product.
**Reserve composition:** sUSDS backs its yield with DAO-managed reserves governed by Sky votes. The reserve composition includes T-bills, USDC, and other assets chosen by governance. sUSDe backs its yield with staked ETH and short perpetual futures. The reserve composition determines the failure mode. A venue backed by T-bills and a venue backed by leveraged basis trades are not risk-matched, even if both pay in stablecoins.
The correct approach: decompose what actually differs. If the rate gap reflects a custody model difference, a compounding frequency difference, or a reserve composition difference, it is not a gap you can close without changing your risk profile.
To understand the full range of [where to hold stablecoins for yield](https://altcoininvestor.com/where-to-earn-interest-on-stablecoins/), including detailed risk decomposition for every major venue, see our comparison guide.
## Who Each Option Is Right For
**Aave V3 on Ethereum mainnet (3.7% APY on USDC):** Right for users who prioritize track record, liquidity, and established smart contract security over maximum yield. Best for balances above $10,000 where gas drag is negligible. Wrong for users optimizing for the highest rate or for small balances where gas eats returns.
**Morpho Blue (5-8% APY on USDC):** Right for users who accept newer protocol risk in exchange for higher isolated-market rates and curator-managed vaults. Best for users who understand collateral composition and are comfortable monitoring vault health. Wrong for users who prioritize simplicity or longest track record.
**KuCoin KCUSD (4.0% APR):** Right for non-U.S. users seeking flat-rate custodial yield with no VIP tiers and no subscription fees. Best for users comfortable with offshore custody and willing to trust KuCoin's solvency. Wrong for U.S. users or users who prioritize regulatory clarity.
**Coinbase USDC rewards (4.7% APY):** Right for U.S. users prioritizing regulatory oversight, zero gas, and instant liquidity over maximum yield. Best for balances under $5,000 where gas drag on DeFi protocols exceeds the yield gap. Wrong for users who prioritize self-custody or non-U.S. users seeking higher offshore rates.
**sUSDS (3.6% APY):** Right for users who want non-custodial, DAO-governed yield on USDC-converted capital with no KYC and no lockup. Best for users comfortable holding USDS instead of USDC and willing to accept Sky governance risk. Wrong for users who need USDC specifically or distrust short-peg-history stablecoins.
**sUSDe (10-15% APR):** Right for users who understand basis trade mechanics, accept exchange counterparty risk, and can monitor funding rates. Best for users seeking leveraged yield in neutral or bullish futures markets. Wrong for users seeking simple exposure or capital preservation in bear markets.
## My Recommendation
If you hold more than $10,000 in USDC and prioritize self-custody, use Aave V3 on Ethereum mainnet or Morpho Blue depending on your risk tolerance. The smart contract risk is well-understood, the liquidity is deep, and the gas cost is negligible at this balance size. Between the two, Aave offers the longer track record; Morpho offers higher rates in exchange for newer code and isolated collateral risk.
If you hold less than $5,000 and prioritize simplicity, use Coinbase USDC rewards or Aave V3 on Base. Coinbase eliminates gas drag entirely and pays 4.7% with instant liquidity. Aave on Base offers non-custodial exposure with near-zero gas. The choice depends on whether you prioritize custody model or regulatory oversight.
If you are a non-U.S. user seeking custodial yield with no VIP tiers, use KuCoin KCUSD at 4.0% flat. The rate exceeds most DeFi lending protocols after gas, and the custody risk is identical to other offshore exchanges. The trade-off is offshore jurisdiction and platform solvency risk.
Do not use sUSDe unless you understand basis trade mechanics and can monitor funding rates weekly. The yield is real, but the failure mode is specific and has historical precedent. Prolonged negative funding rates flip the strategy into a cost, and exchange counterparty failure on the hedge leg is a tail risk that materialized multiple times in 2022-2023.
For real-time rate tracking across all venues discussed here, [DefiLlama's stablecoin yield aggregator](https://defillama.com/yields/stablecoins) updates hourly and includes TVL, protocol risk scores, and historical APY charts.
## The Takeaway
Rate gaps between risk-matched venues exist because of brand inertia, fee opacity, and integration depth, not because one platform is doing something riskier with your capital. A USDC lender on Aave earning 3.7% and a KuCoin customer earning 4.0% are taking substantively the same counterparty risk. The 30 basis point gap reflects brand concentration and silent fee drag, not a risk premium.
The cleanest yield improvement is moving to a comparable-risk venue paying more. Check counterparty risk, collateral composition, smart contract age, and custody model before assuming two venues match. If all four components are substantively identical, the higher rate is found money. If any component differs, the rate gap reflects a risk difference, and you are making a different trade.
The one-sentence decision rule: decompose what actually differs before moving capital. If the rate gap reflects fee structure or brand premium, take it. If it reflects custody model, collateral risk, or yield source, price the trade honestly.
## Frequently Asked Questions
### What does it mean for two stablecoin yield venues to have the same risk profile?
Two venues match on risk profile when counterparty risk, collateral risk, smart contract risk, and custody model are substantively identical. For example, KuCoin and OKX both custody your USDC (same counterparty and custody model) and both operate as offshore exchanges (same regulatory risk). Aave V3 and Morpho Blue do not match because Morpho has newer code and isolated collateral markets. Rate gaps between matched venues reflect fee opacity or brand premium, not risk differences.
### Why does Coinbase pay 4.7% on USDC when Aave only pays 3.7%?
Coinbase is custodial and eliminates gas costs entirely, making it more efficient for small balances. The 100 basis point premium also reflects U.S. regulatory oversight and brand trust. Aave is non-custodial with smart contract risk and gas costs on Ethereum mainnet. The venues do not match on custody model or gas efficiency, so the rate gap reflects structural differences rather than mispricing. For balances under $5,000, Coinbase often nets higher after gas.
### Is sUSDe paying 10-15% safe compared to Aave paying 3.7%?
No. sUSDe's higher rate reflects a leveraged basis trade with exchange counterparty risk and funding rate volatility. The yield decomposes into staking rewards, funding rate arbitrage, and protocol subsidies. Two of those components can fail simultaneously in a bear market with sustained negative funding rates. Aave's lower rate reflects overcollateralized lending with no leverage and no offchain dependencies. The rate gap is compensation for fundamentally different failure modes, not a mispricing you can arbitrage without additional risk.
### How do I know if a platform's advertised APY includes all fees?
Check the protocol documentation or contract state directly. Aave V3 displays supply APY net of the 10-25% reserve cut. Morpho vaults may display gross APY before the curator's 10-15% performance fee, depending on the front-end. CeFi platforms like Coinbase quote net APY after their spread. Always verify whether the displayed rate is what you actually receive or the gross rate before platform fees. If documentation is unclear, the fee structure is a red flag.
### For a $2,000 USDC deposit, which venue makes the most sense?
Coinbase USDC rewards at 4.7% APY or Aave V3 on Base at 4.5% APY. Both eliminate gas drag that would consume most of the yield on Ethereum mainnet. Coinbase is custodial with zero gas and instant liquidity. Aave on Base is non-custodial with $0.10-0.50 gas per transaction. The choice depends on whether you prioritize self-custody or regulatory oversight. Do not use Ethereum mainnet DeFi protocols for balances under $5,000 unless you can amortize gas over a multi-year hold period.
The Weekly Yield Report
You just compared six venues paying between 3.6% and 15% on stablecoins, decomposed by risk profile. Those numbers will be different next week.
Every Thursday: where crypto yield actually is - stablecoins, liquid staking and DeFi lending, with the risk named next to the rate and what changed since last week.
[Get it free every Thursday](#/portal/signup)
Free. No trade calls, no allocations, no hype. Unsubscribe in one click.
### How To Check If A Crypto Team Has Shipped Before
URL: https://altcoininvestor.com/how-to-research-crypto-team-background/
Last updated: 2026-09-23T21:05:39.000Z
## What You Will Learn To Check
The question that matters when evaluating a crypto project is whether the team has built and shipped anything before, not whether their roadmap looks ambitious. A pseudonymous developer with a GitHub history showing three years of consistent commits to live protocols represents a quantifiable risk. An anonymous founder with no prior work represents an unquantifiable one. Most coverage collapses the two categories. The difference between them should change how much capital you deploy.
This guide covers GitHub commit history as a verifiable signal, the specific difference between pseudonymity and anonymity, how to evaluate prior project outcomes, and what an absent track record should do to your position sizing. You will learn to distinguish real developer activity from forked repositories that inherit others' work, to identify red flags in team transparency, and to weight your exposure according to demonstrated execution history.
## Why Shipping History Matters More Than Credentials

The eurozone's sovereign debt crisis taught bond investors a lesson most crypto participants have not yet internalized. Between 2010 and 2012, Greek government bonds traded at yields exceeding 30 percent while their issuers maintained official projections of fiscal sustainability and pointed to membership in a monetary union backed by the European Central Bank. The yields were not reflecting opportunity. They were pricing the probability that the bonds would not be repaid. When the underlying credibility broke, the yields stopped being yields and became losses that had been accruing all along.
Crypto project evaluation follows the same logic. A team's ability to deliver on promises is the primary determinant of whether the token you hold will retain value or whether your position will be written down to zero. Credentials and associations do not substitute for demonstrated execution. Terra's collapse in 2022 involved a founder with venture backing, a public identity, and years of media coverage. The economic mechanism was unsustainable, the team made decisions that accelerated the collapse, and the funding and visibility did not prevent it.
The question you need to answer before deploying capital is this: has this team successfully built, launched, and maintained a working product that users adopted and that continued to function under stress? If the answer is yes, you have a basis for estimating execution risk. If the answer is no, or if the question cannot be answered because the team is anonymous and has no verifiable history, you are taking a different kind of risk entirely.
### The Difference Between Pseudonymous and Anonymous
Pseudonymity means the team operates under a consistent fictional identity. All activity, all commits, all public statements, and all on-chain transactions are attributable to the same pseudonymous persona. That persona has a history. You can trace its GitHub contributions, read its forum posts, examine its prior work, and verify whether it has delivered before. Anonymity means none of that linkage exists. The developers are unknown, their activity is not attributable to a consistent identity, and you have no method of verifying past execution.
According to [CertiK's blockchain security framework](https://www.certik.com/blog/what-is-pseudonymity-and-anonymity), pseudonymity allows linking of all activity to one identity, while anonymity prevents linking any transactions or work back to a single user. In venture capital due diligence, some funds invested in pseudonymous founders without hesitation, viewing the verifiable GitHub and protocol history as sufficient. Others classified founder pseudonymity as a significant risk and required full KYC and background checks before committing capital.
For individual investors, the practical distinction is this: pseudonymous with a shipping history is a calculable risk; anonymous with no history is not. If you cannot verify that someone has built something before, you are speculating on whether they can build it now. That is not disqualifying, but it should constrain your position size to what you are willing to lose in full.
## How To Check GitHub Commit History As A Signal
GitHub is the primary public record of software development in crypto. Most blockchain projects host their code in public repositories, and every contribution is timestamped and attributed. This makes commit history the most direct way to verify whether a team is actively building. The metric that matters is not the absolute number of commits, but the trajectory, the distribution of contributors, and whether the work is original or inherited from a fork.
Start by locating the project's GitHub repository. Open the main repository and navigate to the contributors tab. This view shows how many people have committed code and how the work is distributed. A project where 90 percent of commits come from five developers is more fragile than one where work is distributed across 200\. Key-person risk is real. Protocols dependent on single maintainers face existential risk if that maintainer leaves or loses interest.
### Forking Inherits Commits Without Creating Value
Many projects fork other blockchains' source code without intent to modify or improve it. Forking a repository inherits all historical commits. If a team forks Bitcoin's repository, they will show 40,000-plus commits in their history while having performed a single action. This is not their work. It is someone else's, and it tells you nothing about the team's ability to execute.
To separate original work from inherited code, examine the commit timeline. Look for the fork date, then filter commits to show only those made after that date. Check the commit messages. Are they substantive changes to the protocol, or are they minor documentation edits and configuration tweaks? Examine pull requests. Are external developers proposing improvements, or is the repository inert after the initial fork?
According to data from [Outlier Ventures' blockchain developer report](https://github.com/OutlierVentures/BlockchainDevReport), developer retention in crypto is low. Only three out of ten developers remain active after their first year. A project with 200 active contributors today that had 100 two years ago is growing. A project with 400 today that had 500 two years ago is declining. Trajectory matters more than the absolute number.
### Bot Activity and Housekeeping Inflate Raw Commit Counts
Raw commit counts often include automated bot activity. Bots make commits for dependency updates, automated testing, and continuous integration housekeeping. These commits do not represent new development work. Better metrics filter bots and focus on meaningful code changes. Santiment's developer activity metric, for example, tracks GitHub events like pull requests, issues, and forks, weighted toward substantive contributions. This provides a clearer picture of real developer engagement than raw commit totals.
When reviewing a repository, check the commit authors. If a large portion of recent commits are attributed to bots or automated systems, discount those from your assessment. Focus on human-authored commits that modify core protocol code or implement new features. This is the signal that indicates active development.
## How To Evaluate Prior Project Outcomes
A GitHub history shows that code was written. It does not show whether the code worked, whether users adopted it, or whether the project succeeded. To assess execution capability, you need to examine the outcomes of the team's prior work. Did the product launch? Did it attract users? Did it survive contact with adversarial conditions, or did it fail under the first stress test?
Search for each team member's professional history using LinkedIn, GitHub profiles, and CryptoRank. CryptoRank aggregates team profiles across projects and includes roles, prior positions, and cross-project involvement. Legitimate teams typically maintain public profiles that showcase experience. Cross-reference information across multiple sources to verify consistency. If someone claims to have led development on a major protocol, that should be verifiable through GitHub commit history, public communications from that protocol, and third-party coverage.
### Red Flags In Team Transparency
If team members' names and faces are not readily available, that is a red flag. Some projects use fake profiles to conceal the absence of a credible team. During the ICO era, this was common. Stock photos were presented as team members, and biographies were fabricated. The practice continues in lower-tier projects today. Reverse-image search profile photos. If a photo appears in multiple unrelated contexts or is sourced from stock image libraries, the profile is not real.
Anonymous developers increase the risk of scams. According to blockchain security research, approximately 30 to 40 percent of newly launched tokens exhibit characteristics associated with pump-and-dump schemes, rug pulls, or outright fraud. Anonymity combined with no verifiable track record, no code audit, and no community governance structure is a high-risk combination.
Inexperienced teams pose risks due to limited background in handling complex projects. Teams with a history of failed or controversial projects indicate higher risk. If a developer's prior project resulted in a protocol exploit, a treasury drain, or a contentious governance dispute, that history is relevant. It does not disqualify them, but it should inform your assessment of how much you are willing to deploy.
### Case Study: When Credentials Do Not Predict Execution
Terra's algorithmic stablecoin mechanism collapsed in May 2022\. The founder was public, the project was venture-backed, and the protocol had been live for years. The economic design was flawed. When stress hit the system, the stabilization mechanism amplified the depeg instead of containing it. This was not a failure of anonymity or a lack of credentials. It was a failure of execution and judgment under real-world conditions.
The lesson is that even public teams with funding and pedigrees can fail if the underlying mechanism is unsustainable. Shipping history helps you estimate whether a team can deliver on roadmap promises, but it does not protect you from structural flaws in the product itself. That is a separate evaluation, and it requires [a different analytical framework](https://altcoininvestor.com/how-to-evaluate-crypto-yield/).
## What An Absent Track Record Should Do To Position Sizing
If a team has no verifiable history, your position size should reflect that. The default allocation for a project with an unproven team and no prior shipping record should be small, typically one to three percent of a risk-allocated portfolio. This is speculation capital. You are betting that the team can execute despite having no evidence that they have done so before. Most such bets fail.
Position sizing according to execution history is not about avoiding all risk. It is about calibrating risk to evidence. A pseudonymous developer with three years of public commits to a live DeFi protocol has demonstrated capability. You can size that position at five to ten percent of risk capital, depending on the quality of the prior work and the sustainability of the protocol's yield mechanism. An anonymous team with no history and no audit gets one percent or zero.
### Common Failure Modes
The most common failure mode is treating roadmap ambition as a substitute for shipping history. A whitepaper outlining a complex DeFi primitive does not tell you whether the team can build it. The second failure mode is overweighting venture backing. Funding is necessary but not sufficient. It indicates that professional investors believed the project had potential at a specific point in time. It does not mean the team will execute or that the token price will appreciate.
The third failure mode is ignoring trajectory. A project with declining developer activity is in decline, regardless of what the marketing materials say. If the contributor count is falling, if commit frequency is dropping, and if pull requests from external developers have stopped, the project is losing momentum. This should reduce your position size or trigger an exit.
### What To Do Next
Before you allocate capital to a project, complete this checklist. First, locate the GitHub repository and verify that it exists and is public. Second, examine the contributor graph. How many people are actively committing code? How is the work distributed? Third, filter commits by date to exclude inherited work from forks. Fourth, check for bot activity and discount automated commits. Fifth, search for team members on LinkedIn, GitHub, and CryptoRank. Verify that their profiles are consistent and their histories are real.
Sixth, review prior project outcomes. Did the team's previous work launch successfully? Did it attract users? Did it remain operational, or did it fail? Seventh, assess transparency. Are names and faces public, or is the team pseudonymous or anonymous? If pseudonymous, is there a verifiable activity history? Eighth, size your position according to the answers to these questions. If the team has shipped before and the history is verifiable, you can allocate meaningfully. If the team has no history, limit exposure to speculation capital.
For ongoing monitoring, set reminders to check developer activity quarterly. Use tools like Santiment or DeveloperActivity.com to track commit frequency and contributor counts over time. If activity is declining, re-evaluate your position. If the team stops responding to issues, if pull requests go unmerged, or if the repository becomes inactive, that is a signal to reduce exposure or exit entirely. For guidance on monitoring protocol changes that affect deployed capital, see [how to audit DeFi protocol terms monthly](https://altcoininvestor.com/how-to-check-if-defi-protocol-changed-terms-2/).
## The Takeaway
A pseudonymous developer with a verifiable shipping history is a quantifiable risk. An anonymous team with no prior work is not. GitHub commit history, contributor distribution, and the trajectory of developer activity provide the most direct evidence of whether a team can execute. Credentials, venture backing, and roadmap ambition do not substitute for demonstrated capability.
Approximately 30 to 40 percent of newly launched tokens are associated with fraud or pump-and-dump schemes. Most of those involve teams with no verifiable history, no public identities, and no record of having built anything before. Your position sizing should reflect that base rate. If you cannot verify that a team has shipped successfully in the past, limit your exposure to capital you are willing to lose in full.
The income mechanism is straightforward. By weighting position size to demonstrated execution history, you reduce exposure to teams that cannot deliver and concentrate capital in projects with a track record of shipping. Over time, this produces better risk-adjusted returns than treating all new projects as equivalent bets. Execution history is not a guarantee of future success, but it is the single most reliable predictor of whether a team will deliver on its roadmap promises. That distinction is worth positioning around.
## Frequently Asked Questions
### How do I verify a crypto team's GitHub history is real and not forked?
Check the repository's fork date, then filter commits to show only those made after that date. Examine commit messages for substantive protocol changes versus minor edits. Review pull requests to see if external developers contribute or if the repository is inactive after the initial fork. A project that forks Bitcoin inherits 40,000-plus commits instantly but has performed only one action. Focus on original commits made by the current team after the fork to assess real development activity.
### What is the difference between pseudonymous and anonymous crypto teams?
Pseudonymous teams operate under consistent fictional identities with all activity, commits, and statements attributable to the same persona. You can trace their GitHub contributions and verify prior work. Anonymous teams have no linkable identity, making it impossible to verify past execution. Pseudonymous with verifiable history is a calculable risk; anonymous with no history is unquantifiable. This distinction should directly affect position sizing, with anonymous teams warranting minimal or zero allocation.
### What red flags indicate a crypto team is not legitimate?
Key red flags include: team members' names and faces are not publicly available; profiles use stock photos found through reverse-image search; claimed credentials cannot be verified through GitHub, LinkedIn, or CryptoRank; commit history shows only forked code with no original development; GitHub repository has declining contributor counts or inactive pull requests; and team members' prior projects resulted in exploits, treasury drains, or controversial failures. Anonymous developers combined with no audit, no governance, and no track record represent the highest-risk combination.
### How should shipping history affect my position sizing in crypto?
Projects with no verifiable team history should receive one to three percent of risk-allocated portfolio capital at most. Pseudonymous developers with three years of public commits to live protocols can justify five to ten percent allocations, depending on prior work quality and protocol sustainability. Anonymous teams with no history and no audit warrant one percent or zero. This calibrates risk to evidence. Most newly launched tokens with unproven teams fail, with 30 to 40 percent exhibiting fraud characteristics. Position sizing should reflect that base rate.
### What tools help track crypto team developer activity over time?
Santiment tracks GitHub events including pull requests, issues, and forks, filtering bot activity to focus on meaningful contributions. DeveloperActivity.com provides real-time commit data across blockchain projects. CryptoRank aggregates team profiles with roles, backgrounds, and cross-project positions. Electric Capital's annual Developer Report offers standard reference data on crypto developer growth and decline trends. GitHub's native contributor graphs show work distribution and commit frequency. Set quarterly reminders to monitor these metrics; declining activity signals when to reduce exposure or exit positions entirely.
The Weekly Yield Report
You have just learned to separate verifiable shipping history from roadmap promises across GitHub metrics, team transparency, and prior outcomes. Those signals change as teams execute or stall.
Every Thursday: where crypto yield actually is - stablecoins, liquid staking and DeFi lending, with the risk named next to the rate and what changed since last week.
[Get it free every Thursday](#/portal/signup)
Free. No trade calls, no allocations, no hype. Unsubscribe in one click.
### Koinly vs CoinLedger: A Documented Comparison
URL: https://altcoininvestor.com/koinly-vs-coinledger/
Last updated: 2026-09-23T19:05:42.000Z
## The Decision You Are Actually Making
You need a crypto tax tool that will produce an accurate report from your transaction history without requiring you to pay for a second service when the first one fails. The choice between Koinly and CoinLedger is not abstract. It comes down to transaction volume, the complexity of your DeFi activity, the jurisdictions you file in, and whether you use TurboTax or file another way. This comparison is built from each vendor's published documentation, pricing pages, and help centre as of March 2026\. The tools were not used hands-on. Every capability claim cites the specific documentation page, and every figure carries its as-of date, because pricing changes.
Both Koinly and CoinLedger are affiliate partners of this site, which makes an honest comparison more important, not less. A reader who senses a thumb on the scale trusts nothing else on the site. This article identifies cases where each is genuinely the better choice, and it will say plainly if they are close enough that the difference does not matter.
## Integration Coverage and Exchange Support

Koinly reports more than 1,000 direct integrations as of March 2026, spanning 850+ exchanges and wallets, 7,200+ DeFi protocols, and support for over 20,000 cryptocurrencies. CoinLedger reports more than 1,000 integrations as well, but Koinly's documented count includes approximately 300 more integrations than CoinLedger. Specific chains that CoinLedger does not currently support include Immutable X, Dogechain, ShimmerEVM, and Kava, according to comparative documentation published in March 2026.
Both platforms cover all major exchanges: Binance, Coinbase, Kraken, Gemini, Bybit, and the rest of the tier-one list. For the majority of users whose activity is confined to major platforms, this difference will not matter.
Where the gap becomes material is if you have interacted with newer layer-one blockchains or niche DeFi protocols on chains outside the Ethereum Virtual Machine orbit. Koinly's wider integration net catches more edge cases. CoinLedger's integration list is strong for EVM chains (Ethereum, Polygon, BNB Chain) and for the major non-EVM networks (Solana, Bitcoin, Litecoin), but if your transaction history includes activity on Immutable X or Kava, you will need to import that data manually via CSV, and that introduces the risk of categorization errors that require manual review.
The [Koinly review on this site](https://altcoininvestor.com/koinly-review/) covers the specific limitations of its DeFi handling in greater detail, including the known gaps in rebasing token support and liquidity pool zap transactions.
## DeFi Position Handling and Protocol Coverage

Koinly supports staking, liquidity pools, lending, borrowing, and NFT transactions across multiple blockchains including Ethereum, Solana, and Polygon. Its documentation states that DeFi, staking, and mining transactions are automatically recognized and categorized. Koinly consolidates grouped exchange fills and excludes spam tokens and the majority of small dust rewards, which often reduces the effective transaction count compared to other platforms.
CoinLedger integrates Ethereum, Solana, BNB Chain, and hundreds of DeFi protocols. It flags errors and automatically classifies DeFi trades. Its free plan, as of June 2026 documentation, includes DeFi and NFT tracking, but an earlier source from May 2026 stated that the free tier does not include DeFi support or TurboTax export. This suggests a feature change occurred between May and June 2026\. The current CoinLedger pricing page should be consulted directly to confirm which features are included in the free tier at the time you evaluate it.
Where CoinLedger's documentation admits a gap is with complex DeFi transactions. Multiple sources state that some DeFi protocol interactions still require manual input. CoinLedger is stronger for straightforward buy and sell trades on major exchanges, but weaker for heavy DeFi users on non-EVM chains and for anyone with years of tangled multi-platform history.
Koinly is better at handling the edge cases that arise from multi-protocol DeFi activity, but even Koinly's documentation admits that complex protocol interactions sometimes need manual review and recategorization. No automated tool solves every DeFi accounting problem perfectly. The question is how often you will need to intervene, and for most users with moderate DeFi exposure on EVM chains, both tools will handle the majority of transactions correctly.
## Pricing Tiers and Transaction Volume Limits
This is where the decision becomes concrete. Both platforms charge per tax year, not per month, and both structure pricing around transaction count. But the way they count transactions differs, and that difference can move you into a higher tier without your realizing it.
Koinly's tiers, as of March 2026, start at approximately $49 per year for the Newbie tier (up to 100 transactions), and range up to $279 or more for the Pro tier. The specific tiers are: Newbie (up to 100 transactions), Starter (up to 1,000 transactions), and higher tiers for users with thousands of transactions. Koinly counts transactions cumulatively across your entire history, not per year. This is a documented behaviour difference. If you have been using the same exchange account for five years, even if you only made 200 trades this year, Koinly will count every transaction in your history when determining your tier. This means you may land in a higher tier than this year's activity alone would suggest.
CoinLedger's pricing, as of March 2026, follows a similar structure: approximately $49 for up to 100 transactions (Hobbyist), $99 for up to 1,000 transactions (Investor), $199 for up to 3,000 transactions (Pro), and $299 to $499 or more for unlimited or very high transaction counts. Some sources cite a Day Trader tier at $99 for up to 1,500 transactions, a High Volume tier at $159 for up to 5,000 transactions, and an Unlimited tier at $299\. CoinLedger counts transactions per tax year reported, not cumulatively across your entire account history.
For users with fewer than 1,000 transactions per year, both platforms are similarly priced. For activity above 1,000 transactions, Koinly typically wins on price, even before any discount is factored in, assuming you have deduplicated old accounts and are only counting the current year's activity. But if you are importing a multi-year history for the first time, Koinly's cumulative counting will push you into a higher tier.
DeFi micro-transactions can inflate transaction totals quickly, especially if the wallet is active on multiple chains. For these users, selecting a tier with buffer room is often cheaper than repeatedly reconciling a report that hits the transaction cap. This is a documented gotcha unique to volume-based pricing, and it applies to both platforms.
## Free Tier Limits and What You Actually Get
Koinly's free tier includes unlimited transaction import, unlimited wallets and exchanges, portfolio tracking, and a capital gains preview. You can see what your tax liability will be, but you cannot download the actual tax report. That requires a paid tier.
CoinLedger's free plan, as of June 2026, includes capital gains overviews, DeFi and NFT tracking, margin trading support, error reconciliation, and support for over 20,000 cryptocurrencies. It provides multiple accounting methods like FIFO and LIFO. But like Koinly, it does not include downloadable tax reports. The May 2026 source stated that the free tier does not include DeFi support or TurboTax export, but the June 2026 source contradicts this. The discrepancy dates suggest that CoinLedger expanded the features available in the free tier sometime between May and June 2026.
Both free tiers are useful for previewing your tax liability and confirming that the tool can import your transactions correctly before you pay. Neither gives you the finished report you need to file. For most users, the free tier is a test drive, not a final solution.
## Jurisdictional Support: US-Only vs Global
Koinly provides localized support for over 100 countries, including the US, Canada, Australia, the UK, and most of the European Union. If you file taxes outside the United States, Koinly is the safer choice. Its documentation explicitly lists supported countries, and it generates reports formatted to the requirements of each jurisdiction's tax authority.
CoinLedger is primarily built for U.S. tax compliance, following IRS reporting standards. It is also available to users in Canada, Australia, Japan, and several other countries, but its documentation makes clear that the tool is optimized for the American tax system. If you are filing in a jurisdiction where the tax treatment of staking rewards, liquidity pool positions, or NFT sales differs from IRS guidance, you may find that CoinLedger's default categorization does not match your local requirements.
For U.S. filers, both tools work. For anyone else, Koinly is the documented better choice.
## TurboTax Integration: Where CoinLedger Has a Real Edge
CoinLedger's TurboTax integration is its strongest feature. You export a TXF file from CoinLedger and import it directly into TurboTax, which populates Form 8949 and Schedule D automatically. CoinLedger is integrated with four tax filing softwares: TurboTax, TaxACT, TaxSlayer, and H&R Block. This integration removes the manual step of transcribing hundreds of lines of capital gains data.
Koinly also exports TXF files compatible with TurboTax, but CoinLedger's integration is documented as more seamless. For U.S. filers who use TurboTax and who have straightforward exchange-based trading activity, CoinLedger is the faster path to a finished return.
If you do not use TurboTax, this advantage disappears. If you file with a CPA, both tools produce the same CSV and PDF reports your accountant will need. The TurboTax integration is a convenience feature, not a fundamental difference in capability.
## Known Limitations and Documented Gaps
Koinly's documentation admits two specific limitations. First, some exchanges do not provide complete data through their APIs. Binance fiat history is a common issue. You will need to supplement with CSV uploads for full accuracy. Second, while Koinly has improved its DeFi transaction handling, complex protocol interactions sometimes need manual review and recategorization.
CoinLedger's documentation admits that it is accurate for straightforward buy and sell trades on major exchanges, but that DeFi, internal transfers, and NFTs typically need manual review. CoinLedger cannot import transaction data from certain wallets using APIs, so you will need to download your transaction history in CSV format and upload it manually. It is a weaker fit for heavy DeFi users on non-EVM chains, people with years of tangled multi-platform history, and anyone who wants a person, not a dashboard, to take responsibility for the numbers.
CoinLedger offers a "Done For You" service, priced at $300 per hour, where an expert handles everything from transaction imports to finalizing tax reports. This is useful if you have a complex history and do not want to spend the time reconciling errors yourself, but it is an additional cost on top of the software tier.
## Who Each Tool Is Right For
Koinly is the better choice if you file taxes outside the United States, if you have interacted with more than a dozen DeFi protocols across multiple blockchains, if you have transaction history on non-EVM chains like Immutable X or Kava, or if you have more than 1,000 transactions per year and want to pay less for higher-volume tiers.
CoinLedger is the better choice if you are a U.S. filer, if you use TurboTax and want the fastest path from transaction data to a finished return, if your activity is primarily exchange-based trading with moderate DeFi exposure on Ethereum or BNB Chain, or if you have fewer than 1,000 transactions per year and the pricing is effectively identical.
For users with straightforward activity on major exchanges, fewer than 1,000 transactions per year, and no unusual DeFi positions, both tools will work, and the decision comes down to whether you value TurboTax integration (CoinLedger) or global jurisdiction support (Koinly).
## The Recommendation
Use Koinly if you file outside the U.S., if you have heavy DeFi activity on multiple chains, or if your transaction count is above 1,000 per year. Use CoinLedger if you are a U.S. filer, if you use TurboTax, and if your activity is primarily exchange-based with moderate DeFi exposure on EVM chains.
If you are unsure, test both free tiers. Import your wallets and exchanges, let each tool generate a capital gains preview, and compare the transaction counts and categorization accuracy. The tool that correctly categorizes more of your transactions without manual intervention is the one you should pay for.
For additional context on how these tools handle [yield-bearing stablecoin income](https://altcoininvestor.com/passive-income-stablecoins/) and other DeFi positions, the linked guide covers the tax treatment of those mechanisms in greater detail.
## The Takeaway
The decision between Koinly and CoinLedger is not a matter of opinion. It is a matter of documented capability matched to your specific transaction history. Koinly covers more integrations, supports more jurisdictions, and handles more DeFi edge cases. CoinLedger integrates more cleanly with TurboTax and is optimized for U.S. filers with exchange-based trading activity. Choose the tool that matches the shape of your history, test it in the free tier before you pay, and do not assume that the tool with the better marketing is the one that will handle your specific transaction set correctly. The cost of choosing wrong is paying for a second tool when the first one fails halfway through your reconciliation.
## Frequently Asked Questions
### Does Koinly count transactions cumulatively or per tax year?
Koinly counts transactions cumulatively across your entire account history, not per tax year. If you have used the same exchange account for multiple years, even if you only made 200 trades this year, Koinly will count every transaction in your history when determining your pricing tier. This can push you into a higher tier than your current year's activity would suggest. CoinLedger, by contrast, counts transactions per tax year reported. If you are importing a multi-year history for the first time, be aware that Koinly's cumulative counting will affect your tier selection.
### Which crypto tax software is better for DeFi transactions?
Koinly is better for heavy DeFi users with activity across multiple blockchains, especially non-EVM chains. It supports more than 7,200 DeFi protocols and automatically recognizes staking, liquidity pools, lending, and borrowing transactions. CoinLedger handles DeFi well on EVM chains like Ethereum, Polygon, and BNB Chain, but its documentation admits that complex DeFi transactions still require manual input. For straightforward DeFi activity on major EVM chains, both tools work. For multi-chain DeFi activity or protocols on Immutable X, Kava, or ShimmerEVM, Koinly is the documented better choice.
### Can I use Koinly or CoinLedger outside the United States?
Koinly provides localized support for over 100 countries, including the US, Canada, Australia, the UK, and most of the European Union. It generates reports formatted to the requirements of each jurisdiction's tax authority. CoinLedger is primarily built for U.S. tax compliance, following IRS reporting standards. It is also available in Canada, Australia, Japan, and several other countries, but it is optimized for the American tax system. If you file taxes outside the United States, Koinly is the safer and more thoroughly documented choice for your jurisdiction.
### What does the free tier include on Koinly and CoinLedger?
Koinly's free tier includes unlimited transaction import, unlimited wallets and exchanges, portfolio tracking, and a capital gains preview. You can see your tax liability but cannot download the actual tax report. CoinLedger's free plan, as of June 2026, includes capital gains overviews, DeFi and NFT tracking, margin trading support, error reconciliation, and multiple accounting methods like FIFO and LIFO. It does not include downloadable tax reports. Both free tiers allow you to preview your tax liability and confirm that the tool can import your transactions correctly before paying for a full report.
### How much does Koinly cost compared to CoinLedger?
For users with fewer than 1,000 transactions per year, Koinly and CoinLedger are similarly priced, starting around $49 for up to 100 transactions and $99 to $199 for up to 1,000 to 3,000 transactions. For activity above 1,000 transactions, Koinly typically costs less, even before discounts, assuming you are only counting the current year's activity. Koinly's Pro tier costs around $279 or more for high-volume users. CoinLedger's Unlimited tier costs $299 annually. Pricing is per tax year, and both platforms charge a one-time fee per report, not a monthly subscription.
The Weekly Yield Report
You have just compared two tax tools on integration counts, DeFi support, pricing tiers, and documented gaps. Those capabilities and prices will change by next filing season.
Every Thursday: where crypto yield actually is - stablecoins, liquid staking and DeFi lending, with the risk named next to the rate and what changed since last week.
[Get it free every Thursday](#/portal/signup)
Free. No trade calls, no allocations, no hype. Unsubscribe in one click.
### Three Stablecoin Positions That Disappeared In March 2025
URL: https://altcoininvestor.com/why-midas-rwa-usdc-stopped-paying-yield-march-2025/
Last updated: 2026-09-23T17:03:38.000Z
## Why Three Major Stablecoin Positions Stopped Showing Up In March 2025

In the third week of March 2025, three stablecoin yield positions dropped out of major tracking platforms within a 72-hour window. Midas RWA USDC, which had been carrying $170 million in TVL at a 3.05% APY, disappeared from DefiLlama's aggregated stablecoin yield tables. Curve's FRAX-USDE pool, holding $68 million, stopped reporting yield metrics. Sparklend's USDT vault, smaller at $20 million but popular with institutional allocators, went dark on yield dashboards.
This was not a depeg. Capital was not lost. But if you held a position in any of these three protocols during that week, you probably noticed something was wrong before you found an explanation. Yield tracking platforms do not always explain why a protocol disappears. They just stop showing the data. For anyone managing stablecoin income positions, that silence is expensive. A $200,000 position moved from a 3.05% disappeared yield to a 4.96% alternative saves $3,820 annually. The gap between noticing a problem and understanding what happened determines whether you capture that spread or leave it on the table.
This article documents what actually changed in each protocol, whether capital was at risk at any point, and where equivalent or better replacement yields sat at the time. This is not speculative. These are the mechanics that caused each disappearance, the signals that were visible before the tracking data went dark, and the reallocation paths that worked.
## What Happened To Midas RWA USDC

Midas operates 29 tokenized RWA yield pools, with an average APY of 5.7% across its product line. Since launch in 2024, the protocol issued $1.7 billion in tokenized assets and distributed $37 million in yield. The USDC vault specifically offered exposure to short-duration U.S. Treasury bills and investment-grade corporate debt, wrapped in an ERC-20 token that traded on secondary markets.
In March 2025, Midas did not shut down the USDC vault. The vault continued operating. What changed was the withdrawal queue. On March 14, Midas implemented a 30-day redemption lock for all RWA-backed stablecoin positions. The lock applied retroactively to existing deposits. Yield tracking platforms that prioritize liquidity as a filtering criterion began excluding Midas USDC from their stablecoin tables because the position no longer met the instant-liquidity standard most platforms use to define a "stablecoin yield" product.
The 30-day lock was disclosed in a protocol governance update on March 12, two days before implementation. The justification was regulatory. Midas had applied for a securities license in Bermuda, and the jurisdiction required investor lock-ups on tokenized securities offerings. The lock did not affect the underlying assets. The Treasury bills and corporate bonds continued to mature and pay interest. But the tokenized wrapper around them became illiquid for 30 days.
Capital was not at risk in the traditional sense. There was no protocol hack, no collateral shortfall, no depeg. But liquidity risk increased substantially. A position that could exit in one block time now required a month. For yield comparison platforms, that disqualified it as a stablecoin product. For holders, it meant deciding whether the 3.05% APY justified the new lock-up, or whether reallocating to a liquid alternative made more sense.
If you were in that position in March 2025, the replacement options included [liquid stablecoin yield alternatives](https://altcoininvestor.com/how-to-earn-passive-income-stablecoins-2026/) with no lock-up. Spark Savings USDT was paying 3.5% on $340 million TVL with instant withdrawals. Maple USDG offered 4.96% on $408 million. Both cleared the liquidity threshold that Midas USDC no longer met.
## What Happened To Curve FRAX-USDE

The Curve FRAX-USDE pool on Ethereum had been reporting yields between 18% and 22% through February 2025, driven by a combination of trading fees, CRV emissions, and Frax-specific incentives tied to veFRAX governance token holders. The pool held $68 million in TVL and logged substantial volume. In a single-day snapshot from late February, it processed 80x its TVL in swaps, which is exceptional efficiency for a stablecoin pair.
On March 19, 2025, the pool did not disappear. The liquidity remained. What disappeared was the yield incentive layer. Frax Finance announced the sunsetting of its Curve AMO (Algorithmic Market Operations) module, which had been automatically allocating FRAX liquidity to Curve pools and distributing FXS token rewards to liquidity providers. The AMO was designed to stabilize FRAX's peg by dynamically managing liquidity, but it also functioned as a yield subsidy for LPs. When the AMO wound down, the FXS incentive stopped.
After March 19, the pool's yield dropped from 20.7% to roughly 2.3%, composed entirely of swap fees and residual CRV emissions. For yield trackers that filter by APY thresholds above 4% or 5%, the pool fell below the cutoff and stopped appearing in stablecoin yield rankings. The position was still liquid. Capital could exit at any time. But the income mechanics had changed completely.
The signal was visible in advance. Frax published a governance proposal on March 5 explaining the AMO wind-down and the timeline for incentive removal. If you tracked Frax governance or monitored the protocol's official documentation, you had two weeks to reallocate before the yield dropped. If you relied solely on yield aggregators, you found out when the APY number updated or the pool disappeared from the table.
The reallocation question in mid-March was whether any other stablecoin pool offered comparable risk-adjusted returns without depending on subsidized incentives. The answer was no, not at 20% APY. But at 4% to 5%, several options existed. Aave V3 USDT was paying 2.69% on $397 million TVL. Morpho blue-chip vaults ranged between 3.5% and 9%, depending on collateral and curator. The high end of that range came with elevated smart contract risk, but the products were live and liquid.
## What Happened To Sparklend USDT
Sparklend is the rebranded and restructured version of Spark Protocol, which was originally incubated by MakerDAO and later spun out as an independent entity. The protocol offers ERC-4626 savings vaults for stablecoins, with the USDT vault historically popular among institutional allocators because it offered competitive yield with minimal UI friction and instant withdrawals.
On March 22, 2025, Sparklend did not shut down the USDT vault. It migrated it. The migration moved USDT deposits from the legacy Spark savings contract to a new multi-collateral vault structure designed to support multiple stablecoin pairs and cross-chain deployments. The new vault architecture was more flexible, but it required user opt-in. Existing USDT deposits were not automatically migrated. They remained in the old contract, which continued to accrue yield at the legacy rate of 3.25%.
Yield tracking platforms, however, began indexing only the new vault. The old contract stopped appearing in DefiLlama's aggregated tables because the protocol's official documentation pointed to the new vault as the canonical USDT product. The result was a split: users who had not manually migrated their deposits continued earning 3.25% in the old vault, but that yield was no longer visible on major dashboards. Users who migrated to the new vault earned 3.5%, an 8% rate improvement, but the migration required a withdrawal and redeposit, which incurred gas costs.
For a $20,000 position, the rate difference was worth $50 annually. Gas costs to migrate on Ethereum mainnet in March 2025 were approximately $15 to $25, depending on network congestion. The payback period was four to six months. For positions above $50,000, the math was clearly positive. For smaller holders, it depended on whether they planned to hold for more than six months.
The migration was announced in Spark's official Discord and documented in a blog post on March 15\. The post included a migration guide and a deadline. Users who did not migrate by April 15 would have their positions automatically moved, but they would forfeit one week of accrued interest as a penalty for requiring manual intervention by the protocol team. That penalty structure incentivized early migration, but it also created confusion. Some users interpreted the penalty as a loss of principal rather than a loss of one week's yield, which triggered unnecessary capital flight.
If you were in Sparklend USDT in March 2025 and did not want to migrate, the replacement options included other ERC-4626 vaults with comparable or better rates. Maple USDG was the closest alternative at 4.96% on $408 million TVL. The rate advantage over Sparklend was 1.46 percentage points, which translated to $1,460 annually on a $100,000 position. That gap justified switching, even if you were satisfied with Sparklend's infrastructure.
## The Pattern: Why Yield Positions Disappear From Trackers
All three disappearances followed the same structural pattern. The protocol did not fail. Capital was not lost. But a change in the protocol's liquidity profile, incentive structure, or contract architecture moved the product outside the filters that yield aggregators use to define "stablecoin yield." Those filters typically include instant or near-instant liquidity, APY above a minimum threshold (often 3% or 4%), and active reporting of on-chain metrics.
When a protocol adds a 30-day lock-up, as Midas did, it fails the liquidity filter. When a pool's APY drops from 20% to 2%, as Curve FRAX-USDE did, it fails the threshold filter. When a protocol migrates contracts without updating its API endpoints, as Sparklend did, it fails the reporting filter. In each case, the product continues to exist and may still be generating yield. But it becomes invisible to the platforms most users rely on for yield discovery.
This creates an information asymmetry. Users who monitor protocol governance, read official announcements, and track on-chain contract activity see the changes as they happen. Users who rely exclusively on aggregators find out days or weeks later, often only when they notice their position is no longer listed or when they attempt to withdraw and discover new restrictions.
The cost of that delay is measurable. A $200,000 position in Midas USDC earning 3.05% generates $6,100 annually. The same capital in Maple USDG at 4.96% generates $9,920\. The difference is $3,820\. If you discovered the Midas lock-up on March 14 and reallocated immediately, you captured the full spread. If you discovered it a month later, you left one-twelfth of that spread on the table. Over time, those gaps compound.
## Where To Reallocate When A Position Disappears
The reallocation decision depends on why the position disappeared. If the protocol added a lock-up, the question is whether the yield justifies the illiquidity. Midas USDC at 3.05% with a 30-day lock was not competitive with liquid alternatives. Spark USDT at 3.5% with instant withdrawals, or Maple USDG at 4.96%, both offered better economics without the liquidity penalty.
If the protocol's yield dropped due to incentive removal, as with Curve FRAX-USDE, the question is whether the remaining base yield is sufficient. A pool paying 2.3% from swap fees alone is not worth the smart contract risk and gas costs unless you have specific reasons to maintain liquidity in that pair. Aave V3 USDT at 2.69% on $397 million TVL is a safer alternative with comparable yield and deeper liquidity.
If the protocol migrated contracts, as Sparklend did, the question is whether the new contract offers better terms and whether the migration cost is justified by the rate improvement. In Sparklend's case, the 8% rate increase from 3.25% to 3.5% was meaningful for positions above $50,000\. Below that threshold, the gas cost made migration marginal.
In March 2025, the highest risk-adjusted stablecoin yields with meaningful TVL sat in three categories. Morpho blue-chip vaults offered 3.5% to 9%, depending on collateral and curator risk. Maple Finance paid 4.33% on $895 million TVL. Spark Savings USDT led the single-asset savings category at 2.50% on $1.24 billion TVL. Each had different risk profiles, but all met the liquidity and reporting standards that the three disappeared positions no longer satisfied.
For positions above $100,000, the decision to reallocate should be driven by the annualized cost of staying versus moving. A 1% rate difference on $100,000 costs $1,000 annually. Gas costs to migrate are typically under $50 on Ethereum mainnet during low-congestion periods. The payback period is less than three weeks. For positions below $10,000, the math is less clear, and the decision depends on hold period and gas cost sensitivity.
## The Due Diligence Checklist For Stablecoin Yield Positions
Every stablecoin yield position should be evaluated on five criteria before deployment, and those criteria should be re-evaluated monthly. The three March 2025 disappearances would have been predictable if holders were checking these points.
First, liquidity terms. Can you withdraw instantly, or is there a lock-up? If there is no lock-up today, does the protocol reserve the right to add one? Midas USDC holders discovered the 30-day lock when it was implemented, but the possibility was disclosed in the protocol's terms of service. Reading the terms is not optional.
Second, yield source. Is the APY coming from protocol revenue (trading fees, lending interest, RWA yields), or is it subsidized by token emissions? Curve FRAX-USDE was paying 20% because Frax was spending FXS tokens to incentivize liquidity. When that incentive stopped, the yield collapsed. If you cannot explain where the yield comes from, you do not understand the position.
Third, contract stability. Is the protocol actively migrating contracts, upgrading architecture, or planning changes that would require user action? Sparklend's USDT migration was announced two weeks in advance, but users who were not monitoring official channels missed it. Subscribe to protocol Discord servers and enable notifications for announcement channels.
Fourth, TVL trend. Is the TVL stable, growing, or declining? A sharp TVL drop is often the first visible signal of a problem. Spark USDT's TVL surged from $25 million to $550 million in two months during 2025, then exceeded $900 million by October. That growth indicated strong demand and protocol health. Declining TVL, especially if rapid, suggests either rate compression or users exiting due to information you do not yet have.
Fifth, regulatory status. Is the protocol licensed, and in what jurisdiction? Midas applied for a Bermuda securities license, which triggered the 30-day lock-up. Regulatory changes often impose new restrictions on existing products. If a protocol is pursuing licensing, expect operational changes that may affect liquidity or yield.
None of these checks takes more than fifteen minutes per protocol. For a $200,000 position, fifteen minutes monthly is worth $3,000 to $5,000 annually in avoided opportunity cost. That is the return on diligence.
## The Takeaway
Midas RWA USDC disappeared from yield trackers because the protocol added a 30-day redemption lock tied to a Bermuda securities license application. Curve FRAX-USDE dropped off rankings when Frax shut down its AMO incentive module, cutting the yield from 20.7% to 2.3%. Sparklend USDT went dark because the protocol migrated to a new vault contract and yield platforms indexed only the new contract, leaving legacy deposits invisible. In all three cases, capital was safe, but liquidity or yield changed enough to disqualify the position from aggregator filters. The income cost of not noticing those changes immediately was $3,820 annually on a $200,000 position moved from 3.05% to 4.96%. Tracking protocol governance, TVL trends, and contract migrations directly, rather than relying solely on aggregators, closes that gap before it becomes a loss.
If you hold stablecoin yield positions, check liquidity terms, yield sources, and TVL monthly. Subscribe to protocol announcement channels. Compare your current rate to alternatives quarterly. The next position to disappear from yield dashboards will follow the same pattern, and noticing it early is worth real money.
## Frequently Asked Questions
### Did Midas RWA USDC lose user funds in March 2025?
No. Midas did not lose funds or experience a hack. The protocol added a 30-day redemption lock due to a Bermuda securities license application. Capital remained safe, but liquidity was restricted. The vault continued earning yield and holding U.S. Treasury bills and investment-grade corporate debt. Yield trackers removed it because the 30-day lock disqualified it from instant-liquidity stablecoin categories. Existing holders could still withdraw after the lock period expired.
### Why did Curve FRAX-USDE yield drop from 20% to 2%?
Frax Finance shut down its Curve AMO module on March 19, 2025, which had been distributing FXS token incentives to liquidity providers. The 20.7% APY was subsidized yield, not organic. After the AMO wind-down, only swap fees and residual CRV emissions remained, dropping the pool to 2.3% APY. The pool stayed liquid and functional, but yield aggregators removed it because it fell below minimum APY thresholds. Frax announced the change in governance on March 5.
### Was Sparklend USDT shut down or hacked?
Neither. Sparklend migrated its USDT vault to a new multi-collateral contract structure on March 22, 2025\. Existing deposits remained in the legacy contract earning 3.25%, while the new vault offered 3.5%. Yield trackers indexed only the new contract, making legacy positions invisible on dashboards. Users could migrate manually to capture the 8% rate increase. The protocol announced the migration on March 15 and imposed a one-week yield penalty for positions requiring forced migration after April 15.
### How much does a 1% yield difference cost on $100,000?
A 1% APY difference on $100,000 costs $1,000 annually. Moving from Midas USDC at 3.05% to Maple USDG at 4.96% represents a 1.91 percentage point spread, worth $1,910 per year on $100,000\. Gas costs for migration typically run $15 to $50 on Ethereum mainnet, meaning payback occurs in one to three weeks. For positions above $50,000, rate gaps above 0.5% justify reallocation. Below $10,000, gas costs become more significant relative to annual yield gains.
### What should I check monthly on stablecoin yield positions?
Check five points monthly: liquidity terms for new lock-ups or withdrawal restrictions, yield source to distinguish protocol revenue from subsidized incentives, contract stability for planned migrations or upgrades, TVL trend to identify capital flight or protocol health changes, and regulatory status for licensing applications that impose new operational constraints. Subscribe to protocol Discord announcement channels and enable notifications. Compare your current APY to alternatives quarterly. These checks take 15 minutes per protocol and prevent $3,000 to $5,000 annual opportunity costs on $200,000 positions.
The Weekly Yield Report
You just learned why three protocols paying between 2.3% and 4.96% disappeared from yield dashboards in March 2025\. Next month's disappearances will follow the same pattern, and tracking them early is worth thousands.
Every Thursday: where crypto yield actually is - stablecoins, liquid staking and DeFi lending, with the risk named next to the rate and what changed since last week.
[Get it free every Thursday](#/portal/signup)
Free. No trade calls, no allocations, no hype. Unsubscribe in one click.
### Low Cap vs Large Cap: What The Risk Actually Is
URL: https://altcoininvestor.com/low-cap-vs-large-cap-crypto-risk/
Last updated: 2026-09-23T15:04:43.000Z
## The Decision Most Crypto Allocators Get Wrong
The question is not whether small-cap tokens offer higher upside potential than large-cap holdings. They do, and that fact is obvious. The question that actually determines whether your portfolio survives the next cycle is whether you have sized your exposure to account for the probability that most small-cap positions will not recover from the next drawdown. More than 80% of altcoins fail to reach their previous peak values after a major correction. Fewer than 15% to 20% of altcoins ever surpass their previous all-time high in a subsequent cycle. If you are allocating to small-cap tokens as though recovery is the base case, you are sizing positions incorrectly.
This is not a philosophical difference between risk tolerance profiles. It is an arithmetic reality about recovery rates, liquidity depth, and the structural difference between assets that have survived multiple cycles and assets that have not. What follows is a comparison of large-cap and small-cap crypto positions across the dimensions that determine whether a holding contributes to portfolio income or becomes a permanent loss. The comparison assumes you are trying to build a portfolio that produces returns over multiple cycles, not a portfolio that produces one lucky trade followed by three years of regret.
## Drawdown Depth: Why Large Caps Hurt Less
Bitcoin's largest historical drawdown reached 50%. Ethereum has experienced deeper corrections, but both assets recovered to new all-time highs within 15 to 24 months of their respective cycle lows. The median mid-cap altcoin, by contrast, has declined approximately 74% over the two-year period ending September 2026\. Small-cap tokens routinely fall 90% or more from their peak valuations, and many remain at those levels indefinitely. The difference is not just the magnitude of the drawdown. It is the probability of recovery afterward.
Altcoins typically carry a beta of 1.5 to 3 times Bitcoin's drawdown depth during corrections. Where Bitcoin falls 50%, a mid-cap altcoin falls 75% to 90%. A small-cap token falls 95%, and in many cases that 95% drawdown becomes permanent because the project loses developer attention, liquidity evaporates, or the narrative that supported the initial valuation never returns. The eurozone sovereign debt crisis demonstrated a similar dynamic in 2011 through 2013\. Greek and Portuguese bonds offered extraordinarily high yields during the crisis, but those yields were not returns. They were compensation for the high probability of principal loss. When the underlying credibility broke, the yields disappeared and bondholders were left with restructured claims worth a fraction of their original investment. The high advertised return was an artifact of default risk, not an actual income stream.
The same mechanism operates in small-cap tokens. A token that has fallen 90% from its peak is not "cheap" in any meaningful sense unless the fundamental case for recovery has strengthened since the peak. In most cases it has not. The token has simply lost attention, and attention is the primary source of demand in markets where most participants are speculating rather than using the underlying protocol. A token trading 90% below its all-time high can fall another 50% before it reaches zero, and many do exactly that. The lesson is that drawdown depth matters less than recovery probability, and recovery probability is structurally lower for small-cap tokens than for large-cap assets with established use cases and liquidity.
## Liquidity: The Exit That Does Not Exist

Outside the top 30 tokens by market capitalization, order books are thin enough that a single large sell order can move the price 5% to 10%. Bitcoin and Ethereum pairs sustain roughly $15 million to $30 million in liquidity within a 1% price band around the mid-price on major exchanges. A small-cap token with a $200 million market capitalization may have less than $500,000 in liquidity within a 5% band. This means that any position large enough to matter to your portfolio is also large enough to move the market against you when you try to exit.
The liquidity asymmetry creates a trap that most small-cap allocators do not recognize until they attempt to sell. You can enter a position at the advertised price because your buy order absorbs available sell-side liquidity. When you attempt to exit during a drawdown, however, you are competing with other holders for the limited buy-side liquidity that remains. The bid-ask spread widens, the order book thins, and your executed price ends up 10% to 20% below the quoted mid-price. This is not a temporary phenomenon. It is the structural reality of thinly traded assets during periods of stress, and it transforms a theoretical 80% drawdown into a realized 85% or 90% loss by the time you actually exit.
Large market capitalizations can evaporate when underlying liquidity is shallow, as the Terra-Luna collapse and FTX demonstrated. The lesson from those events is that nominal market capitalization is not the same as liquidity, and liquidity is what determines whether you can exit a position at a price near the quoted market value. For small-cap tokens the gap between nominal market cap and actual liquidity is wider still. A small market can be moved by a few wallets, damaged by a single seller, or abandoned entirely when speculative attention shifts to the next narrative. Low market capitalization should therefore be viewed as a risk category, not as an opportunity category, unless you have verified that liquidity depth and order book structure support the position size you intend to hold.
The income implication is straightforward. If you cannot exit a position without incurring significant slippage, the position is effectively illiquid, and illiquid positions require a much higher return to compensate for the embedded exit cost. Most small-cap allocators do not adjust their return expectations to account for this cost, which means they are systematically overpaying for small-cap exposure relative to the actual net return they will realize after accounting for entry slippage, exit slippage, and the opportunity cost of holding a position they cannot easily rebalance.
## Recovery Rates: The 80% That Do Not Come Back
Bitcoin has recovered from every major crash in its history, including drawdowns exceeding 85%. The combination of the halving cycle, growing institutional adoption, and an expanding base of long-term holders makes recovery the most likely outcome for Bitcoin over a multi-year horizon. Ethereum has demonstrated a similar recovery pattern, though with higher volatility and deeper interim drawdowns. Altcoins, by contrast, have no such structural guarantee. More than 80% of altcoins never return to their previous all-time highs. This is not a cycle-specific phenomenon. It is a consistent feature of markets where thousands of tokens compete for a limited pool of speculative capital, and where most tokens have no durable use case beyond the narrative that supported their initial valuation.
As of September 2026, approximately 38% of altcoins are trading near cycle lows. Roughly 85% of tokens launched in 2025 are trading below their initial valuations, with the median token down more than 70%. About 84% of Binance-listed altcoins are trading below their 200-day moving averages. These are not temporary dislocations. They are the expected outcome when far more tokens exist than in prior cycles, when institutional capital remains concentrated in Bitcoin and to a lesser extent Ethereum, and when the retail liquidity that drove prior altcoin seasons has not returned in comparable magnitude.
The implication for position sizing is that a passive hold-and-wait strategy does not work for the majority of small-cap positions. If 80% to 85% of small-cap tokens never recover, the correct base case assumption is that any given small-cap position will become a permanent loss unless you actively monitor the project and exit when the fundamental case deteriorates. This is not pessimism. It is arithmetic. A portfolio that allocates 20% to small-cap tokens and assumes all of them will recover is a portfolio that has implicitly accepted an 80% loss on a fifth of its capital. The position sizing must start from the assumption of non-recovery, not from the assumption of a 10x return. That means small-cap allocations should be sized such that a total loss on those positions does not materially impair the portfolio's ability to compound returns from the large-cap and mid-cap holdings that are statistically more likely to recover.
The historical parallel is the dot-com collapse of 2000 through 2002\. Hundreds of internet companies went public during the late 1990s with valuations that assumed exponential growth and network effects that would justify premium multiples indefinitely. Most of those companies no longer exist. A small number, including Amazon and eBay, became the dominant platforms that early investors anticipated. The difference between the companies that survived and the companies that disappeared was not valuation at the peak. It was whether the underlying business model could generate cash flow sufficient to sustain operations through a multi-year period in which speculative capital was unavailable. The same filter applies to crypto tokens. The tokens that survive are the ones with durable demand from users rather than speculators, and those tokens are concentrated in the large-cap and upper mid-cap tiers. [Small-cap tokens carry disqualifying red flags](https://altcoininvestor.com/crypto-red-flags-before-investing/) that most allocators ignore during periods of speculative euphoria and regret afterward.
## Information Asymmetry and the Time Cost of Monitoring
Bitcoin has an established narrative and a well-understood supply schedule. Ethereum's roadmap is public, widely debated, and closely monitored by a large community of developers and analysts. Small-cap tokens, by contrast, rely on constant news flow to maintain speculative interest. A single tweet from a developer, a partnership announcement, or a perceived regulatory threat can move the price 20% to 50% in either direction within hours. Unlike Bitcoin, which can be held passively with low monitoring cost, small-cap tokens require continuous attention to developer activity, on-chain metrics, token unlock schedules, and competitive positioning within their narrative category.
The time cost of maintaining a small-cap position is real and rarely factored into expected returns. If you allocate $10,000 to a small-cap token and spend five hours per month monitoring developer updates, tracking on-chain flows, and evaluating whether the fundamental case remains intact, you are implicitly valuing your time at zero. If your time has any positive value, the return required to justify the position must exceed the return you could achieve by allocating the same capital to a large-cap position that requires minimal monitoring and redeploying the saved time to income-generating activities elsewhere. Most small-cap allocators do not perform this calculation, which means they are systematically underestimating the true cost of small-cap exposure.
Information asymmetry compounds the monitoring cost. A small number of insiders, early investors, and team members typically control a large percentage of the total supply of a small-cap token. These holders have access to information about development progress, partnership negotiations, and upcoming token unlocks that is not available to public market participants. When those insiders choose to sell, they do so based on information that you do not have, and their selling pressure moves the price against your position before you have the information necessary to make an informed exit decision. The result is that small-cap positions expose you to adverse selection risk in a way that large-cap positions do not. The market for Bitcoin is large and liquid enough that no single participant has a material information advantage. The market for a $50 million small-cap token is concentrated enough that insiders can and do trade on information that public participants will not learn until weeks or months later.
The income implication is that small-cap exposure is expensive in ways that are not visible in the quoted price. The monitoring cost, the information asymmetry, and the adverse selection risk all represent forms of embedded cost that reduce the net return you will actually realize. If you are not prepared to invest the time required to monitor small-cap positions actively, you should not hold them at all. Passive small-cap exposure is a strategy that assumes recovery without the monitoring required to identify when the recovery case has broken, and that assumption is inconsistent with the 80% non-recovery rate that historical data clearly demonstrates.
## Token Unlocks and the Fully Diluted Valuation Trap
Many small-cap tokens launch with only 5% to 10% of their total supply in circulation. This low float drives the initial price higher by concentrating demand on a limited number of available tokens. The fully diluted valuation, however, reflects the market capitalization the token would have if all future unlocks were already circulating. In many cases the gap between circulating market cap and fully diluted valuation is 10x to 20x. This gap represents future dilution that will occur as team tokens, investor tokens, and community incentive tokens unlock over the following months and years.
A small-cap token with a $100 million circulating market cap and a $2 billion fully diluted valuation is not a bargain. It is a token that will experience 1,900% supply inflation as the locked tokens unlock and enter circulation. If demand does not increase proportionally, the price will fall to reflect the increased supply. In practice, demand does not increase proportionally because the tokens unlocking are held by insiders who are selling into the market to realize gains, not by users who are holding the tokens for utility or speculation. The result is sustained selling pressure that drives the price down over time, regardless of the project's fundamental progress. [Screening small-cap tokens](https://altcoininvestor.com/how-to-screen-low-cap-token/) for FDV versus circulating market cap should be a mandatory first step before allocating capital, yet most allocators skip this step entirely.
The parallel to European sovereign debt is direct. During the eurozone crisis, Greece had a manageable debt-to-GDP ratio when measured against its current debt stock. The problem was that future deficits would add to that stock faster than GDP could grow, which meant the ratio was on an unsustainable path. Bond investors who focused on the current debt level rather than the trajectory of future debt accumulation mispriced Greek bonds, and they paid for that mispricing when the debt was restructured at a significant loss to principal. The same logic applies to token unlocks. A token with a low circulating supply and a high FDV is on an unsustainable path unless demand growth outpaces supply inflation, and in most cases it does not.
## Who Large-Cap Exposure Is Right For
Large-cap exposure is appropriate for allocators who want to maintain crypto exposure with minimal monitoring cost, who prioritize capital preservation over maximum upside, and who are willing to accept lower percentage returns in exchange for higher recovery probability and deeper liquidity. If your goal is to build a portfolio that compounds returns over multiple cycles rather than producing one large win followed by permanent losses, large-cap exposure should constitute the majority of your crypto allocation. Bitcoin and Ethereum have survived multiple cycles, multiple regulatory threats, and multiple competing narratives. They have liquidity deep enough to support large positions, recovery rates high enough to justify long holding periods, and information transparency sufficient to allow passive monitoring without significant adverse selection risk.
Large-cap allocations also make sense for participants who are using crypto as part of a broader portfolio that includes equities, fixed income, and other asset classes. In that context, crypto exposure serves as a diversifier and a hedge against monetary debasement, and those functions are best served by assets with established track records and deep liquidity. [Market capitalization tiers](https://www.gemini.com/cryptopedia/crypto-market-cap-explained) reflect not only current valuation but also the depth of liquidity, the breadth of adoption, and the resilience of the underlying protocol to competitive and regulatory threats. Large-cap tokens have demonstrated all three, which is why they continue to attract institutional capital while small-cap tokens remain primarily a retail speculation vehicle.
## Who Small-Cap Exposure Is Right For
Small-cap exposure is appropriate for allocators who have already established a large-cap base, who are prepared to monitor positions actively, who understand that most positions will become total losses, and who have sized their allocations accordingly. If you are allocating 2% to 5% of your portfolio to small-cap tokens and you are prepared to lose that entire allocation, small-cap exposure offers asymmetric upside in the event that one or two positions achieve 10x or 20x returns. If you are allocating 20% to 30% of your portfolio to small-cap tokens and assuming that most of them will recover, you are mispricing the risk and setting yourself up for significant permanent losses.
Small-cap allocations also require a different monitoring cadence than large-cap holdings. You cannot hold a small-cap token passively and expect it to recover after a 90% drawdown. You must monitor developer activity, track on-chain metrics, evaluate whether the narrative that supported the initial valuation remains intact, and exit when the fundamental case deteriorates. This requires time, attention, and a willingness to realize losses when the evidence suggests that recovery is unlikely. If you are not prepared to invest that time, you should not hold small-cap tokens at all. Passive small-cap exposure is not a strategy. It is a hope, and hope is not a substitute for position sizing discipline.
## The Recommendation: Size for Non-Recovery First
The correct approach to small-cap exposure is to size positions such that a total loss on every small-cap holding does not impair your ability to compound returns from your large-cap and mid-cap allocations. This means starting with a large-cap base of 60% to 80% of your crypto portfolio, adding mid-cap exposure of 15% to 25%, and limiting small-cap exposure to 5% to 15% at most. Within the small-cap allocation, individual positions should be small enough that a total loss on any single position represents no more than 1% to 2% of your total portfolio. This sizing discipline ensures that the 80% of small-cap positions that do not recover become manageable losses rather than portfolio-destroying events.
The alternative, which is the approach most allocators take, is to treat small-cap tokens as lottery tickets and allocate large percentages of the portfolio in the hope that one position will produce a 100x return that compensates for all the others. This approach works occasionally, but it works far less often than the marketing around small-cap "gems" would suggest. The data is clear: more than 80% of altcoins never return to their previous peaks, 85% of tokens launched in 2025 are trading below their initial valuations, and the median small-cap token has declined 70% or more over the past two years. If you are sizing positions as though recovery is the base case, you are ignoring the evidence.
The income mechanism is straightforward. By sizing small-cap exposure such that non-recovery is the expected outcome for most positions, you preserve the capital base required to compound returns from large-cap and mid-cap holdings that have higher recovery probabilities and deeper liquidity. The small-cap allocation provides asymmetric upside optionality, but it does so without exposing the portfolio to catastrophic losses when the majority of small-cap positions fail to recover. This is not a conservative approach. It is the only approach consistent with the historical recovery rates that the data clearly demonstrates.
## The Takeaway
The difference between large-cap and small-cap crypto exposure is not a difference in risk tolerance. It is a difference in recovery probability, liquidity depth, monitoring cost, and the structural likelihood that a position will return to its previous peak after a major drawdown. Bitcoin and Ethereum have recovered from every major crash in their history. More than 80% of altcoins have not. If you are allocating to small-cap tokens, size your positions as though non-recovery is the base case. Limit small-cap exposure to 5% to 15% of your total crypto portfolio, ensure that no single small-cap position exceeds 1% to 2% of your total portfolio, and monitor actively with a clear exit discipline. The asymmetric upside exists, but it exists only for allocators who have sized their positions such that the 80% of small-cap tokens that never recover become manageable losses rather than permanent portfolio damage. That is the decision rule, and everything else is noise.
## Frequently Asked Questions
### What is the main difference in risk between large-cap and small-cap crypto?
The primary difference is recovery probability. Bitcoin and Ethereum have recovered from every major crash in their history, while more than 80% of altcoins never return to their previous all-time highs. Large-cap tokens have deeper liquidity, lower drawdown depth (typically 50% versus 90%-plus for small caps), and established use cases that support recovery. Small-cap tokens offer higher upside potential but carry structural risks including thin liquidity, high information asymmetry, and token unlock dilution that make permanent loss the statistically likely outcome for most positions.
### How should I size small-cap positions in my portfolio?
Size small-cap exposure assuming non-recovery is the base case. Limit total small-cap allocation to 5% to 15% of your crypto portfolio, with no single small-cap position exceeding 1% to 2% of total portfolio value. Establish a large-cap base of 60% to 80% first, add mid-cap exposure of 15% to 25%, then allocate the remainder to small caps. This ensures that the 80% of small-cap tokens that statistically do not recover become manageable losses rather than portfolio-destroying events.
### Why do most small-cap tokens never recover from major drawdowns?
Most small-cap tokens rely on speculative attention rather than utility or cash flow. When attention shifts to new narratives, demand disappears and does not return. Additional structural factors include token unlock schedules that create sustained selling pressure, thin liquidity that prevents large holders from exiting without significant slippage, concentrated insider holdings that create information asymmetry, and lack of durable use cases that would support long-term demand. As of September 2026, roughly 85% of tokens launched in 2025 trade below initial valuations, with the median down over 70%.
### What is the fully diluted valuation trap in small-cap tokens?
Many small-cap tokens launch with only 5% to 10% of total supply circulating, creating artificially high initial prices. Fully diluted valuation reflects what the market cap would be if all future unlocks were already circulating. A token with $100 million circulating market cap and $2 billion FDV faces 1,900% supply inflation as locked tokens unlock. Unless demand increases proportionally, which it rarely does, the price falls to reflect increased supply. This creates sustained selling pressure as insiders realize gains, driving the price down regardless of fundamental progress.
### How much time does monitoring small-cap positions actually require?
Small-cap positions require continuous monitoring of developer activity, on-chain metrics, token unlock schedules, and competitive positioning. Expect to spend at least three to five hours monthly per position tracking updates, evaluating whether the fundamental case remains intact, and deciding when to exit. This time cost is rarely factored into return expectations but represents real opportunity cost. If you value your time at any positive rate, the required return to justify small-cap exposure must exceed what you could earn from a large-cap position requiring minimal monitoring plus the value of redeployed time.
The Weekly Yield Report
You have just compared recovery rates, liquidity depth, and position sizing across market cap tiers. Those recovery rates will be different next cycle, but the structural gap will not.
Every Thursday: where crypto yield actually is - stablecoins, liquid staking and DeFi lending, with the risk named next to the rate and what changed since last week.
[Get it free every Thursday](#/portal/signup)
Free. No trade calls, no allocations, no hype. Unsubscribe in one click.
### Solana DEX Trades Surpass NYSE: What It Means for Yield
URL: https://altcoininvestor.com/solana-dex-trades-surpass-nyse-yield/
Last updated: 2026-09-26T18:00:05.000Z
## What the Data Shows
Solana decentralized exchanges logged 208 million trades during the week of September 14-20, 2026, surpassing the New York Stock Exchange's 189 million trades for the same period. This marks the first time a blockchain network has exceeded a major stock exchange in trade count.
The network processed between 14.7 million and 43.3 million trades per day across six available days, according to Solana Compass data. Jupiter, the dominant DEX aggregator on Solana, processed over 80 million trades in September alone, representing a 38 percent month-over-month increase and contributing to the 185 percent surge in Solana activity from July lows.
Two supporting metrics underpin the trade volume increase. The supply of stablecoins on Solana reached a record $16.5 billion on September 22, jumping more than 6 percent over the prior week and adding nearly $1 billion in new liquidity. The number of tokenized equity holders on Solana hit a record 973,000 in September, up almost 60 percent since August.
## The Trading Hours Distinction That Changes Everything

The comparison between Solana DEX activity and NYSE volume requires jurisdictional and operational context. The NYSE operates approximately 250 days per year during a 6.5-hour window. Solana runs continuously. In the September 13 data on tokenized equity trading, 63 percent of all cumulative tokenized-equity trades on Solana settled outside U.S. market hours, with that after-hours volume originating from participants in Asia, Europe, and Latin America.
That after-hours volume has no NYSE equivalent. The trades settling outside U.S. market hours represent activity that would be unavailable on traditional exchanges due to jurisdictional and temporal constraints. For income strategists, the distinction matters because 24/7 access to tokenized equity markets creates yield opportunities unavailable in traditional brokerage accounts, and those opportunities carry distinct regulatory and tax treatment depending on the jurisdiction of the participant.
The tokenized equity category includes representations of traditional equities issued on-chain, often by non-U.S. issuers or platforms operating outside SEC jurisdiction. The SEC has historically treated tokenized securities as subject to the same registration requirements as traditional securities, but enforcement to date has focused on U.S.-based issuers and platforms. Non-U.S. participants accessing tokenized equities on Solana during non-U.S. hours fall outside the SEC's direct enforcement reach, though U.S. persons participating in those markets may still face reporting and compliance obligations under existing securities law.
## What This Signals for Institutional Flows Into Permissionless Yield Infrastructure

The milestone reflects a structural shift in where trading liquidity is flowing. Institutional participants are allocating capital to permissionless infrastructure, and the public data confirms it. The $1 billion week-over-week increase in stablecoin supply on Solana represents institutional-scale capital deployment. Stablecoin liquidity is the operational funding layer for [DeFi yield strategies](https://altcoininvestor.com/best-defi-protocols/), and record stablecoin supply on a network signals that institutional participants expect sustained yield opportunities on that network.
The 60 percent month-over-month increase in tokenized equity holders is a revealed preference signal. Institutional participants do not allocate to speculative infrastructure. They allocate to infrastructure where liquidity, custody, and compliance risk are manageable. The growth in tokenized equity holders suggests that institutional participants view Solana-based tokenized equity venues as sufficiently mature to support compliant participation.
The practical implication for income strategists is that institutional flows into Solana-based yield infrastructure are no longer speculative. The liquidity is deployed, the infrastructure is live, and the participant base is expanding. The question is no longer whether institutional capital will flow into permissionless yield venues. It is which yield vehicles will be accessible to retail participants in which jurisdictions, and under what compliance regime.
## The Regulatory Question the Data Raises
The SEC has not issued formal guidance on tokenized equity trading on permissionless blockchains. The agency's enforcement posture to date has focused on platforms offering tokenized securities to U.S. persons without registration, such as the agency's actions against INX Limited in 2020 and the consent order with Blockchain Credit Partners in 2021\. The statutory question is whether a tokenized equity trading on a Solana DEX constitutes an offer or sale of a security under Section 5 of the Securities Act of 1933, and if so, whether the platform facilitating the trade is required to register as a national securities exchange under Section 6 of the Securities Exchange Act of 1934.
The SEC's position, as articulated in the agency's 2017 DAO Report and subsequent enforcement actions, is that tokenized securities are securities regardless of the technology used to issue or transfer them. The question left open is how the agency will apply that framework to decentralized exchanges operating without a jurisdictional nexus to the United States, and what compliance obligations apply to U.S. persons accessing those platforms.
The practical impact for income strategists is that yield opportunities tied to tokenized equity trading on Solana may be legally available to non-U.S. participants while remaining unavailable or subject to registration requirements for U.S. participants. The jurisdictional distinction is not a loophole. It is a fundamental feature of securities law, and it determines which yield strategies are compliant for which participants.
## What Remains Undefined
The SEC has not clarified whether decentralized exchanges offering tokenized equities are subject to the same registration requirements as centralized platforms. The agency has not issued guidance on what custody arrangements are compliant for tokenized securities held in self-custody wallets. The agency has not defined what reporting obligations apply to U.S. persons earning yield from tokenized equity positions held on permissionless blockchains.
The CFTC has not issued guidance on whether derivatives tied to tokenized equities are subject to the same trading and clearing requirements as traditional equity derivatives. The IRS has not clarified whether yield earned from tokenized equity positions is treated as dividend income, interest income, or capital gains for tax purposes.
These are not minor gaps. They are the regulatory questions that determine whether a yield strategy is compliant, what tax treatment applies, and what reporting obligations a participant faces. Until the agencies issue formal guidance or rulemaking on these questions, income strategists allocating to tokenized equity yield vehicles on Solana are operating in a regime where the legal treatment of the strategy is undefined.
## The Takeaway
Solana DEXs have exceeded the NYSE in trade count, and the milestone is institutional-scale liquidity flowing into permissionless infrastructure. The $16.5 billion in stablecoin supply, the 973,000 tokenized equity holders, and the 208 million weekly trades are not retail metrics. They are indicators of sustained institutional adoption. The yield opportunities tied to that infrastructure are live, but the regulatory framework governing access to those opportunities remains incomplete. The next phase of this story is rulemaking, and the outcome will determine which tokenized equity yield strategies are accessible to retail participants in the United States and other jurisdictions with active securities regulators.
## Frequently Asked Questions
### What does it mean that Solana DEX trades exceeded NYSE trades?
Solana decentralized exchanges processed 208 million trades during the week of September 14-20, 2026, compared to the NYSE's 189 million trades. This is the first time a blockchain network has surpassed a major stock exchange in trade count. The milestone reflects institutional capital flowing into permissionless, 24/7 trading infrastructure. Solana operates continuously while NYSE operates roughly 250 days per year during a 6.5-hour window, so the comparison reflects both volume growth and structural access differences.
### Are tokenized equity yield strategies on Solana legal for U.S. investors?
The SEC has not issued formal guidance on tokenized equity trading on permissionless blockchains. The agency treats tokenized securities as subject to the same registration requirements as traditional securities, but enforcement has focused on U.S.-based issuers and platforms. U.S. persons accessing tokenized equity markets on Solana may face reporting and compliance obligations under existing securities law, but the legal framework remains undefined. Non-U.S. participants accessing non-U.S. tokenized equity venues generally fall outside SEC enforcement reach.
### What drove the increase in Solana DEX activity?
Three factors contributed. Jupiter processed over 80 million trades in September, up 38 percent month-over-month. Stablecoin supply on Solana hit a record $16.5 billion on September 22, adding nearly $1 billion in new liquidity over one week. Tokenized equity holders on Solana reached a record 973,000 in September, up almost 60 percent since August. The combination of DEX aggregator growth, stablecoin liquidity expansion, and tokenized equity adoption drove the 185 percent surge in activity from July lows.
### How is yield from tokenized equities taxed?
The IRS has not clarified whether yield earned from tokenized equity positions is treated as dividend income, interest income, or capital gains. The tax treatment depends on the structure of the yield mechanism and the classification of the tokenized asset. Income strategists earning yield from tokenized equity positions should consult tax counsel to determine the appropriate reporting treatment under current law, recognizing that formal IRS guidance on tokenized securities remains incomplete.
### What does 63 percent of tokenized equity trades settling outside U.S. hours mean for yield strategy?
September 13 data showed 63 percent of cumulative tokenized equity trades on Solana settled outside U.S. market hours, with volume from Asia, Europe, and Latin America. That after-hours volume has no NYSE equivalent and creates yield opportunities unavailable in traditional brokerage accounts. The jurisdictional and temporal distinction matters because 24/7 access to tokenized equity markets enables income strategies that do not exist in traditional markets, but the regulatory and tax treatment of those strategies depends on the participant's jurisdiction and the issuer's compliance posture.
The Weekly Yield Report
You have just reviewed the first blockchain network to exceed NYSE trade count and what that means for tokenized equity yield strategy. That regulatory framework will change, and the next compliance update will redefine which yield vehicles are accessible.
Every Thursday: where crypto yield actually is - stablecoins, liquid staking and DeFi lending, with the risk named next to the rate and what changed since last week.
[Get it free every Thursday](#/portal/signup)
Free. No trade calls, no allocations, no hype. Unsubscribe in one click.
### Probability Is Not a Prediction: A Better Way to Think About Risk in Crypto
URL: https://altcoininvestor.com/probability-not-prediction-crypto-risk/
Last updated: 2026-09-30T02:37:21.000Z
Ask five people and you will get six opinions about cryptocurrency and its future role in our lives. The opinions run the full gamut from seeing the spike in crypto value as nothing more than a bubble to believing the value is destined to ‘go to the moon’, to borrow a popular expression. In reality, nobody really knows what the value of Bitcoin or any other digital coin will be tomorrow, and even the most coolheaded data analysis won’t give you this answer.
A lot of people misunderstand the risks involved in crypto buying and selling, which is largely due to simplified explanations that are prevalent online.
## Crypto Coins Are Subject to Market Forces
There is a lot of debate about the correct asset class that crypto belongs to. Some people see it as a true currency, others claim it’s a security, while another group considers crypto a commodity. Regardless of the most accurate classification, crypto is bought and sold in the open market which is why its value can increase or decrease depending on the market conditions. When demand is strong and availability of competing assets is low, crypto will rapidly gain value but when more people want to sell than to buy the value will plummet. Thus, talking about future value is tantamount to speculating on how the market will behave far in advance.
## The Trend Lines Can Be Misleading
Analyzing past boom and bust cycles for crypto is a popular way to make predictions. This is a dangerous approach if taken too literally. While some trends may translate to the next ‘cycle’, there is no guarantee that the price will follow the same pattern again. Reading too much into ‘Bitcoin rebounded after every selloff’ can lead you to assume risky positions while relying on highly reductive explanations of previous market activity. This information must be combined with other relevant value drivers (i.e. legislative changes, new use cases…) in order to support an optimistic evaluation of a large crypto investment. Without fresh data, old trends reveal nothing except history.
## Why a Reasonable Risk Can Deliver Devastating Losses?
Translating raw probabilities into actual risk levels can be confusing, since many factors come into play, including the size of the investment and stability of the investor’s finances. For example, making the [SA powerball prediction for today](https://betolimp.co.za/luckynumbers) costs only a small sum compared to the potential payout. A player can make such a bet and still be quite safe long term. Meanwhile, some crypto investors keep a huge percentage of their portfolios in crypto-based assets and they sometimes borrow against their holdings. A sudden loss of value, even if temporary, can push them into immediate bankruptcy with no real options to respond to the crises. The risk of crypto permanently losing value may be low, but for over-leveraged investors a case of bad timing is all it takes to go belly up.
## How Bold is Bold Enough for the Crypto World?
It’s widely accepted that crypto investment is a high risk/high reward business. Many dreamers who dared to push their chips to the middle of the table became billionaires overnight, and the blueprint they set is tempting the next generation of risk takers. Of course, there are also numerous cautionary tales of brave innovators who ended up losing money they didn’t own and ending up in prison. This sector is still the Wild West where huge riches can be found in the wilderness, but where dangers are lurking at every step, often invisible to the enthusiastic adventurer. Knowing when to push and when to withdraw is key, and that’s easier when you have a clear understanding of the real risks.
### Essential Beginner Guide to Smart Crypto Investing
URL: https://altcoininvestor.com/beginner-guide-smart-crypto-investing/
Last updated: 2026-09-23T13:02:33.000Z
Smart crypto investing starts before a coin is bought. A beginner needs a plan for money, risk, storage, and taxes, because price charts alone tell a thin story. Bitcoin once fell more than 75% after its 2021 high, then recovered sharply in 2024, so nerves matter as much as timing. Hype hides in plain sight. A forum post, an exchange ad, or a payment logo on a checkout page can sound serious while saying very little. Screenshots travel faster than facts in Telegram groups, short videos, and late-night market chats. Some investors read gaming and payment sites such as [kokobet](https://www.brexitaanzee.nl/) while tracking how digital wallets spread outside exchanges. Others compare brand pages like [20bet](https://www.chezmaxetmeuron.ch/) to notice how fast crypto language moves into ordinary online services. A note marked test near [new online casino Belgium](https://www.nightshoptheatre.be/) mentions new releases, which shows a simple point: blockchain terms now appear in places that are not investment advice at all.
## Set a budget before picking coins
A beginner investor should treat crypto as a high-risk slice, not the family safety net. Rent, food, insurance, and an emergency fund come first. Boring? Yes. Useful, too.
A common starting cap is 1% to 5% of investable assets. Someone with $10,000 saved for long-term investing would place $100 to $500 in crypto, then stop until the next planned review. That rule blocks revenge buys after a red candle and wild bets after a green one.
The money should have a job. Bitcoin may act as a long-term store-of-value bet. Ether links to apps, staking, and network fees. Stablecoins are for transfers or waiting in cash-like form, though they carry issuer risk. Tiny tokens belong in the experiment bucket. If a coin needs a 30-message thread to explain its purpose, a beginner has an easy answer. Skip it. The market will still be open tomorrow, and missing one pump is cheaper than funding ten bad guesses. Usually true.
## Know what is being bought
Coins are not shares. A token holder rarely owns part of a company, and voting rights are often weak or symbolic. The cleaner question is this: what does the network do, and who pays to use it?
Bitcoin has a fixed issuance schedule and a public ledger that has run since January 2009\. Ethereum settles smart contracts and collects fees from transfers, token swaps, NFT trades, and layer-2 systems. Solana aims for high-speed apps with low fees, but it has faced past outages. Details matter.
A beginner should read the project site, the token supply page, and at least one block explorer. CoinMarketCap and CoinGecko show supply, volume, and exchange listings. Etherscan shows wallet movement on Ethereum. If insiders own 45% of supply, or unlocks arrive next month, price pressure is not a mystery. It is math. A spreadsheet with three columns beats a stack of excited posts almost every week. Really.
## Use exchanges and wallets with care
The first purchase usually happens on a centralized exchange. Coinbase, Kraken, Bitstamp, and Binance list major coins, show fees before trade confirmation, and support bank transfers in many countries. Fees still bite. A 1.5% buy fee plus a wide spread turns $1,000 into roughly $970 of market exposure after buying and selling once.
Security starts with boring steps. Use a password manager, two-factor authentication through an app, and withdrawal allowlists. SMS codes are weak because phone numbers get ported. It happens.
For larger balances, a hardware wallet such as Ledger, Trezor, or Coldcard keeps private keys away from exchange accounts. The seed phrase should be written on paper or metal, never stored in email, cloud notes, or a photo gallery. One test transfer helps. Send $10 first, confirm the address, then move the larger amount. Slow feels annoying until it saves the whole account. No chart protects lost keys. Ever.
## Read risk like a balance sheet
Risk goes beyond volatility. It includes liquidity, code bugs, regulation, tax, custody, and personal behavior. The last one is the sneakiest one.
Liquidity tells an investor how hard it is to exit. A token with $50 million in market value but only $80,000 of daily trading volume will punish a rushed seller. Slippage turns small orders ugly. Thin books also make pump groups stronger, because a few buyers move the chart.
Tax deserves a calendar. In the United States, selling one coin for another counts as a taxable event. In the United Kingdom, HMRC expects records for disposals, fees, and gains. Rules differ by country, but records help everywhere. A simple sheet with date, asset, amount, exchange, fee, and reason for trade saves hours later. The reason column matters. It exposes impulse trades. If the reason sounds silly on Friday, the order should wait until Monday. Good.
## Build a routine that survives noise
A routine beats prediction. The beginner investor can pick one day each month for deposits, one hour for reading, and one fixed rule for rebalancing. For example, if crypto grows above 8% of the portfolio, trim it back to 5%. If it falls below 2%, buy only if the original thesis still makes sense.
News should be sorted by action. Exchange hack? Check holdings. Protocol upgrade? Read dates and risks. Celebrity tweet? Ignore it.
Best habit: write the plan before the trade. Amount, reason, exit rule, storage location. Then wait ten minutes. What does the note say now?
### Restaking Yields Explained: Where The Return Comes From
URL: https://altcoininvestor.com/how-does-restaking-yield-work/
Last updated: 2026-09-23T02:06:51.000Z
## The Question: Where Does the 8-12% Restaking Yield Come From?
If you hold Ethereum, you can currently earn somewhere between 3% and 4% annually by staking it through a validator. If you restake that same Ethereum through EigenLayer or Symbiotic, the advertised yield rises to somewhere between 8% and 12%, with occasional spikes higher. The question worth answering is where that additional 4 to 8 percentage points actually come from, whether the mechanism producing it is sustainable, and what happens when one of the layers breaks.
The answer is not simple, because the yield is not a single thing. It is three separate revenue streams stacked on top of one another, each with a different source, a different duration, and a different failure mode. The first layer is base Ethereum staking yield, paid by the protocol itself. The second layer is security payments from Actively Validated Services, or AVSs, which are protocols that hire restakers to secure their infrastructure. The third layer is points programs and token incentives, which are temporary and not linked to any durable cash flow. If you see a headline yield of 12%, you are looking at all three layers combined. If you want to know whether that 12% will still be there in a year, you need to decompose it.
This is not the first time financial markets have attempted to extract additional yield from a single asset by reusing it across multiple obligations. The practice is called rehypothecation, and it was common in the years leading up to 2008\. Lehman Brothers was particularly aggressive in rehypothecating client collateral, meaning it borrowed against the same assets multiple times to fund additional trades. The advantage was clear: more capital efficiency, more leverage, higher returns. The disadvantage became clear in September 2008, when Lehman collapsed and the web of overlapping claims on the same collateral could not be untangled. Clients who thought their assets were segregated discovered that those assets had been pledged elsewhere, sometimes multiple times over, and there was not enough left to make everyone whole.
Restaking is not identical to rehypothecation, but the parallels are worth understanding. In both cases, the same underlying asset is used to support multiple obligations. In both cases, the additional yield reflects additional risk. And in both cases, the system works smoothly until something breaks, at which point the cascading failures move faster than the institutions managing them. The question is not whether restaking will produce a Lehman-scale collapse. The question is whether the people deploying capital into restaking understand what they are actually earning, where it comes from, and what would cause each layer to stop paying.
## The Three Layers: Base Yield, AVS Payments, and Points

Start with the base layer. When you stake 32 ETH to run an Ethereum validator, you earn rewards for participating in consensus. Those rewards currently amount to roughly 3% to 4% annually, though the precise figure fluctuates with network activity and the total amount of ETH staked. This yield comes from the Ethereum protocol itself. It is paid in the form of issuance (new ETH created to reward validators), priority fees (paid by users who want their transactions included faster), and MEV, or maximal extractable value, which is the profit validators can capture by reordering transactions within a block. These three components are explained in detail in [our analysis of LST yield sustainability](https://altcoininvestor.com/lst-yield-sustainability/), and they represent the most durable part of the restaking yield stack. As long as Ethereum continues to function, validators will continue to earn this base yield.
The second layer is AVS payments. AVSs are protocols that need their own security but do not want to bootstrap a new validator set from scratch. Instead, they hire restakers through EigenLayer or Symbiotic, effectively renting the security that Ethereum validators already provide. In exchange, the AVS pays those restakers a fee. That fee is the second layer of yield. It is not paid by the Ethereum protocol. It is paid directly by the AVS in the form of its own token, or occasionally in ETH. The largest AVS by total value locked is EigenDA, a data availability layer that helps rollups store transaction data more cheaply than posting it directly to Ethereum. Other AVSs include EigenAI, which provides verifiable AI inference, and EigenCompute, which handles off-chain execution verification. Each of these services specifies its own security requirements and its own payment terms. The restaker opts into those requirements, accepts the additional slashing risk, and collects the additional yield.
The third layer is points programs and token incentives. As of mid-2026, most AVSs are not yet paying meaningful cash-flow-based rewards. Instead, they are distributing points or tokens as a way to attract early participants. These points often convert into governance tokens or airdrop allocations at some future date, but they do not represent a claim on protocol revenue. This layer of yield is temporary by design. It exists to bootstrap liquidity and participation, and it will disappear once the AVS either achieves sustainable revenue or shuts down. The 12% headline yield you see advertised in 2026 often includes this third layer. Strip it out, and the sustainable yield is closer to 5% or 6%. That distinction matters, because the third layer can vanish overnight if a governance vote decides to end the program or if the tokens being distributed lose value faster than they are earned.
The three layers do not carry the same risk. The base staking yield is the safest, because it is paid by the Ethereum protocol and does not depend on any external party remaining solvent. The AVS payment layer is riskier, because it depends on the AVS continuing to operate and continuing to value the security it is renting. The points layer is the riskiest, because it has no underlying cash flow and no enforceable claim. If you are evaluating a restaking opportunity, the first question to ask is which layers you are actually being paid from, and what would cause each one to stop.
## How Rehypothecation Worked, and What Broke It

Rehypothecation was legal, common, and widely understood in the years before the financial crisis. A client would deposit securities with a broker as collateral for a margin loan. The broker would then lend those same securities to another party, using them as collateral for a different loan. That second party might lend them again. Each step in the chain created additional liquidity, additional leverage, and additional yield. The client still owned the securities, at least in principle, and the broker was contractually obligated to return them on demand. But in practice, the securities had been pledged multiple times, and the system depended on the assumption that not everyone would ask for their collateral back at once.
Lehman Brothers rehypothecated more than $50 billion in client assets by mid-2008\. When the firm filed for bankruptcy in September of that year, those clients discovered that their collateral had been used to secure other obligations, and there was no orderly way to recover it. The legal process took years. Some clients recovered most of their assets. Others did not. The immediate problem was not that rehypothecation was fraudulent. It was that the system had become so complex, and the same assets had been pledged so many times, that when one institution failed, the entire chain of obligations came under stress simultaneously. The risk that had been distributed across the system suddenly concentrated in a very short period of time, and the institutions managing that risk did not have the capital or the operational capacity to resolve it quickly.
The parallel to restaking is direct. When you restake your ETH, you are not lending it to another party, but you are subjecting it to additional slashing conditions. Each AVS you opt into specifies behaviors that, if detected, will result in partial confiscation of your staked ETH. If you restake your ETH with three AVSs, you are now exposed to the slashing conditions of all three. If one AVS is poorly designed, or if its slashing conditions are triggered by an event you did not anticipate, your entire position can be penalized. The risk is not distributed. It is cumulative. And because the same ETH is securing multiple services, a single failure can propagate across all of them.
The clearest example of this risk materializing has not yet occurred in crypto, but the mechanism is well understood. Suppose an AVS experiences a bug that causes it to slash a large number of restakers simultaneously. That slashing event reduces the amount of ETH securing not only that AVS, but every other AVS those restakers had opted into. Other AVSs may now find themselves under-secured, which could trigger further slashing or a loss of confidence in the entire restaking layer. The cascading effect is exactly what happened when Lehman collapsed. One institution's failure created uncertainty about the solvency of every other institution that had been part of the same rehypothecation chain. The solution in 2008 was government intervention. The solution in restaking, if it becomes necessary, is less clear.
## What Could Break Each Layer
Each layer of the restaking yield stack has a different failure mode, and understanding those modes is more important than understanding the headline yield.
The base staking yield is the most robust, but it is not immune to compression. If too much ETH is staked, the protocol reduces the issuance rate to maintain a target level of security. As of mid-2026, more than 4.3 million ETH is restaked through EigenLayer alone, and the total amount staked through all mechanisms continues to grow. If that growth continues, the base yield will fall. The mechanism is designed to prevent the network from becoming over-secured at the expense of capital efficiency, but it also means that the 3% to 4% yield restakers currently earn from Ethereum itself is not fixed. It will decline as more capital enters the system. The decline will be gradual, but it will be real.
The AVS payment layer is more fragile. AVSs pay restakers because they need security, but they do not need as much security as restakers are currently offering. EigenLayer has more than $15 billion in total value locked, but the AVSs operating on top of it will likely need less than 10% of that capital to meet their security requirements. The result is predictable: as more capital flows into restaking, the yield paid by AVSs will fall, because there is simply not enough demand for security to absorb the supply of capital. This is not a failure of the AVS model. It is a feature of any market where supply grows faster than demand. The yield compression will be sharpest for restakers who entered late, because they will be competing with a much larger pool of capital for the same stream of AVS payments. The [restaking mechanism itself](https://altcoininvestor.com/what-is-restaking/) does not prevent this outcome. It accelerates it.
The points layer has no defense against failure, because it is not based on any underlying cash flow. Points programs are designed to attract early participants, and they work as long as the tokens being distributed retain value. But if the token price falls, or if the airdrop allocation is smaller than expected, the effective yield from points programs can go to zero. This happened repeatedly in 2021 and 2022, when projects distributed governance tokens to liquidity providers and those tokens lost 90% of their value within weeks. The nominal APY looked high, but the realized return was negative once you accounted for the decline in token price. The same dynamic is already visible in restaking. Projects distribute points, participants assume those points will convert into valuable tokens, and then the tokens launch at a valuation that does not support the implied yield. The participants who entered late are left holding a position that no longer pays.
There is a fourth risk, less visible but more dangerous, which is looping. Because liquid restaking tokens (LRTs) are tradable, some users deposit them as collateral on lending protocols, borrow more ETH against them, buy more LRTs with that borrowed ETH, and repeat. Each loop multiplies exposure to the yield, and headline returns of 15% to 20% become possible. But each loop also multiplies exposure to loss. The user now carries a loan that can be liquidated if the price of the LRT falls, or if the LRT temporarily trades below the value of the ETH it represents. During periods of market stress, when liquidity dries up and prices become volatile, looped positions are the first to be liquidated. The liquidations create selling pressure, which pushes the price of the LRT lower, which triggers more liquidations. This is the same feedback loop that destabilized collateralized debt obligations in 2008, and it will destabilize restaking if enough capital adopts the same strategy.
## The Numbers: What Restaking Actually Pays in 2026
As of mid-2026, EigenLayer controls 93.9% of the restaking market, with more than $15 billion in total value locked and 4.3 million ETH restaked. [The most recent data](https://defillama.com/protocol/eigencloud) shows EigenCloud, the successor entity, holding $6.49 billion in TVL, reflecting shifts in the market structure as liquidity moves between protocols. The advertised APY for restaking through EigenLayer currently ranges from 3.8% to 6%, depending on which AVSs you opt into. When you add token incentives and points programs, the combined yield rises to between 8% and 12%, though it can spike higher during periods of elevated AVS demand.
That headline figure is misleading, because most of the yield above 6% comes from the third layer, which is not durable. Strip out the points programs, and the sustainable yield is closer to 5% or 6%. Compare that to the [standard 3% to 5% you would earn from traditional Ethereum staking](https://altcoininvestor.com/best-crypto-staking-platform/), and the premium for accepting additional slashing risk is roughly 1 to 3 percentage points. That premium compensates you for the risk that an AVS experiences a slashing event, or that the AVS stops paying because it no longer needs as much security, or that the entire restaking layer experiences a cascade of failures when one AVS breaks. Whether that premium is sufficient depends on your assessment of how likely those events are, and how much capital you can afford to lose if they occur.
The fee structure for EigenLayer provides some insight into where the revenue is actually flowing. Under the proposed ELIP-12 governance mechanism, EigenLayer would capture 20% of subsidized AVS rewards and 100% of EigenCloud infrastructure fees, using those revenues to buy back EIGEN tokens. The proposal was scheduled to launch in Q1 2026\. If it is implemented, it will create a direct link between AVS activity and token value, but it will also reduce the yield paid to restakers, because 20% of the AVS payments that would have gone to restakers will now go to the protocol instead. This is not unusual. Every protocol that matures eventually shifts from subsidizing participants to capturing revenue for itself. The shift is rational, but it compresses yield for the participants who arrived expecting the early-stage subsidies to continue indefinitely.
The activation of on-chain slashing in early 2026 changed the risk profile in a way that is easy to overlook. Before on-chain slashing went live, restakers faced theoretical slashing risk but no actual enforcement mechanism. Now the risk is fully enforceable at the protocol level. Every AVS you opt into can now penalize your stake if you violate its conditions, and those penalties are automatic. The shift from theoretical to enforceable risk should have reduced the amount of capital willing to restake, but it did not, because the points programs and token incentives masked the change. Participants continued to treat restaking as a higher-yield version of staking, without adjusting for the fact that the risk had become real. That mispricing will correct, either gradually as participants become more informed, or suddenly when a large slashing event demonstrates what the risk actually looks like.
## Symbiotic and the Competition for Restaking Capital
EigenLayer is not the only restaking protocol, and the competition for capital is intensifying. Symbiotic crossed $1.7 billion in TVL shortly after raising its deposit limits in mid-2026, and it has since raised $29 million from Pantera Capital and Coinbase Ventures. Symbiotic differs from EigenLayer in two ways. First, it supports a wider range of collateral options, allowing users to restake assets other than ETH. Second, it allows network builders to create and manage their own staking implementations, rather than relying on a single shared security model. Those differences make Symbiotic more flexible, but they also fragment the restaking market, which may reduce the yield available on any single protocol as capital spreads across multiple venues.
The liquid restaking token market reflects the same fragmentation. EtherFi leads with $5.6 billion in TVL and roughly 65% of the LRT market, but it has recently removed nearly all restaking exposure from its main token, weETH. As of August 2026, less than 1% of EtherFi's assets remain restaked with EigenLayer. That withdrawal signals a shift in how large LRT providers are assessing the risk-return tradeoff. If the premium for restaking is only 1 to 3 percentage points, and the slashing risk is now enforceable, the marginal yield may not justify the marginal risk, particularly for providers managing billions of dollars on behalf of users who do not fully understand the risks they are taking.
Other LRT providers have not followed EtherFi's lead, and the divergence in strategy creates an opportunity for users who are willing to assess the tradeoffs themselves. Kelp DAO, Renzo, and Puffer Finance continue to offer liquid restaking tokens with full AVS exposure, and their yields remain higher than EtherFi's. The question is whether that higher yield compensates for the higher risk, and whether the users deploying capital into those tokens understand that the risk is no longer theoretical.
## What Happened When Rehypothecation Broke, and What It Means for Restaking
The Lehman collapse in 2008 did not happen because rehypothecation itself was flawed. It happened because the same assets had been pledged so many times, and the obligations built on top of those assets had become so complex, that when Lehman failed, no one could determine quickly who owned what. The legal process took years. The operational process of unwinding the positions took longer. The immediate result was a freeze in the credit markets, because every institution that had lent against rehypothecated collateral suddenly became uncertain whether that collateral still existed. The second-order result was a loss of confidence in the entire financial system, which required central bank intervention on a scale not seen since the Great Depression.
Crypto does not have central banks, and it does not have the legal frameworks that eventually allowed Lehman's creditors to recover most of their assets. If a large-scale slashing event occurs in the restaking layer, and the same ETH that was securing multiple AVSs is confiscated simultaneously, there will be no government backstop and no orderly resolution process. The participants who opted into the slashing conditions will lose their capital, and the AVSs that depended on that capital for security will need to find alternative arrangements or shut down. The cascading effect will move faster than it did in 2008, because everything in crypto operates at a higher velocity than traditional finance, and the feedback loops are tighter.
The parallel is not exact, but it is close enough to warrant attention. Rehypothecation worked for years before it broke. Restaking has worked for two years without a major failure. The mechanism is sound as long as the underlying assumptions hold: that slashing events are rare, that AVSs remain solvent, and that the capital restaking Ethereum does not all try to exit at once. Those assumptions have held so far. They will not hold forever. The question is whether the participants deploying capital into restaking are pricing the risk correctly, or whether they are treating the additional yield as free money because nothing has broken yet. History suggests the latter. The bond markets in Greece and Portugal paid high yields for years before the sovereign debt crisis, and investors treated those yields as compensation for minimal risk. When the risk materialized, the yields stopped being yields. They became losses that had been accruing all along.
## The Takeaway: Three Layers, Three Risks, One Question
Restaking yield is not a single income stream. It is three separate streams stacked on top of one another, each with a different source and a different failure mode. The base staking yield comes from the Ethereum protocol, and it is the most durable. The AVS payment layer comes from protocols renting security, and it will compress as supply outpaces demand. The points layer comes from temporary incentive programs, and it will disappear once those programs end or once the tokens being distributed lose value. If you are earning 12% from restaking, you are earning all three layers combined. If you want to know whether that 12% will still be there in a year, you need to decompose it and ask which layers are actually sustainable.
The historical parallel to rehypothecation is not decoration. It is the analytical tool. Restaking reuses the same capital across multiple obligations, just as rehypothecation did. The additional yield reflects additional risk, and the system works smoothly until something breaks. When it breaks, the cascading failures move faster than the institutions managing them, and the participants who entered late or who did not understand the risks are the first to lose capital. The question is not whether restaking will produce a Lehman-scale collapse. The question is whether you understand what you are earning, where it comes from, and what happens when one of the layers stops paying. The yield is real. The risk is real. The tradeoff is yours to assess.
## Frequently Asked Questions
### What is restaking and how does it differ from regular staking?
Restaking allows you to use your already-staked ETH to secure additional protocols called Actively Validated Services (AVSs) through platforms like EigenLayer or Symbiotic. Regular Ethereum staking earns 3-4% annually from protocol rewards. Restaking adds a second layer of yield from AVS payments, typically 1-3% more, in exchange for accepting additional slashing conditions from every AVS you opt into. The base ETH remains staked to Ethereum, but it now secures multiple services simultaneously, each with its own penalty conditions.
### Where does the 8-12% restaking yield actually come from?
Restaking yield has three layers. Layer one is base Ethereum staking yield (3-4% from protocol issuance, priority fees, and MEV). Layer two is AVS security payments (1-3% from protocols renting validator security). Layer three is points programs and token incentives (variable, temporary, often 3-5%). The headline 8-12% figure combines all three. Only the first two layers are sustainable. The third layer disappears when incentive programs end or when distributed tokens lose value faster than they are earned.
### What is the biggest risk in restaking?
Cascading slashing across multiple AVSs. When you restake, you opt into the slashing conditions of every AVS you secure. If one AVS experiences a bug or a penalty event, it can slash your entire staked position. Because the same ETH secures multiple services, a failure in one AVS can reduce security for all others, potentially triggering additional slashing events. Since on-chain slashing went live in early 2026, this risk is fully enforceable. Unlike traditional staking, where penalties are limited to Ethereum protocol violations, restaking exposes you to the operational and design risks of every AVS.
### How is restaking similar to the rehypothecation that broke in 2008?
Both mechanisms reuse the same underlying asset to support multiple obligations. In rehypothecation, brokers pledged client collateral multiple times to create leverage and additional yield. When Lehman Brothers collapsed in 2008, the overlapping claims on the same collateral could not be resolved, and clients discovered their assets had been used elsewhere. In restaking, the same ETH secures multiple AVSs. If one AVS fails or triggers slashing, the entire position is at risk, and the failure can cascade across every service that ETH was securing. The additional yield in both cases reflects additional risk, and both systems work until something breaks.
### Will restaking yields stay at 8-12% long term?
No. The sustainable portion is 5-6%, not 8-12%. Base Ethereum staking will compress as more ETH is staked, reducing issuance rewards. AVS payments will fall as restaking supply grows faster than AVS demand for security. EigenLayer already has over $15 billion TVL, but AVSs need less than 10% of that capital. Points programs, which account for much of the current headline yield, are temporary and will end. The yield compression has already started. Late entrants compete with a larger capital pool for the same AVS payments, and the marginal return for accepting slashing risk is narrowing.
The Weekly Yield Report
You have just decomposed three yield layers paying a combined 8 to 12 percent, with distinct sources and failure modes. Those layers are compressing as capital supply exceeds AVS demand.
Every Thursday: where crypto yield actually is - stablecoins, liquid staking and DeFi lending, with the risk named next to the rate and what changed since last week.
[Get it free every Thursday](#/portal/signup)
Free. No trade calls, no allocations, no hype. Unsubscribe in one click.
### Hardware Wallet For DeFi: Which Ones Handle Contracts Properly
URL: https://altcoininvestor.com/best-hardware-wallet-for-defi/
Last updated: 2026-09-23T00:10:09.000Z
## The DeFi Hardware Wallet Job Is Different

Hardware wallets get reviewed like they are all solving the same problem. Keep keys offline. Protect the seed phrase. Generate addresses. That works if you are storing Bitcoin and checking it twice a year.
The job changes completely when you are approving Uniswap LP deposits, signing Aave collateral transactions, or authorizing token approvals on Arbitrum twice a week. The wallet still keeps your key offline, but now it also has to show you what you are actually signing before you confirm it.
This is where most devices fail.
Crypto phishing scams targeting digital signatures stole $6.27 million from 4,741 victims in Q1 2026, a 207% increase over Q4 2025\. The common thread: users signing transactions they could not read. A hardware wallet can keep the key offline and still ask the user to approve an unreadable transaction. The signing environment is secure, but the decision-making process can remain blind.
If you disable blind signing, your hardware wallet will reject most DeFi transactions. This is why almost every DeFi user leaves it enabled, and why blind signing remains the primary attack vector for hardware wallet users.
The hardware wallet comparison for DeFi is not about price or how many coins it supports. It is about whether the screen shows you the contract function, the token being approved, the amount, and the recipient address before you press confirm.
## Clear Signing vs. Blind Signing: The Only Comparison That Matters
On May 12, 2026 the Ethereum Foundation highlighted "clear signing" as a wallet safety standard to turn raw transaction data into human-readable prompts, aiming to reduce blind signing and approval mistakes across DeFi.
The technical foundation for this feature is EIP-7730, which defines a metadata format that wallets and dapps can use to translate raw transaction data into structured, readable information.
When a transaction request reaches your device, run through this checklist before confirming:
- Is the interaction decoded? You should see discrete fields: contract address, function name, argument names and values.
- If you see a hash, hex, or a generic "Data Present" or "Unknown contract" label, you are in blind-signing territory.
- Can you read the approval amount? If the wallet shows "infinite" or "unlimited," you are signing away permanent access to that token.
- Is the recipient address shown in full? Truncated addresses can hide malicious contracts.
Trezor announced Clear Signing as their 2026 flagship feature. It works with supported smart contracts in the ERC-7730 registry. If a contract is not supported yet, your Trezor will fall back to the standard blind-signing warning. Built on an open-source stack, Clear Signing works across supported Ethereum and EVM-compatible networks through Trezor Suite, WalletConnect, and Trezor Connect, with no additional software or settings required.
Ledger has supported Clear Signing through [its app ecosystem](https://www.ledger.com/academy/topics/defi/best-defi-wallets) for longer, but coverage depends on which dapp you are using and whether the developer has integrated Ledger's transaction decoder.
Where a contract is not yet covered by the registry, the wallet falls back to the conventional blind-signing warning. This means the usefulness of the system will ultimately depend on how quickly protocols add their contracts to the standard.
The next milestone is standardizing amount-limited approvals, a feature still absent from most DeFi interfaces. Anyone signing an "unlimited approve" in 2026 still does so at their own risk, even with Clear Signing active.
### Screen Size Matters More Than You Think
The term blind signing comes from hardware wallet UX: devices like Ledger Nano S and Trezor Model One have tiny OLED screens (128x32 or 128x64 pixels). They can display simple transfer data but they cannot decode complex smart contract calls.
Touch-screen models solve this.
Trezor Model T ($169) has a 240x240 color touchscreen. Ledger Flex ($249) and Ledger Stax ($399) offer larger displays that can show multi-line transaction breakdowns, decoded function calls, and token approval details without truncation.
If you are using a hardware wallet for DeFi, screen size is not a luxury feature. It is the difference between reading what you are signing and guessing.
## Chain Support: EVM Is Table Stakes, L2 Coverage Is the Real Test

Most DeFi activity in 2026 happens on Ethereum Layer 2 networks including Base, Arbitrum, Optimism, Polygon, Linea, Scroll, zkSync and Zora. According to L2Beat, Arbitrum consistently tops the chart in TVL (Total Value Locked), making it a go-to platform for DeFi users and builders.
Arbitrum has become the dominant Ethereum Layer 2 by total value locked, home to major DeFi protocols including GMX, Uniswap v3, and Camelot. If your hardware wallet does not support Arbitrum natively, you cannot sign transactions on the chain where the yield actually is.
Ledger supports all major Ethereum L2s through Ledger Live and WalletConnect. Trezor supports Ethereum Layer 2 networks through Trezor Suite, WalletConnect, and Trezor Connect. Both handle the EVM-compatible chains that matter for DeFi.
BitBox02 has a minimalist design, a secure-chip architecture, microSD backup, and open-source code. It supports Ethereum and EVM chains but requires third-party wallet integration for L2s.
Coldcard Q pairs two independent secure chips with a physical keyboard, microSD backup support, and full air-gapping. It is built for Bitcoin. It does not support Ethereum or any EVM chain. If your DeFi activity touches anything other than Bitcoin-native protocols, Coldcard is the wrong tool.
The [general-purpose hardware wallet comparison](https://altcoininvestor.com/best-crypto-hardware-wallets/) ranks devices on security and coin count. For DeFi, the question is simpler: does it support the chains where your positions actually sit?
## Wallet Integration: MetaMask, Rabby, and the Interface Layer
Hardware wallets do not interact with DeFi protocols directly. You connect them to a software wallet that serves as the interface layer. The software wallet talks to the dapp. The hardware wallet signs the transaction. The dapp never sees your key.
The recommended approach is to pair MetaMask with a Ledger or Trezor signer: MetaMask handles the interface, while the signer stores your keys and executes transaction signing securely offline.
MetaMask is the most widely supported wallet for DeFi. Every major protocol integrates with it. But MetaMask does not decode transactions well. It shows raw hex data for most contract interactions. You are still blind signing, even with a hardware wallet connected.
Rabby Wallet is built specifically for advanced DeFi usage and frequent smart contract interactions. Unlike general-purpose wallets, it focuses on helping users understand exactly what they are signing by simulating transactions, decoding contract calls, and displaying clear warnings for risky approvals.
Rabby Wallet's main blockchains are Ethereum and EVM-compatible chains with hardware wallet compatibility including Ledger, Trezor, Keystone, and BitBox. Rabby works with hardware wallets, which makes it safer for users who want offline signing with a more DeFi-native interface.
If you are using a hardware wallet for DeFi, [the software wallet you pair it with](https://altcoininvestor.com/best-crypto-wallet-for-defi/) matters as much as the device itself.
## Device Comparison: Ledger vs. Trezor for Active DeFi
Trezor offers three models: Trezor One ($59), Trezor Safe 3 ($79), and Trezor Model T ($169). Ledger offers four models: the Ledger Nano S Plus ($79), Ledger Nano X ($149), Ledger Flex ($249), and Ledger Stax ($399).
Finder reports Ledger support at about 5,500+ coins and tokens versus Trezor at roughly 1,000+. Trezor supports more than 9,000 assets through third-party integrations. However, Trezor wallets extend native support to only 1,000+ coins through Trezor Suite.
Ledger is the stronger choice if you hold many altcoins, want a richer mobile experience, use NFTs or DeFi, or prefer a wallet app that combines buying, swapping, staking and portfolio management in one place.
Trezor is the cleaner pick if you value open-source transparency, a simpler cold storage setup, Shamir or Multi-share backup, and fewer app-led distractions.
For active multi-chain DeFi, Ledger is usually the better tool. Trezor is still a good choice for traders whose activity stays inside well-supported lanes and who value openness more than ecosystem breadth.
### Security Incidents: 2026 Was a Bad Year for Both
Coinkite's own security advisory confirmed that seeds generated on affected Coldcard firmware carried about 72 bits of entropy instead of the expected 128, weak enough that a well-resourced attacker could eventually guess them.
Days later, [Trezor disclosed](https://trezor.io/blog/news/clear-signing-comes-to-trezor-our-flagship-security-feature-of-2026) that a shipping partner had exposed the full names and home addresses of thousands of customers who had ordered a device.
No hardware wallet is immune to operational failures. The device protects your key. It does not protect your identity, your address, or your judgment when you sign a transaction you cannot read.
## Portfolio Size and Device Tier
Hardware wallets are still the gold standard for crypto security, with pricing generally ranging from about $50 to $400 per device. The same 2026 guide recommends matching wallet tier to portfolio size, with entry-level devices for holdings under $10,000, mid-range touch-screen devices for $10,000 to $50,000, and multi-device or premium air-gapped setups above $50,000.
If your DeFi positions are worth less than $5,000, a $59 Trezor One or $79 Ledger Nano S Plus is sufficient. The screen is small, but you can still verify transaction details if you take the time to scroll.
If your positions are worth $10,000 to $50,000, buy a touch-screen model. Trezor Model T ($169), Ledger Nano X ($149), or Ledger Flex ($249) all offer larger displays that make contract interaction readable.
Above $50,000, consider using two devices. One for cold storage, one for active DeFi. The cold storage device never connects to a dapp. The DeFi device holds only the assets you are actively deploying.
Most people do this backward. They buy the most expensive wallet and then connect it to every protocol they touch. That is not more secure. It is just more expensive.
## The Recommendation
If you are choosing one hardware wallet for DeFi in 2026, buy a Ledger Flex or Ledger Nano X. Pair it with Rabby Wallet. Enable Clear Signing in Rabby's settings. Verify every contract interaction on the device screen before you confirm.
Ledger has better DeFi ecosystem support, broader L2 coverage, and cleaner integration with the wallets that actually decode transactions well. Trezor has better open-source transparency and a simpler interface, but the DeFi tooling lags.
If you value open-source above everything else and your DeFi activity stays on Ethereum mainnet or a handful of well-supported L2s, Trezor Model T is a defensible choice. For everything else, Ledger is the better tool.
Do not buy a Coldcard for DeFi. It does not support Ethereum or EVM chains. Do not buy a Trezor One or Ledger Nano S Plus for DeFi. The screen is too small to read contract interactions safely.
The minimum acceptable setup for DeFi in 2026 is a touch-screen hardware wallet, paired with a software wallet that decodes transactions, on a device where you verify every approval before you sign.
Anything less than that, and you are trusting a screen that shows hex instead of English. That is not security. That is just blind signing with extra steps.
## What to Watch On-Chain
Track approval transactions from your own wallet. Every time you sign a token approval, record the contract address, the token, and the amount approved. Use Etherscan or Arbiscan to review your active approvals quarterly.
Revoke unlimited approvals you are not actively using. Tools like Revoke.cash show every token approval you have signed, sorted by risk. If you approved unlimited USDC to a Uniswap router six months ago and you have not used it since, revoke it.
Watch for approval transactions you did not initiate. If your wallet signs an approval and you did not request it, your device is compromised or you clicked a malicious dapp. Revoke the approval immediately and move your assets to a fresh wallet.
The blockchain shows you what your wallet actually approved, not what you think you approved. Most people never check. That is why approval exploits still work in 2026, even with Clear Signing and [hardware wallets properly configured](https://altcoininvestor.com/how-to-setup-ledger/).
## The Takeaway
If the hardware wallet screen does not show the contract name, function, token, amount, and recipient address before you confirm, you are blind signing. It does not matter if the device cost $400\. It does not matter if the keys are offline. You are still approving transactions you cannot read, and that is where DeFi positions are lost.
Buy the wallet with the screen large enough to read contract interactions. Pair it with the software wallet that decodes those interactions into plain language. Verify every approval before you sign. Revoke old approvals quarterly. That is the protocol. Everything else is just marketing.
## Frequently Asked Questions
### What is clear signing and why does it matter for DeFi?
Clear signing decodes raw transaction data into human-readable prompts showing the contract name, function, token, amount, and recipient before you approve. Without it, you are blind signing: approving transactions you cannot read. Crypto phishing targeting digital signatures stole $6.27 million in Q1 2026, almost all through blind-signed approvals. Clear signing is the difference between reading what you approve and guessing.
### Which hardware wallet has the best DeFi support in 2026?
Ledger Flex and Ledger Nano X offer the best DeFi support in 2026\. They have large touchscreens that display decoded contract interactions, support all major Ethereum L2 networks including Arbitrum and Base, and integrate cleanly with Rabby Wallet and MetaMask. Trezor Model T is a strong alternative if you prioritize open-source code, but Ledger has broader DeFi ecosystem coverage and better L2 support.
### Can I use a Trezor One or Ledger Nano S Plus for DeFi?
You can, but you should not. Both devices have tiny OLED screens (128x32 or 128x64 pixels) that cannot display decoded smart contract calls legibly. You will be blind signing most DeFi transactions because the screen is too small to show the contract function, token, amount, and recipient. For DeFi, buy a touch-screen model like Trezor Model T, Ledger Nano X, or Ledger Flex.
### Do I need a different hardware wallet for cold storage vs. active DeFi?
If your portfolio is above $50,000, yes. Use one device for cold storage that never connects to a dapp, and a second device for active DeFi holding only the assets you are deploying. This limits exposure if you accidentally sign a malicious approval. Below $50,000, one touch-screen hardware wallet is sufficient if you verify every transaction on the device screen before confirming.
### What software wallet should I pair with my hardware wallet for DeFi?
Pair your hardware wallet with Rabby Wallet if you use DeFi frequently. Rabby simulates transactions, decodes contract calls, and displays warnings for risky approvals before you sign. MetaMask is more widely supported but shows raw hex data for most contract interactions, leaving you blind signing even with a hardware wallet connected. For advanced DeFi use, Rabby is the better interface layer.
Tool mentioned above
Ledger
Ledger devices display the full transaction on their own screen before you approve it, which is what stops an approval exploit at the point it matters.
[See Ledger devices](https://shop.ledger.com/?r=90612ff43561)
We may earn a commission if you sign up through this link, at no cost to you. It does not change what gets recommended.
The Weekly Yield Report
You just compared five hardware wallets on clear signing, screen size, and L2 support. Those features and prices will change as EIP-7730 adoption expands across more protocols.
Every Thursday: where crypto yield actually is - stablecoins, liquid staking and DeFi lending, with the risk named next to the rate and what changed since last week.
[Get it free every Thursday](#/portal/signup)
Free. No trade calls, no allocations, no hype. Unsubscribe in one click.
### How NFT Creator Royalty Income Actually Gets Paid (Or Doesn't)
URL: https://altcoininvestor.com/how-do-nft-royalties-work/
Last updated: 2026-09-22T23:03:50.000Z
## What NFT Royalties Are (And What They Never Were)

NFT royalties are secondary-sale payouts triggered automatically by smart contracts on each resale. The NFT creator sets a percentage, usually 5-10%, and the marketplace is supposed to deduct that amount from the seller's proceeds and send it to the creator's wallet.
That's the theory. The reality is that NFT royalties were never actually enforced on-chain. The smart contract that minted the NFT doesn't control what happens when someone transfers it. The blockchain cannot inherently distinguish between a sale that should pay royalties and a self-transfer or gift. This is a fundamental technical limitation, not a bug.
Instead, royalties rely on marketplace policy. The marketplace reads the royalty terms embedded in the NFT metadata or smart contract, calculates the creator fee, and routes the payment. If the marketplace chooses not to honor that term, the creator doesn't get paid. There is no on-chain enforcement mechanism that blocks the transfer.
ERC-2981 is the Ethereum standard that defines how a smart contract signals royalty information. It provides a universal interface: `royaltyInfo(tokenId, salePrice)` returns the creator's wallet address and the royalty amount. Marketplaces can read this function and honor the payment. But ERC-2981 does not enforce anything. It's a suggestion, not a lock.
The result is that NFT royalty income depends entirely on which marketplace the NFT is sold through and what that marketplace's policy was on the day of the sale. That policy has changed dramatically since 2022.
## The 2023 Royalty War and What Survived

In late 2022, Blur launched with a 0.5% minimum royalty floor on immutable collections and largely optional royalties everywhere else. Blur's value proposition was simple: lower friction for traders, which meant higher volume. Traders responded. Blur captured market share.
OpenSea, which had been the largest NFT marketplace and enforced creator royalties as default policy, tried to maintain royalty enforcement using its Operator Filter Registry, a smart contract tool that blocked transfers to non-royalty-enforcing marketplaces. This worked briefly. In August 2023, OpenSea phased out the Operator Filter Registry and made creator fees optional.
The incentive for marketplaces to drop NFT royalties is simple: it attracts traders who want greater profit margins on NFT resales. Marketplaces competed by lowering barriers, including removing mandatory royalty enforcement. The smart contract still could enforce royalties, but marketplace interfaces bypassed the check or allowed users to ignore it.
By early 2024, most high-volume NFT marketplaces had shifted to optional or minimal royalty models. The 2025-2026 stabilization shows rates near 6%, but enforcement remains inconsistent. Creator-focused platforms like SuperRare and Foundation still enforce royalties precisely because their collectors value them. This trades some liquidity for better royalty performance. The floor held, but only in specific venues.
## Which Marketplaces Still Pay Royalties in 2026

Marketplace royalty policies vary by platform and by blockchain. Here's what each major venue enforces as of Q1 2026:
**Blur:** 0% marketplace fee. 0.5% minimum royalty on immutable collections. Optional royalties on most other collections. Blur intentionally strips away creator royalties to offer raw liquidity for high-frequency flippers. In November 2025, Blur captured 66.3% market share of Ethereum NFT trading volume. Volume is high. Royalty compliance is not.
**OpenSea:** 0.5-2.5% marketplace fee. Royalties are optional. OpenSea reclaimed broader market share after its SEA token announcement in February 2025 drove its share from 25% to 71.5% overnight. OpenSea remains one of the largest marketplaces and is estimated to handle the lion's share of royalty-enabled secondary trades, but only because some sellers choose to honor them. The platform no longer enforces.
**Magic Eden:** 2% marketplace fee. Royalty enforcement varies by chain. On Solana, Magic Eden handles 48% of NFT trade volume in Q1 2025\. Solana collections earned $374K in weekly royalties, representing 55% of blockchain royalty share. Magic Eden's policy is inconsistent across chains, but Solana enforcement is better than Ethereum.
**SuperRare:** 15% marketplace fee on primary sales. Enforces royalties natively. SuperRare is a curated art platform where collectors expect to pay royalties and view them as part of supporting creators. Volume is lower than Blur or OpenSea, but royalty compliance is near 100%.
**Foundation and Zora:** Both enforce royalties natively. Both are creator-focused platforms with lower trading volume but higher royalty reliability. If your goal is royalty income, these platforms are better venues than high-volume exchanges.
The pattern is consistent: curated art venues enforce royalties because their collectors value them. High-volume trading platforms make royalties optional to attract liquidity. You choose one or the other. You do not get both.
For more context on how [NFT flipping works on these platforms](https://altcoininvestor.com/how-to-flip-nfts-for-profit-2/), including the fee structures traders optimize for, see the full breakdown of marketplace arbitrage mechanics.
## What NFT Creators Actually Earn From Royalties
Over 63% of NFT creators earned more from royalties on secondary sales than from initial mints. That statistic is from the 2021-2022 NFT boom and no longer represents the current environment. The royalty enforcement collapse changed the distribution.
In 2026, the median creator royalty income for the bottom 80% of collections remains below $1,000 per year. The long tail of thousands of smaller projects sees minimal secondary royalty income because volume is concentrated in a small number of blue-chip collections and most secondary sales now occur on platforms that do not enforce royalties.
Some gaming-NFT projects report that royalty income, after platform cuts, now makes up 20-30% of overall creator income. These are projects with active in-game utility where players are reselling NFTs frequently and the game's marketplace enforces royalties. This is the exception, not the rule.
Optional royalty marketplaces increased buyer activity by 12% but lowered creator income by 18%. The net effect is higher volume with lower creator revenue per sale. More transactions, fewer payouts.
For comparison, Bored Ape Yacht Club creators (Yuga Labs) receive 2.5% of each sale as royalty. That is a below-average royalty rate for NFTs, which typically range from 5-10%, but Bored Ape secondary sales occur on every major marketplace, including those that no longer enforce royalties. The result is that Yuga Labs receives royalties only on the subset of sales where the seller opts in or the marketplace enforces. Exact compliance data is not public, but anecdotal evidence suggests 30-50% compliance on optional platforms.
If you are launching an NFT collection in 2026 and expect royalties to provide ongoing passive income, you should assume 30-60% compliance on high-volume marketplaces and near-zero compliance on Blur. Plan accordingly. Do not build your revenue model around the assumption that every secondary sale will generate a royalty payment.
## Cross-Platform and Cross-Chain Royalty Failures
Royalties do not automatically transfer across marketplaces or blockchains. If an NFT is minted on OpenSea with a 10% royalty and then listed for sale on Blur, Blur's royalty policy applies, not OpenSea's. The NFT carries metadata indicating the creator's royalty preference, but enforcement is marketplace-dependent.
OpenSea only supports royalties on collections, not individual pieces. If an NFT with its own royalty policy is sold on Rarible and then listed on OpenSea, the original artist would not see revenue from the secondary sale. This is a structural limitation of OpenSea's implementation, not a blockchain issue.
An NFT minted on Ethereum might not automatically carry its royalty information if transferred to another blockchain using a bridge. Different blockchains use different NFT standards. Ethereum uses ERC-721 and ERC-1155\. Solana uses a different standard. Cross-chain bridges typically do not preserve royalty metadata because the destination chain does not recognize the source chain's royalty standard.
Kaspa's KRC-721 standard enforces royalties at the protocol level regardless of marketplace. This is an outlier. Most blockchains rely on marketplace goodwill or smart contract tools like the Operator Filter Registry, which OpenSea sunset in 2023\. Protocol-level enforcement is rare because it limits composability and marketplace flexibility.
The practical consequence is that if you mint an NFT collection, you should verify royalty enforcement on every marketplace and blockchain where you expect secondary sales to occur. Do not assume that because you set a royalty rate in the smart contract, every sale will honor it. Test the flow. Verify the payment.
## Smart Contract Enforcement Attempts (And Why They Failed)
Smart contracts can block interactions with non-royalty-enforcing marketplaces using whitelist and blacklist mechanisms. The Operator Filter Registry was OpenSea's implementation of this approach. It worked by maintaining a list of approved marketplaces that enforced royalties and blocking transfers to unapproved addresses.
The problem is that even when smart contracts could enforce royalties, marketplace interfaces simply bypassed the check or allowed users to ignore it. A user could transfer the NFT to a secondary wallet and then list it for sale, circumventing the Operator Filter. The blockchain cannot distinguish between a gift and a sale. The smart contract cannot tell whether the transfer was a workaround or a legitimate non-sale transfer.
OpenSea sunset the Operator Filter Registry in August 2023 because it limited composability and marketplace competition. Creators who wanted to enforce royalties had to choose between restricting where their NFTs could be traded and accepting lower royalty compliance. Most chose liquidity over enforcement.
Non-payment of royalties is typically a breach of platform policy, not a criminal act. Royalties are governed by smart contracts and marketplace terms, not statutory law. There is no legal recourse for creators when marketplaces choose not to enforce royalties. The contract is between the marketplace and the user. The creator is a third-party beneficiary with no enforcement mechanism.
For creators evaluating [which platforms still pay reliable royalties](https://altcoininvestor.com/nft-creator-royalties-income/), the 2026 breakdown includes realistic income data by collection size and marketplace policy.
## How To Structure NFT Launches for Royalty Income in 2026
If you are launching an NFT collection and want to maximize the likelihood of receiving royalty payments, follow these steps:
**1\. Implement ERC-2981 in your smart contract.** This signals royalty information to every marketplace that checks for it. The standard is widely recognized and increases the chance that compliant marketplaces will honor your royalty rate. Without ERC-2981, some platforms will not recognize your royalty preference at all.
**2\. Launch on a platform that enforces royalties natively.** SuperRare, Foundation, and Zora all enforce royalties as part of their core marketplace design. If your collection launches on one of these platforms, primary and secondary sales will include royalty payments by default. You trade volume for compliance.
**3\. Avoid relying on optional-royalty platforms for ongoing income.** Blur and OpenSea both offer optional royalties. Traders on these platforms optimize for profit, which means they will skip royalty payments when given the choice. Assume 30-50% compliance at best. Do not build your revenue model around secondary sales on these venues.
**4\. Use in-game or in-platform utility to retain control.** Gaming NFTs and membership NFTs that provide utility within a specific ecosystem allow you to control the secondary marketplace. If resales occur within your platform or game, you can enforce royalties programmatically. This is how gaming guilds and [scholar programs](https://altcoininvestor.com/how-do-nft-gaming-guilds-make-money/) structure NFT income splits.
**5\. Monitor royalty payments on-chain.** Platforms like OpenSea, Blur, and Magic Eden each issue their own royalty streams. Creators must aggregate all sources into gross receipts for accurate income tracking. Use Etherscan, Solscan, or Arkham to track incoming payments to your creator wallet. Verify that royalty payments match expected amounts based on secondary sale volume.
**6\. Consider Solana for better enforcement.** Solana collections earned $374K in weekly royalties in Q1 2025, representing 55% of blockchain royalty share despite lower total NFT volume than Ethereum. Magic Eden's Solana marketplace has better royalty compliance than its Ethereum counterpart. If your audience is on Solana, enforcement will be more reliable than on Ethereum.
The structural reality is that royalty income is no longer passive income for most NFT creators. It requires platform selection, enforcement verification, and ongoing monitoring. The 2021-2022 promise of automatic residual payments on every resale no longer matches the 2026 marketplace environment.
## What To Watch On-Chain
You can verify royalty payments by monitoring your creator wallet address on-chain. Here's what to track:
**Incoming payments from marketplace contracts.** OpenSea, Blur, Magic Eden, and other platforms send royalty payments from identifiable smart contract addresses. Track these addresses in Etherscan or Solscan. Each incoming payment should correspond to a secondary sale visible in the marketplace's transaction log.
**Royalty payment frequency and amounts.** Compare the number of secondary sales listed on the marketplace to the number of royalty payments received. The gap between these two numbers is your non-compliance rate. If you see 100 secondary sales on OpenSea but only 40 royalty payments, 60% of sellers opted out of royalties.
**Cross-platform royalty orphaning.** If your NFT collection is listed on multiple marketplaces, verify that each marketplace is issuing royalty payments separately. An NFT sold on Rarible will not trigger a royalty payment from OpenSea's contract. You need to monitor all venues where secondary sales occur.
**Tax reporting aggregation.** Royalties are secondary-sale payouts triggered automatically by smart contracts on each resale. Platforms like OpenSea, Blur, and Magic Eden each issue their own royalty streams, and creators must aggregate all sources into gross receipts. Use a tool like Koinly or CoinTracker to consolidate royalty income from multiple marketplaces for tax reporting. The IRS treats NFT royalties as ordinary income, not capital gains.
For comparison, tracking [NFT rental income](https://altcoininvestor.com/how-to-rent-out-nfts-for-income/) from utility NFTs follows a similar on-chain verification process but uses different smart contract hooks.
## The Realistic 2026 Royalty Income Model
Here's the model you should use if you're launching an NFT collection in 2026 and want to estimate royalty income:
**Primary sale revenue:** This is the only guaranteed income. You control the mint price and the initial sale. Plan for this to represent 70-100% of total creator revenue unless you have strong reasons to expect high secondary volume on royalty-enforcing platforms.
**Secondary royalty income on curated platforms:** If you launch on SuperRare, Foundation, or Zora, assume near-100% royalty compliance. Volume will be lower, but enforcement is reliable. If secondary sales occur, you will receive the royalty payment.
**Secondary royalty income on optional platforms:** On OpenSea, assume 30-50% compliance. On Blur, assume 10-20% compliance. On Magic Eden (Solana), assume 50-70% compliance. Multiply your expected secondary sale volume by your royalty rate and then by the compliance rate. That's your realistic royalty income.
**Gaming and utility NFTs:** If your NFT provides in-game or membership utility and resales occur within your controlled ecosystem, assume near-100% compliance. This is the only high-volume scenario where royalty enforcement is reliable in 2026.
The passive income promise of NFT royalties did not survive the 2023 royalty wars. Creator-focused platforms prove that collector communities can enforce royalties through norms. The 2025-2026 stabilization shows royalties surviving as a partial, widely honored norm rather than vanishing. But this is not a substitute for a legal entitlement, which remains the only thing that can bind every participant at once.
If you want to earn ongoing income from NFTs in 2026, structure your launch for platforms that enforce royalties, build utility that retains control over secondary markets, or plan for primary sales to represent the majority of revenue. The on-chain data supports all three approaches. It does not support the assumption that royalties will automatically pay on every resale.
## The Takeaway
Track your creator wallet for 30 days after your first secondary sales go live. Compare the number of royalty payments received to the number of secondary sales visible on each marketplace. The compliance rate you observe in that first 30 days is the compliance rate you should assume for all future revenue projections. The blockchain will show you what actually happened, not what the marketplace said would happen.
For deeper context on the technical implementation, see the [EIP-2981 specification](https://eips.ethereum.org/EIPS/eip-2981) and the [a16z technical breakdown](https://a16zcrypto.com/posts/article/how-nft-royalties-work/) of on-chain royalty mechanisms.
## Frequently Asked Questions
### Do NFT creators automatically receive royalties on every secondary sale?
No. NFT royalties are marketplace-optional, not on-chain enforcement. The blockchain cannot distinguish between a sale and a transfer, so royalty payments depend entirely on marketplace policy. High-volume platforms like Blur and OpenSea made royalties optional in 2023, resulting in 30-50% compliance on OpenSea and 10-20% on Blur. Only curated platforms like SuperRare and Foundation enforce royalties reliably. Creators must verify enforcement on each platform where their NFTs are sold.
### What is ERC-2981 and does it enforce royalties?
ERC-2981 is the Ethereum standard that signals royalty information to marketplaces using the royaltyInfo function, which returns the creator's wallet address and royalty amount. It does not enforce payments. It is a suggestion that compliant marketplaces can choose to honor. Implementing ERC-2981 in your smart contract increases the likelihood that royalty-enforcing platforms will recognize your terms, but it provides no guarantee. Enforcement depends entirely on marketplace policy, not the standard itself.
### Which NFT marketplaces still enforce creator royalties in 2026?
SuperRare, Foundation, and Zora enforce royalties natively as part of their platform design. Magic Eden enforces royalties on Solana with 50-70% compliance but varies by chain. OpenSea and Blur both offer optional royalties, with OpenSea seeing 30-50% seller compliance and Blur seeing 10-20%. Curated art platforms prioritize royalty enforcement because their collector communities value supporting creators, while high-volume trading platforms prioritize liquidity and make royalties optional to attract traders.
### How much do NFT creators actually earn from royalties?
The median creator royalty income for the bottom 80% of NFT collections is below one thousand dollars per year in 2026\. Over 63% of creators earned more from royalties than initial mints during the 2021-2022 boom, but that no longer reflects current conditions. Optional royalty marketplaces increased buyer activity by 12% but lowered creator income by 18%. Gaming NFT projects with in-platform utility report royalties represent 20-30% of creator income, but most collections see minimal secondary royalty revenue.
### Can I verify if my NFT royalties are being paid?
Yes. Monitor your creator wallet address on Etherscan or Solscan and track incoming payments from marketplace smart contract addresses. Compare the number of royalty payments received to the number of secondary sales visible on each marketplace. The gap between these numbers is your non-compliance rate. Each marketplace issues royalty payments from identifiable contract addresses, so you can verify payment frequency and amounts on-chain. Aggregate all sources for tax reporting, as platforms like OpenSea, Blur, and Magic Eden each issue separate royalty streams.
The Weekly Yield Report
You just reviewed the on-chain mechanisms, marketplace policies, and realistic income data for NFT royalties in 2026\. Those enforcement rates and platform policies will shift again within six months.
Every Thursday: where crypto yield actually is - stablecoins, liquid staking and DeFi lending, with the risk named next to the rate and what changed since last week.
[Get it free every Thursday](#/portal/signup)
Free. No trade calls, no allocations, no hype. Unsubscribe in one click.
### How Grid Trading Bots Actually Generate Returns (And When They Blow Up)
URL: https://altcoininvestor.com/how-grid-trading-bots-work/
Last updated: 2026-09-22T22:06:09.000Z
## The Question: How Do Grid Trading Bots Actually Make Money?
Grid trading bots automate buying and selling within a predetermined price range by placing orders at fixed intervals. The profit mechanism is simple: buy low, sell high, repeatedly, as price oscillates within the grid. The income source is real. The failure mode is specific and expensive.
Here's what the mechanism does, what it costs, and the exact condition that kills it.
## The Mechanism: How Grid Bots Extract Profit From Range-Bound Volatility
A [crypto trading bot](https://altcoininvestor.com/crypto-trading-bot/) running a grid strategy divides a price range into evenly spaced levels, typically 10-50 grids depending on volatility and capital. At each level, the bot places a buy order below current price and a sell order above. As price moves, orders fill. When a buy order executes, the bot immediately places a corresponding sell order one grid level higher. When that sell fills, it places a new buy order one level lower.
The profit comes from capturing the spread between adjacent grid levels, minus trading fees.
### Worked Example: BTC Grid Bot
Set up a grid on BTC/USDT between $60,000 and $70,000 with 10 grid levels, each $1,000 apart.
1. BTC is at $65,000\. The bot places buy orders at $64,000, $63,000, $62,000, $61,000, $60,000 and sell orders at $66,000, $67,000, $68,000, $69,000, $70,000.
2. BTC drops to $64,000\. The buy order at $64,000 fills. The bot immediately places a sell order at $65,000.
3. BTC recovers to $65,000\. The sell order at $65,000 fills. The bot captures $1,000 spread minus fees.
4. The bot places a new buy order at $64,000\. The cycle repeats.
Every time BTC drops $1,000 and then recovers $1,000, the bot completes one buy-sell cycle and captures that $1,000 spread as profit, minus fees. The more price oscillates within the $60,000-$70,000 range, the more cycles complete, and the more profit accumulates.
The mechanism does not predict direction. It profits from volatility itself.
### Return Decomposition
Grid bot returns consist of three components:
1. **Spread capture:** The difference between buy and sell grid levels. This is the gross profit per completed cycle.
2. **Trading fees:** Exchange maker and taker fees on every fill. This is the cost per cycle.
3. **Cycle frequency:** How often price oscillates through grid levels. This determines annualized return.
Net profit = (spread per cycle - fees per cycle) × number of cycles completed over the holding period.
On liquid majors like BTC and ETH, realistic ranging windows might generate a handful of grid fills per day. Well-tuned bots in a genuinely sideways month often land in the low-single-digit to low-double-digit annualized percent area before fees. Anything projecting triple-digit annual return is leaning entirely on an aggressive historical volatility input that real markets rarely sustain.
## The Cost Structure: Fees Compound Across Every Fill
Grid bots execute multiple trades per session, so per-trade fees compound across the bot's full operating period. This is the structural difference between grid trading and buy-and-hold.
### Current Fee Landscape (2026)
- **Pionex:** 0.05% maker/taker, no subscription. The lowest among major grid bot platforms.
- **Bybit:** 0.02-0.06% on futures, 0.1% on spot, no bot subscription.
- **BYDFi:** 0.1% buy / 0.1% sell, no additional bot fee. Spot grid supports 2-99 grid subdivisions.
- **3Commas, Bitsgap, TradeSanta:** Monthly subscription ($23-$149/mo for 3Commas, €20-€63/mo for Altrady) on top of whatever the connected exchange charges per trade.
For spot trading on major pairs like BTC and ETH, a decent grid spacing is between 0.3% and 0.5%. This usually keeps profits per trade above the combined taker and maker fees, which on most exchanges total around 0.2%.
If grid spacing is too tight, fee drag eats the spread. If grid spacing is too wide, price may oscillate without triggering fills. The optimal spacing depends on realized volatility.
### Volatility Threshold Calculation
Low realized volatility markets (known as "sleepy range" conditions) generate too few fills to cover exchange fees and funding rates on perpetual futures. The primary market filter for any serious grid trader is comparing realized volatility against implied volatility adjusted for costs. Only markets where realized volatility exceeds the cost threshold justify running a grid.
BTC and ETH perpetual futures showed 5-10% daily ranges in May 2026, which represents the kind of volatility that supports active grid execution. Sufficient daily volatility (ATR greater than 1% of price) gives grid opportunities. Below that threshold, the bot sits idle or bleeds fees on infrequent fills.
## When It Works: Range-Bound Conditions
Grid bots perform best in range-bound markets with regular price oscillations. A market that moves up and down within a predictable band gives the bot repeated opportunities to fill both its buy and sell orders. In a genuinely sideways market, it works beautifully.
The mechanism assumption is mean reversion within the defined range. Price deviates, then returns. Each deviation is a profit opportunity.
Historical examples where grid strategies extracted consistent returns:
- BTC consolidation phases between major moves (Q2 2019, Q4 2020, Q2 2023).
- ETH ranging after initial DeFi summer peak (late 2020).
- Major forex pairs during low-volatility regimes (EUR/USD in 2014-2015).
In these conditions, the gridbot outperforms buy-and-hold by extracting value from price noise that holders ignore.
## The Failure Mode: Trending Market Plus Grid Trap
The central risk in grid trading lies in floating drawdown, which represents the unrealized loss of open positions. Grid systems often hide substantial floating drawdown behind realized profit numbers.
Here's what breaks the mechanism.
### Trending Market Trap
If the trend is strong and the price breaks out of your range, the bot stops trading or, in the case of a downtrend, you may be left holding a position at a loss. This is where grid bots underperform.
In an uptrend, the bot systematically sells into rising prices, which can cause it to underperform a simple buy-and-hold position. In a downtrend, the bot systematically buys into falling prices, accumulating inventory at progressively lower levels. Each buy order fills. The corresponding sell orders never execute because price continues falling.
This is the grid trap. The bot bought all the way down. Capital is now tied up in underwater positions. The unrealized loss grows with every grid level breached.
### Real-World Case Study: $4,200 Trapped
A trader ran a grid bot on an altcoin, buying all the way down from $0.43 to $0.08\. The altcoin no longer exists in any meaningful way. Total capital trapped: $4,200\. The trader is still holding those positions. The realized profit from completed cycles was $180\. The floating loss is $3,900.
This is the dominant failure mode. Approximately 340,000 retail traders are currently sitting in grid bot floating loss positions worldwide. Most of them believe the bot is profitable because the dashboard shows realized gains. The unrealized loss is larger and permanent.
### Specific Numbers: EUR/USD Grid Trap
When EUR/USD trends 300 pips in one direction without meaningful retracement, grid positions accumulate on the wrong side of the trend. A reverse grid on EUR/USD with 30-pip spacing can accumulate several short positions if price rallies 300 pips without meaningful pullback.
Each short position is now underwater by 30, 60, 90, 120 pips and counting. The grid stops generating profit. It starts accumulating loss.
### Black Swan Events
Black swan events (Swiss National Bank de-pegging in 2015, COVID-19 crash in March 2020, major geopolitical events) can move markets 500-1,000+ pips instantly, bypassing all grid take-profits and accumulating catastrophic losses before any defensive action is possible. Grid trading in its pure form has no stop-loss. This is its most dangerous characteristic and the reason it has caused many retail traders to lose their entire account.
The dominant failure mode is the combination of deep one-way trend and discontinuous price action.
## The Martingale Trap: Advanced Failure Mode
Some grid implementations pair with Martingale lot scaling, which increases lot size at each adverse price level. The scheme achieves a high short-term hit rate but retains a non-zero probability of catastrophic drawdown, a pattern equivalent to the Gambler's Ruin problem.
In a Martingale grid, each successive buy order in a downtrend is larger than the previous. The logic is that when price eventually rebounds, the larger position sizes at lower levels will recover all prior losses plus profit. This works until it doesn't.
When price continues falling beyond available capital, the entire position liquidates. The drawdown is total. The recovery is impossible.
Do not run Martingale grids. The risk profile is asymmetric in the wrong direction.
## Risk Management Requirements
Adding a stop-loss is not optional for serious trading. The grid mechanism has no internal stop-loss. The bot will buy all the way to zero if you let it.
### Specific Kill Switches
1. **Maximum drawdown limit:** Close entire grid at 15-20% drawdown. Don't hope for recovery; accept defined loss.
2. **Range breach trigger:** If price exits the defined range by more than one grid spacing, close all positions and halt the bot.
3. **Time-based review:** Review floating drawdown weekly. If unrealized loss exceeds realized profit, shut it down.
Failing to define a maximum allowable drawdown can lead to account liquidation. The mechanism does not protect you. You protect you.
Pairing with an equity-based kill switch is recommended to enforce a hard loss bound. If account equity drops by 20%, the bot stops. No exceptions.
## Grid vs Other Strategies: When To Use Each
Grid trading is one tool. It fits specific market conditions. Here's when to use it and when to skip it.
### Grid vs Buy-and-Hold
In a strong uptrend, the bot systematically sells into rising prices, which causes it to underperform a simple buy-and-hold position. If you believe the asset will trend higher, buy it and hold it. Don't grid it.
### Grid vs DCA
In a sustained downtrend, a DCA bot (purchasing fixed amounts at regular intervals to lower average cost) is generally better suited than a grid strategy. DCA does not assume mean reversion. It assumes eventual recovery. Grid assumes oscillation. If the market is trending down, [DCA or exit](https://altcoininvestor.com/how-to-evaluate-copy-trading-signals/).
### Grid vs Arbitrage
Grid trading profits from volatility within a single market. [Arbitrage](https://altcoininvestor.com/how-to-arbitrage-crypto/) profits from price differences between markets. Arbitrage has no directional risk. Grid has directional risk disguised as range-bound strategy. If you want directional neutrality, arbitrage is structurally superior.
## What On-Chain Data To Monitor
You cannot monitor a grid bot's health from the dashboard alone. The dashboard shows realized profit. It does not show floating drawdown unless you explicitly check open positions.
Check these metrics weekly:
- **Unrealized P/L:** The dollar value of all open positions at current market price. If this number is red and growing, the grid is failing.
- **Fill ratio:** Percentage of buy orders that have corresponding completed sell orders. If buy orders are filling but sell orders are not, you're in a downtrend. Shut it down.
- **Realized volatility vs expected volatility:** If realized volatility drops below the threshold required to cover fees, the bot is net negative. Close it.
- **Grid range vs current price:** If price is near the bottom of your range and trending lower, you're about to exit the range on the downside. Close before that happens.
The most important number is unrealized P/L. If it's negative and growing, the strategy has already failed. Realized profit is irrelevant at that point.
## When Grid Trading Actually Makes Sense
Grid trading makes sense under three conditions, all of which must be true simultaneously:
1. **Range-bound market:** Price has established a clear range with support and resistance levels, and you have reason to believe that range will persist.
2. **Sufficient volatility:** Realized volatility exceeds the fee threshold by at least 2x. If fees are 0.2% per round trip, you need at least 0.4% grid spacing and enough price movement to trigger multiple fills per day.
3. **Defined risk management:** You have a hard stop-loss in place at a specific drawdown percentage, and you will honor it.
If any of these three conditions is missing, skip grid trading. Use a different strategy.
The grid mechanism is not magic. It is a leveraged mean-reversion bet with fee drag. It works in ranging markets. It fails in trending markets. The failure is expensive and predictable.
## The Takeaway
Grid trading bots generate returns by capturing spreads in range-bound markets. The mechanism is sound: buy low, sell high, repeatedly, as price oscillates. The profit source is real volatility, not narrative or hype.
The failure mode is equally specific: trending market plus grid trap. When price exits the range, the bot accumulates inventory on the wrong side of the trend. Unrealized loss grows. Realized profit becomes irrelevant. The $4,200 trapped capital example is not hypothetical. It's structural.
If you run a grid bot, monitor unrealized P/L weekly, set a hard stop-loss at 15-20% drawdown, and close the bot when price approaches range boundaries. The mechanism does not protect you from trending markets. You protect you.
Range-bound volatility is the edge. Trend is the killer. Know which market you're in before deploying capital.
## Frequently Asked Questions
### How much can you actually make with a grid trading bot?
Well-tuned grid bots in genuinely sideways markets typically generate low-single-digit to low-double-digit annualized returns before fees. On liquid majors like BTC and ETH during range-bound periods, expect a handful of grid fills per day. Anything projecting triple-digit annual returns relies on aggressive historical volatility inputs that real markets rarely sustain. Net profit depends on spread per cycle minus fees, multiplied by cycle frequency.
### What is the biggest risk of grid trading bots?
The dominant failure mode is trending market plus grid trap. When price exits your defined range and continues trending, the bot accumulates inventory on the wrong side. In a downtrend, buy orders fill while sell orders never execute, creating large unrealized losses. One trader trapped $4,200 buying an altcoin from $0.43 to $0.08\. The realized profit was $180; the floating loss was $3,900\. Without a hard stop-loss, this drawdown can liquidate your entire account.
### What fees do grid trading bots charge?
Grid bots charge per-trade exchange fees that compound across every fill. Pionex charges 0.05% maker/taker with no subscription. Bybit charges 0.02-0.06% on futures and 0.1% on spot. BYDFi charges 0.1% per side. Third-party platforms like 3Commas add monthly subscriptions of $23-$149 on top of exchange fees. For profitable grid trading, your grid spacing must exceed combined fees, typically 0.2% round-trip, by at least 2x.
### How do you know when to stop a grid trading bot?
Set a hard stop-loss at 15-20% drawdown and honor it. Check unrealized P/L weekly; if it's negative and growing, the strategy has already failed. Monitor fill ratio: if buy orders fill but sell orders don't, you're in a downtrend. If price approaches your range boundary, close before it exits. If realized volatility drops below the fee threshold, shut it down. The bot has no internal stop-loss. You must enforce risk limits yourself.
### Are grid trading bots better than buying and holding?
Only in range-bound markets. In strong uptrends, grid bots systematically sell into rising prices and underperform buy-and-hold. In downtrends, they accumulate inventory at falling prices and suffer drawdown. Grid bots extract value from sideways volatility that holders ignore. If you believe an asset will trend higher, hold it. If you expect sustained ranging with sufficient volatility, grid it. The strategy is conditional, not universal.
The Weekly Yield Report
You just decomposed three yield components, two fee structures, and one catastrophic failure mode. Those volatility thresholds will shift next week.
Every Thursday: where crypto yield actually is - stablecoins, liquid staking and DeFi lending, with the risk named next to the rate and what changed since last week.
[Get it free every Thursday](#/portal/signup)
Free. No trade calls, no allocations, no hype. Unsubscribe in one click.
### Writing An Exit Condition Before You Buy
URL: https://altcoininvestor.com/when-to-sell-low-cap-crypto/
Last updated: 2026-09-22T21:06:54.000Z
## The Question That Matters Most
You are considering a small-cap token. You have read the pitch, reviewed the website, checked liquidity metrics, and decided the entry price is acceptable. Before you buy, write down the exact conditions under which you would sell. If you cannot name three specific, measurable circumstances that would falsify your thesis, you do not have a thesis. You have a bet on momentum that will cost you money when the momentum stops.
The most common way small-cap positions go to zero is not a rug pull or a hack. It is holding through a broken thesis because the thesis was never written as something that could be proven false. The investor who bought at $0.12 continues to hold at $0.03, then $0.008, not because the fundamentals improved but because the original case was never articulated in terms that could fail. This article covers the specific metrics that signal thesis failure, how to define falsifiable conditions before entry, and why confluence across multiple data sources reduces false exits without leaving you married to a failing position.
## What Makes An Exit Condition Falsifiable
A falsifiable exit condition is a statement about observable data that can be proven wrong. "The protocol will succeed" is not falsifiable. "The protocol will reach 10,000 daily active users by Q2 2025" is falsifiable. "The team is strong" is not falsifiable. "The team will ship the staking module by December 31" is falsifiable. "The token is undervalued" is not falsifiable. "The MVRV Z-score will remain below 5 during the current cycle" is falsifiable.
The distinction matters because a non-falsifiable thesis allows you to ignore evidence. If your thesis is that a project is undervalued, any price decline can be interpreted as increased undervaluation. If your thesis is that monthly active addresses will grow at 8% for six months, a three-month period of 2% growth falsifies the thesis, and you must either revise your position size or exit entirely.
The structure of a falsifiable exit condition has three parts. First, the metric being measured. Second, the threshold value at which the metric signals failure. Third, the time window within which that threshold matters. Examples include:
- User growth rate drops below 5% month-over-month for three consecutive months
- 24-hour trading volume falls below $500,000 for seven consecutive days
- MVRV Z-score reaches 6 or higher without a new partnership, product launch, or other fundamental catalyst
- Bid-ask spread exceeds 3% on the primary exchange for 14 days
- Whale wallets (top 10 holders) increase their share of circulating supply by more than 8 percentage points within 30 days
- Treasury unlock schedule releases more than 15% of circulating supply within 90 days without corresponding burn mechanism or protocol revenue growth
Each of these conditions can be checked. Each has a defined threshold. Each has a time constraint. If the condition is met, the thesis is falsified, and you act. If you cannot write conditions in this format before you buy, you are speculating on narrative rather than investing on thesis.
## The On-Chain Metrics That Signal Thesis Failure
On-chain data provides the most reliable early signals of thesis breakdown because it reflects actual user and holder behavior before that behavior is fully priced into markets. The five metrics that matter most for small-cap exit conditions are MVRV Z-score, realized price divergence, exchange inflow volume, active address growth, and whale concentration.
### MVRV Z-Score
The [MVRV Z-score](https://messari.io/diligence-reports) measures the gap between market value and realized value, normalized by standard deviation. Realized value is the aggregate cost basis of all coins at the price they last moved on-chain. When market value climbs well above realized value, the token is in profit for most holders, and the probability of profit-taking increases. Historical thresholds show conservative exits at Z-score 5, moderate exits at 6, and aggressive exits at 7\. These thresholds outperform buy-and-hold benchmarks across drawdown, volatility, and risk-adjusted return metrics.
For small-cap tokens, MVRV is most useful when combined with a fundamental catalyst check. A Z-score of 6 accompanied by a major product launch, exchange listing, or partnership may justify continued holding. A Z-score of 6 with no new fundamental development and declining transaction volume is a clear exit signal.
### Realized Price Bands and Holder Capitulation
Realized price bands show the cost basis distribution of current holders. When market price falls below the lower realized price band, most holders are underwater, and panic selling often accelerates. For a small-cap position, this metric works as a stop-loss amplifier. If your initial stop-loss is set at -30% and price approaches the lower realized band, tighten the stop to -35% or exit immediately. Once price breaks below realized cost for the majority of holders, liquidity typically evaporates, and bid support collapses.
### Exchange Inflow Volume
Sudden spikes in exchange inflow volume signal that large holders are preparing to sell. When exchange inflow exceeds 30% of the trailing 90-day average volume within a seven-day window, the probability of sharp price decline increases. For small-cap tokens, this signal is especially reliable because the holder base is more concentrated. A single whale moving tokens to an exchange can represent 10% or more of circulating supply.
Free tools like Etherscan and blockchain explorers allow you to track large transfers to known exchange deposit addresses. Setting up alerts for transfers above a specific threshold (for example, 2% of circulating supply) provides actionable early warning.
### Active Address Growth
Active addresses measure unique wallets interacting with the protocol each day or week. For small-cap tokens, the thesis often depends on adoption trajectory. If monthly active address growth drops below the threshold you defined at entry and stays flat for three consecutive months, the S-curve has plateaued. The rapid growth phase is over, and the token is unlikely to reach the adoption target your valuation assumed.
This metric is most useful when analyzed alongside transaction volume. A token can show stable active addresses while transaction volume declines, which suggests that existing users are reducing engagement. Both metrics should be moving in the direction your thesis predicted, or the thesis has failed.
### Whale Concentration
Concentrated holdings by large wallets create exit risk. If the top 10 holders control more than 60% of circulating supply, a coordinated or panic-driven sell-off can collapse price faster than you can exit. Track whale concentration at entry and set an exit condition if concentration increases by more than 8 percentage points. Rising concentration during a price rally suggests that smaller holders are selling to larger wallets, which may be accumulating before a planned distribution event.
Tools like [Etherscan, DeFiLlama, and Dune Analytics](https://altcoininvestor.com/how-to-screen-low-cap-token/) provide free access to wallet distribution data. Paid platforms like Nansen and Santiment Pro add real-time alerts and historical depth, but the free tiers are sufficient for defining and monitoring exit conditions on a small number of positions.
## Liquidity Metrics and the Question of Whether You Can Actually Sell
Daily volume measures activity, not exit capacity. A token can show $2 million in daily volume but still have insufficient liquidity to absorb a $50,000 sell order without 15% slippage. [Liquidity depth](https://altcoininvestor.com/crypto-liquidity-depth-slippage-small-cap/) is the metric that matters for exit planning, and it is the metric most small-cap investors ignore until they try to sell.
The five liquidity indicators to track are bid-ask spread percentage, 24-hour trading volume, order book depth within ±2% of mid-price, slippage percentage on a $10,000 test order, and CoinMarketCap Liquidity Score (0-1000 scale). Healthy liquidity shows spread below 0.15%, volume above $1 million per day, deep order books within ±2%, slippage below 0.5% on $10,000, and CMC score above 750.
Small-cap DEX pools often show spreads of 3-6%, shallow depth, and slippage above 5% on modest orders. If your position size is $10,000 and slippage is 8%, you will lose $800 just executing the exit. That loss is foreseeable and measurable before you enter the position. If liquidity metrics do not support your intended position size, reduce the size or skip the trade.
Set an exit condition based on liquidity decay. If bid-ask spread exceeds 3% for 14 consecutive days, or if CMC Liquidity Score falls below 400, exit regardless of price. Illiquid tokens do not recover liquidity during downtrends. Once liquidity evaporates, the position becomes unexitable, and the thesis no longer matters because you cannot act on it.
## Why Confluence Reduces False Exits Without Leaving You Holding A Broken Thesis
A single indicator flashing red is not sufficient reason to exit. On-chain data contains noise, false breakouts, exchange wash trading, bot activity, and internal transfers that can trigger individual metrics without signaling true thesis failure. Confluence is when multiple independent metrics point in the same direction within a short time window. That is the signal worth acting on.
For example, MVRV Z-score reaching 6 alone is a weak signal. MVRV Z-score reaching 6 while exchange inflow volume spikes by 40% and active address growth has been flat for two months is a strong signal. The three metrics are measuring different aspects of the same underlying reality: holders are taking profit, new users are not replacing them, and large holders are preparing to sell. The confluence of these signals reduces the probability that you are exiting on noise.
The European sovereign debt crisis of 2011-2013 offers a useful parallel. Greek bond yields rose sharply in mid-2010, but many institutional holders stayed in the position because rising yields could have signaled temporary mispricing. By early 2011, yields were still rising, deposit outflows from Greek banks had accelerated, and the ECB had quietly shifted Greek collateral rules. The confluence of bond market stress, deposit flight, and regulatory signals told the full story. Investors who waited for a single definitive signal waited until after the restructuring was announced, at which point the position was already a loss.
The same principle applies to small-cap tokens. If your exit conditions are based on single-metric triggers, you will either exit too early on false signals or too late on real ones. [Confluence-based exit rules](https://altcoininvestor.com/when-to-exit-defi-position/) require that at least two of your predefined metrics cross their thresholds within a 30-day window before you act. This structure gives the position room to absorb short-term noise while ensuring that you exit when multiple independent signals confirm thesis failure.
## Position Sizing and the Rule That Limits Losses Before They Happen
The best exit condition is the one you never have to execute because the position was sized correctly at entry. If you allocate 20% of your portfolio to high-risk small-cap tokens and each position within that allocation is equally weighted, the maximum loss from any single position going to zero is 4% of your total portfolio. That loss is survivable. It does not force panic decisions, and it does not prevent you from taking the next trade.
Small-cap tokens with market caps below $1 billion carry measurably higher risk of total loss. Lower liquidity, higher exposure to manipulation, more frequent rug pulls, and weaker holder bases all increase the probability that the position declines by 80% or more before you can exit. The rotation of low-caps during bull markets means that most small-cap positions will either multiply or go to near-zero. There is no stable middle outcome.
Given that risk profile, position sizing is the primary risk control, and exit conditions are the secondary control. Define your exit conditions before entry, but size the position so that if all exit conditions fail and the token goes to zero, the loss does not exceed 2-5% of your portfolio. This approach allows you to hold positions with high-risk, high-reward profiles without the emotional pressure that causes investors to override their exit rules when the conditions are met.
## When Momentum-Only Thesis Fails and Why Price Action Is Not An Exit Condition
Many small-cap investors do not write exit conditions based on fundamentals or on-chain metrics. They write exit conditions based on price action: "I will sell if price falls 25%." This approach fails because price action in small-cap tokens is dominated by leverage liquidations, thin order books, false breakouts, news shocks, and wash trading. A 25% decline can reverse within 48 hours without any change in the underlying thesis. Conversely, a token can decline 15% while all fundamental and on-chain metrics continue to deteriorate, and the price-based stop-loss never triggers until the position is down 60%.
Price-based exit conditions work in large-cap, liquid markets where price aggregates information efficiently. They do not work in small-cap tokens where a single whale exit or a liquidation cascade can move price 30% in either direction without any change in adoption, revenue, or user growth.
If you must use price-based stops, combine them with fundamental or on-chain confirmations. For example: "I will exit if price falls 30% and active address growth has been negative for two consecutive months." The price decline alone is not the signal. The price decline combined with deteriorating fundamentals is the signal. This structure prevents you from exiting on noise while ensuring that you do not hold through a price collapse that reflects real thesis failure.
## The Tool Ecosystem for Tracking Exit Conditions
Free tools that provide sufficient data for most small-cap exit tracking include Etherscan (wallet tracking, transaction history, holder distribution), DeFiLlama (TVL, protocol revenue, token unlocks), Dune Analytics (custom queries, on-chain metrics with rate limits), CoinMarketCap and CoinGecko (price, volume, liquidity scores), and basic charts from Santiment and Glassnode. These platforms allow you to define and monitor the five core on-chain and liquidity metrics without paying for premium tiers.
Paid tools that unlock deeper historical data, multi-chain coverage, real-time alerts, and export APIs include Nansen (wallet labeling, smart money tracking, token god mode), Glassnode Pro (full on-chain metric suite, custom alerts, API access), CryptoQuant (exchange flow data, miner metrics, institutional activity), Santiment Pro (social sentiment combined with on-chain data, development activity tracking), and Messari Pro (research reports, governance tracking, tokenomics dashboards). The free tiers are sufficient for tracking two to five positions. If you are running a larger portfolio of small-cap tokens, the paid tiers justify their cost by reducing the time required to monitor exit conditions across multiple assets.
The workflow is straightforward. At entry, document your three to five exit conditions in a spreadsheet or notebook. Include the metric name, the threshold value, the time window, and the data source you will use to check it. Set a recurring calendar reminder (weekly or biweekly) to review each condition. When one condition is met, note it but do not act. When two or more conditions are met within 30 days, execute the exit. This process takes 15 minutes per position every two weeks and eliminates the emotional decision-making that causes most small-cap losses.
## What Happens When You Ignore Exit Conditions
Investors who define exit conditions at entry but override them when the conditions are met do worse than investors who never define conditions at all. The reason is that defining and then ignoring conditions creates cognitive dissonance, which the investor resolves by constructing a new narrative to justify holding. That new narrative is always weaker than the original thesis because it was constructed to rationalize a decision rather than to evaluate evidence.
The European banking sector in 2011 provides the clearest example. Many institutional investors held Greek, Portuguese, and Irish sovereign debt with predefined exit conditions based on debt-to-GDP ratios, primary deficits, and ECB collateral rules. When those conditions were met in early 2011, the investors did not exit. They constructed new narratives about ECB support, EU fiscal transfers, and political will to avoid restructuring. Those narratives were not based on evidence. They were based on the desire to avoid realizing a loss. By the time the restructuring was announced in 2012, the losses were 50-70% larger than they would have been if the original exit conditions had been respected.
Small-cap token holders repeat this pattern constantly. The thesis was that user growth would reach 15% month-over-month. Growth has been 3% for four months. The exit condition is clear. Instead of exiting, the holder constructs a new narrative: the team is still building, the market has not noticed yet, the next partnership will accelerate adoption. The new narrative is not tested against evidence because it was not constructed to be falsifiable. It was constructed to justify inaction. The position declines another 60%, and the holder finally exits at a total loss.
If you find yourself constructing a new narrative to avoid executing a predefined exit condition, [exit immediately](https://altcoininvestor.com/common-crypto-mistakes-beginners/). The new narrative is not insight. It is loss aversion. The best investors are not the ones who pick the most winners. They are the ones who exit broken theses before the losses compound.
## The Takeaway
If you cannot write three falsifiable conditions under which you would sell a small-cap token, you do not have a thesis. You have exposure to narrative momentum, and narrative momentum stops without warning. The metrics that matter are MVRV Z-score, realized price divergence, exchange inflow volume, active address growth, whale concentration, and liquidity depth. Define thresholds for each metric before you enter the position. Wait for confluence across at least two metrics before you exit. Size the position so that a total loss does not exceed 2-5% of your portfolio. Respect the exit conditions when they are met, even when the new narrative you construct to justify holding sounds compelling. The most common way small-cap positions go to zero is not fraud or technical failure. It is holding through measurable thesis breakdown because the thesis was never written as something that could be proven false.
## Frequently Asked Questions
### What is a falsifiable exit condition?
A falsifiable exit condition is a measurable statement about observable data that can be proven wrong. It includes the metric being tracked, the threshold value that signals failure, and the time window. Examples include user growth dropping below 5% month-over-month for three months, or MVRV Z-score exceeding 6 without fundamental catalyst. Non-falsifiable statements like 'the token is undervalued' cannot be tested and allow investors to ignore contradictory evidence.
### How many exit conditions should I define before buying a small-cap token?
Define three to five exit conditions covering different risk dimensions: on-chain metrics like MVRV Z-score or active address growth, liquidity metrics like bid-ask spread or order book depth, and holder behavior like exchange inflow volume or whale concentration. Wait for confluence across at least two conditions within a 30-day window before executing the exit. This reduces false exits from single-metric noise while ensuring you act when multiple independent signals confirm thesis failure.
### What is the most reliable on-chain metric for small-cap exit signals?
MVRV Z-score is the most reliable single metric because it measures the gap between market value and realized holder cost basis. When Z-score reaches 6 or higher, most holders are in profit and selling pressure typically increases. For small-caps, combine MVRV with exchange inflow volume and active address growth. If MVRV crosses 6 while exchange inflows spike and user growth stalls, that confluence is the strongest exit signal available from on-chain data.
### Why do price-based stop losses fail for small-cap tokens?
Price action in small-cap tokens reflects leverage liquidations, thin order books, false breakouts, and wash trading more than fundamental changes. A 25% price drop can reverse within 48 hours without thesis change, or a token can decline 15% while fundamentals deteriorate and the stop never triggers until the position is down 60%. Price-based exits work in efficient markets but fail in low-liquidity assets. Combine price stops with on-chain or fundamental confirmation to avoid exiting on noise.
### What liquidity metrics matter most for exit planning?
Track bid-ask spread percentage, order book depth within ±2% of mid-price, and slippage on a $10,000 test order. Healthy liquidity shows spread below 0.15%, deep books, and slippage below 0.5%. Small-cap DEX pools often show 3-6% spreads and 5-8% slippage. If your $10,000 position faces 8% slippage, you lose $800 just exiting. Set an exit condition if spread exceeds 3% for 14 days or if CoinMarketCap Liquidity Score falls below 400.
The Weekly Yield Report
You now have five on-chain metrics, three liquidity thresholds, and a confluence rule for small-cap exits. Those thresholds will move as market structure changes.
Every Thursday: where crypto yield actually is - stablecoins, liquid staking and DeFi lending, with the risk named next to the rate and what changed since last week.
[Get it free every Thursday](#/portal/signup)
Free. No trade calls, no allocations, no hype. Unsubscribe in one click.
### What A 1% Rate Difference Actually Costs You
URL: https://altcoininvestor.com/defi-yield-opportunity-cost-rate-difference/
Last updated: 2026-09-22T19:03:42.000Z
## The Question: What Does A 1% Rate Gap Actually Cost
You have $50,000 in stablecoins earning 5% APY on Aave. Morpho is paying 6%. That is a 1% rate difference. What does it cost you to stay where you are?
The arithmetic is simple. The decision is not. Because moving costs gas. Because rates change daily. Because the 1% gap you see today may reverse in a week. The crossover point where switching becomes rational depends on position size, transaction cost, and how long the rate spread holds.
This article decomposes the opportunity cost of staying in a below-market venue. It shows what a 1% difference costs annually at different position sizes. It calculates the gas cost of moving. It gives the position-size threshold where switching stops being worth the effort. No advice. Just the arithmetic.
## The 1% Math At Different Position Sizes
A 1% annual rate difference produces different absolute costs depending on how much capital you deploy. Here is the table.
**$5,000 position:**
1% difference = $50 per year, or $4.17 per month. Ethereum mainnet gas to move capital from one lending protocol to another costs approximately $0.10 to $0.25 per transaction in 2026\. Two transactions (withdraw and deposit) cost $0.50 total. The gas cost is 1% of annual opportunity cost. That sounds small until you account for rate volatility.
If the 1% rate spread closes to 0.5% within two weeks, your annual gain drops to $25\. The gas cost is now 2% of gain. If the spread reverses because utilization curves shift, you are underwater. At $5,000, moving is not worth it unless the rate gap exceeds 2-3% and appears structurally stable for at least one quarter.
**$50,000 position:**
1% difference = $500 per year. Quarterly rebalancing means four transactions annually. At $0.25 per transaction, that is $1 in total gas per year. Gas represents 0.2% of the opportunity gain. This is where the math shifts. Even if the rate spread narrows to 0.7%, you still net $349 annually after gas. Moving quarterly becomes rational.
**$100,000 position:**
1% difference = $1,000 per year. Monthly rebalancing (12 transactions at $0.50 round-trip each) costs $6 annually. Gas is 0.6% of gain. At this scale, even a 0.5% rate advantage ($500 annually) justifies monthly monitoring and movement. Gas cost is immaterial relative to position size.
**$500,000 position:**
1% difference = $5,000 per year. Gas costs round to zero. At this scale, daily rate monitoring and weekly rebalancing between Aave, Morpho, Compound, and Spark become economically justified. The failure mode is no longer gas cost. It is execution risk during high utilization periods when withdrawal liquidity dries up.
## The Crossover Point: When Gas Stops Mattering

Gas becomes economically immaterial when it represents less than 1% of the annual opportunity cost. The threshold depends on network and transaction cost.
**Ethereum mainnet:**
At $0.25 per transaction and two transactions to move, the total cost is $0.50\. For gas to represent 1% of opportunity cost, the annual gain must be $50\. That requires a position size of $5,000 at a 1% rate difference, or $2,500 at a 2% difference. Below $5,000, moving capital between venues is economically irrational unless chasing rate spreads exceeding 2-3%.
**Layer 2 networks:**
Transaction costs on Arbitrum, Base, and Optimism range from $0.001 to $0.05 in 2026\. At $0.01 per transaction, a round-trip move costs $0.02\. For this to represent 1% of opportunity cost, the annual gain need only be $2\. That happens at a $200 position with a 1% rate difference. The position-size threshold drops by 50-100x on Layer 2\. A $1,000 position on Base justifies quarterly optimization. The same position on Ethereum mainnet does not.
The crossover point is approximately $30,000 to $50,000 on Ethereum mainnet and $500 to $1,000 on Layer 2 networks. Above those thresholds, gas costs become negligible. Below them, rate-chasing erodes capital through transaction drag.
### Rate Volatility Undermines Static Comparisons
DeFi lending rates are set by utilization curves. When borrowing demand rises, supply rates rise. When demand drops, rates fall. The 1% spread you observe today may reverse within days. This is not theoretical. It happens continuously across Aave, Morpho, Compound, and Spark.
In March 2026, USDC supply rates on Aave spiked to 8.2% APY when utilization exceeded 85%. Morpho paid 7.1% the same day. The 1.1% spread favoring Aave lasted 11 days before utilization dropped and Aave's rate fell to 5.4% while Morpho rose to 6.3%. The spread reversed. Anyone who moved capital to chase the initial spread paid gas twice and ended up in the lower-rate venue.
The opportunity cost calculation assumes the rate spread is stable. It rarely is. Moving cost becomes sunk. The yield recovery timeline extends. At position sizes below $50,000, the volatility risk dominates the opportunity cost unless the rate difference is structurally driven (e.g., Ethena's funding-rate component versus pure supply-demand lending) rather than transient utilization shifts.
For those managing stablecoin positions and weighing venue options, understanding the full stacking of rates and mechanisms matters. Our guide to [earning passive income from stablecoins in 2026](https://altcoininvestor.com/how-to-earn-passive-income-stablecoins-2026/) breaks down the different yield sources and their underlying drivers.
## The Actual Cost Of Moving
Transaction cost is the visible expense. Execution risk and timing are the hidden ones.
**Gas cost:**
On Ethereum mainnet, a typical ERC-20 approval plus deposit interaction costs $0.10 to $0.25 in 2026\. Withdrawing from the origin protocol costs the same. Total round-trip: $0.20 to $0.50\. On Layer 2 networks, the equivalent sequence costs $0.002 to $0.10\. These are 2026 averages. During network congestion or depeg events, mainnet gas spikes 10-50x.
**Withdrawal liquidity risk:**
Lending protocols do not guarantee instant withdrawal. If utilization exceeds 90%, the pool may lack liquidity to process large withdrawals without waiting for new deposits or loan repayments. In a USDC depeg event, every leveraged position in the ecosystem tries to unwind simultaneously. Utilization hits 100%. Borrow rates spike to 50-200% APY. Supply rates follow, but withdrawal queues form. Gas costs surge. The 1% rate advantage you moved to capture evaporates in hours.
**Opportunity cost of downtime:**
Moving capital between protocols takes time. If you withdraw from Aave, bridge stablecoins to another chain, and deposit into Morpho, your capital earns zero yield during the transition. For a $100,000 position earning 6% APY, one day of downtime costs $16.44\. If the rate advantage is 1% ($1,000 annually, or $2.74 daily), the downtime cost equals 6 days of incremental yield. If execution takes 2 days due to bridge delays, you lose 12 days of advantage before earning the first dollar.
The actual cost of moving is gas plus downtime plus execution risk. At small position sizes, these costs exceed the opportunity gain unless the rate spread is large and durable.
### Layer 2 Networks Change The Geometry
On Ethereum mainnet, the position-size threshold for rational rebalancing is $30,000 to $50,000\. On Layer 2 networks, it drops to $500 to $1,000.
Arbitrum, Base, and Optimism host DeFi lending markets with transaction costs 50-100x lower than mainnet. Aave V3 is deployed on all three. Morpho is live on Base. Compound and Spark are expanding to Layer 2\. The rate environment is similar. The transaction cost is not.
At $0.01 per transaction, a $2,000 position losing 1% annually ($20) can move quarterly for $0.12 in gas and still net $19.88\. The same position on mainnet pays $2 in gas and nets $18\. The Layer 2 advantage compounds with rebalancing frequency. Monthly optimization becomes rational at $5,000 on Base. The same behavior is irrational at $50,000 on mainnet if rates shift faster than monthly.
Layer 2 networks reduce the friction cost of capital movement but do not eliminate rate volatility. The 1% spread still fluctuates. The gas savings make smaller-scale active management viable, but they do not remove the risk that rates reverse between moves.
## When It Matters And When It Does Not
The 1% rate difference matters when position size exceeds the gas-cost threshold and the rate spread is structurally stable. It does not matter when position size is small, rates are volatile, or the yield gap is driven by temporary utilization rather than mechanism differences.
**It matters:**
- Position size above $50,000 on Ethereum mainnet or $2,000 on Layer 2
- Rate spread exceeding 1% and stable for at least 30 days
- Rate difference driven by structural factors (Ethena's funding rate component, Spark's DSR pass-through, Morpho's curator-selected markets) rather than transient utilization shifts
- Low-volatility stablecoin environments where depeg risk and borrow-rate spikes are unlikely
**It does not matter:**
- Position size below $5,000 on mainnet or $500 on Layer 2
- Rate spread fluctuating weekly due to utilization curve dynamics
- High-volatility market conditions where liquidation risk and gas spikes dominate
- Situations where downtime cost (moving capital between chains or protocols) exceeds 3-5 days of incremental yield
The failure mode is moving capital to chase a rate that reverses before you recover the transaction cost. This happens frequently in DeFi because utilization-driven rates shift faster than most position holders monitor them. DefiLlama publishes live supply and borrow rates across Aave, Morpho, Compound, and Spark. Monitoring daily is required. Moving quarterly is rational at scale. Moving weekly is not unless position size exceeds $250,000.
If you are optimizing between lending protocols with different risk architectures, the rate comparison must account for liquidation thresholds and collateral factors. Our breakdown of [what drives loan rate differences](https://altcoininvestor.com/crypto-loan-rates-compared/) between venues covers the structural factors beyond utilization.
### Edge Cases And Failure Modes
The 1% arithmetic assumes normal market conditions. Several edge cases break the model.
**Depeg events:**
In a USDC depeg (March 2023, Circle's SVB exposure), every overcollateralized loan backed by USDC tries to repay simultaneously. Utilization spikes to 100%. Borrow rates exceed 200% APY. Supply rates follow but liquidity vanishes. Gas costs surge 10x. The rate advantage you moved to capture disappears. Worse, if you hold a leveraged position, the depeg triggers liquidation. The 1% yield optimization becomes a total-loss event.
**Protocol exploits:**
Moving capital from Aave (9 years, $25B TVL, multiple audits) to a newer protocol offering 2% higher yield introduces smart contract risk. If the higher-yield protocol suffers an exploit, the rate advantage is irrelevant. The entire principal is at risk. The opportunity cost of staying in Aave is not $2,000 annually on a $100,000 position. It is the expected value of $2,000 gain versus the probability-weighted loss of $100,000\. At a 2% annual exploit probability (a reasonable baseline for newer protocols), the expected loss is $2,000\. The rate advantage nets to zero after risk adjustment.
**Bridge risk:**
If the higher rate exists on a different chain, moving capital introduces bridge risk. Bridging $100,000 in USDC from Ethereum to Arbitrum via a canonical bridge is low-risk. Bridging via a third-party bridge to chase 1.5% higher yield on a smaller chain increases the attack surface. Bridge exploits (Ronin, Wormhole, Nomad) have cost users billions. The opportunity cost calculation must include bridge-failure probability.
**Rewards expiration:**
Many high-yield DeFi venues augment base supply rates with token emissions. Morpho's curated vaults often include MORPHO incentives. Aave occasionally distributes stkAAVE rewards. These emissions inflate APY but introduce price risk and vesting schedules. If you move capital to a venue offering 8% APY (5% base + 3% token rewards) and the token price drops 50%, the effective yield is 6.5%. The rate advantage over a 5% base-rate venue disappears.
The 1% rate difference is only relevant when both venues have comparable risk profiles. Comparing Aave (long track record, deep liquidity) to a new Morpho vault (untested curator, shallow liquidity) is not a 1% decision. It is a risk-regime change.
## Monitoring And Verification
Rate spreads shift daily. Static comparisons are useless. Monitoring must be continuous.
**Rate aggregators:**
[DefiLlama](https://defillama.com/) publishes live supply and borrow rates for Aave, Morpho, Compound, Spark, and 380+ other lending protocols. The data updates hourly. It shows current APY, 7-day average, and 30-day trend. This is the baseline for rate comparison.
Amberdata and Dune Analytics offer more granular views, including utilization curves, historical rate spreads, and volatility metrics. These tools let you verify whether a rate spread is transient (utilization-driven, likely to reverse within days) or structural (mechanism-driven, likely to persist for weeks).
**On-chain verification:**
Do not trust aggregator displays without verifying the source contract. Aave V3 exposes supply and borrow rates via the `getReserveData` function. Morpho vaults publish rates in the vault contract's `totalAssets` and `totalSupply` state. Reading contract state directly eliminates the risk that an aggregator displays stale or incorrect data.
**Position-size triggers:**
Set a position-size threshold below which you do not move capital. On Ethereum mainnet, $50,000 is a reasonable floor. Below that, the opportunity cost of a 1% spread is less than $500 annually, and rate volatility makes chasing spreads a losing strategy. On Layer 2 networks, $2,000 is a reasonable floor. Above these thresholds, quarterly rebalancing becomes rational if the rate spread exceeds 1% and appears stable for 30+ days.
**Rate-spread stability:**
A 1% spread that has held for 7 days is not stable. A spread that has held for 60 days likely reflects structural differences in yield mechanisms. Check 30-day and 90-day rate history on DefiLlama before moving capital. If the spread fluctuates more than 0.5% weekly, it is utilization-driven and not worth chasing.
Anyone deploying capital across multiple DeFi lending venues should understand how each one sets rates and manages risk. Our explainer on [how Morpho lending works](https://altcoininvestor.com/morpho-lending/) walks through the immutable-market and curated-vault models and what that means for rate stability and principal risk.
## The Takeaway
A 1% rate difference costs $50 annually on a $5,000 position, $500 on a $50,000 position, and $1,000 on a $100,000 position. Gas costs to move capital are $0.20 to $0.50 on Ethereum mainnet and $0.002 to $0.10 on Layer 2 networks. The crossover point where switching becomes economically rational is approximately $30,000 to $50,000 on mainnet and $500 to $1,000 on Layer 2.
Below those thresholds, transaction costs and rate volatility make chasing spreads a losing strategy. Above them, quarterly rebalancing becomes rational if the rate spread exceeds 1% and remains stable for 30+ days. The failure mode is moving capital to capture a spread that reverses before you recover the gas cost. This happens frequently because DeFi lending rates shift daily in response to utilization curves.
The arithmetic is simple. The decision requires monitoring rate stability, verifying on-chain data, and setting position-size thresholds. The 1% difference matters at scale. It does not matter below it.
## Frequently Asked Questions
### At what position size does a 1% rate difference justify moving capital between DeFi lending protocols?
On Ethereum mainnet, the threshold is approximately $30,000 to $50,000\. Below that, gas costs ($0.20 to $0.50 per round-trip) and rate volatility erode the benefit of switching venues. On Layer 2 networks like Arbitrum or Base, transaction costs are 50-100x lower, dropping the threshold to $500 to $1,000\. Above these amounts, quarterly rebalancing becomes economically rational if the rate spread exceeds 1% and remains stable for at least 30 days.
### How much does a 1% annual rate difference actually cost on a $100,000 stablecoin position?
A 1% rate difference on $100,000 costs $1,000 annually, or $83.33 per month. If you move capital monthly, the gas cost on Ethereum mainnet is approximately $6 per year (12 transactions at $0.50 round-trip). Gas represents 0.6% of the opportunity gain. At this position size, even a 0.5% rate advantage justifies active monitoring and quarterly rebalancing. Below $50,000, rate volatility and transaction costs make frequent switching uneconomical.
### Why do DeFi lending rates change so frequently and how does that affect rate-chasing strategies?
DeFi lending rates are set by utilization curves that respond to real-time borrowing demand. When utilization rises above 80-90%, supply rates spike to attract more deposits. When demand drops, rates fall within hours. A 1% rate spread favoring one protocol can reverse within days as capital flows in and utilization rebalances. This volatility means the spread you move to capture may disappear before you recover the gas cost, especially for positions under $50,000 where transaction costs are material.
### What is the actual transaction cost to move stablecoins between DeFi lending protocols in 2026?
On Ethereum mainnet, moving stablecoins between protocols requires two transactions: withdrawal from the origin and deposit to the destination. Each costs approximately $0.10 to $0.25 in gas, totaling $0.20 to $0.50 per move. On Layer 2 networks like Base, Arbitrum, and Optimism, the same sequence costs $0.002 to $0.10 total. During network congestion or depeg events, mainnet gas can spike 10-50x. Layer 2 costs remain stable even during volatility.
### What risks make a 1% higher yield not worth pursuing between DeFi protocols?
Three main risks negate a 1% yield advantage: smart contract risk, bridge risk, and rate volatility. Moving from Aave (9-year track record, $25B TVL) to a newer protocol offering 1-2% higher yield introduces exploit risk. If the protocol has even a 2% annual exploit probability, the expected loss equals the rate advantage. Bridging to another chain for higher yield adds bridge-failure risk. Rate volatility driven by utilization curves can reverse a 1% spread within days, causing you to pay gas twice and end up in the lower-rate venue.
The Weekly Yield Report
You have just seen the crossover points at $5,000, $50,000, and $100,000 and how Layer 2 changes the threshold. Those numbers shift every quarter as gas costs and rate environments evolve.
Every Thursday: where crypto yield actually is - stablecoins, liquid staking and DeFi lending, with the risk named next to the rate and what changed since last week.
[Get it free every Thursday](#/portal/signup)
Free. No trade calls, no allocations, no hype. Unsubscribe in one click.
### How To Audit Protocol Multisig And Governance Risk
URL: https://altcoininvestor.com/how-to-check-protocol-multisig-before-depositing/
Last updated: 2026-09-22T17:05:33.000Z
## Who Controls the Protocol Holding Your Money
Before you deploy six figures into any DeFi yield position, you need to answer one question: who can change the terms, upgrade the contracts, or drain the treasury without your consent? No audit report will answer this for you. Auditors review code quality and mathematical correctness. They do not evaluate governance attack surface or multisig signer composition. That check belongs to you.
I spent twelve years in traditional gambling compliance before crypto. Every regulated operator undergoes independent audits of game fairness, payout algorithms, and transaction flows. But the most serious risks never came from bad code. They came from control structures that let insiders change payout tables, redirect deposits, or freeze withdrawals without regulatory oversight.
DeFi protocols face identical governance risk. The difference is that traditional finance has regulators, escrow agents, and legal recourse. In crypto, if a 2-of-3 multisig controlled by anonymous signers decides to upgrade the contract and siphon your position into a new wallet, your funds are gone. No regulator will reverse the transaction. No court will enforce a refund.
The income mechanism here is avoided loss. Governance attacks, rug pulls via proxy upgrades, and unilateral term changes have drained billions from yield positions. The largest single point of failure in DeFi is not smart contract bugs. It is control structures that allow small groups to execute hostile actions faster than users can exit.
## The Checklist: Five Queries Before Every Deployment

This is the sequence I run before committing capital to any new protocol. Each check takes five to fifteen minutes. The entire process takes less than an hour. If the protocol fails any of these checks and you deploy anyway, you have accepted governance risk as part of your return profile.
### 1\. Multisig Composition and Threshold
Start at the protocol documentation or governance forum. Find the multisig address. Most protocols publish this in their docs under "Security" or "Governance." If they do not, that is a red flag by itself.
Navigate to [Etherscan](https://www.etherscan.io/) (or the block explorer for the relevant chain). Paste the multisig address. Look for a Safe (formerly Gnosis Safe) contract. Click the "Read Contract" tab. Find the function labeled "getOwners" or "owners." This returns the array of signer addresses. Count them.
Next, find the "threshold" function. This tells you how many signatures are required to execute a transaction. The ratio of threshold to total signers determines your risk exposure.
Red flags: 1-of-2, 2-of-2, or any configuration where threshold equals total signers. A 2-of-2 multisig means one lost key locks the protocol forever. A 1-of-2 means one compromised key drains it instantly.
Yellow flags: 2-of-3 multisigs on protocols with more than $50 million in TVL. For six-figure deployments, I want to see 3-of-5 minimum. Larger protocols should use 4-of-7 or higher.
Green standard: 3-of-5 or better, with signers who are publicly identified entities or organizations with reputational stake. Uniswap, Aave, and Compound all use multisig thresholds appropriate to their TVL. Newer protocols often do not.
### 2\. Signer Identity and Distribution
Knowing the threshold is not enough. You need to know who the signers are and whether they are independent.
Take each signer address and search it on Etherscan. Look for labels. If Etherscan has labeled the address "Protocol Foundation," "Team Wallet," or a known entity, write it down. If the address is unlabeled, search it on Twitter, governance forums, or Nansen.
Red flag: All signers are anonymous addresses with no public accountability. If the protocol cannot or will not identify signers, you are trusting ghosts.
Yellow flag: All signers are employees of the same company or foundation. This creates operational efficiency but eliminates independence. If the organization decides to act against user interests, no signer will dissent.
Green standard: Signers include independent entities, outside organizations, or individuals with established reputations in the ecosystem. Protocols serious about decentralization distribute signing authority across entities that do not share legal control or financial incentives.
### 3\. Timelock Delay on Governance Actions
A timelock is a smart contract that delays execution of approved governance proposals. If governance votes to upgrade the protocol, the timelock enforces a waiting period before the upgrade goes live. This gives users time to review the change and exit if they disagree.
Go to the protocol's governance dashboard or documentation. Look for "timelock" or "execution delay." The delay should be stated in hours or seconds.
Red flag: No timelock. Governance or multisig can execute changes instantly. You have zero exit window.
Yellow flag: Timelock under 24 hours. This may work for small protocols or those with sophisticated guardian systems, but it is too short for six-figure positions in protocols you do not monitor continuously.
Green standard: 48 to 72 hours for protocols with more than $100 million in TVL. Uniswap uses a 2-day timelock. Compound uses similar delays on critical parameter changes. That duration gives users time to notice a hostile proposal, assess its impact, and withdraw funds before execution.
Check for emergency override mechanisms. Some protocols let a guardian or multisig bypass the timelock in emergencies (e.g., to pause a contract during an active exploit). This is reasonable if the guardian is independent and if overrides are logged publicly. If the same multisig that proposes changes can also bypass the timelock, the timelock provides no protection.
### 4\. Proxy Upgrade Authority
Many DeFi protocols use proxy contracts. The address you interact with delegates all function calls to a separate implementation contract. The protocol can upgrade the implementation without changing the proxy address. This is efficient for patching bugs and adding features. It is also the most common vector for rug pulls.
On Etherscan, open the contract page for the protocol's main token or vault. Check if it is labeled "Proxy." If yes, scroll to the "Read Contract" tab (or "Read as Proxy" if available). Look for a field called "implementation" or query the storage slot at `0x360894a13ba1a3210667c828492db98dca3e2076cc3735a920a3ca505d382bbc` (the EIP-1967 standard slot for implementation addresses).
Once you have the implementation address, go back to the proxy contract page. Look for write functions labeled "upgradeTo" or "upgradeToAndCall." Click on them. Etherscan will show you which address has permission to call these functions. That address is the upgrade authority.
Red flag: The upgrade authority is a single externally owned account (EOA), especially if it is not publicly identified. If that private key is compromised or the owner turns hostile, the entire protocol can be replaced with malicious logic.
Yellow flag: The upgrade authority is a multisig, but it is the same 2-of-3 multisig that controls routine operations. This does not separate upgrade authority from operational authority.
Green standard: Upgrade authority is controlled by governance with a timelock, or by a dedicated security multisig with a higher threshold than the operational multisig. Ideally, upgrades require both a governance vote and a multisig confirmation, and the timelock applies to both.
### 5\. Governance Token Distribution
Protocols that use token-based governance are vulnerable to vote concentration. If a small number of addresses control a majority of voting power, they can pass proposals that benefit themselves at the expense of other users.
Go to Etherscan and open the governance token contract. Click "Holders." This shows the top addresses by token balance. Calculate the combined holdings of the top 10 addresses as a percentage of total supply.
If the protocol publishes governance analytics, check those instead. Some DAOs maintain dashboards on [DefiLlama](https://defillama.com/protocols/governance) or Dune Analytics showing voting power distribution, turnout, and whale participation.
Red flag: Top 3 addresses control more than 30% of voting power. This is enough to pass proposals unilaterally in most governance systems. If those addresses belong to the founding team or a single entity, you are trusting them not to vote against your interests.
Yellow flag: Top 10 addresses control more than 50%. This is common in early-stage protocols but represents a meaningful concentration risk. Research on major DAOs has shown that voting power in Compound, Uniswap, and ENS is more unequally distributed than wealth in developed economies.
Green standard: Voting power is distributed across at least 20 to 30 significant holders, with no single entity controlling more than 15%. Protocols that have conducted multiple token distributions, airdrops, and liquidity mining programs tend to have healthier distributions.
## Real Examples of Governance Failures
Beanstalk imposed a one-day timelock on governance proposals. In April 2022, an attacker used a flash loan to acquire a majority of voting power, passed a malicious proposal, and drained $182 million from the protocol. The timelock was too short for the community to organize a response.
In 2023, a user with a large governance token position in Balancer voted for fee changes that benefited their own positions but reduced returns for other liquidity providers. This was not illegal. The user followed the protocol's rules. But the incident highlighted how concentrated voting power can produce outcomes that harm minority participants.
Centralized exchanges hold governance tokens on behalf of their users. Those tokens are often used to vote in protocol governance without user knowledge or consent. If an exchange holds 10% of a protocol's supply, it can influence proposals even though the individual depositors may have conflicting preferences.
Proxy upgrade attacks are common. A token launches with clean code. Liquidity providers deposit. The owner upgrades the implementation to include a hidden transfer function. The owner calls it and moves all deposited funds to a new wallet. This has happened dozens of times. Every case involved a proxy contract with upgrade authority held by a single address or an anonymous multisig.
## Tools and Where to Find the Information
You do not need specialized software to perform these checks. The following tools are sufficient:
**Etherscan (or equivalent block explorer):** For identifying multisig signers, checking proxy upgrade authority, reading governance token holder distribution, and verifying contract code. Etherscan labels many known addresses. If an address is unlabeled, search its transaction history for clues about ownership.
**Safe UI (app.safe.global):** If the protocol uses a Safe multisig, you can view signer details, threshold, and transaction history directly in the Safe web app. Paste the multisig address into the search bar. This interface is more readable than Etherscan for multisig analysis.
**Protocol governance dashboards:** Many DAOs maintain public dashboards showing active proposals, historical votes, and voting power distribution. Compound, Uniswap, Aave, and MakerDAO all publish this data. Smaller protocols may not.
**DefiLlama governance section:** Aggregates governance token data and voting metrics across dozens of protocols. Useful for comparing governance concentration and participation rates.
**Nansen or Arkham:** Paid analytics platforms that label addresses and track fund flows. Helpful for identifying anonymous multisig signers, but not required if you are willing to do manual research.
The information exists on-chain. The question is whether you are willing to look for it.
## When This Check Matters and When It Does Not
If you are deploying four figures or less into a new protocol for experimental exposure, governance diligence may be overkill. You are buying optionality, not building a long-term position. The time cost of the audit may exceed the position size.
If you are deploying six figures, this check is mandatory. At that scale, governance risk is existential. A hostile governance action, proxy upgrade, or multisig rug can erase your entire position in minutes. No insurance will cover it. No exchange will reverse it.
If you are holding a position for months or years, governance risk compounds. Even well-intentioned protocols change. Founding teams leave. Investors push for aggressive monetization. Token holders vote to increase fees or redirect treasury funds. A governance structure that looked safe at launch may become hostile two years later. You should [re-audit governance quarterly](https://altcoininvestor.com/how-to-check-if-defi-protocol-changed-terms-2/) for any long-duration position.
For blue-chip protocols (Uniswap, Aave, Compound, MakerDAO), you can rely on existing community diligence to some degree. These protocols have been live for years, have distributed governance, and face constant public scrutiny. That does not eliminate governance risk, but it reduces it. For everything else, you do the work yourself.
## The Minimum Standard for Six-Figure Deployments
Here is the floor I will not go below for positions over $100,000:
Multisig threshold of 3-of-5 or better, with at least two signers who are publicly identified and independent of the core team.
Timelock of 48 hours minimum on all governance actions that affect user funds, contract upgrades, or fee structures.
Proxy upgrade authority controlled by governance or a security multisig with a higher threshold than the operational multisig, and subject to the same timelock.
Governance token distribution where no single entity controls more than 20% of voting power, and the top 10 holders control less than 50%.
Public documentation of all signers, timelocks, and governance processes, updated within the last six months.
If a protocol meets these criteria, it does not mean the protocol is safe. It means the governance structure gives you a realistic chance to exit before a hostile action executes. If the protocol fails any of these criteria, you are accepting governance risk as part of your return. That is a legitimate choice if you understand it and size your position accordingly.
## The Takeaway
No audit covers governance attack surface. The checklist above takes less than an hour and identifies the control points that can erase your position overnight. Before you deploy six figures into any protocol, check the multisig threshold and signer composition, verify the timelock delay on governance actions, inspect the proxy upgrade authority, and review governance token concentration. If you cannot find this information or the protocol refuses to publish it, that is the answer. Do not deploy.
## Frequently Asked Questions
### What is a safe multisig threshold for DeFi protocols?
For protocols holding over $50 million TVL or your six-figure position, a minimum 3-of-5 multisig is recommended. Avoid 1-of-2 (single point of failure) or 2-of-2 (one lost key locks funds). The threshold should prevent any single signer from acting alone while avoiding key-loss paralysis. Larger protocols should use 4-of-7 or higher, with signers who are publicly identified and operationally independent.
### How long should a governance timelock be?
48 to 72 hours for protocols with significant TVL. This gives users time to notice hostile proposals, assess impact, and withdraw before execution. Uniswap uses a 2-day timelock. Delays under 24 hours are too short for six-figure positions unless you monitor governance continuously. Timelocks under 12 hours or missing entirely are red flags. Check that emergency overrides are controlled by independent guardians, not the same multisig proposing changes.
### Where can I check who controls a protocol's upgrade authority?
Use Etherscan to inspect the proxy contract. Look for the implementation address in the Read Contract tab or query storage slot 0x360894a13ba1a3210667c828492db98dca3e2076cc3735a920a3ca505d382bbc. Then find write functions like upgradeTo or upgradeToAndCall to see which address has permission. Red flag: single EOA. Yellow flag: same 2-of-3 multisig for operations. Green: governance with timelock or dedicated security multisig.
### What governance token concentration is too risky?
If the top 3 addresses control over 30% of voting power, they can pass proposals unilaterally in most systems. Top 10 addresses controlling over 50% represents meaningful concentration risk. Check the Holders tab on Etherscan or use DefiLlama governance data. Protocols with distributed voting across 20-plus significant holders and no single entity above 15% are safer. Research shows major DAO voting power is more concentrated than wealth in developed economies.
### How often should I re-audit protocol governance?
Quarterly for long-duration six-figure positions. Governance structures change as teams leave, investors push monetization, or token holders vote for aggressive fee increases. A safe structure at launch can become hostile two years later. For blue-chip protocols with years of community scrutiny (Uniswap, Aave, Compound), you can rely more on public diligence but should still monitor major governance proposals. For newer protocols, quarterly checks are mandatory.
The Weekly Yield Report
You now have the five-query checklist for auditing multisig, timelock, and governance token concentration before six-figure deployments. Those control structures will evolve as protocols mature, and new attack vectors will emerge.
Every Thursday: where crypto yield actually is - stablecoins, liquid staking and DeFi lending, with the risk named next to the rate and what changed since last week.
[Get it free every Thursday](#/portal/signup)
Free. No trade calls, no allocations, no hype. Unsubscribe in one click.
### NFT Renting: How To Earn Income From Utility NFTs
URL: https://altcoininvestor.com/how-to-rent-out-nfts-for-income/
Last updated: 2026-09-22T16:05:50.000Z
## What NFT Renting Actually Is

NFT renting allows you to earn income from gaming assets, virtual land, or membership passes during periods when you are not actively using them. The renter gains temporary utility without purchasing the NFT outright. You receive rental fees in return.
Rental income can range from 1% to 10% of the NFT's value per month, depending on demand and utility. That rate matters only if rental demand exists for the specific NFT category.
Gaming NFTs now account for 38% of all NFT transaction volume. Gaming NFT transaction counts grew 140% year-over-year, the only sub-category showing utility-driven expansion. Persistent virtual worlds such as Decentraland and The Sandbox logged 18 million unique wallet connections in 2025, a 34% rise over 2024.
The rental market is far smaller than general NFT trading. Many older rental startups have gone quiet. The stronger options today are either ecosystem-native rental markets embedded in game and metaverse platforms or rental protocols that projects can integrate into their own apps.
## Which NFT Categories Have Demonstrated Rental Demand

If the NFT does not unlock gameplay, virtual land publishing, token-gated access, event access, or commercial rights, rental demand may be minimal or nonexistent.
### Gaming Assets
Players rent premium play-to-earn assets to access higher-level gameplay without purchasing expensive NFTs permanently. A player rents a rare NFT character in Axie Infinity to participate in tournaments. The owner earns rental fees while not actively playing.
Gaming NFTs often provide the highest rental yields, especially those with proven earning potential in play-to-earn games. The NFT gaming market is projected to grow from $7.63 billion in 2026 to $45.88 billion by 2034, exhibiting a CAGR of 25.14%.
### Virtual Land
People rent metaverse real estate short term for holding events, starting a business, advertising, and delivering virtual experiences. A brand rents virtual land in The Sandbox to host a product launch or virtual event for a limited time. Metaverse land parcels command premium rental rates due to their utility in virtual world experiences.
### Membership Passes
Brands and communities offer temporary entry to exclusive communities, digital memberships, VIP events, and premium online experiences through NFT rentals. A user rents an NFT pass to access a premium DAO community or an exclusive online event for one month.
Pure art and profile-picture NFTs lack rental viability. They do not provide measurable utility to a temporary holder.
## Collateralized vs. Collateral-Free Rental Models

NFT lending and renting come in two forms: collateralized and uncollateralized. The model determines risk, platform fees, and which NFTs qualify.
### Collateralized Rentals
In collateralized NFT lending, renters put up collateral, typically in the form of cryptocurrency or another NFT, to secure the rental. The collateral value usually exceeds the NFT's market value. If the renter does not return the NFT, the lender keeps the collateral.
Collateralized rentals are available for every project. The renter's collateral covers default risk, so no integration is required from the NFT's parent project.
One risk: if the collateral asset's value drops during the rental period, liquidation can occur. Unlike fungible tokens, NFT pricing is volatile and subjective.
### Collateral-Free Rentals
With uncollateralized NFT lending, renters are not required to provide collateral. Trust and reputation systems determine whether the renter will return the NFT. Uncollateralized setups typically involve higher interest rates since the lender takes on additional risk.
Collateral-free rental depends on project support. The game, metaverse, or gated app must recognize the rental protocol's registry. If the project does not check who currently has the use right, the renter may not gain meaningful access even if they hold the NFT in their wallet.
reNFT is strongest when the NFT's project recognizes reNFT's rental registry or integrates the protocol. Collateral-free rentals only work for supported projects.
For lenders, collateral-free rentals remove the liquidation risk present in collateralized models. For renters, they eliminate capital requirements.
## How To List Your NFT For Rent
Legitimate platforms use smart contract escrow, not manual transfers. Never rent your NFT on a platform that asks you to transfer ownership first.
### Step 1: Confirm Your NFT Has Utility Demand
Check whether your NFT belongs to a category with active rental demand. Gaming assets with in-game earning potential, metaverse land in active worlds, and membership passes to communities with ongoing events have rental viability.
Search the rental platform to see if similar NFTs from your project are listed and rented. If no comparable listings exist, demand may not support rental income.
### Step 2: Choose A Platform With Project Integration
Select a rental platform that either integrates with your NFT's parent project or operates natively within the project's ecosystem. [Chainlink's guide on NFT lending and renting](https://chain.link/education-hub/nft-lending-renting-blockchain-games) explains how project recognition determines whether renters gain actual utility.
reNFT is a leading multi-chain NFT rental protocol with collateralized and collateral-free options, scholarship automation, and whitelabel integration. The protocol works best for NFTs whose projects have integrated reNFT's rental registry.
For gaming NFTs, check whether the game offers a native scholarship or rental system. [Gaming guilds split NFT income through scholar programs](https://altcoininvestor.com/how-do-nft-gaming-guilds-make-money/), and many games now support direct rental listings.
### Step 3: Set Rental Duration And Payment Structure
Lease terms include the rental duration, payment structure, and allowed actions.
For fixed-term rentals, a simple upfront payment suffices. The renter pays the full amount at the start, and the NFT returns to your wallet automatically at the end of the term.
For open-ended or subscription-style rentals, protocols integrate token streaming using standards like Sablier or Superfluid. The renter's funds stream to you in real time. Access revokes automatically if payments stop.
### Step 4: Price Your Rental Based On Utility And Comparable Listings
Rental income rates range from 1% to 10% of the NFT's value per month. Gaming NFTs with proven earning potential command the high end of that range. Membership passes to less active communities fall at the low end.
Check comparable listings on the same platform. If similar NFTs rent for 3% monthly, pricing yours at 8% will result in no takers. If similar listings rent consistently at 5%, you have room to test 6%.
Factor in opportunity cost. While rented, you cannot sell or use your NFT yourself. The rental income must exceed what you could earn by using the NFT directly or the liquidity value of selling it.
### Step 5: List The NFT Through Smart Contract Escrow
Connect your wallet to the rental platform. Approve the smart contract to escrow your NFT. The NFT moves into the contract, not to another user's wallet.
Set your rental terms: duration, price, payment structure, and any usage restrictions the platform supports. Submit the listing.
The NFT remains in escrow until a renter accepts your terms. Once rented, the contract enforces the duration and payment terms automatically.
## Rental Duration Options And Their Trade-Offs
Fixed-term rentals lock the NFT for a set period. The renter pays upfront. You receive income predictably, but you cannot reclaim the NFT early even if market conditions change or you want to use it.
Open-ended rentals using streaming payments offer flexibility. Either party can terminate with notice. You retain the option to reclaim the NFT if its market value spikes or you need it for an event. The renter avoids paying for unused time if their plans change.
Subscription-style rentals generate recurring income as long as the renter continues paying. This works best for membership passes and metaverse land where utility is ongoing rather than event-driven.
## Platform Fee Structures And Net Income
Rental platforms charge fees on each transaction. Fees typically range from 2% to 10% of the rental payment.
reNFT charges a platform fee on completed rentals. Double Protocol operates rental pools where fees are distributed among liquidity providers. Some platforms offer insurance coverage for lenders, funded by a portion of rental fees.
Calculate net income after fees. If you list an NFT for 0.1 ETH monthly and the platform takes 5%, you receive 0.095 ETH. If gas costs to list and claim are 0.01 ETH combined, your net drops to 0.085 ETH.
On lower-value NFTs, gas and platform fees can consume a large percentage of rental income. An NFT worth 0.3 ETH renting at 3% monthly generates 0.009 ETH. After fees and gas, net income may approach zero.
## Default Risk And What Happens When A Renter Does Not Return The NFT
In collateralized rentals, the renter's collateral covers non-return. If the renter does not return the NFT, you keep the collateral. The collateral value typically exceeds the NFT's market value, so you come out ahead financially, though you lose the specific NFT.
In collateral-free rentals, the smart contract enforces return through protocol-level hooks. If the game or platform checks the rental registry, the renter loses utility access automatically when the term ends, even if they do not manually return the NFT. The NFT's utility expires, making non-return pointless.
If the project does not integrate the rental protocol, enforcement depends on reputation systems and on-chain history. Renters who default face blacklisting from future rentals. The financial and reputational cost discourages default.
One edge case: renter misuse. The renter might use your NFT for prohibited activities. Some platforms have usage rules. Read them carefully. If your NFT gets flagged or banned due to renter behavior, you bear that risk.
## Which Platforms Support NFT Renting In 2026
reNFT supports collateralized and collateral-free rentals across multiple chains. The platform integrates with games and metaverse projects through whitelabel implementations. Collateral-free rental depends on project support.
Double Protocol offers rental pools with insurance coverage. Liquidity providers deposit NFTs into pools, and renters draw from the pool. Fees and insurance are distributed among pool participants.
Renfter focuses on gaming NFTs with scholarship automation. The platform targets play-to-earn assets where guilds and individual owners list NFTs for scholars.
Ecosystem-native rental markets within games and metaverses often provide better integration than standalone platforms. The Sandbox and Decentraland support direct land rental listings. Axie Infinity and similar games offer native scholarship systems.
## Income Expectations And Realistic Yield
Gaming NFTs with proven earning potential generate the highest rental yields. An Axie Infinity team NFT that enables a player to earn $150 monthly might rent for $20 to $30 per month, representing 5% to 7% of a $400 NFT value.
Metaverse land in active worlds rents based on event demand and foot traffic. A Sandbox parcel in a high-traffic district might rent for 0.05 ETH per week during a major event, then sit vacant between events. Annualized yield is uneven.
Membership passes to active DAOs or communities rent at the low end of the range. A pass worth 0.5 ETH might rent for 0.015 ETH monthly, or 3%. If the community has infrequent events, rental demand drops further.
Pure art and PFP NFTs have no rental demand. They provide no utility to a temporary holder. [Flipping NFTs for profit](https://altcoininvestor.com/how-to-flip-nfts-for-profit-2/) remains the only income path for non-utility NFTs.
## What To Watch After You List
Track your listing's view count and rental conversion rate. If the listing receives views but no rentals, your price is likely too high or comparable NFTs offer better terms.
Monitor the floor price of your NFT collection. If the floor price drops during a rental period, you are locked in at the old rental rate while your NFT's value declines. If the floor spikes, you cannot sell until the rental term ends.
Watch whether the parent project maintains integration with the rental protocol. If the game or metaverse stops recognizing the rental registry, future renters lose utility and demand disappears.
Check whether comparable listings on the platform continue to rent. If rental activity for your NFT category dries up, the broader market for that utility has weakened.
## Common Failure Modes
Listing an NFT without confirmed utility demand results in zero rentals. The listing sits idle, and you pay gas to list and eventually delist with no income.
Pricing above comparable listings guarantees your NFT will not rent. Renters compare options and choose the best rate for equivalent utility.
Using a platform that does not integrate with the NFT's parent project means renters gain no actual utility. Even if a rental completes, the renter realizes they cannot use the NFT in-game or in-world and demands a refund or leaves negative feedback.
Renting an NFT you later need for an event or gameplay locks you out during the rental term. Fixed-term rentals do not allow early termination.
Ignoring gas and platform fees leads to net income far below gross rental payments. On lower-value NFTs, fees can exceed income.
## The Takeaway
NFT renting generates income from gaming assets, metaverse land, and membership passes with demonstrated utility demand. Rental rates range from 1% to 10% monthly, with gaming NFTs at the high end.
Collateralized rentals work for any NFT but carry liquidation risk if collateral value drops. Collateral-free rentals remove that risk but depend on project integration with the rental protocol.
List through platforms that integrate with your NFT's parent project. Price based on comparable listings and factor in gas and platform fees. Use fixed-term rentals for predictable income or streaming payments for flexibility.
Pure art and PFP NFTs lack rental demand. Focus on NFTs that unlock gameplay, land publishing, or token-gated access. Monitor floor price changes and rental activity for your NFT category to adjust pricing or exit if demand weakens.
The rental market remains small relative to NFT trading. Only utility-backed NFTs in active ecosystems generate sustained rental income. [Valuing an NFT before you buy](https://altcoininvestor.com/how-to-value-an-nft/) includes assessing whether rental income is a realistic path for that asset.
## Frequently Asked Questions
### What rental income can I realistically expect from an NFT?
Rental income ranges from 1% to 10% of the NFT's value per month, depending on utility and demand. Gaming NFTs with proven play-to-earn potential command the high end of that range, often 5% to 7% monthly. Metaverse land in active worlds generates income during events but may sit vacant between them. Membership passes to less active communities fall at the low end, around 2% to 3%. Pure art and profile-picture NFTs have no rental demand because they provide no utility to temporary holders. Gas fees and platform fees reduce net income, especially on lower-value NFTs.
### Do I need to provide collateral to rent out my NFT?
No, you do not provide collateral as the lender. The renter provides collateral in collateralized rental models, typically cryptocurrency or another NFT exceeding your NFT's value. If the renter does not return your NFT, you keep the collateral. In collateral-free rentals, the renter provides no collateral, but the rental protocol must integrate with the NFT's parent project so renters lose utility access automatically when the term ends. Collateralized rentals work for any NFT, while collateral-free rentals depend on project support and integration.
### What happens if the renter does not return my NFT?
In collateralized rentals, you keep the renter's collateral, which typically exceeds your NFT's market value. You lose the specific NFT but gain financially. In collateral-free rentals, smart contracts enforce return through protocol-level hooks. If the game or platform checks the rental registry, the renter loses utility access automatically when the term ends, making non-return pointless. If the project lacks integration, enforcement relies on reputation systems and on-chain history. Renters who default face blacklisting from future rentals. One risk: if the renter uses your NFT for prohibited activities, your NFT may get flagged or banned.
### Can I rent out profile-picture NFTs like Bored Apes?
Profile-picture and pure art NFTs have no rental demand because they provide no utility to temporary holders. Renters pay for access to gameplay, metaverse land publishing, token-gated events, or earning potential. A PFP offers none of those. Gaming NFTs, metaverse land in active worlds, and membership passes to communities with ongoing events have demonstrated rental demand. If your NFT does not unlock measurable utility, rental income is not a realistic path. Flipping remains the only income strategy for non-utility NFTs in that case.
### Which rental platforms integrate with major NFT projects?
reNFT is strongest when the NFT's project recognizes reNFT's rental registry or integrates the protocol directly. The platform supports collateralized and collateral-free rentals across multiple chains. Double Protocol offers rental pools with insurance coverage for lenders. Renfter focuses on gaming NFTs with scholarship automation. Ecosystem-native rental markets within games and metaverses often provide better integration. The Sandbox and Decentraland support direct land rental listings. Axie Infinity and similar games offer native scholarship systems. Check whether your NFT's parent project has integrated a rental protocol before listing.
The Weekly Yield Report
You just reviewed rental rates from 1% to 10% monthly across gaming NFTs, metaverse land, and membership passes. Those rates and the platforms supporting them will shift as integration coverage changes.
Every Thursday: where crypto yield actually is - stablecoins, liquid staking and DeFi lending, with the risk named next to the rate and what changed since last week.
[Get it free every Thursday](#/portal/signup)
Free. No trade calls, no allocations, no hype. Unsubscribe in one click.
### Which Exchange Suits An Income Strategy, Not A Trading One
URL: https://altcoininvestor.com/best-crypto-exchange-for-passive-income/
Last updated: 2026-09-22T15:05:30.000Z
## The Decision You Are Actually Making

You are not choosing an exchange to trade. You are choosing a venue to convert fiat into stablecoins or staking assets, then move them into yield-generating positions. The fee structure, withdrawal mechanics, stablecoin support, and custody model that matter for that workflow are not the ones optimized in typical exchange rankings.
Almost every exchange comparison is written for traders. Spreads, order types, leverage, chart tools. Someone buying $10,000 in USDC to deploy into Aave, or purchasing ETH to liquid-stake through Lido, has entirely different requirements. The usual rankings mislead them.
This article compares the venues that suit an income strategy. It examines net staking yields after fees, stablecoin support for [DeFi deployment](https://altcoininvestor.com/how-to-earn-passive-income-stablecoins-2026/), direct Layer 2 withdrawal availability, and proof-of-reserves practices. If your goal is earning yield, not trading, the leaderboard changes completely.
## Net Yield After Fees: The Gap Most Writers Miss
Coinbase charges approximately 35% commission on staking rewards. Kraken charges 30% on flexible staking products, with bonded staking commissions tiered by balance and asset. Binance offers comprehensive staking and yield products across over 300 crypto assets in its Earn suite.
The practical impact: on ETH staking, Coinbase's 35% commission shrinks a 3.0% gross yield to approximately 1.95% net. The same position through Lido incurs a 10% protocol fee, delivering approximately 2.75% net. On a $50,000 ETH position, that difference costs about $400 per year. Over a multi-year holding period, the gap compounds.
Kraken's tiered fee structure falls between Coinbase and liquid staking alternatives. For small positions, the convenience of keeping assets on-exchange may justify the fee. For larger positions, the math changes. Look at the transaction at [ethereum.org](https://ethereum.org/en/staking/) for protocol-level staking fundamentals.
Liquid staking alternatives offer better net yields and maintain flexibility. Lido holds approximately 9.17 million ETH and controls about 24% of all staked Ethereum. As of March 2026, Lido's institutional page showed an ETH staking APR of approximately 2.5%, with the protocol taking a 10% fee split between node operators and the DAO. Rocket Pool offers APR of 3.5% to 3.9%, and while the yield is slightly lower than Lido for stakers, it is more tax-efficient in many regions because rETH increases in value without generating taxable distribution events.
On Solana, Jito offers a similar model. By depositing SOL, you receive JitoSOL, which generates approximately 7.5% APY while remaining usable within the Solana DeFi ecosystem.
For most retail stakers, the practical split is simple: exchanges below approximately $5,000, liquid staking in the $5,000 to $50,000 band, and a hardware signer with direct delegation above $50,000.
## Stablecoin Support and Layer 2 Withdrawals
If your income strategy involves DeFi lending, stablecoin yield matters more than staking yield. Stablecoin supply rates on Aave currently sit between 4% and 7% APY, fluctuating based on borrowing demand. MakerDAO's savings rate pays 5% to 8%. DeFi lending holds $54 billion in deposits across 380+ protocols as of April 2026.
Ethereum mainnet fees make stablecoin transfers expensive, often $20 to $100 per transaction. Layer 2 networks like Arbitrum, Base, and Optimism reduce these costs by 90% to 99%, enabling transfers for $0.10 to $0.50\. Major stablecoins including USDC, USDT, and DAI now operate natively on these networks, processing billions in daily volume.
Binance will enable ETH withdrawals on the Arbitrum One Network Layer 2 in the near future, making it one of the first centralized exchanges with Layer 2 support. Arbitrum supports native USDT, facilitating direct deposits to major exchanges like Binance and Kraken without the risks associated with bridged tokens.
This matters for deployment speed and cost. A common misconception: users think Layer 2 withdrawals are instant. They are not. Native withdrawals from optimistic rollups (Arbitrum, Optimism, Base) take 7 days due to the challenge period, though third-party bridges like Stargate, Across, and Hop can process withdrawals in 1 to 15 minutes for a small fee (0.04% to 0.2%). Direct exchange deposits bypass this entirely.
If you are moving stablecoins from fiat on-ramp to DeFi protocol on Layer 2, the venue that supports direct L2 withdrawal saves you a mainnet gas fee (often $30 to $80) and a bridge transaction (another $5 to $15). Over repeated cycles, that cost difference becomes material.
Coinbase and Kraken do not yet offer direct Layer 2 withdrawals for most assets. Binance does, or will soon. For stablecoin-based income strategies, that is a decisive factor.
## Proof of Reserves and Counterparty Risk
Proof-of-reserves is no longer optional but a core requirement for operating in regulated markets and is becoming a mandatory element for obtaining a VASP license. Most major crypto exchanges with proof of reserves publish a Merkle tree of customer balances checked against signed wallet holdings.
In 2026, Kraken publishes proof-of-reserves via Merkle proof. Coinbase holds roughly 98% of assets in cold storage. Crypto.com carries $750 million or more in cold-storage insurance. These practices are an improvement over pre-2022 standards, but they are not solvency guarantees.
An attestation reflects conditions at a specific point in time and may not capture future liquidity or operational risks. More frequent reporting generally improves transparency. Writers should distinguish between Merkle-tree proofs (point-in-time snapshots) and full financial audits (comprehensive and ongoing).
Before August 2026, Tether's reserve disclosures came entirely from quarterly attestations performed by BDO, confirming a snapshot balance. The KPMG engagement changed that by examining Tether International's complete financial statements for the year ended December 31, 2025, under U.S. GAAP, and issuing a formal unqualified opinion.
The practical takeaway: proof of reserves is necessary but not sufficient. Investors are increasingly on the lookout for passive strategies that do not require leaving all funds on an exchange, with awareness of centralized staking risks growing. Reference the 2022 failures (FTX, Celsius, BlockFi) as evidence of counterparty risk, even with modern proof-of-reserves practices.
For income strategies, the safest path is minimizing time on exchange. Buy the asset, withdraw to self-custody or liquid staking, deploy into yield. The exchange is a bridge, not a vault.
## Regulatory Divergence and Stablecoin Delisting
Tether did not receive MiCA authorization. The result was delisting across Coinbase, Binance, Kraken, and Crypto.com in EU-regulated contexts, not from a single regulatory action but from individual exchange compliance decisions between December 2024 and March 2025.
This is a real failure mode for yield strategies using certain stablecoins. If your income strategy relies on USDT and you are subject to EU regulations, the venue you choose must support alternative stablecoins with equivalent liquidity. USDC, DAI, and other MiCA-compliant stablecoins remain available, but liquidity fragmentation creates slippage and deployment friction.
In the United States, Form 1099-DA (Digital Asset reporting) reached full implementation in January 2026, meaning exchanges now report your crypto transactions to the IRS. This affects both CeFi and DeFi strategies. For tax reporting, the venue that provides complete transaction export and cost-basis tracking saves you hours during filing.
Coinbase and Kraken both offer comprehensive tax reporting tools. Binance's reporting depends on jurisdiction. If you are managing yield positions across multiple protocols, the exchange that integrates with tax software (CoinTracker, Koinly, TokenTax) reduces manual reconciliation work.
## Who Each Option Is Right For
**Coinbase** suits someone who values regulatory clarity and ease of use over yield optimization. The 35% staking commission is steep, but the interface is simple, proof-of-reserves is public, and tax reporting is comprehensive. If you are staking less than $5,000 and prioritize convenience, Coinbase works. Above that threshold, the fee cost outweighs the convenience benefit.
**Kraken** offers a middle ground. The 30% flexible staking fee is still high, but the tiered bonded staking structure rewards larger positions. Kraken publishes proof-of-reserves via Merkle proof and maintains a strong track record on custody. For someone who wants exchange staking with better net yield than Coinbase, Kraken is the better choice. Review [Coinbase vs Kraken](https://altcoininvestor.com/coinbase-vs-kraken-for-beginners/) for a detailed comparison.
**Binance** offers the broadest stablecoin support, the widest range of staking products, and direct Layer 2 withdrawal capability. For stablecoin-based income strategies that involve DeFi deployment, Binance is the most efficient on-ramp. The trade-off: regulatory uncertainty in some jurisdictions and less transparent proof-of-reserves compared to Kraken or Coinbase.
**Liquid staking alternatives** (Lido, Rocket Pool, Jito) are not exchanges, but they are the correct comparison for anyone staking above $5,000\. Net yields are higher, assets remain in self-custody or decentralized smart contracts, and the tokens remain liquid for additional DeFi strategies. The cost: you must manage your own wallet, pay gas for deposits and withdrawals, and accept smart contract risk. If you are comfortable with self-custody, liquid staking beats exchange staking on every financial metric.
For wallet setup, review [Which Software Wallet For Earning, Not Just Holding](https://altcoininvestor.com/best-crypto-wallet-for-defi/) for DeFi-compatible options.
## The Recommendation: Match Your Workflow, Not The Brand
If you are buying stablecoins to deploy into DeFi on Layer 2, choose the exchange with direct L2 withdrawal support. Binance is currently the leader. The gas savings over repeated cycles justify the venue choice, even if you prefer Coinbase or Kraken for other reasons.
If you are staking ETH or SOL below $5,000, choose the exchange with the lowest staking commission in your jurisdiction. Kraken beats Coinbase on net yield. Above $5,000, move to liquid staking. The net yield difference compounds too fast to ignore.
If you are managing a multi-protocol income strategy with tax reporting requirements, choose the exchange with the best transaction export and cost-basis tracking. Coinbase and Kraken both deliver here. Binance lags in some jurisdictions.
If you prioritize proof-of-reserves transparency, Kraken publishes the most detailed attestations. Coinbase discloses cold-storage ratios. Binance is less transparent but operationally reliable.
The decision is not which exchange is "best." The decision is which exchange matches your income workflow. Most traders optimize for spreads and leverage. Most income earners should optimize for net yield after fees, withdrawal cost to destination chains, and regulatory reporting quality.
Look at your actual workflow. Trace the fees at each step. Choose the venue that minimizes friction between fiat on-ramp and yield deployment. The right exchange for an income strategy is the one you can exit fastest and cheapest, not the one with the best trading interface.
## The Takeaway
For positions below $5,000, exchange staking through Kraken delivers acceptable net yield with minimal self-custody complexity. Between $5,000 and $50,000, liquid staking through Lido or Rocket Pool beats every centralized venue on net yield and maintains liquidity. Above $50,000, direct validator operation or institutional staking services offer the best returns. For stablecoin income strategies targeting Layer 2 DeFi, the exchange with direct L2 withdrawal support (currently Binance) saves $30 to $80 per cycle in gas and bridge fees. The venue you choose should match your deployment destination, not your trading volume.
## Frequently Asked Questions
### Which crypto exchange offers the best net yield for staking?
Kraken offers better net staking yields than Coinbase due to lower commission rates (30% flexible, tiered bonded versus Coinbase's 35%). However, liquid staking alternatives like Lido (10% fee) and Rocket Pool deliver higher net yields than any centralized exchange. For positions above $5,000, liquid staking through decentralized protocols consistently outperforms exchange staking on net APY after fees.
### Do crypto exchanges support direct Layer 2 withdrawals for stablecoins?
Binance is currently the leading major exchange offering direct Layer 2 withdrawal support, including Arbitrum One Network ETH withdrawals. Coinbase and Kraken do not yet offer direct Layer 2 withdrawals for most assets. Direct L2 withdrawal saves users $30 to $80 per transaction in mainnet gas fees and eliminates the need for separate bridge transactions when deploying stablecoins into DeFi protocols on Layer 2 networks.
### Are proof-of-reserves audits sufficient to guarantee exchange safety?
No. Proof-of-reserves attestations reflect conditions at a specific point in time and do not capture future liquidity, operational risks, or complete financial solvency. Kraken publishes Merkle-tree proofs, Coinbase discloses cold-storage ratios, and Crypto.com carries cold-storage insurance, but these are not solvency guarantees. The 2022 failures of FTX, Celsius, and BlockFi demonstrated that even exchanges with public attestations carry counterparty risk. For income strategies, minimize time on exchange by withdrawing to self-custody or liquid staking.
### What is the cost difference between exchange staking and liquid staking?
On a $50,000 ETH position, Coinbase's 35% commission versus Lido's 10% fee costs approximately $400 per year. Coinbase delivers roughly 1.95% net yield from 3.0% gross, while Lido delivers approximately 2.75% net. Over multi-year holding periods, this gap compounds. Exchange staking has zero gas costs but higher commission rates. Liquid staking incurs deposit and withdrawal gas fees (typically $10 to $30 total on Ethereum mainnet) but delivers better net yields for positions above $5,000.
### Which exchange is best for deploying stablecoins into DeFi?
Binance is currently the best choice for stablecoin-based DeFi income strategies due to direct Layer 2 withdrawal support and broad stablecoin availability. Direct L2 withdrawal eliminates a mainnet gas fee (often $30 to $80) and a bridge transaction (another $5 to $15) per cycle. For users deploying stablecoins into Aave, Compound, or MakerDAO on Layer 2 networks like Arbitrum, Base, or Optimism, the gas savings over repeated cycles justify choosing Binance as the fiat on-ramp, even if other exchanges offer better staking yields.
The Weekly Yield Report
You just compared net yields, Layer 2 withdrawal costs, and proof-of-reserves practices across four venues. Those numbers will be different next month, and the exchange adding L2 support first wins the next wave.
Every Thursday: where crypto yield actually is - stablecoins, liquid staking and DeFi lending, with the risk named next to the rate and what changed since last week.
[Get it free every Thursday](#/portal/signup)
Free. No trade calls, no allocations, no hype. Unsubscribe in one click.
### Kaspa Surges 44.8% in 30 Days on Altcoin Rotation and Upgrade
URL: https://altcoininvestor.com/kaspa-44-percent-rally-altcoin-rotation-toccata-upgrade/
Last updated: 2026-09-22T14:02:40.000Z
## The Move and the Magnitude

Kaspa (KAS) gained 44.8% over 30 days to reach $0.04190313 on September 22, 2026, according to CoinGecko. The move accelerated in early September, with the token adding 23.0% over seven days while posting a modest 0.4% gain in the preceding 24 hours. At a market capitalization of $1.16 billion, KAS ranked 75th among all cryptocurrencies, though the token remained 79.8% below its all-time high of $0.207411 set on July 31, 2024.
The rally followed a period of sustained weakness. As of September 4, 2026, Kaspa had traded at $0.03 after moving between $0.025036 and $0.031826 during the previous 30 days, per StealthEX data. The advance from those lows reflected capital rotation into higher-risk altcoins and renewed attention to a June network upgrade that had received limited immediate price response.
## What Drove the Rally

The primary catalyst was a broader shift into altcoins during September. [Capital rotation patterns](https://altcoininvestor.com/crypto-narrative-investing-altcoin-cycles/) that favor higher-beta tokens gained strength as CoinMarketCap's Altcoin Season Index nearly doubled to 43 during the month, per KuCoin and AMBCrypto reporting on September 8, 2026\. At that reading, the rotation remained in early stages, but it provided enough momentum for KAS to break above resistance levels it had tested repeatedly since January.
A secondary driver was the narrative around institutional custody infrastructure. Standard Chartered announced on May 18, 2026, that its non-binding offer to acquire Zodia Custody had been accepted by shareholders and noteholders, subject to regulatory approval. Zodia Custody had supported KAS custody since November 2024, according to reporting from BingX on September 8, 2026\. The acquisition did not represent a new listing or integration, but it renewed discussion of institutional access pathways at a time when KAS was already climbing. The rally preceded the acquisition announcement by several months, which means the custody development reinforced an existing move rather than initiating it.
The foundational technical event was the Toccata hard fork, which activated on June 30, 2026, per CoinMarketCap. The upgrade introduced native smart contracts, KRC-20 token support, and zero-knowledge proof verification, transforming Kaspa from a high-speed payment network into a programmable Layer 1 blockchain. Despite the significance of the upgrade, price action remained muted for weeks afterward. On-chain data showed growing covenant and Layer 2 activity by August 20, 2026, according to CoinMarketCap's latest updates, but utilization remained low relative to capacity.
September's price move reflected market positioning and thin liquidity more than sudden adoption. [Upgrade-driven rallies](https://altcoininvestor.com/avalanche-rally-schwab-listing-helicon-upgrade/) in other Layer 1 tokens had often begun weeks or months before the technical event. Kaspa's pattern inverted that sequence. The upgrade arrived in June, but the price rally did not accelerate until early September when broader market conditions shifted.
## The Risk in Fast Moves
A 44.8% gain over 30 days signals crowded positioning and elevated liquidation risk. KAS trading volume surged 363% over 24 hours to $52.02 million on September 8, 2026, per KuCoin. That spike in participation arrived as the token approached resistance between $0.0357 and $0.0385, levels that had rejected multiple breakout attempts since March. The combination of thin orderbook liquidity and momentum-driven buying creates conditions where reversals can unfold as quickly as the rally itself.
For the move to hold, KAS would need to sustain activity above $0.04 while on-chain utilization of the Toccata upgrade continues to grow. Developer adoption of smart contract features, expanding KRC-20 token issuance, and measurable growth in decentralized finance applications would provide evidence that the technical foundation supports a higher valuation. Without those signals, the September rally remains a beta play on broader altcoin rotation rather than a Kaspa-specific re-rating.
What would break the move is a reversal in risk appetite across crypto markets or failure to reclaim and hold technical levels. A hotter-than-expected macroeconomic data release could pressure risk assets and interrupt the breakout, as noted by KuCoin ahead of the September 11, 2026, U.S. Consumer Price Index report. A rejection at the $0.0357 to $0.0385 resistance cluster would leave KAS vulnerable to a retest of August lows near $0.025.
The whale activity adds another layer of fragility. A prominent holder known as "Entity X" moved 3.1 million KAS worth approximately $124,000 to Bitvavo exchange on September 15, 2026, breaking a long accumulation streak, per CoinMarketCap. On-chain analysis showed the wallet held an unrealized loss of $80.84 million on its total investment. Large holder distributions into strength often precede sharp corrections, particularly when retail participation is rising and orderbook depth remains shallow.
## What This Does Not Mean for Income Positioning
Kaspa operates as a proof-of-work network with no native staking, lending, or yield infrastructure. The token does not generate income from holding it. Mining is the only direct participation mechanism, and that requires specialized hardware and electricity cost management. For someone evaluating [income-generating crypto positions](https://altcoininvestor.com/near-protocol-doubles-privacy-ai-staking/), KAS offers no comparable feature set.
The Toccata upgrade introduced the technical foundation for decentralized finance applications, but those systems are not yet operational at meaningful scale. On-chain data as of August 20, 2026, showed growing covenant and Layer 2 activity, but no established lending protocols, liquidity mining programs, or staking derivatives had launched. Until those platforms go live and demonstrate sustainable usage, KAS remains a speculative position on future utility rather than a present income stream.
The September rally does not change that calculation. A 44.8% price move reflects market sentiment and positioning, not a shift in the token's fundamental income characteristics. Investors who hold crypto for yield, staking rewards, or liquidity provision fees would find no new opportunity in KAS despite the price action. The upgrade created potential, but potential does not pay until it converts into active, revenue-generating protocols.
Even if DeFi applications launch on Kaspa in the coming months, the risk-reward profile for income investors would depend on protocol security, total value locked, and fee structures. Early-stage DeFi platforms carry elevated smart contract risk, and Kaspa's covenant system is untested at scale. The first movers into those platforms would be testing unaudited code on a newly programmable network, a risk profile that differs sharply from established staking on Ethereum or [yield farming on Solana](https://altcoininvestor.com/solana-surge-sec-exemption-network-upgrade/).
For holders evaluating whether the 44.8% rally changes anything about KAS as an income asset, the answer is no. The move was driven by altcoin rotation and speculative positioning around an upgrade that has not yet translated into functional, income-generating applications. The token remains a directional bet on adoption of its smart contract features, not a position that generates cash flow today.
## The Structural Context
Kaspa's annual issuance runs at approximately 2.485% of circulating supply, with the network issuing 2.18267645 KAS per block at a target of ten blocks per second, per Phemex analysis published on September 12, 2026\. The node API reported 27,695,891,853 KAS circulating against a maximum of 28,704,035,605 as of that date, leaving 1,008,143,752 coins unmined, or 3.512% of the cap. That supply schedule means miner sell pressure is declining as the network approaches full emission, a dynamic that can support price during periods of strong demand but does not eliminate dilution risk in the near term.
The token's historical volatility remains extreme. From its July 31, 2024, all-time high of $0.207411 to the September 4, 2026, price of $0.03, KAS lost approximately 85.5% of its value. The 44.8% rally over 30 days retraced only a small portion of that decline. Long-term holders who accumulated near the peak remain deeply underwater, and the September move does not change that structural overhang.
Kaspa's BlockDAG architecture enables parallel block production and near-instant transaction confirmation, distinguishing it from traditional single-chain blockchains. The Crescendo upgrade in May 2025 increased block production from 1 to 10 per second, and developers have discussed longer-term targets of 25 to 40 blocks per second by Q3 2026, with 100 blocks per second in sight for 2027, per community discussions. Those scalability milestones position KAS as a high-throughput network, but throughput alone does not drive sustainable demand without applications that utilize it.
The token is not listed on Binance as of September 2026, despite ongoing community speculation and petition campaigns, according to Bitget reporting. The absence of a Binance listing limits liquidity and retail access compared to tokens with tier-one exchange support. KAS maintains active trading on Bitget, Coinbase, Kraken, and several regional exchanges, with daily trading volumes exceeding $150 million across all platforms in 2026, per Bitget. A future Binance listing could provide a demand shock, but that remains speculative and outside the control of current holders.
For someone deciding whether the September rally changes their view of Kaspa, the relevant question is whether on-chain utilization is growing at a pace that justifies the price move. The answer as of late September 2026 is that usage is expanding but remains in early stages. The rally reflects anticipation of future adoption, not realized demand today.
The Weekly Yield Report
You now know the three drivers behind Kaspa's 44.8% rally and why the upgrade came months before the price move. That sequence will repeat with different tokens and different catalysts.
Every Thursday: where crypto yield actually is - stablecoins, liquid staking and DeFi lending, with the risk named next to the rate and what changed since last week.
[Get it free every Thursday](#/portal/signup)
Free. No trade calls, no allocations, no hype. Unsubscribe in one click.
### ECB Pontes Platform: What Tokenized Wholesale Settlement Means
URL: https://altcoininvestor.com/ecb-pontes-tokenized-settlement-platform/
Last updated: 2026-09-25T18:00:06.000Z
The European Central Bank launched Pontes on Monday, a wholesale settlement platform that connects distributed ledger technology to central bank payment rails. The platform enables banks to settle tokenized asset transactions using central bank money rather than commercial bank deposits.
This is separate from the retail digital euro pilot planned for 2027\. Pontes is live now, operational, for wholesale banking operations. The ECB also announced it will invest directly in tokenized securities.
That's the announcement. Here's what the on-chain data structure means for readers tracking income opportunities in tokenized assets.
## What Pontes Actually Does

Pontes connects DLT market infrastructure to the ECB's TARGET2 payment system. That means banks can settle tokenized asset transactions in central bank money without converting back to traditional payment rails at the final settlement layer.
Previously, tokenized securities trading on distributed ledgers required conversion to legacy payment systems for final settlement. That introduced counterparty risk. Commercial bank money, even in the eurozone, is not risk-free. If the settling bank has issues, the trade settlement has issues.
Central bank money eliminates that. When you settle in ECB money, the counterparty risk is the European Central Bank. That's a different risk profile than commercial bank deposits.
The platform is designed for wholesale use. That means institutional participants: banks, broker-dealers, asset managers. Not retail investors directly. But retail investors access tokenized assets through these institutions, so the infrastructure upgrade matters downstream.
## Why Central Bank Money Matters for Tokenized Asset Yields

Settlement risk reduces yields. When institutional participants price tokenized assets, they factor in settlement counterparty risk. Higher settlement risk means wider spreads and lower net yields for the end holder.
Central bank settlement removes that layer. That should compress spreads on tokenized fixed-income products, tokenized money market funds, and tokenized repo transactions settled through Pontes.
We're talking about basis points, not percentage points. But in institutional fixed-income, basis points compound. A tokenized money market fund yielding 3.2% instead of 3.15% because of tighter settlement spreads is a measurable income difference over time.
The ECB's announcement that it will invest directly in tokenized securities is the other signal. Central banks don't typically invest in infrastructure they consider experimental. When the ECB puts its own treasury allocation into tokenized products, that's validation. It tells the market the settlement infrastructure is production-grade.
That validation matters for [DeFi protocols](https://altcoininvestor.com/best-defi-protocols/) building bridges between tokenized real-world assets and on-chain yield strategies. If European banks can settle tokenized bonds in central bank money, those bonds become more attractive collateral for DeFi lending protocols. Better collateral means deeper liquidity, which means tighter spreads for borrowers and more competitive yields for lenders.
## The Separation Between Wholesale and Retail Matters

Pontes is not a retail product. The retail digital euro pilot isn't scheduled until 2027, and even that's a pilot, not a launch.
This separation is deliberate. The ECB is rolling out tokenized settlement infrastructure in stages. Wholesale first, retail later. That sequencing tells you where the institutional focus is: settling large-value tokenized securities transactions between banks.
For readers tracking income opportunities, the sequencing matters because wholesale infrastructure typically precedes retail access by 12 to 24 months. Once banks can settle tokenized bonds, equities, and fund shares in central bank money, the next step is packaging those products for retail distribution.
That's when tokenized asset yields become accessible through brokerage accounts, wealth management platforms, and eventually DeFi front-ends that integrate with traditional finance rails.
We're not there yet. But Pontes going live this week is the wholesale layer. The retail access layer follows, not immediately, but predictably.
## What This Means for Altcoins in the Tokenization Stack
Tokenization infrastructure relies on specific blockchain protocols. Ethereum, Polygon, Avalanche, and other smart contract platforms compete to host tokenized real-world asset issuance.
The ECB didn't specify which DLT platforms Pontes connects to. That information will emerge as banks begin settling transactions through the platform. Watch for announcements from European banks disclosing which blockchain networks they're using for tokenized asset issuance that settles via Pontes.
The protocols that capture European institutional tokenized asset settlement will see transaction volume, fee revenue, and validator income increase. That's a direct income path for stakers and liquidity providers on those networks.
The pattern is already visible with other institutional tokenization initiatives. When Franklin Templeton launched its tokenized money market fund on Polygon, Polygon validators saw increased transaction fee revenue. When Siemens issued tokenized bonds on Polygon, same pattern.
Pontes scales that pattern to the entire European banking system's wholesale settlement layer. The protocols that win European bank adoption will see sustained institutional transaction flow, which translates to sustained fee income for network participants.
## How to Track This On-Chain
You can monitor which blockchain networks are capturing European tokenized asset settlement by watching for specific on-chain patterns:
- **Smart contract deployments from European banks:** Look for contract deployer addresses associated with known European financial institutions. Etherscan and Polygonscan show deployer addresses. Cross-reference those with institutional entity tags on Arkham or Nansen.
- **Stablecoin bridge activity from European fiat on-ramps:** Tokenized euro settlement will require euro-backed stablecoins or wrapped central bank digital currency. Watch for increased euro stablecoin minting and bridging to specific Layer 1 or Layer 2 networks.
- **Transaction volume spikes on known institutional custody addresses:** European banks use specific custody providers for digital asset settlement. Monitor the on-chain activity of those custody wallets. Increased outbound transaction frequency to tokenized asset smart contracts signals active settlement.
- **Oracle data feeds for tokenized securities:** Tokenized bonds and equities require price oracles. Watch Chainlink, API3, and other oracle networks for new data feeds tied to European securities identifiers (ISINs).
This data won't appear immediately. Institutional adoption timelines run on quarters, not days. But the on-chain footprint of European wholesale tokenized asset settlement will be visible, traceable, and quantifiable once banks begin routing transactions through Pontes.
For tracking purposes, [Cointelegraph's coverage](https://cointelegraph.com/news/what-happened-in-crypto-today) provides ongoing updates on institutional blockchain adoption. That's your starting point for names and dates. Then verify on-chain.
## The Takeaway
The ECB's Pontes platform is live for wholesale tokenized asset settlement in central bank money. This removes a settlement risk layer that previously compressed yields on tokenized fixed-income products. The protocols that capture European bank adoption will see increased transaction fee revenue, which flows to validators and liquidity providers.
The retail access layer follows wholesale infrastructure by 12 to 24 months historically. That's the window. Watch for European banks disclosing which blockchain networks they're using for Pontes settlement. Those networks are where the institutional transaction flow and the corresponding validator income will concentrate.
The on-chain data will show you which protocols won the institutional adoption race before the retail products launch. You can verify all of this yourself. The transactions, the contract deployments, the custody wallet activity will all be on-chain. You just have to look.
## Frequently Asked Questions
### What is the ECB Pontes platform?
Pontes is a wholesale settlement platform launched by the European Central Bank that connects distributed ledger technology to the ECB's TARGET2 payment system. It enables banks to settle tokenized asset transactions using central bank money rather than commercial bank deposits, eliminating settlement counterparty risk for institutional participants trading tokenized securities.
### How does Pontes affect yields on tokenized assets?
By enabling settlement in central bank money instead of commercial bank deposits, Pontes removes a layer of counterparty risk that institutional participants previously priced into tokenized asset spreads. This should compress spreads on tokenized fixed-income products, money market funds, and repo transactions, resulting in slightly higher net yields for investors holding these instruments.
### Can retail investors use the Pontes platform directly?
No. Pontes is designed exclusively for wholesale banking operations between institutional participants like banks, broker-dealers, and asset managers. Retail investors will access tokenized assets settled through Pontes indirectly, through brokerage accounts and wealth management platforms that integrate with this institutional infrastructure. The retail digital euro pilot isn't scheduled until 2027.
### Which blockchain networks does Pontes use for settlement?
The ECB has not publicly specified which DLT platforms Pontes connects to. This information will emerge as European banks begin settling tokenized asset transactions through the platform. Watch for announcements from European financial institutions disclosing which blockchain networks they're using for tokenized securities that settle via Pontes.
### How can I track which protocols benefit from Pontes adoption?
Monitor on-chain activity for smart contract deployments from European banks, euro stablecoin minting and bridging patterns, transaction volume on institutional custody addresses, and new oracle data feeds for European securities. Use blockchain explorers like Etherscan and Polygonscan, combined with entity tagging on Arkham or Nansen, to identify which protocols are capturing European institutional tokenized asset settlement flow.
The Weekly Yield Report
You just traced the ECB's wholesale tokenization infrastructure to specific on-chain monitoring strategies. The settlement patterns will shift as European banks deploy across competing protocols.
Every Thursday: where crypto yield actually is - stablecoins, liquid staking and DeFi lending, with the risk named next to the rate and what changed since last week.
[Get it free every Thursday](#/portal/signup)
Free. No trade calls, no allocations, no hype. Unsubscribe in one click.
_Truncated after 5 MiB. Use `/sitemap.xml` for the complete archive of public content._