
If you have heard terms thrown around in the crypto space like head and shoulders, rising wedge, or bullish flag and are not sure what they all mean, this article (and downloadable PDF) will help you out.
In this article, I cover the top 20 most common chart patterns and what they mean. There is even a PDF downloadable cheat sheet included - at the bottom of this post!
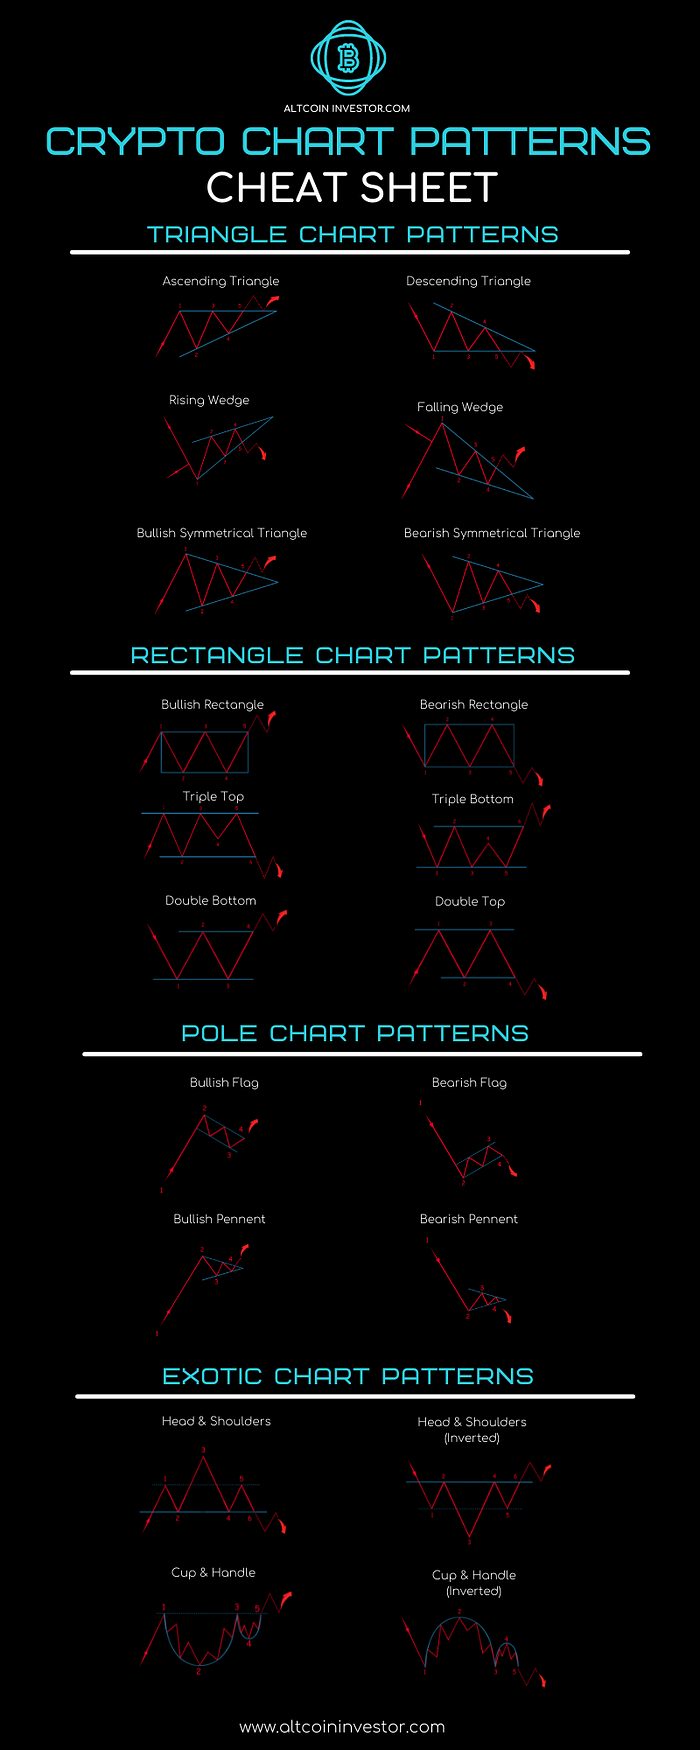
Top 20 Crypto Chart Patterns
Although 20 patterns may sound like a lot, it’s only 10 different patterns (as the others are inverted).
These twenty trading patterns are categorized into four groupings:
Triangle Chart Patterns (6)
Rectangle Chart Patterns (6)
Pole Chart Patterns (4)
Exotic Chart Patterns (4)
Join the Crypto Revolution:
As one of the fastest-growing industries in the world, cryptocurrency is constantly changing and developing. Our newsletter provides you with the latest news, trends, and insights that you need to stay informed and make informed decisions.
What are Chart Patterns?
A chart pattern is a shape within a price chart that suggests the next price move, based on past moves. Chart patterns are the basis of technical analysis and help traders determine the probable future price direction.
Reading chart patterns have been around for as long as trading has existed and predates the cryptocurrency market.
The patterns described and illustrated in this article are not new. They have been borrowed from the technical analysis, going back to the early 1900s, and are similar patterns and terms commonly used in both the stock and Forex markets today.
There is seldom something more useful whether you are just starting with your trading journey or you are an already established trader. Utilizing chart patterns cheat sheets will enhance your trading strategy and increase your chances of strengthening your portfolio.
Why are Crypto Chart Patterns Important?
Crypto chart patterns are important for investors because they provide valuable insights into the price movement and potential future trends of cryptocurrencies.
Here are a few reasons why crypto chart patterns are significant:
- Technical Analysis: Chart patterns are a fundamental aspect of technical analysis, which is widely used by traders and investors to make decisions based on historical price data. By studying chart patterns, investors can identify trends, support and resistance levels, and potential price reversals, among other things. This analysis helps them understand the current market sentiment and make informed trading decisions.
- Predicting Price Movements: Chart patterns can offer clues about the potential direction of a cryptocurrency's price. Patterns such as triangles, head and shoulders, double tops/bottoms, and flags can indicate a continuation or reversal of an ongoing trend. Investors who can accurately interpret these patterns may gain an edge in predicting price movements and adjust their investment strategies accordingly.
- Entry and Exit Points: Chart patterns help investors determine optimal entry and exit points for their trades. For example, a breakout from a consolidation pattern may signal a good entry point to buy a cryptocurrency, while a breakdown from a bearish pattern may indicate a suitable time to sell or short it. Understanding chart patterns allows investors to time their trades more effectively, potentially maximizing their profits and minimizing risks.
- Risk Management: Crypto chart patterns also assist investors in managing their risk exposure. By identifying key support and resistance levels, investors can set stop-loss orders and take-profit targets more effectively. This allows them to define their risk-reward ratios and establish a disciplined approach to managing their investments.
- Psychological Factors: Chart patterns are not purely mathematical; they also reflect market psychology and sentiment. As certain patterns emerge, investors' reactions to them can create self-fulfilling prophecies, causing price movements to align with the pattern's implications. By recognizing and understanding these psychological factors, investors can take advantage of market behavior and make more informed decisions.
It's important to note that while chart patterns provide valuable information, they are not foolproof indicators of future price movements. Other factors, such as fundamental analysis and the latest crypto market news, should also be considered when making investment decisions.
Why Should You Learn Crypto Chart Patterns?
Chart patterns are one of the key tools used by investors and traders to predict future price movements based on past behavior. They are essential in technical analysis, a method that tries to forecast the future price movements of cryptocurrencies based on historical data.
Here are some reasons you may want to learn chart patterns:
- Price prediction: Chart patterns can indicate potential price movements. For example, if a specific pattern frequently leads to an upward trend, spotting this pattern early can provide an opportunity to buy before the price increases.
- Risk Management: Recognizing chart patterns can also aid in risk management. For instance, some patterns may suggest a significant price drop is coming, giving an investor the chance to sell off and avoid losses.
- Strategy Development: Understanding chart patterns can assist in formulating investment strategies. An investor may use certain patterns to determine when to enter or exit trades, set stop losses, or identify potential profit targets.
- Understanding Market Sentiment: Chart patterns can also give insights into market psychology. Certain patterns may indicate bullish or bearish sentiment among other investors, which can help an individual investor decide on their own strategy.
- Greater Autonomy: Understanding chart patterns allows investors to make informed decisions independently. Instead of relying on advice from others, they can analyze the market themselves and make their own judgments.
- Real-time Application: Cryptocurrency markets operate 24/7, unlike traditional markets. This makes the ability to interpret chart patterns and react quickly extremely valuable in the fast-paced crypto environment.
However, it's important to note that while chart patterns can be a useful tool, they aren't a guarantee. There are many factors that influence the price of cryptocurrencies, and technical analysis should be used in conjunction with other methods, like fundamental analysis, to make informed decisions.
Forex Signals Vs. Crypto Signals?
Forex signals, as the name suggests, are primarily associated with the forex market. However, similar concepts have emerged in the cryptocurrency market to provide trading signals specifically for cryptocurrencies. These are often referred to as crypto signals or cryptocurrency signals.
Triangle Chart Patterns
Ascending & Descending Triangle, Bullish & Bearish Symmetrical Triangle, Rising & Falling Wedge
TRIANGLE CHART PATTERNS (6)
There are six patterns that fall into triangle patterns. Half of these patterns are their inverted counterparts.
Ascending Triangle
This is a bullish indicator and indicates the continuation of an upward trend. The ascending triangle is a very common pattern seen in bullish markets.
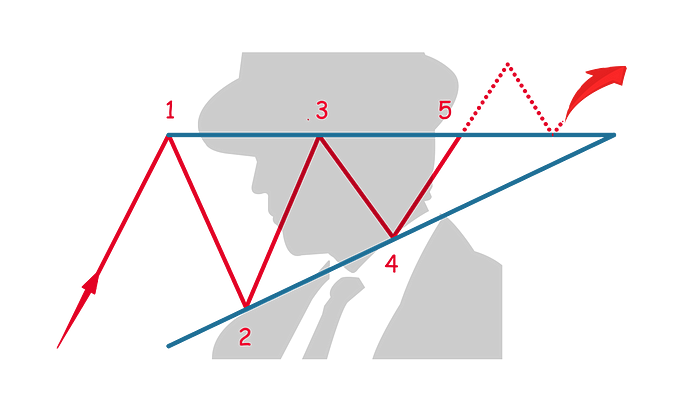
In an uptrend, the first resistance is found (1) and the price reverses until it finds its first support (2). Price reverses direction and continues its upward movement until the second resistance is found (3) which is near or level to the first resistance level and also forms the horizontal line in this pattern.
The price reverses direction and finds its support slightly higher than before (4).
The pattern completes when the price breaks through the initial resistance level as set out in this pattern (5).
Descending Triangle
This is a bearish indicator and indicates the continuation of the downward trend. It is also the inverse of an ascending triangle.
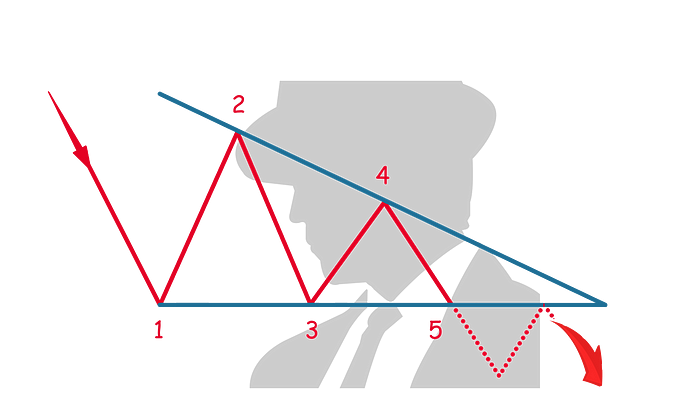
In a downtrend, the first resistance is encountered (1) setting the horizontal resistance for the rest of the pattern. The price reverses direction and finds its first support (2) which will be the highest point in this pattern.
The price reverses and finds its second support (3) at a similar level to the first resistance (1). The price again reverses and finds its resistance at a lower level than before (4), forming the descending angle of the triangle.
The pattern completes when the price reverses again and breaks below (5) the established horizontal line in this pattern.
Bullish Symmetrical Triangle
As the name suggests, this is a bullish indicator and indicates the continuation of the upward trend. The bullish asymmetrical triangle is a common pattern seen in bullish markets.

In an uptrend, the price finds the first resistance (1) which will be the highest price in the pattern. The price reverses and finds its first support (2) which will be the lowest point in this pattern. The price reverses from the first support (2) and finds the second resistance (3) which is lower than the first resistance. These two resistance points create the downward angle of the symmetrical triangle.
The second support level (4) is higher than the first support (2) and forms the upward angle of the symmetrical triangle.
The pattern completes when the price reverses direction from the second support (4) and breaks the triangle's upper line (5).
Bearish Symmetrical Triangle
As the name suggests, this pattern is bearish and indicates the continuation of the downward trend. The bearish symmetrical triangle is a common pattern seen in bearish markets.
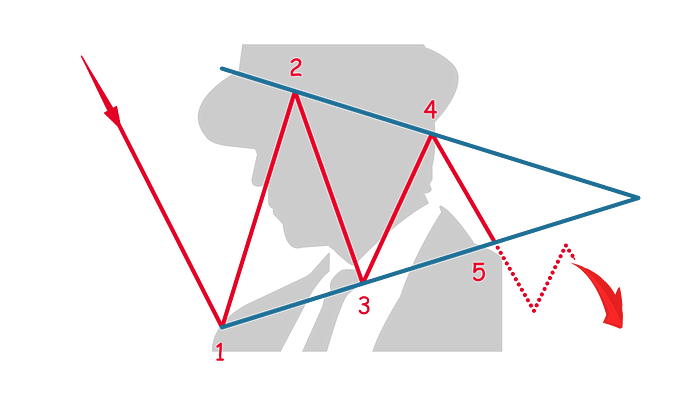
In a downtrend, the price finds its first support (1) which is the lowest price in this pattern. The price reverses and finds its first resistance (2), which is the highest point in this pattern.
The second support (3) is higher than the first support (1) and creates the upward angle of this pattern. The price reverses direction and the second resistance (4) is lower than the first resistance (2) creating the downward angle of this pattern.
The pattern completes when the price reverses past the bottom angle of the pattern (5) and anticipates a lower low and bearish trend.
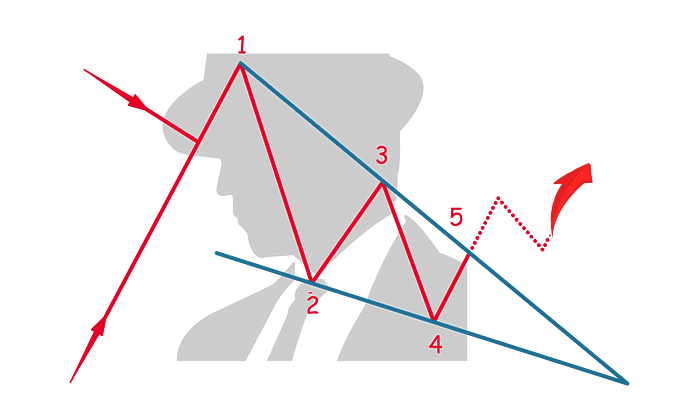
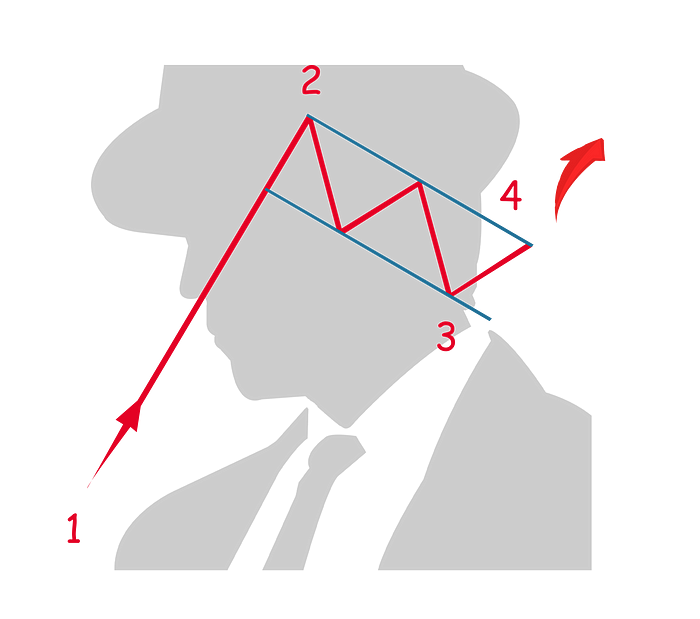
Rising Wedge
The rising wedge is a bearish indicator and can be found in either an uptrend or a downtrend. It is not a common pattern.

In either an uptrend or downtrend, the first point in this pattern (1) forms the first support level and also the lowest point in the pattern. As the price reverses, the first resistance level (2) is set and is also the lowest resistance level in the pattern.
As the price reverses, the second support (3) is found and the first (1) and the second support (3) form the bottom angle of the rising wedge.
The price reverses and the second resistance level (4) is at a point higher than the first resistance level (2).
The pattern completes when the price reverses (4) and breaks through the bottom of the rising wedge (5).
Falling Wedge
The falling wedge is a bullish indicator that can be found in either an uptrend or a downtrend. The falling wedge is not a very common pattern. The falling wedge is also the inverse of the rising wedge.
This chart pattern can be formed after either an uptrend or a downtrend where the first resistance (1) marks the highest point in this pattern. The price reverses, finding the first support (2) which is also the highest support level in this pattern.
The price reverses, moving upward until hitting the second resistance level (3) which is lower than the first resistance point (1). These two points also mark the top angle of the falling wedge.
The price reverses finding the second support (4) which is also lower than the first support level (2), marking the bottom angle of the falling wedge.
The pattern completes when the third resistance level (5) breaks through the upper angle of the falling wedge.
Rectangle Chart Patterns
Bullish & Bearish Rectangle, Double Top & Bottom, Triple Top & Bottom
RECTANGLE CHART PATTERNS (6)
There are six patterns that fall into the rectangle chart pattern. Half of these patterns are their inverted counterparts.
Bullish Rectangle
The bullish rectangle is a common pattern that indicates the continuation of a uptrend.
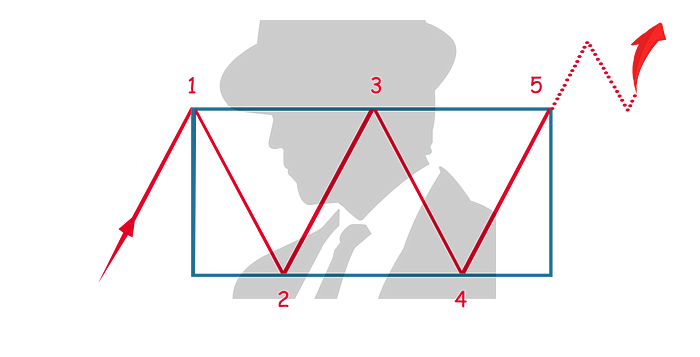
In an uptrend, the price finds its first resistance (1) which will form the basis for a horizontal line which will be the resistance level for the rest of the pattern.
As the price reverses, it finds its first support (2) which will also form the basis for a horizontal line that will be the support level for the rest of the pattern.
As the price moves upward from its first support (2), it finds the second resistance level (3) which is at the same or similar level as the first resistance.
The price reverses direction moving downward and finds support (4) at the same or similar level as the first support.
The pattern completes when the price reverses its direction, moving upward and breaking the upper border of the pattern (5).
Bearish Rectangle
The bearish rectangle is a very common pattern that indicates the continuation of a downtrend. It is also the inverse of the bullish rectangle.
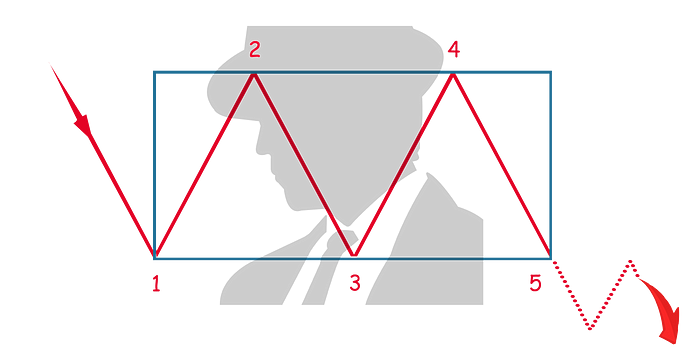
In a downtrend, the price finds its first support (1) which will form the basis for a horizontal line that will be the support level for the rest of the pattern.
As the price reverses, it finds its first resistance (2) which will also form the basis for a horizontal line that will be the resistance level for the rest of the pattern.
The price reverses, moving downward until it finds the second support level (3) which is at the same or similar level of support as the first (1).
The price reverses direction, moving upward until it finds the second level of resistance (4) which is at the same or similar level of resistance as the first (2).
The pattern completes when the price reverses direction, moving downward until it breaks the lower border of the pattern (5).
Double Top
A double top is a very common pattern and indicates a reversal in price direction.
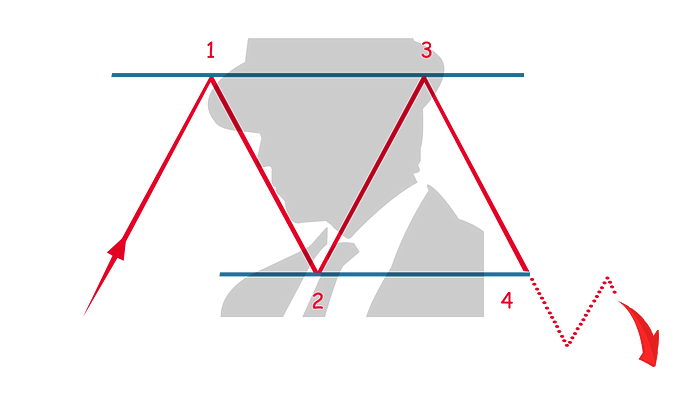
In an uptrend, the price finds its first resistance (1) which will form the basis for a horizontal line that will be the resistance level for the rest of the pattern.
As the price reverses, it finds its first support (3) which will also form the basis for a horizontal line that will be the support level for the rest of the pattern.
As the price reverses and moves upward, it finds the second resistance (3), which is at the same similar resistance as the first resistance (1).
The pattern completes when the price reverses direction, moving downward until it breaks the support level set out in the pattern (4).
Double Bottom
A double top is a very common pattern and indicates a reversal in price direction. It is also the inverse of the double top.

In a downtrend, the price finds its first resistance (1) which will form the basis for a horizontal line that will be the support level for the rest of the pattern.
As the price reverses, it finds its first resistance (2) which will also form the basis for a horizontal line that will be the resistance level for the rest of the pattern.
As the price reverses and moves downward, it finds the second support (3), which is at the same similar support level as the first support (1).
The pattern completes when the price reverses direction, moving upward until it breaks the resistance level set out in the pattern (4).
Triple Top
A triple top is a bearish indicator and a less common pattern. It indicates a reversal in price direction.
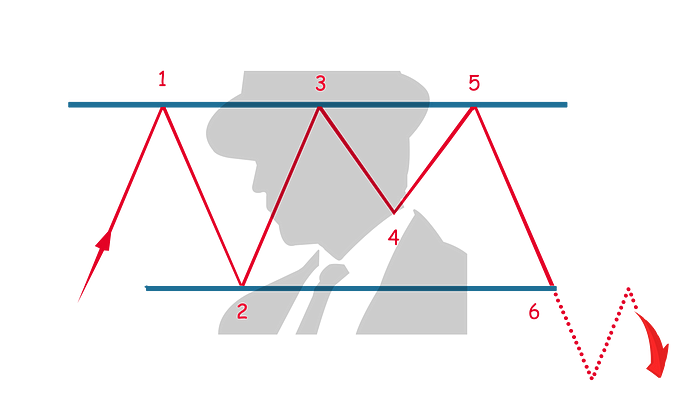
In an uptrend, the price finds its first resistance (1) which will form the basis for a horizontal line that will be the resistance level for the rest of the pattern.
As the price reverses, it finds its first support (2) which will also form the basis for a horizontal line that will be the support level for the rest of the pattern.
As the price reverses and moves upward, it finds the second resistance (3), which is at the same resistance level as the first resistance (1).
As the price reverses and moves downward, it finds the second support (4), which can be higher or lower than the first support (2).
The price movement reverses and moves upward until it hits the resistance level (5) which is at the same similar resistance level as the first resistance (1).
The pattern completes when the price reverses direction, moving downward until it breaks the support level set out in the pattern (6).
Triple Bottom
A triple bottom is a bullish indicator and a less common pattern. It indicates a reversal in price direction. It is also the inverse of a triple top.
In a downtrend, the price finds its first support (1) which will form the basis for a horizontal line that will be the support level for the rest of the pattern.
As the price reverses, it finds its first resistance (2) which will also form the basis for a horizontal line that will be the resistance level for the rest of the pattern.
As the price reverses and moves downward, it finds the second support (3), which is at the same similar support level as the first support (1).
As the price reverses and moves downward, it finds the second resistance (4), which can be higher or lower than the first resistance (2).
The price movement reverses and moves upward until it hits the support level (5) which is at the same similar support level as the first support (1).
The pattern completes when the price reverses direction, moving upward until it breaks the resistance level set out in the pattern (6).
Pole Chart Patterns
Bullish Flag, Bearish Flag, Bullish Pennant, Bearish Pennant
POLE CHART PATTERNS (4)
There are four patterns that fall under this category. Half of these patterns are their inverted counterparts.
Bullish Flag
A bullish flag, as the name suggests is a bullish indicator and a very common pattern.
In a sharp and prolonged uptrend, the price finds its first resistance (2) which will form the flag’s pole of this pattern.
As the price reverses, in short increments of price reversal, the flag-like formation of the pattern will appear. This is identified by lower highs and lower lows until support is finally found (3).
The pattern completes when the price reverses direction, moving upward until it breaks out of the flag-like pattern (4).
Bearish Flag
A bearish flag, as the name suggests is a bearish indicator and a very common pattern. It is also the inverse of the bullish flag.
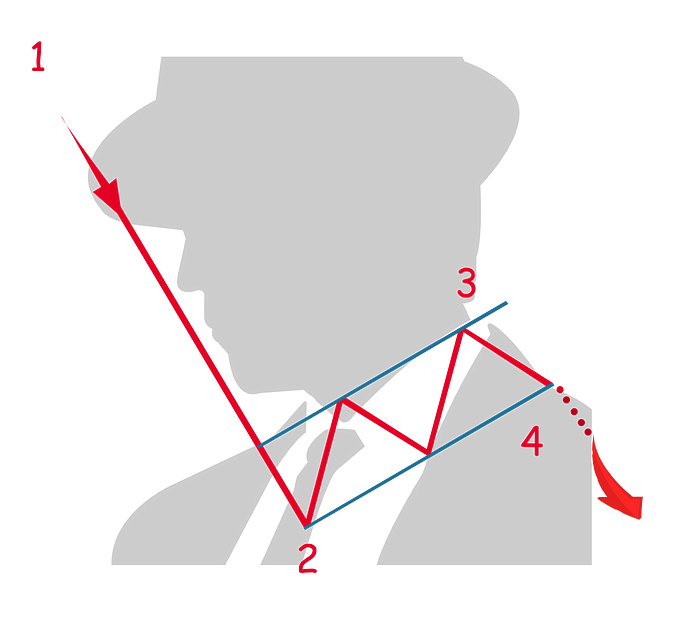
In a sharp and prolonged downtrend, the price finds its first support (2) which will form the inverted flag’s pole of this pattern.
As the price reverses, in short increments of a price reversal, the flag-like formation of the pattern will appear. This is identified by higher lows and higher highs in a narrow flag-like formation until the highest resistance level is found (3).
The pattern completes when the price reverses direction, moving downward until it breaks out of the flag-like pattern (4).
Bullish Pennant
A bullish pennant, as the name suggests is a bearish indicator and a very common pattern.
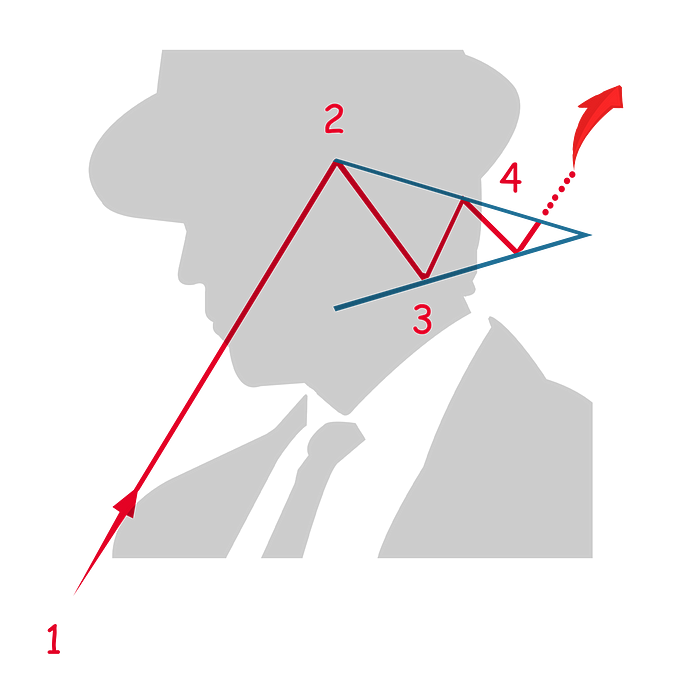
In a sharp and prolonged uptrend, the price finds its first resistance (2) which will form the pole of the pennant.
As the price reverses, in a short increment, it finds its first support level (3).
In short increments of a price reversal, the pennant-like formation of the pattern will appear. This is identified by lower highs and higher lows in a narrow pennant-like formation.
The pattern completes when the price reverses direction, moving upward until it breaks out of the upper part of the pennant-like formation (4).
Bearish Pennant
A bearish pennant, as the name suggests is a bearish indicator and a very common pattern. It is also the inverse of the bullish pennant.

In a sharp and prolonged downtrend, the price finds its first support (2) which will form the pole of the pennant.
As the price reverses, in a short increment, it finds its first resistance level (3).
In short increments of price reversal, the pennant-like formation of the pattern will appear. This is identified by lower highs and higher lows in a narrow pennant-like formation.
The pattern completes when the price reverses direction, moving downward until it breaks out of the lower part of the pennant-like formation (4).
Exotic Chart Patterns
Head & Shoulders, Head & Shoulders Inverted, Cup & Handle, Cup & Handle Inverted
EXOTIC CHART PATTERNS (4)
There are a group of patterns that are not very common and that don’t nicely fit into the abovementioned categories.
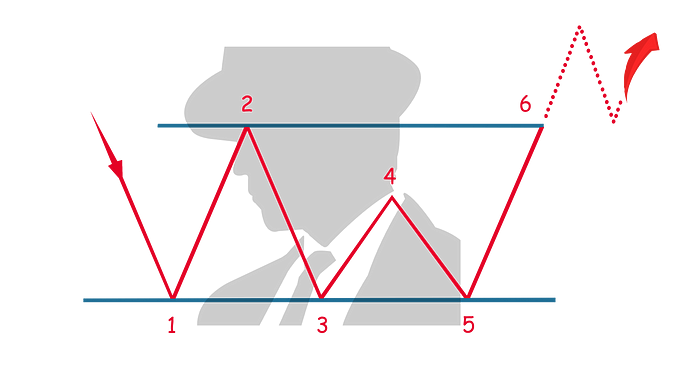
Head & Shoulders
The head and shoulders pattern is a bearish indicator and indicates a reversal of direction. It is not a very common pattern.
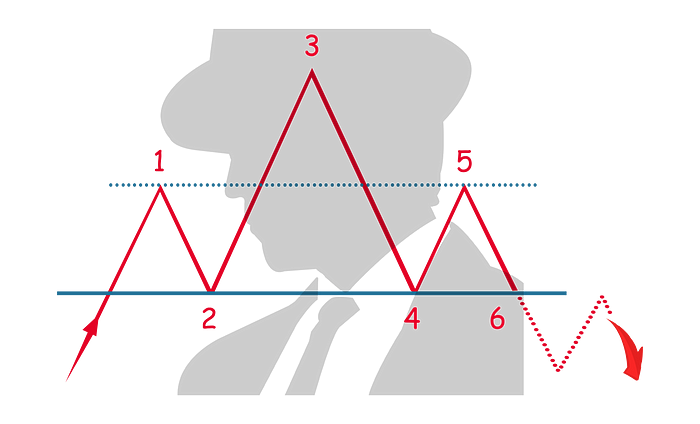
In an uptrend, the price finds its first resistance (1) which forms the left shoulder of the pattern.
As the price reverses, in a short increment, it finds its first support level (2), completing the formation of the left shoulder.
The price reverses and moves upward, it finds the second resistance (3), forming the head, which must be higher than the first resistance (1).
The price reverses and moves downward until it finds the second support (4), near to the same price of the first support (2) completing the head formation.
The price reverses and moves upward until it finds the second resistance (5), which is near to the same price as the first resistance (1). This forms the right shoulder of the pattern.
The pattern completes when the price reverses direction, moving downward until it breaks out of the lower part of the right shoulder pattern (6).
Head & Shoulders Inverted
The head and shoulders Inverted, as the name suggests is an inverted version of the head and shoulders pattern. It indicates a reversal of direction (bullish) and is not a very common pattern.
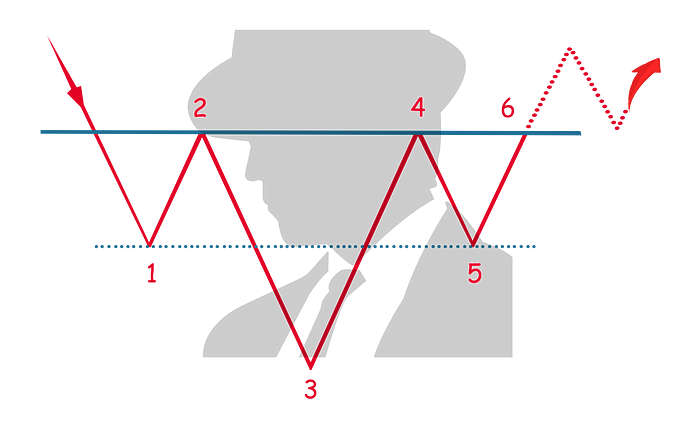
In a downtrend, the price finds its first support (1) which forms the left shoulder of the pattern.
As the price reverses, in a short increment, it finds its first resistance level (2), completing the formation of the (inverted) left shoulder.
The price reverses and moves downward, it finds the second support (3), forming the (inverted) head, which must be lower than the first support (1).
The price reverses and moves upward until it finds the second resistance (4), near to the same price of the first resistance (2) completing the (inverted) head formation.
The price reverses and moves downward until it finds the second support (5), which is near to the same price as the first support (1). This forms the (inverted) right shoulder of the pattern.
The pattern completes when the price reverses direction, moving upward until it breaks out of the higher part of the (inverted) right shoulder pattern (6).
Cup & Handle
The cup and handle pattern indicates the continuation of a pattern and is a bullish indicator. It is not a very common pattern.
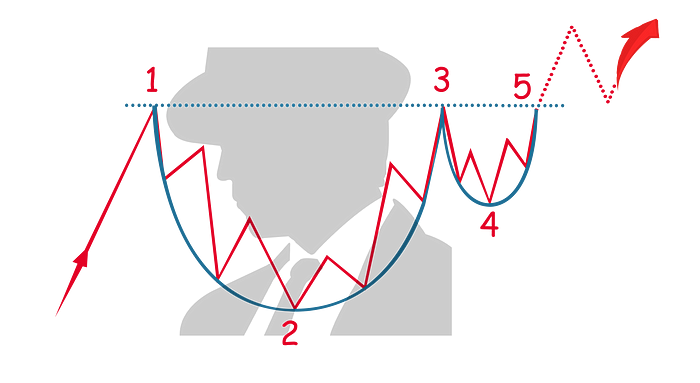
In an uptrend, the price finds its first resistance (1) which forms the edge of the cup pattern. The price reverses direction and in short increments and price reversals, finds its support (2), the lowest point in the pattern and forming the bottom of the cup.
The price direction reverses, moving upward in short increments until it finds the second resistance (3), which is at a similar level to the first level of resistance (1), completing the cup formation.
The handle formation is created when the price moves downward until it finds its support (4) which is higher than the first support level (2).
The pattern completes when the price movement reverses, moving upward (5) and breaks out of the cup and handle formation.
Cup & Handle (Inverted)
The cup and handle inverted pattern, as the name indicates is an inversion of the cup and handle pattern. This pattern indicates the continuation of a pattern and is a bearish indicator. It is not a very common pattern.

In a downtrend, the price finds its first support (1) which forms the edge of the (inverted) cup pattern. The price reverses direction and in short increments and price reversals, finds its resistance (2), the highest point in the pattern and forming the (inverted) bottom of the cup.
The price direction reverses, moving downward in short increments until it finds the second support (3), which is at a similar level to the first level of support (1), completing the (inverted) cup formation.
The handle formation is created when the price moves upward until it finds its resistance (4) which is lower than the first resistance level (2).
The pattern completes when the price movement reverses, moving downward (5) and breaking out of the (inverted) cup and handle formation.
Free Download
Download the Complete Crypto Pattern Cheat Sheet
Download Your Own Crypto Pattern Cheat Sheet:
For easy reference, a high-resolution infographic has been provided.
 Richard Knight
Get your own copy and download this cheat sheet here
Join the Crypto Revolution
Maximize Your Crypto Investment
Get expert insights from our team
Are you interested in staying ahead of the game when it comes to the ever-evolving world of cryptocurrency? Look no further than our exclusive Altcoin Investor newsletter!
As one of the fastest-growing industries in the world, cryptocurrency is constantly changing and developing. Our newsletter provides you with the latest news, trends, and insights that you need to stay informed and make informed decisions.
Our team of expert analysts scours the market to provide you with timely information on the newest coins, emerging trends, and regulatory changes that could impact the market. You'll also receive valuable tips on trading and investing strategies to help you maximize your returns.
With our cryptocurrency newsletter, you'll be the first to know about exciting developments in the world of blockchain and cryptocurrency, giving you a major edge over the competition.
Welcome to the Crypto Revolution:
As one of the fastest-growing industries in the world, cryptocurrency is constantly changing and developing. Our newsletter provides you with the latest news, trends, and insights that you need to stay informed and make informed decisions.
Frequently Asked Questions (FAQS)
What types of chart patterns are covered in this guide?
The guide categorizes the top 20 crypto chart patterns into four main groupings:
- Triangle Chart Patterns
- Rectangle Chart Patterns
- Pole Chart Patterns
- Exotic Chart Patterns
How can I download the cheat sheet?
The downloadable PDF cheat sheet is available at the bottom of the article. Simply scroll down to find the download link.
Why are chart patterns important for crypto trading?
Chart patterns are crucial for understanding market trends and making informed trading decisions. They help in identifying entry and exit points, predicting price movements, and managing risk.
What is the difference between Forex signals and Crypto signals?
While Forex signals are primarily associated with the forex market, Crypto signals are similar concepts that have emerged in the cryptocurrency market. Both provide traders with insights, recommendations, and analysis regarding potential trading opportunities.
How reliable are these chart patterns?
While chart patterns provide valuable insights, they are not foolproof indicators of future price movements. It's essential to combine them with other forms of analysis, such as fundamental analysis and current market news, for a more comprehensive investment strategy.
Can beginners benefit from this guide?
Absolutely! This guide is designed to be a valuable resource for both newcomers and experienced traders. It provides a foundational understanding of chart patterns, making it easier for anyone to get started with crypto trading.
Is there a newsletter I can subscribe to for more insights?
Yes, Altcoin Investor offers a free newsletter that provides you with the latest news, trends, and insights in the cryptocurrency market. You can sign up for it directly on the page.
Are there any other resources available for learning about crypto trading?
Yes, Altcoin Investor offers a range of articles and guides, including a "Beginner's Guide to Cryptocurrency Investing," to help you deepen your understanding of the crypto market.