
Table of Contents
A descending triangle is a bearish chart pattern used in technical analysis that is typically recognized as a continuation pattern in a downtrend, but it can also act as a reversal signal in an uptrend. This pattern is identified by a flat lower support level and a downward-sloping upper resistance line, which converge to form a right triangle.
Here's a detailed overview of the descending triangle pattern:
Formation
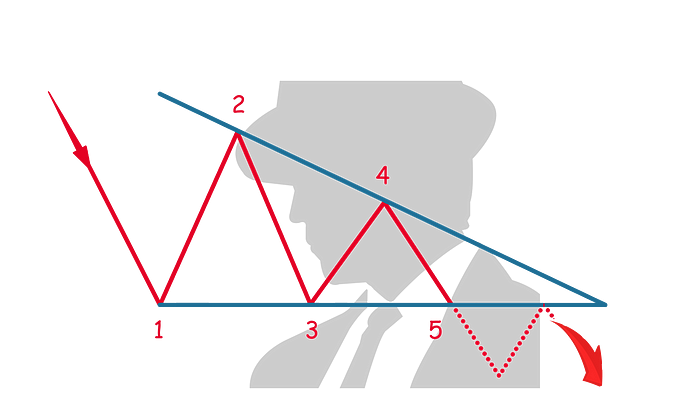
- Support Level: The bottom of the triangle is formed by a horizontal support line, which is created by connecting at least two similar lows. This line represents a price level that sellers repeatedly push the price down to, but buyers have so far been able to prevent the price from breaking below.
- Descending Resistance Line: The upper line of the triangle is a descending resistance line, which is created by connecting lower highs. This line reflects decreasing buying pressure as the highs progressively drop.
Characteristics
- Duration: Descending triangles can develop over various time frames—ranging from weeks to months. The reliability of the pattern increases with the length of time it takes to form.
- Volume: Volume typically decreases as the pattern forms, indicating less trading activity and consolidation. A breakout below the support level should ideally occur on increased volume, which provides confirmation of the pattern and a stronger signal for a continuation or reversal.
Trading Considerations
- Entry Point: Traders often consider entering a short position when the price breaks below the support level with confirmed volume. This breakout signals that sellers have taken control, and the price is likely to continue falling.
- Stop-Loss: A stop-loss can be placed just above the most recent swing high within the triangle or above the descending resistance line to protect against a potential false breakout.
- Profit Target: The target price after a breakout can be estimated by measuring the vertical distance from the highest point of the triangle to the support line. This distance is then subtracted from the breakout point at the support level to estimate how far the price might descend.
Psychological Dynamics
The descending triangle pattern represents a period where supply gradually overcomes demand. The flat support level indicates that buying pressure is present but not strengthening, while the descending upper resistance line shows that sellers are becoming more aggressive, lowering their prices. The eventual breakout below the support suggests that sellers have consolidated their control and are ready to push prices lower.
Understanding the descending triangle pattern is crucial for crypto traders, particularly those looking to capitalize on potential downtrends. It provides clear signals for entry and exit strategies and is generally regarded as a bearish indication in market analysis.


