Table of Contents
What You Are Investigating And Why The Headline Rates Do Not Matter

Sky stUSDS jumped 8.18 percentage points. Fluid USDC jumped 3.84 points. Midas USDC jumped 1.92 points. All three moved in the same week. You have $500,000 in stablecoins split across five venues. You are deciding which move to investigate first, which rebalancing actions to take, and which spreads are large enough to justify gas costs.
The wrong framework investigates the highest percentage jump first. That approach wastes time. The right framework calculates capital-weighted return delta for each potential move: the spread multiplied by the position size you would realistically deploy, minus gas. On $500,000 in stablecoins, optimal rebalancing across three simultaneous jumps can capture $20,000 or more in additional annual yield. Wrong prioritization wastes investigation time on venues where you hold no capital, or pays $15 in gas to move $8,000 and capture $63 in annual spread.
This is the capital-weighted investigation and rebalancing framework for simultaneous multi-venue moves. You will calculate net annual gain for each potential action, rank by dollars not percentages, and build a parallel investigation workflow to avoid analysis paralysis.
What You Need Before You Start
You need your current stablecoin allocation by venue and token. Write down how much USDC, USDT, DAI, and other stables you hold in each protocol. You need current APY for each venue before the jump. You need the new APY after the jump. You need current Ethereum gas prices if any of your positions or target venues are on Ethereum L1, and you need to know which venues are on L2 chains where gas is $0.50 or less.
If you do not track positions in a spreadsheet, now is the time to start. You cannot calculate capital-weighted priority without position size data. If you are holding stablecoins but have not written down the venue, the amount, and the rate, you are flying blind.
Calculate Capital-Weighted Return Delta For Each Potential Move

Sky stUSDS jumped 8.18 points. That number means nothing until you know how much capital you can move there. Fluid USDC jumped 3.84 points. That number means nothing until you know how much USDC you hold elsewhere and how much gas it costs to migrate.
The capital-weighted return delta is the formula that converts percentage spreads into dollar outcomes. For each potential rebalancing action, calculate:
Annual gain = (new rate - old rate) × position size - gas cost
Walk through three examples with real position sizes.
Example One: Sky stUSDS Jump On A $200,000 Position
You hold $200,000 USDC in Aave V3 at 4.74%. Sky stUSDS jumped 8.18 points to 11.98%. The spread is 7.24 percentage points. Annual gain before gas: 0.0724 × $200,000 = $14,480. Gas cost to withdraw from Aave and deposit to Sky on Ethereum L1: approximately $8 at normal congestion. Net annual gain: $14,472.
This move clears the hurdle easily. Even if gas were $50, the payback period is 1.3 days. At $200,000 position size, a 7.24-point spread is worth investigating immediately.
Example Two: Fluid USDC Jump On A $50,000 Position
You hold $50,000 USDC in a venue paying 5.00%. Fluid USDC jumped 3.84 points to 8.84%. The spread is 3.84 points. Annual gain before gas: 0.0384 × $50,000 = $1,920. Gas cost on Ethereum L1: $8. Net annual gain: $1,912.
This move clears the hurdle. Payback period for gas: 1.5 days. At $50,000 position size, a 3.84-point spread is worth the migration if the rate is sustainable.
Example Three: Midas USDC Jump On A $10,000 Position
You hold $10,000 USDC in a venue paying 4.50%. Midas USDC jumped 1.92 points to 6.42%. The spread is 1.92 points. Annual gain before gas: 0.0192 × $10,000 = $192. Gas cost on Ethereum L1: $8. Net annual gain: $184.
This move barely clears the hurdle. Payback period for gas: 15.2 days. At $10,000 position size, a 1.92-point spread is marginal. If Midas USDC is on a Layer 2 and gas costs $0.50, net annual gain rises to $191.50 and the move becomes more attractive. If gas is $15 during congestion, net annual gain drops to $177 and payback stretches to 31 days.
Build The Priority Ranking Table
Now calculate capital-weighted return delta for every potential rebalancing action. List each move as a row: current venue, target venue, position size, old rate, new rate, spread, gas cost, net annual gain. Sort the table by net annual gain in descending order. The top row is your first investigation priority. The second row is your second priority. Any row with net annual gain below $100 goes to the bottom of the list.
This ranking eliminates the cognitive bias that makes an 8.18-point jump feel more urgent than a 3.84-point jump when you hold ten times more capital in the second venue. A 3.84-point spread on $200,000 is $7,680 annually. An 8.18-point spread on $20,000 is $1,636 annually. The smaller percentage spread on the larger position is worth $6,044 more. Investigate it first.
Vet Sustainability And Risk For The Top Three Ranked Moves

You have ranked every potential move by net annual gain. Now you investigate the top three. Do not investigate all venues simultaneously. That creates analysis paralysis. Do not investigate the highest headline rate first if it ranks fifth by capital-weighted return. Investigate in rank order.
Sky stUSDS: Governance-Set Rate With TVL-Dependent Stability
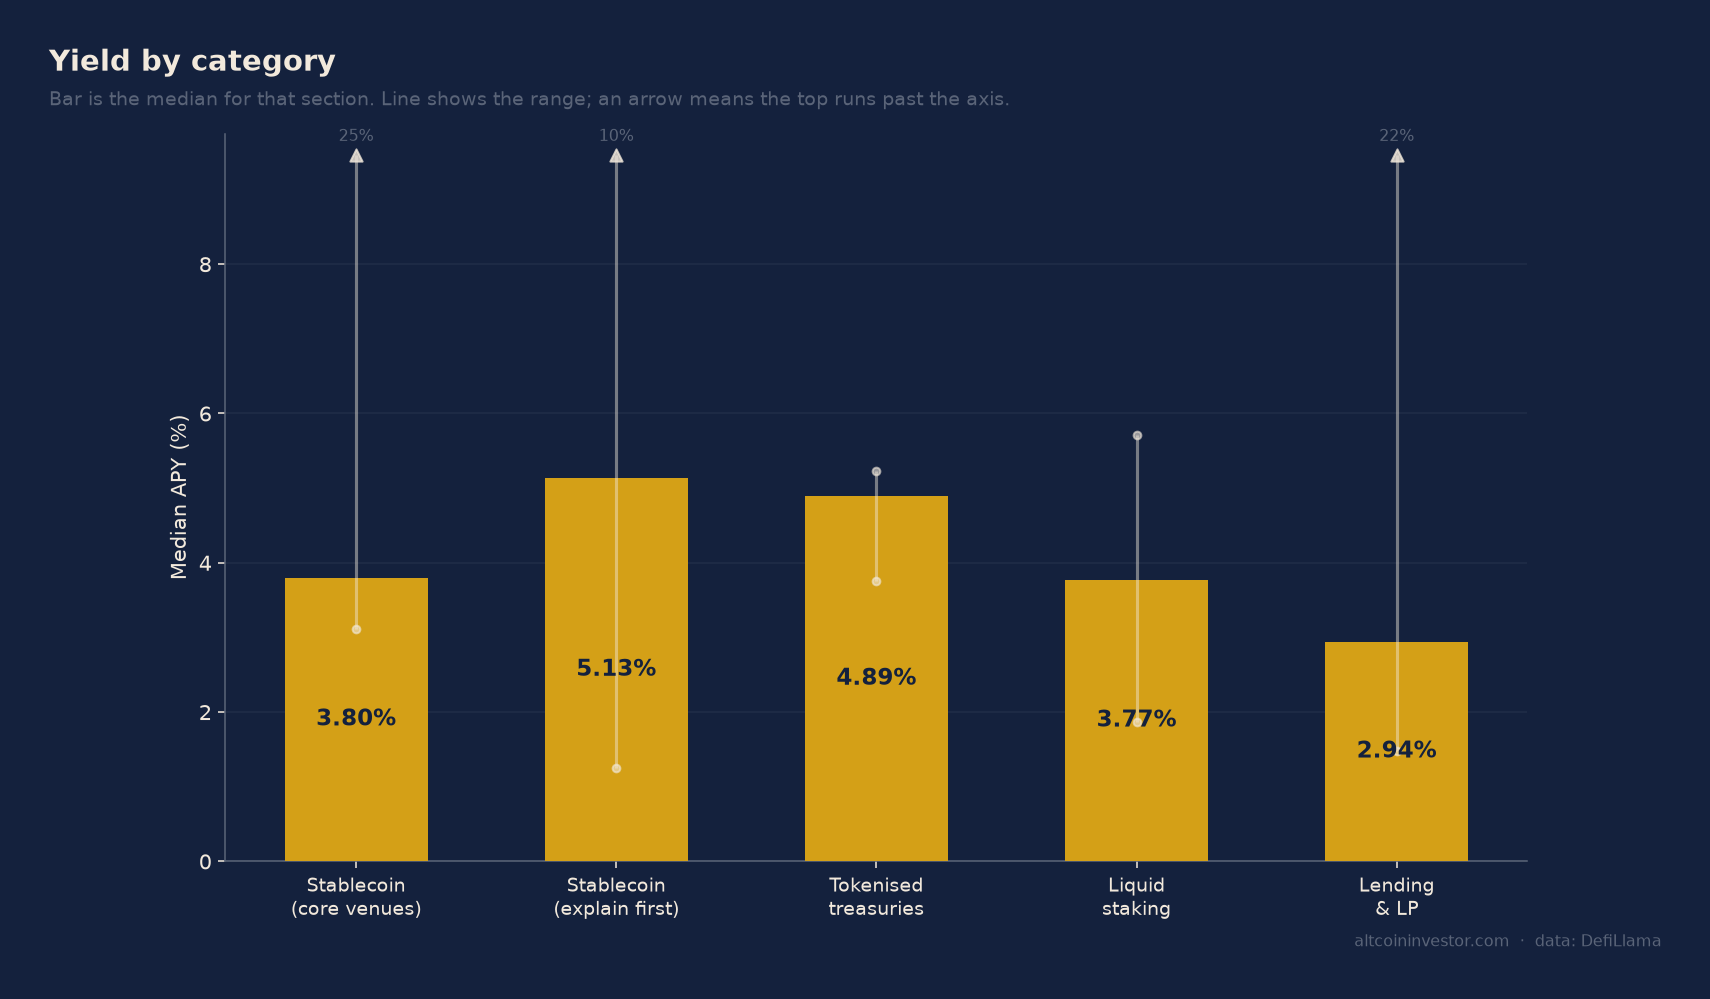
Sky stUSDS currently pays 3.80% APY on $3.79 billion in TVL, with the rate averaging 3.62% over the trailing six months. The rate is set by SKY token governance and can move up or down based on protocol revenue and governance votes. If your analysis assumes an 8.18-point jump to 11.98%, you need to verify whether that jump has actually occurred or whether it represents a scenario you are modeling.
Check the Sky dashboard for the current savings rate. Check the governance forum for recent rate-change proposals. If the rate jumped because of a governance vote to increase DSR allocation, that rate is likely to persist for weeks or months. If the rate jumped because of a temporary rewards incentive, it will revert when the incentive ends.
Sky's risk profile is moderate. The protocol has $3.79 billion in TVL and has been operating since its MakerDAO origin. The rate is variable and can drop. The collateral backing sUSDS includes real-world assets, U.S. Treasury exposure, and over-collateralized crypto loans. If you deploy $200,000 to Sky, you are taking governance risk (the rate can be voted down) and smart contract risk (the protocol can be exploited), but you are not taking utilization risk (the rate does not fluctuate based on borrow demand like Aave or Fluid).
Fluid USDC: Utilization-Dependent Rate With Collateral Concentration Risk
Fluid USDC on Ethereum currently pays approximately 11% with no token rewards, with the rate averaging around 5% for most of November before jumping on November 15 and holding between 10.8% and 12.8% for several days. The rate is utilization-dependent. When borrow demand is high, the rate spikes. When borrowers repay, the rate drops.
If your analysis assumes a 3.84-point jump, verify the current rate on the Fluid app. Check the pool's utilization rate. Fluid operates on a kink model: rates are low when utilization is below the kink (typically 80-90%), then rise steeply when utilization crosses the kink. A rate spike to 11% suggests utilization above 90%. That rate will persist as long as borrowers maintain their positions. If utilization drops to 70%, the rate will collapse back to 5-6%.
Fluid's risk profile includes collateral concentration. The Fluid USDC pool on Ethereum is backed by collateral including ETH (46%), sUSDe (17%), PST (14%), WBTC (13%), wstETH, cbBTC, weETH, with liquidation thresholds ranging from 80% to 95%. If ETH drops 20% and multiple borrowers are liquidated simultaneously, utilization will fall and your rate will drop. If you deploy $50,000 to Fluid, you are taking utilization risk (the rate is not guaranteed) and collateral risk (a sharp ETH drop can trigger cascading liquidations).
Check the pool's idle liquidity. Never hold more than a few percent of a pool's idle liquidity. If the pool has $10 million in idle liquidity and you are deploying $200,000, you are within safe bounds. If the pool has $2 million in idle liquidity and you are deploying $200,000, you are taking 10% of available exit liquidity and may face delays or slippage if you need to withdraw during a rush.
Midas USDC: RWA-Backed Yield With Custody And Regulatory Risk
Midas operates real-world asset (RWA) yield products with an average APY of 7% across 30 tracked pools on DefiLlama. Midas mTBILL shows 7-day APY of 3.42% and 30-day APY of 3.69%. If your analysis assumes a 1.92-point jump, verify the current rate for the specific Midas USDC product you are evaluating. Midas offers multiple products with different underlying assets, and the rate depends on the specific pool.
Midas RWA products generate yield by holding tokenized U.S. Treasury bills or other real-world debt instruments. The rate tracks the yield on those underlying assets. A 1.92-point jump suggests either a change in Treasury yields or a shift in the composition of the underlying portfolio. Check whether the rate increase is protocol-wide (affecting all Midas products) or specific to one pool.
Midas's risk profile includes custody risk and regulatory risk. The underlying Treasury bills are held by a custodian, not on-chain. If the custodian fails or if regulatory action freezes the assets, you cannot redeem your tokens. The protocol also carries smart contract risk. If you deploy $10,000 to Midas, you are taking custodial risk (the assets are not fully decentralized) and regulatory risk (RWA protocols are subject to securities law in multiple jurisdictions).
Parallel Investigation Workflow To Avoid Analysis Paralysis
Do not investigate Sky, Fluid, and Midas sequentially. That takes three hours and by the time you finish, the third venue's rate may have changed. Use a parallel investigation workflow. Open three browser tabs. Allocate 15 minutes to each venue. Focus on the same three checkpoints for each: current rate verification, TVL and liquidity check, and collateral or backing composition.
For Sky: verify the current savings rate, check TVL, review recent governance proposals. For Fluid: verify the current supply APY, check utilization rate, check idle liquidity. For Midas: verify the current rate for the specific USDC product, check the underlying asset composition, check the custodian identity. After 45 minutes, you have enough information to make a capital allocation decision. You do not need to read every governance forum post or audit every line of smart contract code. You need to know whether the rate is sustainable, whether the liquidity supports your position size, and whether the risk profile is acceptable.
Calculate Gas-Adjusted Breakeven Thresholds For Each Position Size Band
Not every spread justifies a rebalancing move. The minimum spread that clears the gas hurdle depends on your position size. Calculate the breakeven threshold for five position size bands: $10,000, $50,000, $100,000, $250,000, $500,000.
Ethereum L1 Gas At $8 Per Transaction
At $10,000 position size: breakeven spread is $8 ÷ $10,000 = 0.08% annually, or 0.008 percentage points. Any spread above 0.01 percentage points clears gas after one year. At $50,000: breakeven is 0.016 percentage points. At $100,000: breakeven is 0.008 percentage points. At $250,000: breakeven is 0.0032 percentage points. At $500,000: breakeven is 0.0016 percentage points.
In practice, you should not move capital for a spread that takes more than 30 days to recover gas costs. That sets a higher hurdle. For a 30-day payback, multiply the breakeven spread by 12. At $10,000 position size, the minimum spread is 0.096 percentage points. At $50,000, the minimum spread is 0.192 percentage points. At $100,000, the minimum spread is 0.096 percentage points.
For the three venues in this scenario, the spreads are 8.18 points, 3.84 points, and 1.92 points. All three clear the 30-day payback threshold even at $10,000 position size. The gas hurdle is not the binding constraint. The constraint is sustainability and risk.
Layer 2 Gas At $0.50 Per Transaction
If any of the three venues are deployed on Layer 2 chains like Base, Arbitrum, or Optimism, gas costs drop to approximately $0.50. At $10,000 position size, the 30-day payback threshold drops to 0.006 percentage points. At this gas level, even a 0.25-point spread is worth capturing. The capital-weighted return delta calculation still applies, but gas becomes a rounding error rather than a meaningful constraint.
Check whether Sky, Fluid, and Midas are available on Layer 2. Sky is primarily on Ethereum L1. Fluid has deployments on multiple chains including Layer 2. Midas RWA products are typically on Ethereum L1 but may have Layer 2 wrappers. If you can access the same rate on Layer 2, always choose the Layer 2 deployment to minimize gas drag.
Decide Whether To Rebalance Fully, Partially, Or Wait
You have calculated net annual gain for each potential move. You have vetted sustainability and risk for the top three ranked moves. Now you decide how much capital to deploy. You have three options: rebalance fully (move 100% of the position), rebalance partially (move 20-50% of the position), or wait (do not move yet, monitor for 48-72 hours).
Rebalance Fully When The Rate Is Governance-Set And The Spread Is Large
If Sky stUSDS jumped 8.18 points because of a governance vote to increase the DSR, and you have confirmed the vote passed and the new rate is live, rebalance fully. Move 100% of your USDC from the old venue to Sky. The rate is not utilization-dependent. It will not drop tomorrow because a borrower repaid. The rate will persist until governance votes to change it again, which typically happens on a monthly or quarterly cycle.
Governance-set rates have higher persistence than utilization-dependent rates. If the spread is 7+ percentage points and the rate is governance-set, the expected value of moving fully is higher than the expected value of splitting the position.
Rebalance Partially When The Rate Is Utilization-Dependent And The Spread Is Moderate
If Fluid USDC jumped 3.84 points because utilization spiked above 90%, rebalance partially. Move 30-50% of your USDC from the old venue to Fluid. The rate is utilization-dependent. It will drop if borrowers repay or if new lenders enter the pool and push utilization down. By moving only 30-50%, you capture most of the spread while maintaining optionality to redeploy if the rate collapses.
Utilization-dependent rates have lower persistence than governance-set rates. Historical data shows Fluid USDC rates averaging 5-6% with periodic spikes to 10-12% that last several days to several weeks. If you move 100% of your position during a spike, you will need to monitor daily and move again when the rate reverts. If you move 30-50%, you reduce monitoring burden and transaction costs.
Wait When The Rate Is New And The Venue Is Unfamiliar
If Midas USDC jumped 1.92 points and you have never used Midas before, wait. Do not move capital to an unfamiliar venue for a marginal spread without first deploying a test position. Move $1,000 to Midas. Verify that you can deposit, that the rate accrues as advertised, and that you can withdraw. Wait 48 hours. If the test position performs as expected, calculate whether the spread still justifies the move. If the rate has already dropped, you saved yourself the gas cost of moving $50,000 and then moving it back.
New venues carry higher smart contract risk and interface risk than established venues. The first time you use a protocol, you are also learning its withdrawal process, its fee structure, and its liquidity constraints. Do not combine learning with large capital deployment. Test first, deploy second.
Build The Ongoing Monitoring Checklist For Three-Venue Rebalancing
You have rebalanced across Sky, Fluid, and Midas. The capital-weighted investigation framework helped you prioritize and deploy. Now you build the ongoing monitoring checklist to catch rate reversions early.
Sky stUSDS: Monitor Governance Forum And Rate Dashboard Weekly
Check the Sky governance forum once per week for rate-change proposals. If a proposal to lower the DSR is posted, you have 5-7 days of discussion before the vote. If the vote passes, you have 24-48 hours to redeploy before the rate drops. Set a calendar reminder to check the forum every Monday. Bookmark the Sky dashboard and check the current savings rate every Monday when you check the forum.
Fluid USDC: Monitor Utilization Rate Daily For 7 Days, Then Twice Weekly
Utilization-dependent rates change faster than governance-set rates. For the first seven days after you deploy to Fluid, check the utilization rate daily. If utilization drops below 80%, the rate will start to fall. If utilization holds above 85%, the rate will persist. After seven days, reduce monitoring frequency to twice per week unless utilization is trending downward.
Set an alert in your calendar or task manager: check Fluid utilization every morning for the first week, then every Monday and Thursday after that. If the rate drops 2+ percentage points in a single day, recalculate whether the spread over your next-best alternative still justifies holding the position.
Midas USDC: Monitor Rate And Check For Custodian Or Regulatory News Weekly
RWA protocols carry regulatory risk that DeFi lending protocols do not. Check the Midas rate dashboard once per week. If the rate drops 1+ percentage points, investigate whether the drop is protocol-wide or specific to your pool. Check crypto news aggregators for any mention of Midas, the custodian, or the underlying asset issuer. If regulatory action is announced, you may need to withdraw before assets are frozen.
Set a calendar reminder to check Midas news and rate dashboard every Wednesday. RWA regulatory risk is tail risk - low probability, high impact. Weekly monitoring is sufficient to catch early warning signals without creating monitoring burden.
Common Failure Modes And How To Avoid Them
Failure Mode One: Investigating In Order Of Headline Percentage Instead Of Capital-Weighted Return
You see Sky jumped 8.18 points, Fluid jumped 3.84 points, Midas jumped 1.92 points. You investigate Sky first because 8.18 is the largest number. You spend 45 minutes reading governance proposals and auditing the DSR mechanism. You finish your investigation and discover you only hold $15,000 in stablecoins that could move to Sky, and the net annual gain is $1,227 after gas.
Meanwhile, you hold $180,000 USDC in Aave, and the Fluid jump represents a 3.84-point spread that would generate $6,912 in net annual gain. You wasted 45 minutes investigating the wrong venue because you ranked by percentage instead of by capital-weighted return.
The fix: build the priority ranking table before you start investigating. Calculate net annual gain for every potential move. Investigate in rank order, not in order of headline APY.
Failure Mode Two: Moving To A New Venue Without Testing Withdrawal First
Midas USDC jumped 1.92 points. You calculate that the spread justifies moving $80,000. You deposit $80,000. Three weeks later, the rate drops and you decide to withdraw. You discover that withdrawals require 7-day notice and that the withdrawal fee is 0.5%. The delay and fee were disclosed in the documentation you did not read. The withdrawal fee is $400. The 7-day delay means you miss the rate spike at a different venue that you wanted to redeploy into.
The fix: always test withdrawal before deploying large positions. Move $500-1,000 to the new venue. Wait 48 hours. Withdraw the test position. Measure the withdrawal time and fee. If the process is smooth, deploy the full position. If the withdrawal is delayed or expensive, factor that into your capital-weighted return calculation.
Failure Mode Three: Ignoring Liquidity Risk And Deploying More Than 5% Of Pool Idle Liquidity
Fluid USDC has $143.6 million in TVL and 15% idle liquidity, which equals $21.5 million available for withdrawal. You deploy $3 million, which is 14% of idle liquidity. Two days later, utilization spikes to 95% and idle liquidity drops to $7.2 million. You hold 42% of remaining idle liquidity. You cannot exit without moving the rate. If you withdraw $3 million, you will drain most of the pool's liquidity and push utilization even higher, which will spike the rate further but also create a liquidity crunch for other depositors.
If a broader market event causes multiple depositors to exit simultaneously, you may face withdrawal delays or be unable to withdraw the full position in a single transaction.
The fix: never hold more than 3-5% of a pool's idle liquidity. If you are deploying $500,000, the pool should have at least $10 million in idle liquidity. If the pool is too small for your position, split the position across two venues or choose a larger pool with lower utilization risk.
What To Do Next
Open a spreadsheet. List every stablecoin venue where you hold capital: venue name, token, amount, current APY. Add three columns: target venue, spread, net annual gain. For each potential rebalancing action, calculate the spread between your current venue and the target venue, multiply by position size, subtract gas, and write the result in the net annual gain column. Sort the spreadsheet by net annual gain descending.
The top row is your first investigation priority. Open the target venue's app or dashboard. Verify the current rate. Check TVL and liquidity. Review the rate mechanism (governance-set, utilization-dependent, or RWA-backed). Decide whether to move fully, partially, or test first. Repeat for the second and third rows.
Set calendar reminders for ongoing monitoring. For governance-set venues like Sky, check the forum once per week. For utilization-dependent venues like Fluid, check utilization daily for the first week, then twice weekly. For RWA venues like Midas, check for regulatory news once per week.
If a fourth or fifth venue jumps while you are still investigating the first three, recalculate the priority ranking table. Add the new venue as a row. Recalculate net annual gain for every move. Re-sort. If the new venue ranks in the top three, pause your investigation of the third-ranked venue and investigate the new venue instead. Capital-weighted triage is dynamic, not static. The ranking changes as rates change and as you deploy capital.
The Takeaway
When three stablecoin venues jump simultaneously, the investigation priority is determined by capital-weighted return delta (spread times position size minus gas), not by headline APY. An 8.18-point jump on a $20,000 position is worth $1,636 annually. A 3.84-point jump on a $200,000 position is worth $7,680 annually. The second move is worth $6,044 more. Investigate it first. Build the priority ranking table before you start investigating. Vet sustainability and risk for the top three ranked moves using a parallel investigation workflow. Decide whether to rebalance fully (governance-set rates with large spreads), partially (utilization-dependent rates with moderate spreads), or wait (new venues or marginal spreads). Set up ongoing monitoring that matches the rate mechanism: weekly for governance-set, daily then twice-weekly for utilization-dependent, weekly for RWA. Recalculate the priority ranking whenever a new venue moves. The capital-weighted framework converts percentage spreads into dollar outcomes and eliminates the cognitive bias that makes higher percentages feel more urgent regardless of position size. On $500,000 in stablecoins, optimal rebalancing across three simultaneous jumps can capture $20,000 or more in additional annual yield. Wrong prioritization wastes 45 minutes investigating venues where you hold no capital, or pays $8 in gas to earn $63 annually.
Frequently Asked Questions
How do I calculate capital-weighted return delta for a stablecoin yield jump?
Multiply the spread (new rate minus old rate) by the position size you would deploy to that venue, then subtract the gas cost for the transaction. For example, a 3.84-point spread on $50,000 is $1,920 annually. Subtract $8 Ethereum gas to get $1,912 net annual gain. This dollar figure, not the percentage spread, determines investigation priority. Always calculate net gain in dollars, not percentages, because a small percentage spread on a large position is worth more than a large percentage spread on a small position.
Should I investigate the venue with the highest percentage jump first?
No. Investigate venues in order of capital-weighted return delta, not headline percentage. An 8-point jump is irrelevant if you only hold $10,000 there ($800 annual gain), while a 3-point jump on $200,000 is worth $6,000 annually. Build a priority ranking table that lists every potential move with its net annual gain after gas. Sort by net gain descending and investigate the top three. This eliminates the cognitive bias that makes higher percentages feel more urgent regardless of position size.
What gas cost threshold makes a stablecoin rebalancing move uneconomical?
Use a 30-day payback rule. If gas costs $8 on Ethereum L1, the spread must generate at least $96 annually to recover gas in 30 days. That breakeven threshold varies by position size: at $10,000 it is 0.96 percentage points, at $50,000 it is 0.19 points, at $100,000 it is 0.096 points. For the three venues in this scenario (spreads of 8.18, 3.84, and 1.92 points), gas is not the binding constraint at any position size above $10,000. Sustainability and risk are the binding constraints.
How do I vet whether a utilization-dependent rate spike is sustainable?
Check the pool's current utilization rate and idle liquidity. Utilization-dependent protocols like Fluid use a kink model: rates spike when utilization crosses 85-90%. If the current utilization is 92% and the rate is 11%, that rate will persist as long as borrowers hold their positions. If utilization drops to 75%, the rate will collapse to 5-6%. Monitor utilization daily for the first seven days after deploying capital. If utilization holds above 85%, the rate is likely to persist for weeks. If utilization trends downward, recalculate whether the spread still justifies holding the position.
What is the liquidity risk threshold for deploying to a stablecoin lending pool?
Never hold more than 3-5% of a pool's idle liquidity. Calculate idle liquidity as TVL multiplied by (1 minus utilization rate). For example, a pool with $100 million TVL and 85% utilization has $15 million idle liquidity. Deploying $750,000 (5% of idle liquidity) is at the upper safe limit. Deploying $3 million (20%) creates exit risk: if utilization spikes or other depositors withdraw, you may face delays or be unable to exit the full position in one transaction. If your position size exceeds the 5% threshold, split capital across two pools or choose a larger venue.
You just walked through capital-weighted triage for three simultaneous yield jumps with specific spreads and position sizes. Those rates will have changed by next week.
Every Thursday: where crypto yield actually is - stablecoins, liquid staking and DeFi lending, with the risk named next to the rate and what changed since last week.
Get it free every ThursdayFree. No trade calls, no allocations, no hype. Unsubscribe in one click.