
Table of Contents
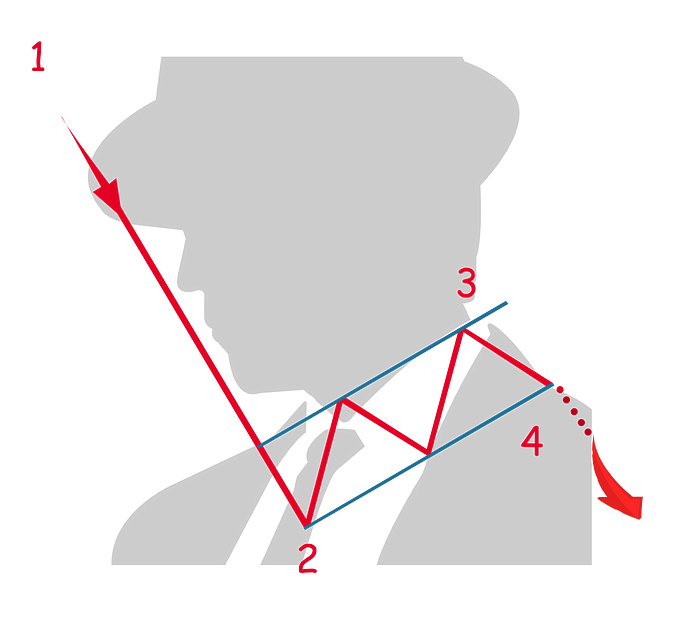
The "bearish flag" pattern is an important chart formation used by traders to signal a continuation of an existing downtrend. This pattern, which mirrors the bullish flag but inverted, resembles a flag on a pole and typically appears during a brief pause or consolidation in a strong downward market trend.
Here’s how it's structured and how traders typically interpret and use it:
Structure
1. The Pole: The pole is formed by a sharp decrease in the price of the asset, representing a strong downward move. This initial decline should be on significant volume, indicating strong selling pressure.
2. The Flag: After the rapid decline, the market enters a consolidation phase. During this phase, the prices typically retrace slightly upward in a narrow, upward-sloping price channel or a small rectangular area that tilts up. This formation looks like a flag at the bottom of the pole. The flag portion is generally much shorter and less steep compared to the pole. This pattern can form over a few days to weeks.
Significance
The bearish flag pattern is considered a continuation pattern, suggesting that the previous downward trend is likely to continue after the pattern is completed. The consolidation (flag) phase is viewed as a period during which sellers are temporarily pausing before pushing the price lower again.
Trading Considerations
- Entry Point: Traders often look for an entry point when the price breaks below the lower boundary of the flag. This breakout should ideally occur on a higher volume to confirm the pattern's validity and the likely continuation of the bear trend.
- Target Price: The target price after a breakdown can be estimated by measuring the length of the pole and projecting that distance downward from the point of the breakout at the bottom of the flag.
- Stop Loss: To manage risk, a stop-loss is commonly placed above the highest point within the flag or at a predetermined percentage above the breakout level.
- Volume: It's crucial to monitor volume; it should be high during the formation of the pole and decrease during the consolidation of the flag. An increase in volume on the breakout lends further support to the continuation of the downtrend.
The bearish flag pattern is particularly valued for its relative reliability and the clear, actionable signals it provides, making it a favored strategy among traders who focus on technical analysis. Nonetheless, it's advisable to employ this pattern in conjunction with other indicators and analysis methods to enhance accuracy and effectively manage risks.


