
Table of Contents
A double top is a popular chart pattern used in technical analysis to signal a potential reversal from an uptrend to a downtrend. This pattern is characterized by the price reaching a high point, undergoing a minor sell-off, and then rallying back to the same high point before experiencing a significant decline.
Here’s a detailed explanation of the double-top pattern:
Formation
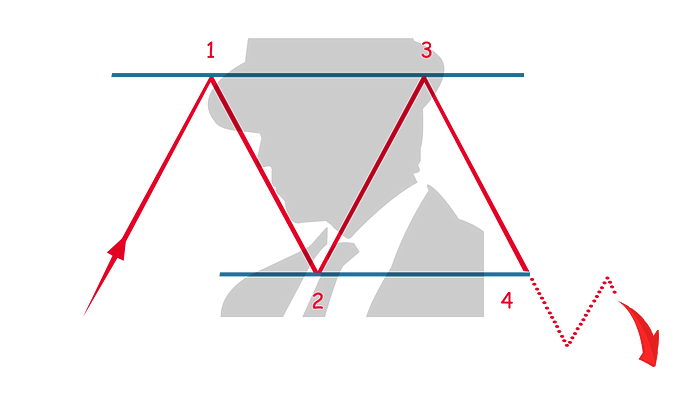
- Two Peaks: The double-top pattern consists of two consecutive peaks of approximately the same height, separated by a valley. This gives the chart an "M" shape. The two peaks are crucial as they indicate that the attempt to push prices higher has failed twice at the same resistance level.
- Support Level (Neckline): The low point between the two peaks forms the support level, also known as the neckline. The pattern is confirmed when the price falls below this neckline after forming the second peak.
Characteristics
- Volume: Ideally, the volume should be higher on the first peak than on the second. A visible decrease in volume at the second peak suggests waning buying pressure, which is a bearish sign. Confirmation of the pattern, when the price breaks below the neckline, is typically accompanied by an increase in volume.
- Time Frame: The double top can be identified on various time frames, but patterns that take longer to form generally provide more reliable signals.
Trading Considerations
- Entry Point: Traders might consider entering a short position when the price falls below the neckline, confirming the double top pattern. This break should be on a higher volume to validate the reversal signal.
- Stop-Loss: A stop-loss is often placed above the second peak to protect against the possibility of the price reversing back into an uptrend.
- Profit Target: The profit target can be estimated by measuring the height of the formation (from the neckline to the top of the peaks) and then subtracting this distance from the point where the price breaks through the neckline.
Psychological Dynamics
The double-top pattern reflects a shift in market sentiment from bullish to bearish. The first peak represents a high point in price that buyers could not sustain due to selling pressure. When the price reaches this level again and fails to break through, it indicates a lack of confidence in the asset's ability to appreciate further, leading to a bearish outlook.
Understanding a double-top pattern helps crypto traders and investors anticipate potential market reversals, allowing them to make informed decisions about securing profits or entering short positions. Recognizing the implications of volume and the importance of a decisive neckline breakout is key to effectively utilizing this pattern in trading strategies.


