Table of Contents
The Head and Shoulders pattern is a popular and highly regarded chart formation in the field of technical analysis, and it's frequently applied to cryptocurrency trading due to its reliability in predicting trend reversals. Here’s a detailed breakdown of this pattern:
Structure
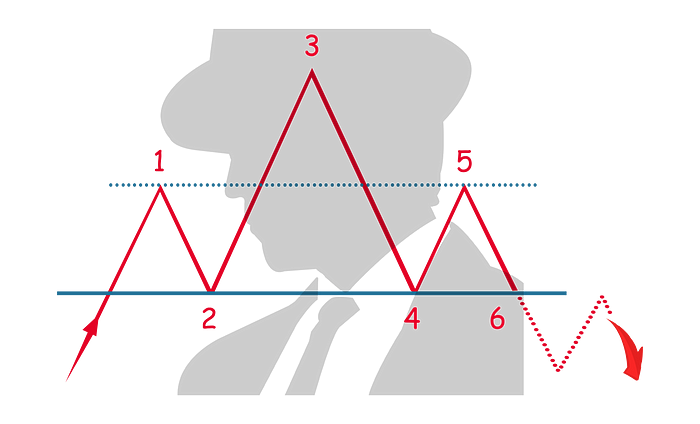
The Head and Shoulders pattern consists of three peaks on a chart. The middle peak (head) is the highest, and the two outside peaks (shoulders) are lower but approximately equal in height. This pattern typically forms during an uptrend and signals a potential reversal to a downtrend.

Components
- Left Shoulder: This is formed when the price rises to a new high and then declines to a new low.
- Head: After forming the left shoulder, the price rises to an even higher peak before falling again, setting the stage for the head.
- Right Shoulder: The price rises again but does not reach the height of the head. It then falls back down to a level similar to the previous lows.
Volume
Volume plays an important role in confirming the pattern. Typically, volume is highest on the left shoulder, decreases on the head, and is lower on the right shoulder. This decrease in volume shows waning buyer interest and is a critical confirmation of the pattern.
Neckline
The "neckline" is a key component in this pattern. It’s drawn by connecting the lowest points of the two troughs (the end points of the shoulders and head). The neckline can be horizontal or sloped and is crucial for confirming the pattern. A definitive break and close below the neckline confirm the reversal signal.
Trading Strategy
Traders often enter a sell position when the price breaks below the neckline after forming the right shoulder, anticipating a new downtrend. The depth of the head from the neckline can be used to estimate the potential decline in price, giving traders a target for their sell position.
Considerations
While the Head and Shoulders pattern is considered reliable, it's important to use it in conjunction with other indicators and technical indicators to confirm the signal and manage risk effectively. False breaks can occur, and other market conditions or news can influence the effectiveness of this pattern.
This pattern is a cornerstone of technical analysis and offers valuable insights into market psychology, showing the shift from a bullish to a bearish market sentiment. In the volatile crypto markets, recognizing such patterns early can be particularly beneficial for traders looking to capitalize on large swings in price.


