Table of Contents
Stablecoin Yields
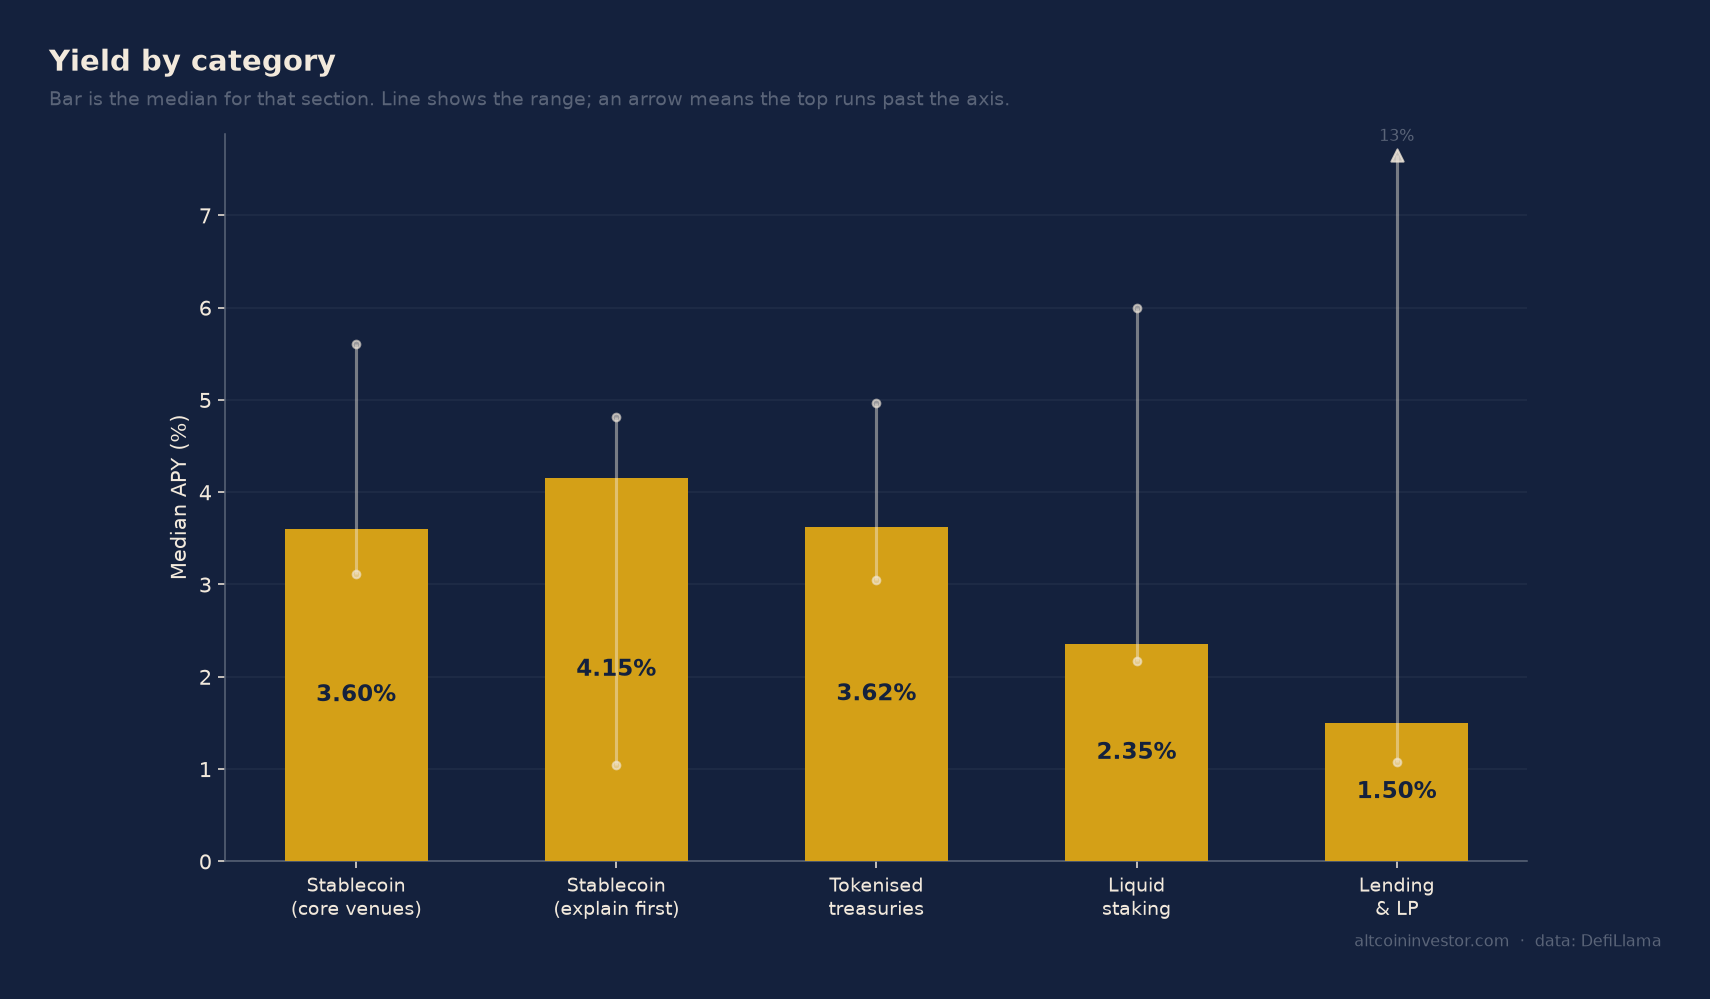
The core lending venues show tight clustering as of 10 September 2026. Sky Lending SUSDS returns 3.6% across Ethereum and Arbitrum with $5,021M in total value locked and 566 days of history. Aave v3 USDC across four chains pays 3.72%, while Aave v3 USDT on Ethereum sits at 3.85% with $246M TVL and 1,299 days of operation. Spark Savings offers 3.6% on USDC and USDS, and 3.25% on USDT.
Two venues stand above that range. Compound v3 USDC on Ethereum pays 5.61% on $35M TVL, the highest stablecoin base rate in the core category. Aave v3 SGHO yields 4.5% on $163M, though with only 117 days of history compared to Compound's 1,428 days.
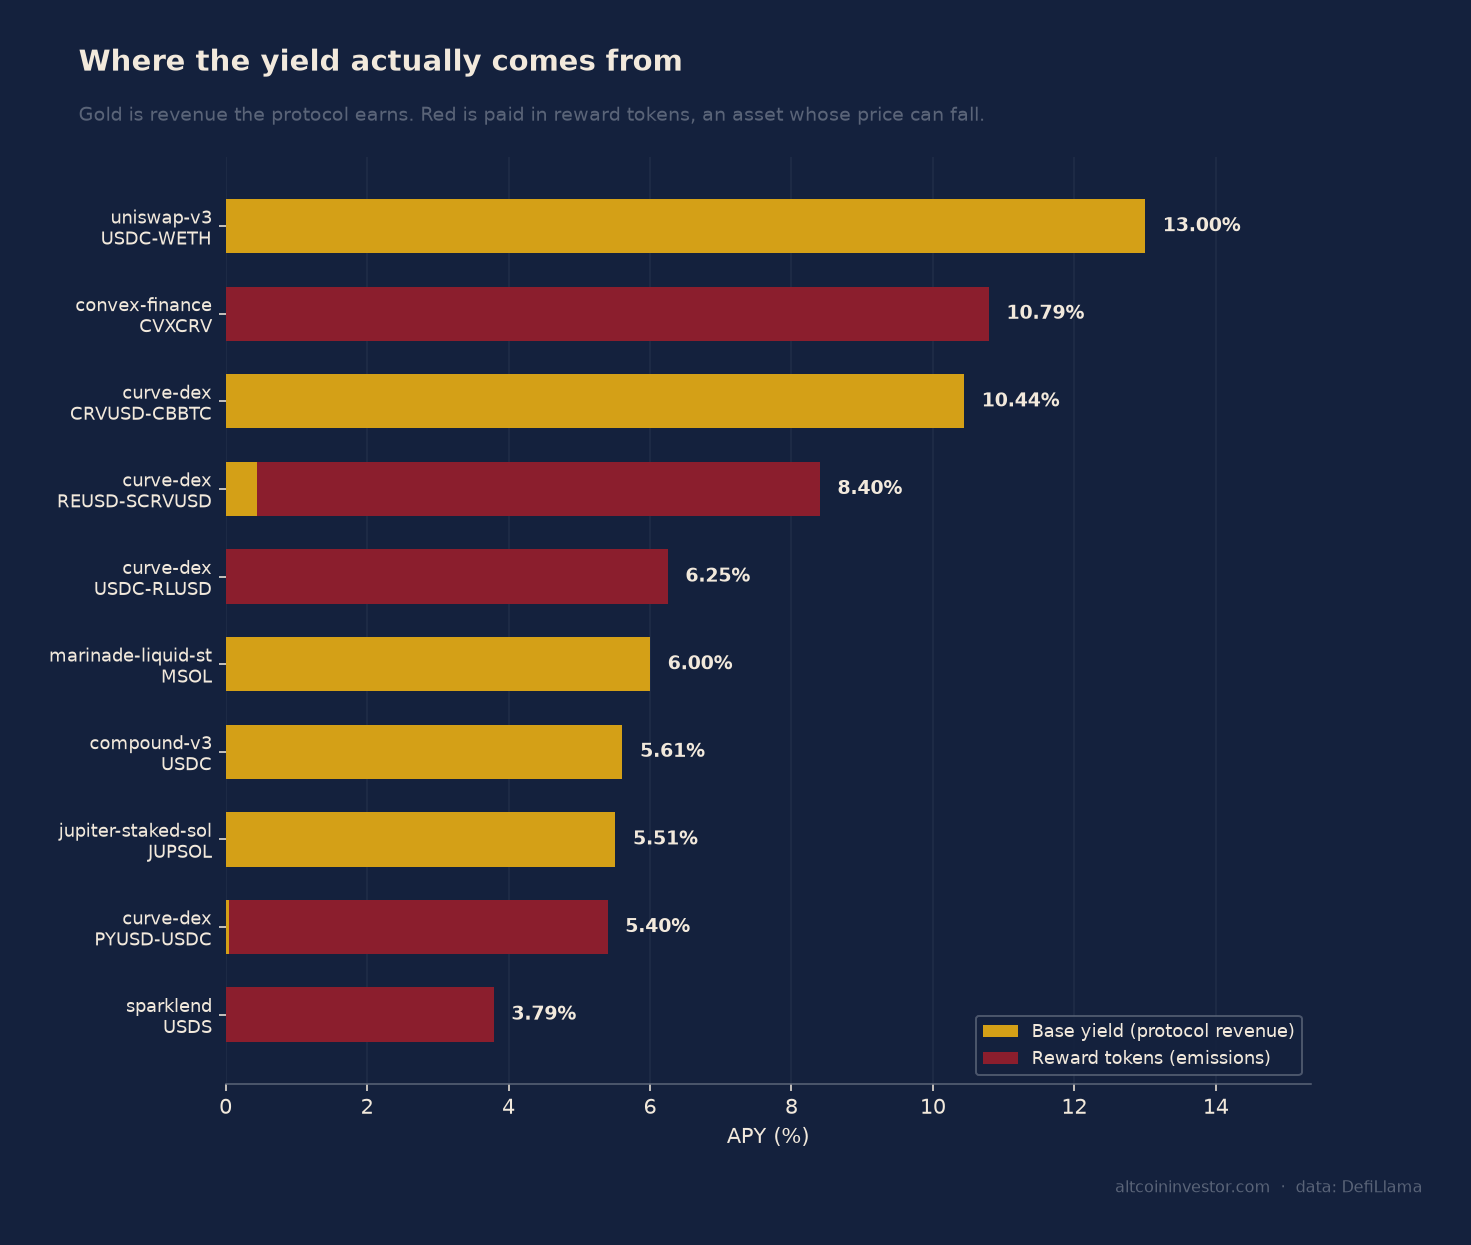
Several large stablecoin pools require mechanism explanation. Ethena sUSDe pays 4.81% on $1,326M TVL, but yield is funding-rate dependent and can go negative in a bear market. Sparklend USDS on Ethereum returns 3.79% on $904M, but 100% of that yield comes from reward emissions rather than lending fees. Morpho Blue vaults for steakUSDC and gtUSDcp pay 4.14% and 4.15% respectively, with combined TVL exceeding $1.4B, but risk parameters are set by vault curators rather than protocol governance.
Jupiter Lend USDC on Solana pays 4.35% on $466M, with 3.96% base and 0.39% in rewards. That carries different chain risk to Ethereum venues. Fluid Lending USDC returns 4.54% on $214M across Ethereum and Arbitrum, a newer lending design with 832 days of history compared to Aave's 1,309 days.
Tokenised Treasuries And Credit
Tokenised US Treasuries from major issuers cluster near the underlying rate. BlackRock BUIDL pays 3.56% on $1,878M across Solana and Ethereum with 167 days of history. Ondo USDY yields 3.57% on $1,361M over 225 days. Invesco USTB returns 3.54% on $602M TVL. These carry counterparty and regulatory risk rather than smart-contract risk, a different exposure profile to DeFi lending.
Institutional credit pools pay a premium. Maple USDC returns 4.97% on $2,644M and Maple USDT pays 4.66% on $928M, both with 409 days of track record. That yield reflects real borrower default risk. Centrifuge USDS offers 4.0% on $750M for tokenised real-world credit. Midas RWA USDC pays 3.05% on $170M, though with only 99 days of history.
Usual USD0 pays 3.62% on $507M, but 100% of the APY comes from token emissions. It is treasury-backed with a token incentive layer, placing it between pure treasury products and emissions-dependent pools.
Liquid Staking
Ethereum liquid staking yields as of 10 September 2026 range narrowly from 2.17% to 2.35%. Lido stETH dominates with $23,430M TVL and 1,559 days of history, paying 2.25%. Binance wbETH returns 2.27% on $8,552M but carries exchange custodial risk. Coinbase cbETH yields 2.35% on $463M. Rocket Pool rETH pays 2.17% on $1,273M with 1,330 days of operation.
Ether.fi weETH offers 2.32% on $5,249M across Ethereum and Base, but includes restaking exposure on top of staking, adding a layer of protocol risk. StakeWise osETH returns 2.24% on $386M with 988 days of history, a smaller pool with longer track record than many competitors.
Solana liquid staking yields are structurally higher due to higher base network rewards and MEV capture. Marinade mSOL pays 6.0% on $229M. Jupiter jupSOL returns 5.51% on $514M. Drift dSOL yields 5.2% on $280M. Jito jitoSOL offers 4.65% on $1,022M and explicitly includes MEV rewards in the rate. All carry Solana chain risk distinct from Ethereum.
What Changed
This is the first issue of the Weekly Yield Report. No prior week exists for comparison. Future editions will document changes in APY, TVL, and new venue availability with the same verifiable precision applied to the base dataset.
Where The Yield Is Not Real
Several high-headline pools derive most or all yield from token emissions. Convex cvxCRV pays 10.79% on $49M, but 100% comes from reward tokens. Curve reUSD-scrvUSD returns 8.4%, but 7.95% of that is emissions, making it 95% dependent on token price. Curve USDC-rLUSD shows 6.25% APY on $126M with 100% from emissions.
Curve PYUSD-USDC appears to pay 5.4% on $78M, but only 0.05% is base yield from fees. The remaining 5.35% is emissions, making it 99% dependent on reward token value. A pool paying 5 basis points in real fees and 535 basis points in tokens is not a 5.4% pool if the token declines.
Some established venues now carry high emissions ratios. Aave v3 WETH on Ethereum shows 5.13% APY, but 3.68% of that is rewards, making it 72% emissions-dependent compared to the standard Aave v3 WETH pool at 1.45% base. Aave v3 RLUSD pays 4.98% on $128M, with 3.2% from emissions, a 64% ratio. Curve DOLA-sUSDe returns 3.83%, but 2.64% is rewards, a 69% emissions share.
Sparklend USDS on Ethereum shows a 3.79% APY on $1,486M TVL with 192 days of history, but the entire yield is reward emissions with zero base lending fees. That is a different product to Spark Savings USDS on Arbitrum and Base, which pays 3.6% base on $375M.
How To Verify Any Of This
Every figure in this report comes from DefiLlama pool data as of 10 September 2026. Yields change daily. The numbers here are a snapshot, not a guarantee. Aave v3 USDT might pay 3.85% today and 3.92% tomorrow based on utilisation.
Click any protocol link in this report to see current APY, TVL, the breakdown between base yield and reward emissions, and historical performance. Compound v3 USDC shows 1,428 days of data. BlackRock BUIDL shows 167 days. Lido stETH shows 1,559 days. Track record matters.
When a pool shows a large gap between headline APY and base APY, as with Convex cvxCRV at 10.79% with 100% emissions, that tells you the yield depends entirely on the reward token holding value. The verification link lets you see that split yourself.
This report does not tell you where to deploy capital. It tells you what the venues pay, what risks attach, and where to check the data. The rest is your decision.