Table of Contents
It was Albert Einstein who once said,
Look deep into nature and then you will understand everything better.
There is a pattern found within the natural world that surrounds our daily lives. It’s found in nature, used in psychology, statistics, graphic design, the stock market, and likely the most important mathematical function to know when it comes to entering and exiting the cryptocurrency markets.
First described by a German mathematician, Carl Gauss this mathematical function goes by many names (depending on the discipline it is applied).
If you are a graphics designer, you may know it by the name of Gaussian function (or Gaussian blur). In statistics, it’s often referred to as the “normal distribution” or “standard deviation” as it's used in probabilistic distributions. Yet, most people are likely familiar with its common name the “bell curve” — the name which best describes its shape.
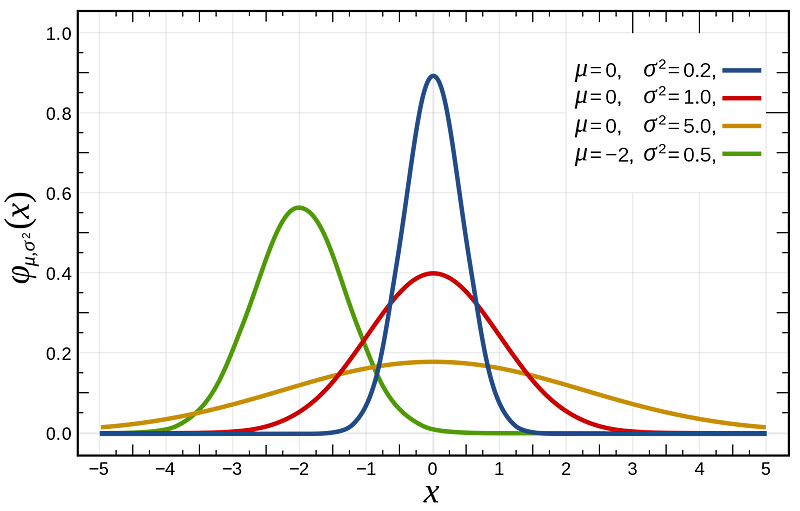
The bell curve is easily identifiable and has been an important technique used within the stock market to determine the best time to enter or exit a market and equally can be (and should be) used by cryptocurrency investors.
The bell curve can be found in almost all aspects of life and has been proven in many different disciplines to be highly accurate in its application.
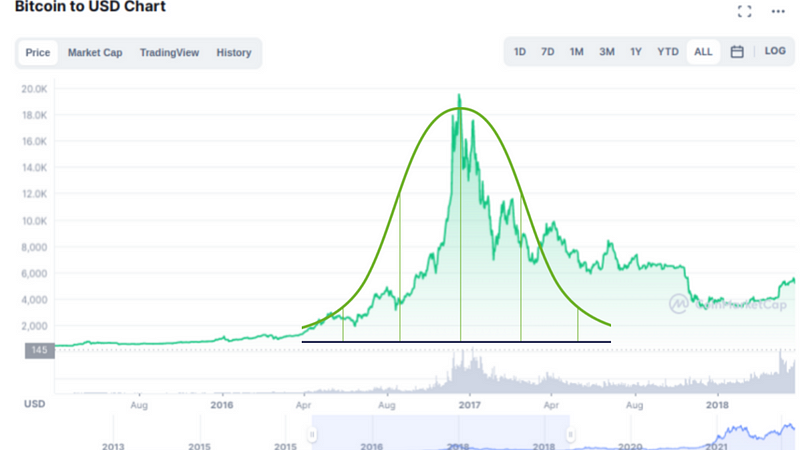
For example, if we look back at the first major Bitcoin bull run in late December 2017, when the price went from around $3,000 to almost $20,000, the bell curve shape can be identified.
Again in mid-2021, we saw this same curve show up in the price of Bitcoin rising sharply from $11k and peaking at $63k and then dropping down again to $30k.
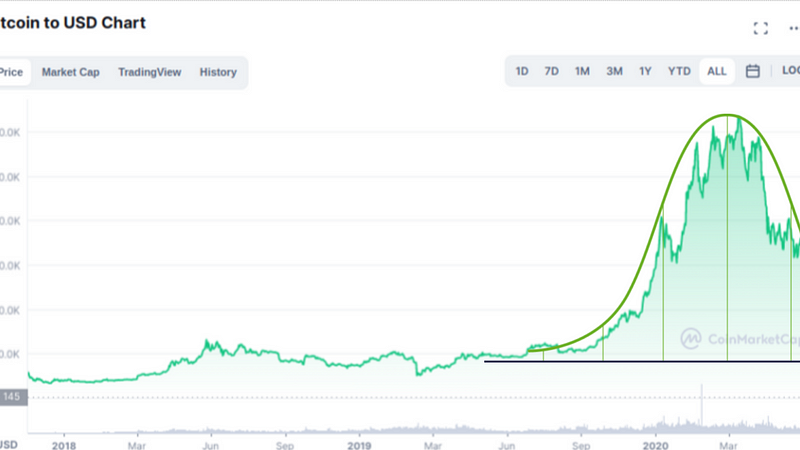
While the application of a bell curve lends itself to the depiction of a normal probability distribution, the graphical representation of a bell curve can also be used to determine the four stages of a market cycle and to identify the best time to enter and exit the market.
The 4 Phases of a Crypto Market Cycle
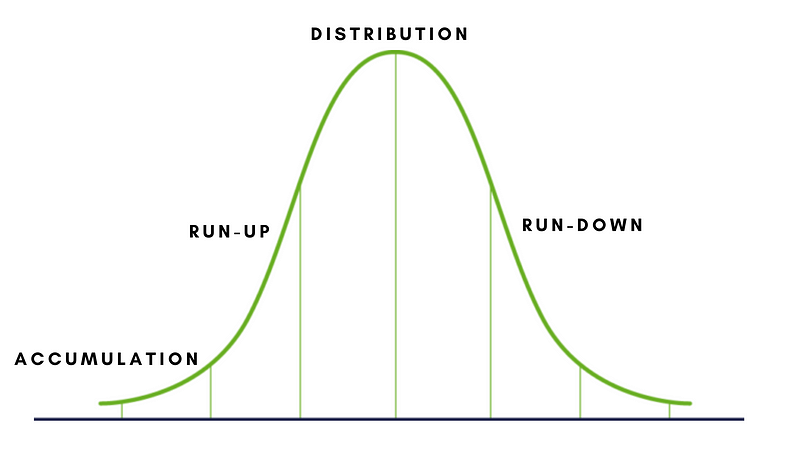
This same bell curve can be used to identify the 4 phases found within a cryptocurrency market cycle - the slow accumulation, the quick run-up, the plateau in price, and the subsequent drop in price. This is a pattern that repeats time and time again across all markets.
Sadly, especially within the cryptocurrency, there seems to be a belief that the price will only continue to rise, without taking into account the cycles of the natural world — which the cryptocurrency market is not immune to.
There are and will always be cycles — All cryptocurrencies and markets have a natural tendency to follow this pattern.
The good news is, that as this cycle completes, the next one begins.
The problem for many investors and this is especially true for cryptocurrency traders is that they fail to recognize that markets are cyclical in nature and do not foresee (or want to acknowledge) the final phase of the cycle.
While it’s almost impossible to accurately pick the top or bottom of any given cycle, understanding that cycles exist and knowing which cycle the market is in will help you to identify the best time to buy and when to sell, helping to maximize your returns and minimize your losses.
Borrowing from traditional market analysis, here are the four major phases of a market cycle and how to recognize them:
Accumulation Phase
The accumulation phase is either the start of a new project or the ending of a prior phase where the market has already bottomed out. In the case of a new project, this is when early adopters or insiders buy into the project.
In the case where the market has bottomed out, the weak hands have sold and it is when smart money buys in, figuring that the worst is over. This is the beginning of a new cycle and many refer to this as “buying the dip”. This is the point in the cycle where the price is the lowest. It’s also a point marked by market sentiment moving from negative to neutral (from the prior cycle).
Run-Up Phase (Bull Market)
The run-up phase (which can also be referred to as a bull market when looking at the market as a whole) is when the market begins to move to higher highs at an increasing rate. At the beginning of this phase, technical analysts pick up on these projects and it is around this point the early majority enter the market.
This is the time when the market direction has become clear and overall market sentiment has changed to optimistic.
Near the end of this phase, FOMO (fear of missing out) runs high as increasingly more investors are buying near the top in fear of missing out.
The end of this phase is also marked by the late majority jumping in resulting in a large increase in market volume. This point is also often identified when the market valuations seem excessively high and overvalued.
This is also the point where smart money and insiders start selling.
As prices begin to level off, this leads the market into the Distribution Phase with the final wave of investors jumping in. This is where excessive gains are seen in very short periods and it's where the media attention on the market is at its all-time high.
Distribution Phase
In the third phase of the market cycle, the price plateaus, and sellers begin to dominate. This part of the cycle is identified by a period in which the bullish sentiment of the previous phase turns into a mixed sentiment. The price will seem to plateau as trading occurs within a narrow range which can last days or weeks and the price momentum will slow.
This phase concludes when the market reverses its direction. It’s at this time when classic TA patterns like head and shoulders or double or triple tops can be found and are an indication of a change in direction.
As this marks the peak (top) of the market, it’s a period overrun by emotion. The majority of the market looks to the recent past with hopes of continued excessive gains and greed overtakes common sense. It’s a time when smart money has already exited and where equal parts of anticipation and fear surround the market.

Run-Down Phase (Bear Market)
The last phase of a market cycle is the run-down. For the majority of investors, this is the most difficult period and a highly emotional time. Within the cryptocurrency markets, this also seems to be a time of social media pumping with the hard-held belief the price will only keep going up.
However, the nature of this world dictates there will always be a run-down phase and this seems to be one of the hardest lessons in the cryptocurrency community.
Psychologically, this is also the most difficult point for crypto investors as they either are not aware of the permanence of market cycles or choose to ignore them, resulting in either selling too late or not selling at all.
Of course, it’s possible to wait for the next run-up in price (HODL) however, this can significantly reduce your ROI and limit future investing opportunities.

How Long Do These Cycles Last?
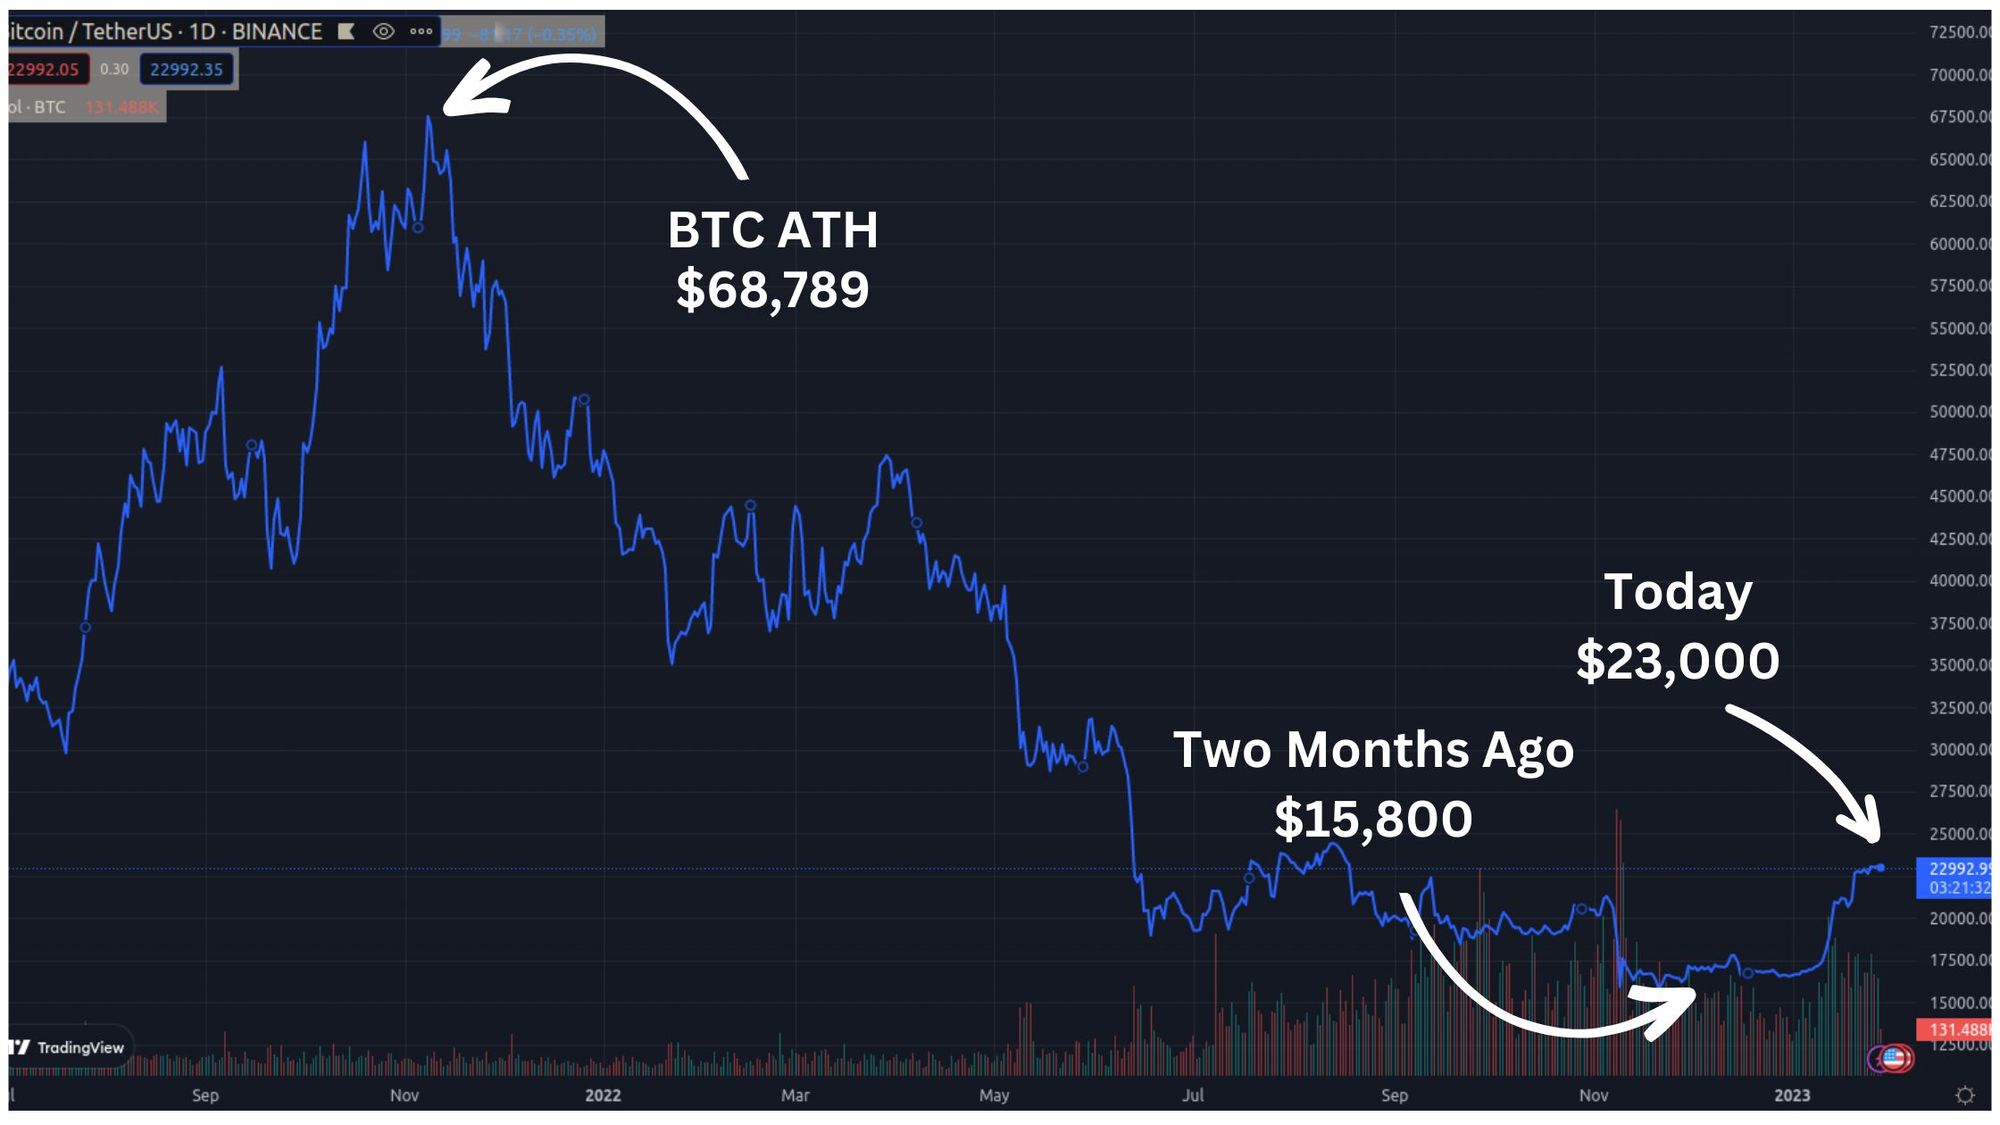
Although the cryptocurrency market is still very young, we do have limited historical data to indicate the duration of market cycles. The biggest market runup happened in 2017 when the price went from ~$3,000 to almost $20,000.
Again in 2021, we had another major runup where the price went from ~$10,000 to ~$63,000.
These cycles have been correlated with what is known as the Bitcoin Halving Cycle, a programmatic event that occurs approximately once every 4 years where the creation of new bitcoins is halved, reducing the supply and subsequently increasing its market price as a result.

During the runup to the Bitcoin halving (the accumulation phase of the market), there is one class of cryptocurrencies that have outperformed all other investments - Small Cap Alts.
When to Buy & When to Sell?
Known as contrarian investing, investors purposefully go against the prevailing market trends, selling when the market is buying and buying when the market is selling.
When to Buy
The accumulation phase is the best time to buy into the market. For new projects, this can be when they are initially offered or after the run-down phase of the last cycle. This is when the price has stopped falling while the market is still bearish. Also referred to as “buying the dip”.
When to Sell
The end of the run-up and before the start of the distribution phase is the best time to sell, according to contrarian investing. This is when the market sentiment is the most bullish, prices are still climbing and everyone including the media is talking about it. For smart money, this is the time to sell.
The Reality
Unfortunately, we would all like to believe prices will keep climbing — especially in the cryptocurrency market, making it difficult for most investors to sell when the price keeps climbing.
However, the nature of reality is that the price will ALWAYS come down. The bell curve is a function of our reality. This is why the contrarian approach to investing, especially in the cryptocurrency markets is so important.
Conclusion
When it comes to investing in cryptocurrency, knowing and utilizing this knowledge will help to minimize your risk and maximize your returns.


