
Table of Contents
In this article, we cover the top 20 most common crypto chart patterns and what they mean.
What are Chart Patterns?
A chart pattern is a shape within a price chart that suggests the next price move, based on the past moves. Chart patterns are the basis of technical analysis and help traders determine the probable future price direction.
Reading chart patterns have been around for as long as trading has existed and predates the cryptocurrency market.
The patterns described and illustrated in this article are not new. They have been borrowed from the technical analysis, going back to the early 1900s, and are similar patterns and terms commonly used in both the stock and Forex markets today.
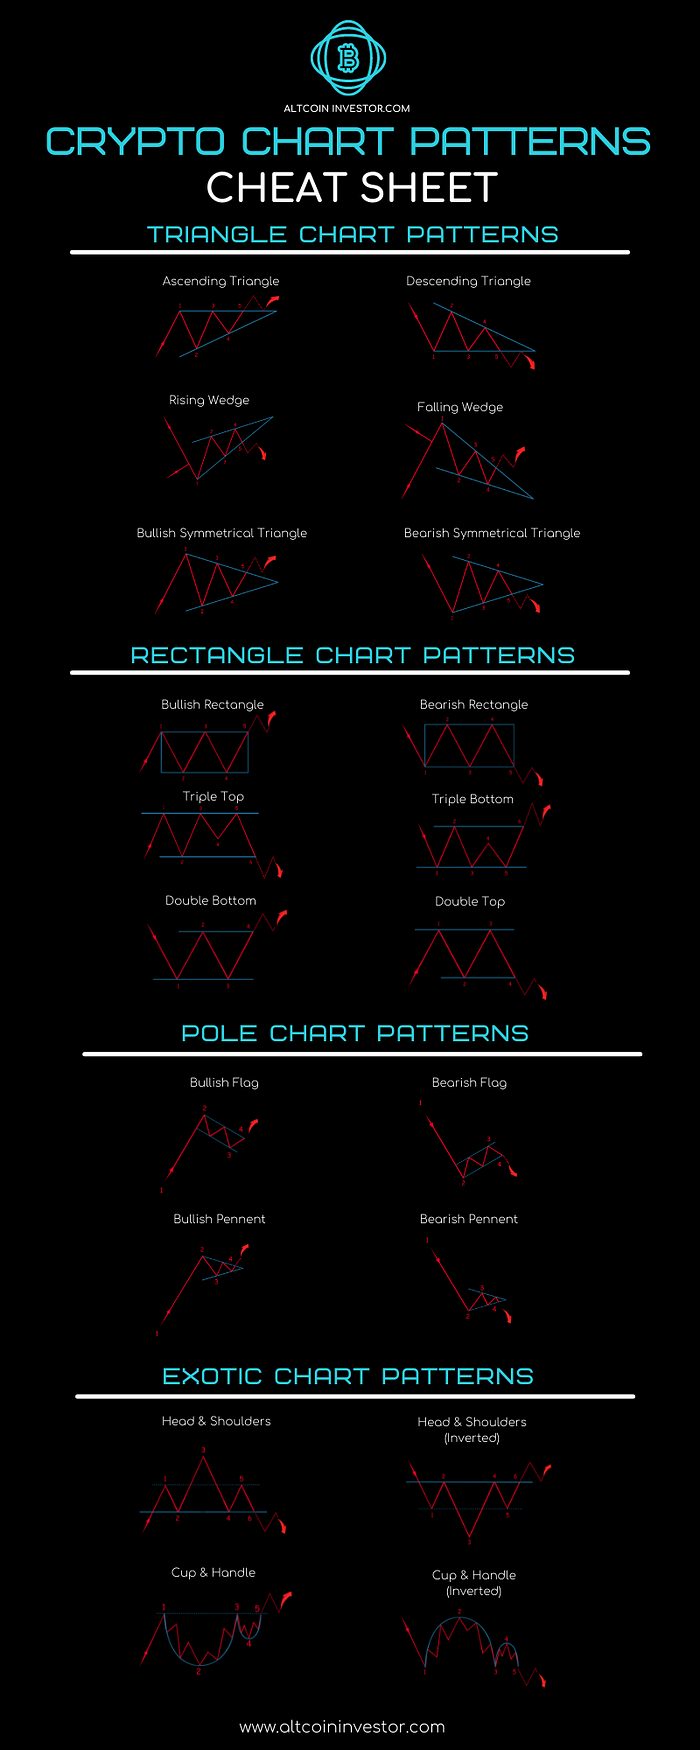
Top 20 crypto chart patterns:
Although 20 patterns may sound like a lot, it’s only 10 different patterns (as the others are inverted).
These twenty trading patterns are categorized into four groupings:
- Triangle Chart Patterns (6)
- Rectangle Chart Patterns (6)
- Pole Chart Patterns (4)
- Exotic Chart Patterns (4)
TRIANGLE CHART PATTERNS (6)
There are six patterns that fall into triangle patterns. Half of these patterns are their inverted counterparts.
Ascending Triangle
This is a bullish indicator and indicates the continuation of an upward trend. The ascending triangle is a very common pattern seen in bullish markets.

In an uptrend, first resistance is found (1) and the price reverses until it finds its first support (2). Price reverses direction and continues its upward movement until the second resistance is found (3) which is near or level to the first resistance level and also forms the horizontal line in this pattern.
The price reverses direction and finds its support slightly higher than before (4).
The pattern completes when the price breaks through the initial resistance level as set out in this pattern (5).
Descending Triangle
This is a bearish indicator and indicates the continuation of the downward trend. It is also the inverse of an ascending triangle.
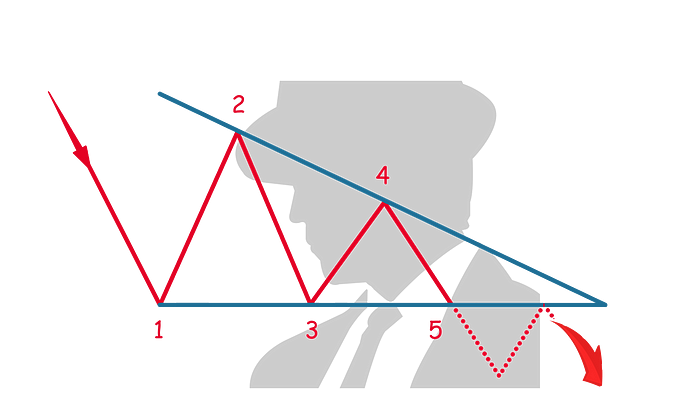
In a downtrend, the first resistance is encountered (1) setting the horizontal resistance for the rest of the pattern. The price reverses direction and finds its first support (2) which will be the highest point in this pattern.
The price reverses and finds its second support (3) at a similar level to the first resistance (1). The price again reverses and finds its resistance at a lower level than before (4), forming the descending angle of the triangle.
The pattern completes when the price reverses again and breaks below (5) the established horizontal line in this pattern.
Bullish Symmetrical Triangle
As the name suggests, this is a bullish indicator and indicates the continuation of the upward trend. The bullish asymmetrical triangle is a common pattern seen in bullish markets.

In an uptrend, the price finds the first resistance (1) which will be the highest price in the pattern. The price reverses and finds its first support (2) which will be the lowest point in this pattern. The price reverses from the first support (2) and finds the second resistance (3) which is lower than the first resistance. These two resistance points create the downward angle of the symmetrical triangle.
The second support level (4) is higher than the first support (2) and forms the upward angle of the symmetrical triangle.
The pattern completes when the price reverses direction from the second support (4) and breaks the triangle's upper line (5).
Bearish Symmetrical Triangle
As the name suggests, this pattern is bearish and indicates the continuation of the downward trend. The bearish symmetrical triangle is a common pattern seen in bearish markets.
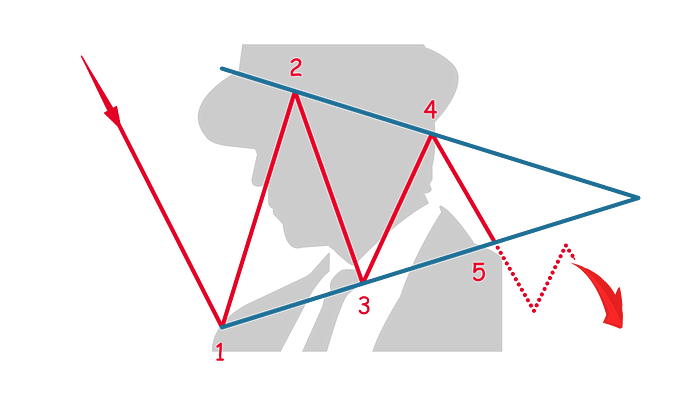
In a downtrend, the price finds its first support (1) which is the lowest price in this pattern. The price reverses and finds its first resistance (2), which is the highest point in this pattern.
The second support (3) is higher than the first support (1) and creates the upward angle of this pattern. The price reverses direction and the second resistance (4) is lower than the first resistance (2) creating the downward angle of this pattern.
The pattern completes when the price reverses past the bottom angle of the pattern (5) and anticipates a lower low and bearish trend.
Rising Wedge
The rising wedge is a bearish indicator and can be found in either an uptrend or a downtrend. It is not a common pattern.

In either an uptrend or downtrend, the first point in this pattern (1) forms the first support level and also the lowest point in the pattern. As the price reverses, the first resistance level (2) is set and is also the lowest resistance level in the pattern.
As the price reverses, the second support (3) is found and the first (1) and the second support (3) form the bottom angle of the rising wedge.
The price reverses and the second resistance level (4) is at a point higher than the first resistance level (2).
The pattern completes when the price reverses (4) and breaks through the bottom of the rising wedge (5).
Falling Wedge
The falling wedge is a bullish indicator that can be found in either an uptrend or downtrend. The falling wedge is not a very common pattern. The falling wedge is also the inverse of the rising wedge.

This chart pattern can be formed after either an uptrend or a downtrend where the first resistance (1) marks the highest point in this pattern. The price reverses, finding the first support (2) which is also the highest support level in this pattern.
The price reverses, moving upward until hitting the second resistance level (3) which is lower than the first resistance point (1). These two points also mark the top angle of the falling wedge.
The price reverses finding the second support (4) which is also lower than the first support level (2), marking the bottom angle of the falling wedge.
The pattern completes when the third resistance level (5) breaks through the upper angle of the falling wedge.
RECTANGLE CHART PATTERNS (6)
There are six patterns that fall into the rectangle chart pattern. Half of these patterns are their inverted counterparts.
Bullish Rectangle
The bullish rectangle is a common pattern that indicates the continuation of an uptrend.

In an uptrend, the price finds its first resistance (1) which will form the basis for a horizontal line which will be the resistance level for the rest of the pattern.
As the price reverses, it finds its first support (2) which will also form the basis for a horizontal line that will be the support level for the rest of the pattern.
As the price moves upward from its first support (2), it finds the second resistance level (3) which is at the same or similar level as the first resistance.
The price reverses direction moving downward and finds support (4) at the same or similar level as the first support.
The pattern completes when the price reverses its direction, moving upward and breaking the upper border of the pattern (5).
Bearish Rectangle
The bearish rectangle is a very common pattern that indicates the continuation of a downtrend. It is also the inverse of the bullish rectangle.
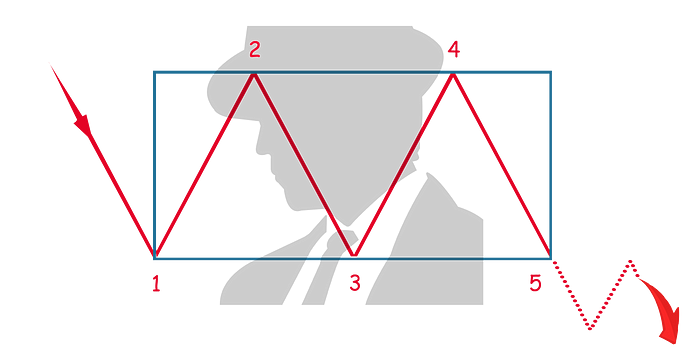
In a downtrend, the price finds its first support (1) which will form the basis for a horizontal line that will be the support level for the rest of the pattern.
As the price reverses, it finds its first resistance (2) which will also form the basis for a horizontal line that will be the resistance level for the rest of the pattern.
The price reverses, moving downward until it finds the second support level (3) which is at the same or similar level of support as the first (1).
The price reverses direction, moving upward until it finds the second level of resistance (4) which is at the same or similar level of resistance as the first (2).
The pattern completes when the price reverses direction, moving downward until it breaks the lower border of the pattern (5).
Double Top
A double top is a very common pattern and indicates a reversal in price direction.
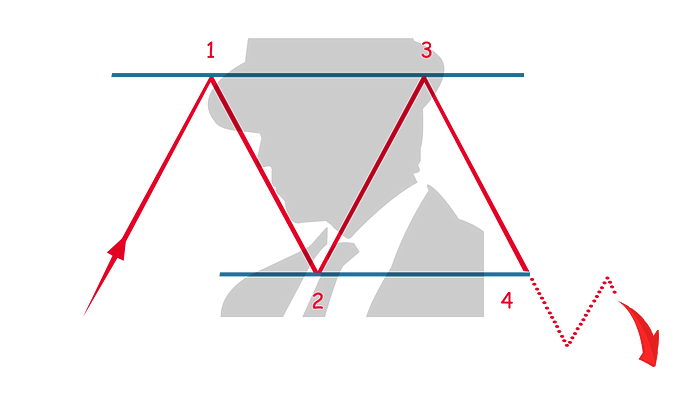
In an uptrend, the price finds its first resistance (1) which will form the basis for a horizontal line that will be the resistance level for the rest of the pattern.
As the price reverses, it finds its first support (3) which will also form the basis for a horizontal line that will be the support level for the rest of the pattern.
As the price reverses and moves upward, it finds the second resistance (3), which is at the same similar resistance as the first resistance (1).
The pattern completes when the price reverses direction, moving downward until it breaks the support level set out in the pattern (4).
Double Bottom
A double top is a very common pattern and indicates a reversal in price direction. It is also the inverse of the double top.

In a downtrend, the price finds its first resistance (1) which will form the basis for a horizontal line that will be the support level for the rest of the pattern.
As the price reverses, it finds its first resistance (2) which will also form the basis for a horizontal line that will be the resistance level for the rest of the pattern.
As the price reverses and moves downward, it finds the second support (3), which is at the same support level as the first support (1).
The pattern completes when the price reverses direction, moving upward until it breaks the resistance level set out in the pattern (4).
Triple Top
A triple top is a bearish indicator and a less common pattern. It indicates a reversal in price direction.
In an uptrend, the price finds its first resistance (1) which will form the basis for a horizontal line that will be the resistance level for the rest of the pattern.
As the price reverses, it finds its first support (2) which will also form the basis for a horizontal line that will be the support level for the rest of the pattern.
As the price reverses and moves upward, it finds the second resistance (3), which is at the same resistance level as the first resistance (1).
As the price reverses and moves downward, it finds the second support (4), which can be higher or lower than the first support (2).
The price movement reverses and moves upward until it hits the resistance level (5) which is at the same resistance level as the first resistance (1).
The pattern completes when the price reverses direction, moving downward until it breaks the support level set out in the pattern (6).
Triple Bottom
A triple bottom is a bullish indicator and a less common pattern. It indicates a reversal in price direction. It is also the inverse of a triple top.

In a downtrend, the price finds its first support (1) which will form the basis for a horizontal line that will be the support level for the rest of the pattern.
As the price reverses, it finds its first resistance (2) which will also form the basis for a horizontal line that will be the resistance level for the rest of the pattern.
As the price reverses and moves downward, it finds the second support (3), which is at the same support level as the first support (1).
As the price reverses and moves downward, it finds the second resistance (4), which can be higher or lower than the first resistance (2).
The price movement reverses and moves upward until it hits the support level (5) which is at the same support level as the first support (1).
The pattern completes when the price reverses direction, moving upward until it breaks the resistance level set out in the pattern (6).
POLE CHART PATTERNS (4)
There are four patterns that fall under this category. Half of these patterns are their inverted counterparts.
Bullish Flag
A bullish flag, as the name suggests is a bullish indicator and a very common pattern.

In a sharp and prolonged uptrend, the price finds its first resistance (2) which will form the flag’s pole of this pattern.
As the price reverses, in short increments of price reversal, the flag-like formation of the pattern will appear. This is identified by lower highs and lower lows until support is finally found (3).
The pattern completes when the price reverses direction, moving upward until it breaks out of the flag-like pattern (4).
Bearish Flag
A bearish flag, as the name suggests is a bearish indicator and a very common pattern. It is also the inverse of the bullish flag.
In a sharp and prolonged downtrend, the price finds its first support (2) which will form the inverted flag’s pole of this pattern.
As the price reverses, in short increments of price reversal, the flag-like formation of the pattern will appear. This is identified by higher lows and higher highs in a narrow flag-like formation until the highest resistance level is found (3).
The pattern completes when the price reverses direction, moving downward until it breaks out of the flag-like pattern (4).
Bullish Pennant
A bullish pennant, as the name suggests is a bearish indicator and a very common pattern.
In a sharp and prolonged uptrend, the price finds its first resistance (2) which will form the pole of the pennant.
As the price reverses, in a short increment, it finds its first support level (3).
In short increments of price reversal, the pennant-like formation of the pattern will appear. This is identified by lower highs and higher lows in a narrow pennant-like formation.
The pattern completes when the price reverses direction, moving upward until it breaks out of the upper part of the pennant-like formation (4).
Bearish Pennant
A bearish pennant, as the name suggests is a bearish indicator and a very common pattern. It is also the inverse of the bullish pennant.

In a sharp and prolonged downtrend, the price finds its first support (2) which will form the pole of the pennant.
As the price reverses, in a short increment, it finds its first resistance level (3).
In short increments of price reversal, the pennant-like formation of the pattern will appear. This is identified by lower highs and higher lows in a narrow pennant-like formation.
The pattern completes when the price reverses direction, moving downward until it breaks out of the lower part of the pennant-like formation (4).
EXOTIC CHART PATTERNS (4)
There is a group of patterns that are not very common and that don’t nicely fit into the abovementioned categories.
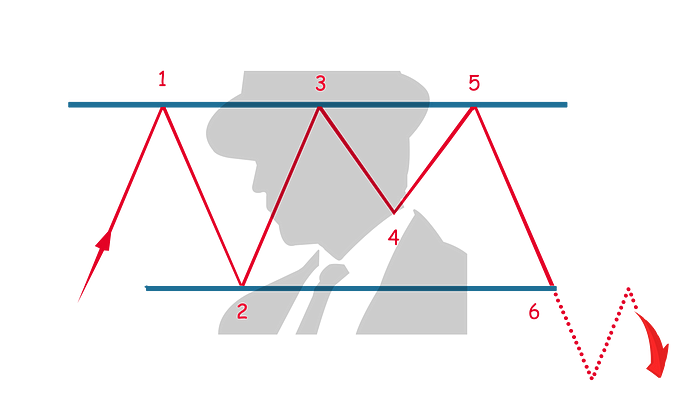
Head & Shoulders
The head and shoulders pattern is a bearish indicator and indicates a reversal of direction. It is not a very common pattern.

In an uptrend, the price finds its first resistance (1) which forms the left shoulder of the pattern.
As the price reverses, in a short increment, it finds its first support level (2), completing the formation of the left shoulder.
The price reverses and moves upward, it finds the second resistance (3), forming the head, which must be higher than the first resistance (1).
The price reverses and moves downward until it finds the second support (4), near the same price as the first support (2) completing the head formation.
The price reverses and moves upward until it finds the second resistance (5), which is near to the same price as the first resistance (1). This forms the right shoulder of the pattern.
The pattern completes when the price reverses direction, moving downward until it breaks out of the lower part of the right shoulder pattern (6).
Head & Shoulders Inverted
The head and shoulders Inverted, as the name suggests is an inverted version of the head and shoulders pattern. It indicates a reversal of direction (bullish) and is not a very common pattern.
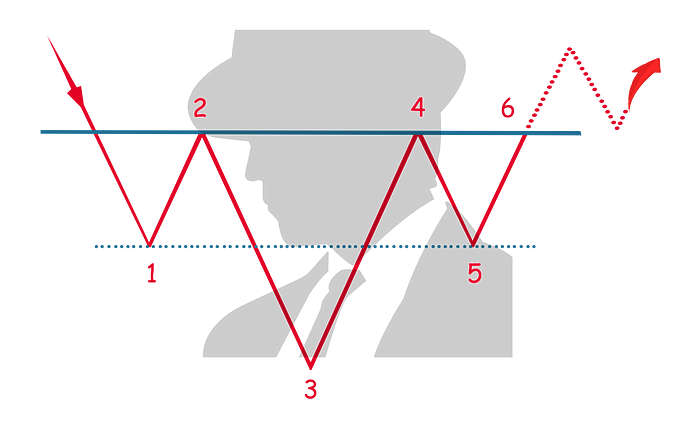
In a downtrend, the price finds its first support (1) which forms the left shoulder of the pattern.
As the price reverses, in a short increment, it finds its first resistance level (2), completing the formation of the (inverted) left shoulder.
The price reverses and moves downward, it finds the second support (3), forming the (inverted) head, which must be lower than the first support (1).
The price reverses and moves upward until it finds the second resistance (4), near to the same price as the first resistance (2) completing the (inverted) head formation.
The price reverses and moves downward until it finds the second support (5), which is near to the same price as the first support (1). This forms the (inverted) right shoulder of the pattern.
The pattern completes when the price reverses direction, moving upward until it breaks out of the higher part of the (inverted) right shoulder pattern (6).
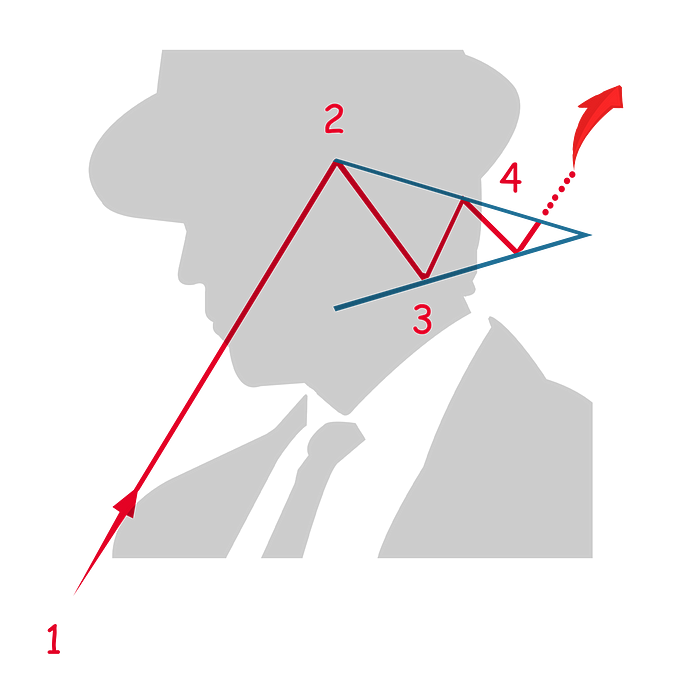
Cup & Handle
The cup and handle pattern indicates the continuation of a pattern and is a bullish indicator. It is not a very common pattern.
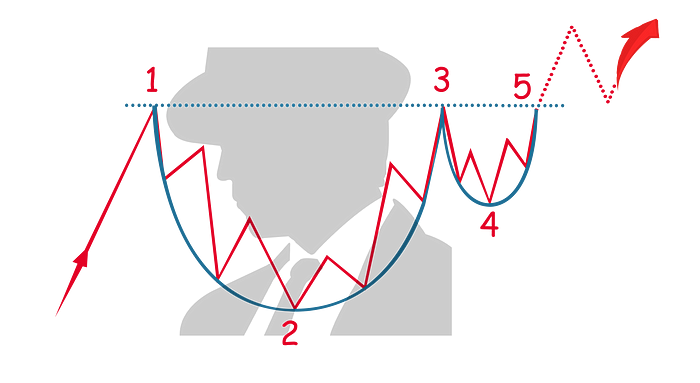
In an uptrend, the price finds its first resistance (1) which forms the edge of the cup pattern. The price reverses direction and in short increments and price reversals, finds its support (2), the lowest point in the pattern and forming the bottom of the cup.
The price direction reverses, moving upward in short increments until it finds the second resistance (3), which is at a similar level to the first level of resistance (1), completing the cup formation.
The handle formation is created when the price moves downward until it finds its support (4) which is higher than the first support level (2).
The pattern completes when the price movement reverses, moving upward (5) and breaks out of the cup and handle formation.
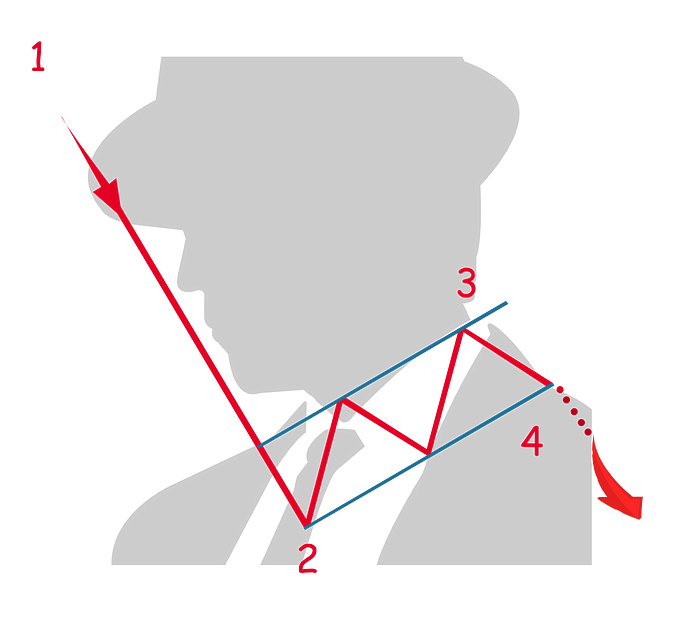
Cup & Handle Inverted
The cup and handle inverted pattern, as the name indicates is an inversion of the cup and handle pattern. This pattern indicates the continuation of a pattern and is a bearish indicator. It is not a very common pattern.

In a downtrend, the price finds its first support (1) which forms the edge of the (inverted) cup pattern. The price reverses direction and in short increments and price reversals, finds its resistance (2), the highest point in the pattern and forming the (inverted) bottom of the cup.
The price direction reverses, moving downward in short increments until it finds the second support (3), which is at a similar level to the first level of support (1), completing the (inverted) cup formation.
The handle formation is created when the price moves upward until it finds its resistance (4) which is lower than the first resistance level (2).
The pattern completes when the price movement reverses, moving downward (5) and breaking out of the (inverted) cup and handle formation.
Download the Cheat Sheet:
For easy reference, a high-resolution infographic has been provided.
Get your own copy and download this cheat sheet here
Utilizing Chart Patterns & Technical Analysis
Chart patterns and technical indicators are crucial tools in the analysis of cryptocurrencies and other financial markets. They help investors and traders to make educated decisions by providing insights into the market dynamics.
Here's a breakdown of how they are utilized in the realm of crypto investing:
Understanding Market Sentiment:
- Chart patterns reflect the collective psychological demeanor of market participants which is vital in understanding market trends. For example, patterns like Head and Shoulders, or Double Top/Bottom, can indicate a reversal in trend, reflecting shifts in market sentiment.
Trend Identification:
- Identifying the prevailing trend is fundamental in technical analysis. Patterns like flags and pennants, or indicators like Moving Averages, help in understanding whether a cryptocurrency is in an uptrend, downtrend, or a sideways trend.
Support and Resistance Levels:
- Both chart patterns and technical indicators help in identifying support and resistance levels which are crucial for entry and exit points. For instance, a breakout above a resistance level could signify a potential bullish run.
Predicting Future Price Movements:
- By analyzing historical price data, traders can use chart patterns and technical indicators to make educated predictions on future price movements.
Volume Analysis:
- Volume indicators provide insights into the strength or weakness of price movements. For instance, a price movement accompanied by high volume might signify a strong trend, which can be confirmed with other indicators or chart patterns.
Risk Management:
- By identifying potential reversal points and trend strengths, investors can set stop-loss and take-profit levels, which are crucial for risk management in the volatile crypto market.
Enhancing Trading Strategies:
- Combining chart patterns with technical indicators can refine trading strategies. For instance, using a combination of trend indicators with chart patterns can provide a more robust understanding of market conditions.
Confirmation:
- Utilizing both chart patterns and technical indicators can provide confirmation for trade setups. For example, a bullish chart pattern along with a bullish crossover in Moving Averages can provide stronger confirmation for a long position.
Historical Performance Analysis:
- Technical analysis allows for the evaluation of historical performance which can be used to fine-tune trading strategies for better performance in the crypto market.
Comparative Analysis:
- Comparing different cryptocurrencies or other altcoins through technical analysis can help in asset allocation and diversification.
In summary, chart patterns and technical indicators, when used effectively, can provide a robust framework for navigating the complexities of the cryptocurrency market, enabling better decision-making and potentially more profitable trading strategies.
You May Also Like:


)