Table of Contents
The Question
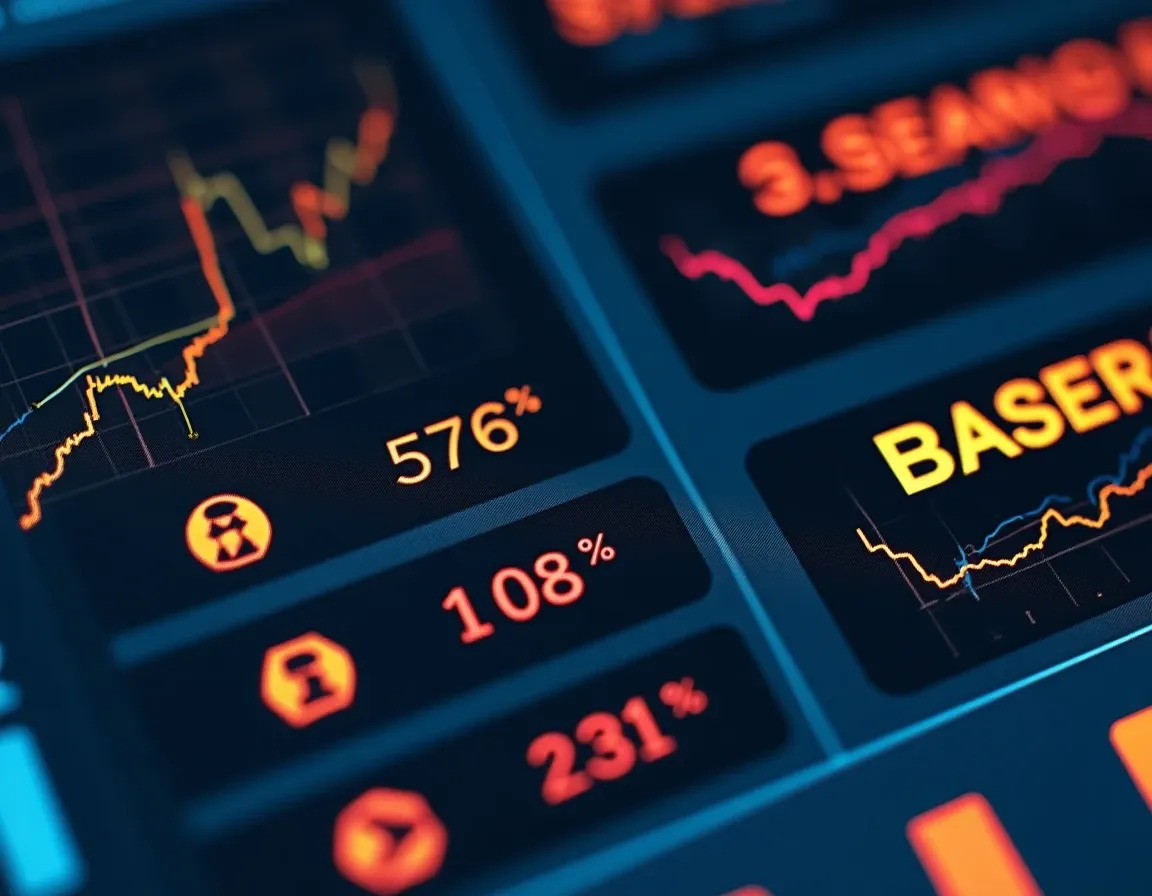
Copy trading platforms show you a leaderboard. You see a trader with 127% annual returns, a 68% win rate, and 2,400 followers. Should you allocate $5,000 to copy their signals?
Most people look at those three numbers and click "copy." That is how platforms want you to evaluate signals. It is also how you lose money.
The metrics that predict whether a signal provider will protect your capital appear further down the page, or not at all. Maximum drawdown, Sharpe ratio, trade count, and correlation matter more than headline returns. If you evaluate signals the way platforms present them, you are selecting for marketing, not performance.
The Four Metrics That Actually Matter
Cumulative return tells you what happened. The next four metrics tell you whether it will happen again, and at what cost.
Maximum Drawdown
Maximum drawdown measures the largest peak-to-trough loss during the track record. A trader with 120% annual returns and a 55% drawdown lost more than half their capital at least once. You need to know that before you copy them.
Drawdowns below 15% indicate capital preservation discipline. Drawdowns above 30% mean the trader has taken risks that, if repeated, could wipe out a meaningful portion of your allocation. If the trader recovered from a 50% drawdown, they doubled their remaining capital to get back to breakeven. You will need the same outcome just to avoid a loss.
Check whether the drawdown is current or historical. A trader sitting in a 22% drawdown right now is underwater. Copying them means entering at a loss unless they recover.
Sharpe Ratio
Sharpe ratio measures return per unit of volatility. A Sharpe above 2.0 is strong. Below 1.0 means the trader is not being compensated for the risk they are taking.
Most crypto traders ignore Sharpe because they do not come from finance. Platforms bury it for the same reason. But if you are choosing between two traders with similar returns, the one with the higher Sharpe delivers those returns with less volatility. That means smaller drawdowns, less emotional stress, and better odds that the system survives a bad month.
Sharpe does not tell you whether a strategy will keep working. It tells you whether the strategy has been efficient. Efficiency tends to persist longer than raw returns.
Sample Size
A trader showing 65% profitable trades over 40 trades has not proven anything. Variance explains that win rate. A trader showing 60% over 500 trades has demonstrated edge.
100 trades is the minimum threshold for usable data. 200 trades makes the data convincing. 500 trades gives you statistical significance. If the platform shows a trader with 30 trades and a 70% win rate, you are looking at noise, not skill.
Trade count also reveals consistency. A trader with 600 trades over six months is active and systematic. A trader with 80 trades over six months is discretionary, or inactive, or both. Discretionary traders are harder to evaluate because their decision process is not repeatable.
Trade Correlation and Strategy Diversity
If you copy three traders and all three open long positions on the same altcoin at the same time, you have not diversified. You have triple-leveraged one idea.
Platforms rarely show inter-trader correlation. You need to check it manually by reviewing recent trade history across the traders you are considering. Look for differences in assets traded, position duration, and directional bias. Copying one swing trader, one scalper, and one mean-reversion system reduces the chance that all three fail simultaneously.
If all your selected traders trade Bitcoin futures with similar leverage and hold times, you have allocated to one strategy, not three.
The Metrics Platforms Show That Do Not Matter

Leaderboards rank traders by metrics that look impressive and mean nothing.
Follower Count
2,400 followers does not validate a strategy. It validates marketing. A trader can attract followers by posting win screenshots on Twitter, running referral promotions, or simply appearing at the top of a default-sorted leaderboard.
Follower count also lags performance. A trader might have built their follower base during a winning streak that ended months ago. New followers copying them today are entering after the edge has decayed.
Win Rate
A 68% win rate sounds good until you realize the trader risks $500 to make $100. You can have a 90% win rate and still lose money if your average loss is larger than your average win.
Win rate becomes useful only when paired with average win size and average loss size. Platforms show win rate in isolation because it is easy to game. Close small winners quickly, let losers run, and your win rate stays high while your account bleeds.
Check whether the platform displays unrealized losses. Some traders hide open losing positions to inflate their win rate. If you see a 72% win rate but no closed-trade history, assume the trader is sitting on unrealized losses.
Short-Term Returns
A trader with +40% in the last 30 days might have caught one good trade, or taken excess risk that has not blown up yet. Short-term returns are the least predictive metric on the page.
Evaluate performance over at least six months, ideally 12. If the platform does not show 12-month history, the trader is either new or the platform is hiding a bad stretch.
How Copy Trading Platforms Mislead Retail
Platforms make money when you copy traders. They do not make money when you evaluate traders carefully and decide not to allocate. The interface is designed accordingly.
Leaderboard Sorting Defaults
Most platforms default-sort leaderboards by short-term return or follower count. Both metrics reward recency and popularity, not risk-adjusted performance. The traders at the top are the ones who performed well last month, or marketed themselves well, or both.
Re-sort by Sharpe ratio, maximum drawdown, or total trade count. The leaderboard will look completely different. The trader ranked #1 by 30-day return might rank #47 by Sharpe.
Hiding Open Losses
Some platforms show only closed trades in performance history. Open trades do not appear until they close. A trader can be sitting in a -30% unrealized loss while their closed-trade history shows steady profits.
Before you copy, check whether the platform displays open positions. If it does not, you are evaluating incomplete data. If the trader has five open positions, look at their entry prices and current prices. Unrealized loss is still loss.
Unannounced Strategy Changes
A trader builds a track record swing trading ETH, then switches to scalping altcoin futures at 20x leverage. Their historical performance reflects the old strategy. You are copying the new one.
Platforms are not required to notify you when a trader changes strategy, timeframe, or leverage. IOSCO has flagged unannounced strategy changes as a key investor risk in copy trading. Check recent trade history to confirm the trader is still executing the same approach that generated their performance.
If you see a sudden shift in trade frequency, position size, or asset class, the historical statistics no longer apply.
Performance Fees That Erase Returns
A trader generates 18% annual return. The platform charges 1% transaction fees per side, and the trader takes a 15% profit share. After fees, your net return is closer to 8%.
Platforms show gross returns, not net. Before you copy, calculate what you will actually keep. A high-frequency trader executing 200 trades per month will trigger transaction fees on every entry and exit. At 1% per side, that is 2% friction per round trip. Multiply by trade frequency and the headline return disappears.
Profit-sharing fees typically range from 10% to 20%. FXTM Invest and similar platforms charge performance fees only when you profit, but that fee comes out of your gross return. A 15% return minus a 15% performance fee leaves you with 12.75%, not 15%.
Execution Risk You Cannot See On The Leaderboard
Even if you select a profitable trader with low drawdown and strong Sharpe, you face execution risk that the leaderboard does not capture.
Slippage and Delay
Copy trading executes your orders on a slight delay after the lead trader. On liquid markets and small position sizes, the delay is negligible. On low-liquidity altcoins or large allocations, you may enter at a worse price than the lead trader.
If the lead trader market-buys 10 BTC and you copy with $5,000, your fill price will be similar. If the lead trader market-buys a low-cap altcoin with $50,000 of liquidity and 200 followers copy simultaneously, later orders fill at worse prices. The lead trader got in at $1.00, you got in at $1.03.
That 3% slippage repeats on every trade. Over 100 trades, it compounds into real performance drag.
Proportional Sizing Risk
Most platforms use proportional position sizing. If the lead trader risks 10% of their capital, you risk 10% of your allocated amount. That sounds fair until you realize the lead trader might have a $500,000 account and you have $5,000.
A 10% position for them is $50,000, diversified across other positions and strategies. A 10% position for you is $500, and if you are copying only one trader, it represents concentrated risk.
Proportional sizing also means you inherit the lead trader's risk tolerance. If they are comfortable with 20% positions, you will take 20% positions. That might exceed your risk capacity.
Platform and Regulatory Risk
Copy trading platforms are not uniformly regulated. Some operate under CFTC, SEC, or FINRA oversight. Others operate offshore with no meaningful regulatory framework.
Regulated platforms must disclose the percentage of retail accounts that lose money. That disclosure sets realistic expectations. Platforms operating outside major jurisdictions often do not publish that data.
Regulation does not eliminate risk. You can lose money copying a legitimate trader on a fully regulated platform. But regulation reduces fraud risk, custody risk, and the chance the platform disappears with your funds. If you are allocating $10,000, platform selection matters as much as trader selection.
For context, check whether the platform has transparent fee disclosure and verified performance data. Audited track records are harder to fake than leaderboard rankings.
Practical Evaluation For A $1,000 to $10,000 Allocation
If you are allocating between $1,000 and $10,000, you need a repeatable process that filters for durability, not headlines.
Step 1: Set Minimum Thresholds
Do not evaluate traders who fail these minimums:
- At least 200 closed trades (500 preferred)
- At least six months of performance history (12 preferred)
- Maximum drawdown below 25%
- Sharpe ratio above 1.5
- Verified track record with visible closed-trade history
These thresholds eliminate 80% of the leaderboard. That is the point.
Step 2: Check Recent Activity
Review the last 30 trades. Confirm the trader is still active, still trading the same strategy, and not sitting in large unrealized losses. If recent performance has diverged sharply from historical performance, something changed.
Look for consistency in position size, hold duration, and asset selection. A trader who historically swing-traded BTC and ETH, then suddenly started scalping low-cap altcoins, is running a different system. The old statistics do not apply.
Step 3: Calculate Net Return After Fees
Platforms charge transaction fees and performance fees. Lead traders take profit shares. Calculate what you actually keep.
If the platform charges 1% per side and the trader executes 50 round trips per month, you are paying 100% in transaction fees annually. Even a 20% gross return becomes a loss after fees.
For a $5,000 allocation, a 15% annual return is $750 gross. Subtract a 15% performance fee ($112.50) and transaction costs, and you might net $500 to $600. That is a 10% to 12% return, not 15%. Know the real number before you copy.
Step 4: Allocate Across Multiple Traders
Copying one trader concentrates all your risk in one system. If that trader has a bad quarter, your entire allocation suffers.
Allocate across at least two to three traders with different strategies. One swing trader, one trend follower, one mean reversion system. Check that they trade different assets or timeframes. Diversification reduces the chance that all three fail simultaneously.
If your allocation is $3,000, split it $1,000 per trader. If one trader hits a 20% drawdown, you lose $200, not $600.
Step 5: Set a Stop-Copy Rule
Decide in advance when you will stop copying. A trailing stop-copy rule protects you from strategy decay.
Example: stop copying if the trader's equity curve falls 15% from its peak, or if monthly return falls below -8% for two consecutive months. The specific thresholds matter less than having a rule and following it.
Most retail copiers hold through drawdowns because they hope for recovery. That works if the drawdown is temporary. It does not work if the strategy broke. A stop-copy rule forces you to exit before hope becomes a loss.
What Good Evaluation Looks Like
You are evaluating two traders on Bitget. Trader A has 180% annual return, 72% win rate, and 4,100 followers. Trader B has 48% annual return, 58% win rate, and 340 followers.
Default sorting puts Trader A at the top. You re-sort by Sharpe ratio. Trader A has a Sharpe of 0.9 and a maximum drawdown of 42%. Trader B has a Sharpe of 2.1 and a maximum drawdown of 11%.
You check trade count. Trader A has 67 trades over four months. Trader B has 410 trades over 14 months. You review recent activity. Trader A recently switched from swing trading to high-frequency scalping. Trader B has maintained consistent strategy and position sizing.
You calculate net return. Trader A's high trade frequency will trigger significant transaction fees. After 1% per side and a 12% performance fee, the 180% gross return might net 60% to 70%. Trader B's 48% return, after fees, nets roughly 35% to 38%.
Trader B has lower headline returns, but better risk-adjusted performance, larger sample size, and more consistent execution. You copy Trader B.
That is what evaluation looks like when you ignore the leaderboard defaults and focus on durability. If you approach copy trading like evaluating a trading bot, you filter for systems that survive, not systems that market well.
Common Scam Patterns To Avoid
Some signal providers are not traders. They are marketers running a scam with a performance veneer.
Unverifiable Track Records
A signal provider advertises 120% annual returns with screenshots and spreadsheets. They do not provide live account access or audited statements. You cannot independently verify the performance.
If the performance is not verifiable on the platform where you would copy it, assume it is fake. Real performance appears in real-time on a live leaderboard with closed-trade history.
Strategy Changes Without Notice
A trader builds credibility with conservative swing trading, attracts followers, then switches to high-risk speculation. Followers copy based on the old strategy but are now exposed to the new one.
IOSCO has identified unannounced strategy changes as a primary investor risk in copy trading. Check recent trades to confirm the current strategy matches the historical performance.
Hiding Unrealized Losses
A trader closes all winning positions immediately and leaves losing positions open. Their closed-trade win rate stays high while their account sits in deep unrealized loss.
Check open positions before copying. If the trader has multiple open losers and few open winners, they are managing optics, not risk.
When Copy Trading Makes Sense
Copy trading is not passive income. It is outsourced execution. You still need to evaluate strategy, monitor performance, and manage risk.
It makes sense when you lack the time or skill to trade actively but understand enough to evaluate traders properly. It makes sense when you can allocate enough capital that fees do not erase returns. For a $1,000 allocation, transaction fees and profit sharing will eat a large percentage of gross returns. For $5,000 to $10,000, the economics improve.
It does not make sense if you evaluate traders by follower count and recent returns. That selection process optimizes for marketing, and marketing does not predict performance.
If you treat copy trading like yield evaluation, you ask the same questions: What is the source of return? Is it sustainable? What is the risk? What happens in the worst case?
The Takeaway
The traders at the top of the leaderboard are optimized for visibility, not durability. Maximum drawdown, Sharpe ratio, and sample size predict whether a signal provider will protect your capital better than headline returns or follower counts. If you allocate to copy trading, re-sort the leaderboard by risk-adjusted metrics, verify the track record includes closed trades and visible open positions, calculate net return after all fees, and set a stop-copy rule before you start. The platforms want you to copy based on 30-day returns. Do not.
Frequently Asked Questions
What is the minimum number of trades needed to evaluate a copy trading signal?
100 trades is the minimum threshold for usable data, but it is not sufficient for confidence. At 200 trades the data becomes convincing, and at 500 trades you have strong statistical significance. A trader showing a 65% win rate over 40 trades has not proven edge, just variance. Sample size matters more than win rate because small samples are dominated by luck, not skill. Always check total trade count before evaluating any other performance metric.
Why does maximum drawdown matter more than total return?
Maximum drawdown shows the largest peak-to-trough loss a trader experienced. A 120% return with a 55% drawdown means the trader lost more than half their capital at some point. If that drawdown repeats, you lose half your allocation. Drawdowns above 30% indicate risk-taking that can destroy capital. Recovery from a 50% loss requires a 100% gain just to break even. Traders with drawdowns below 15% demonstrate capital preservation discipline that tends to persist.
How do copy trading fees reduce actual returns?
Platforms charge transaction fees, typically 1% per side, and traders take profit-sharing fees ranging from 10% to 20%. A trader generating 18% gross return might net you only 8% after a 1% transaction fee per trade and a 15% performance fee. High-frequency traders executing 50 round trips monthly trigger 100% in annual transaction costs. Always calculate net return after all fees before copying. Platforms display gross performance, but you earn net performance.
What is a Sharpe ratio and why should I care?
Sharpe ratio measures return per unit of volatility. A Sharpe above 2.0 is strong; below 1.0 means the trader is not being compensated for the risk taken. Two traders with 50% annual returns can have very different Sharpe ratios depending on volatility. The higher-Sharpe trader delivers returns with less dramatic swings, smaller drawdowns, and better odds the system survives a bad month. Sharpe is a durability metric that platforms bury because it does not create excitement.
Should I copy traders with high follower counts?
No. Follower count reflects marketing effectiveness, not trading skill. A trader can build a large following by posting win screenshots, running referral promotions, or ranking high on a default-sorted leaderboard. Follower counts also lag performance, meaning a trader may have attracted followers during a winning streak that ended months ago. Evaluate traders by maximum drawdown, Sharpe ratio, and sample size instead. Ignore follower count entirely unless you are studying how platforms manipulate retail behavior.
You now have a framework that filters for drawdown, Sharpe, and sample size instead of follower counts. Those metrics change as strategies decay.
Every Thursday: where crypto yield actually is - stablecoins, liquid staking and DeFi lending, with the risk named next to the rate and what changed since last week.
Get it free every ThursdayFree. No trade calls, no allocations, no hype. Unsubscribe in one click.