Table of Contents
The Question: Can Jupiter Lend's 6.31% USDC Rate Hold?
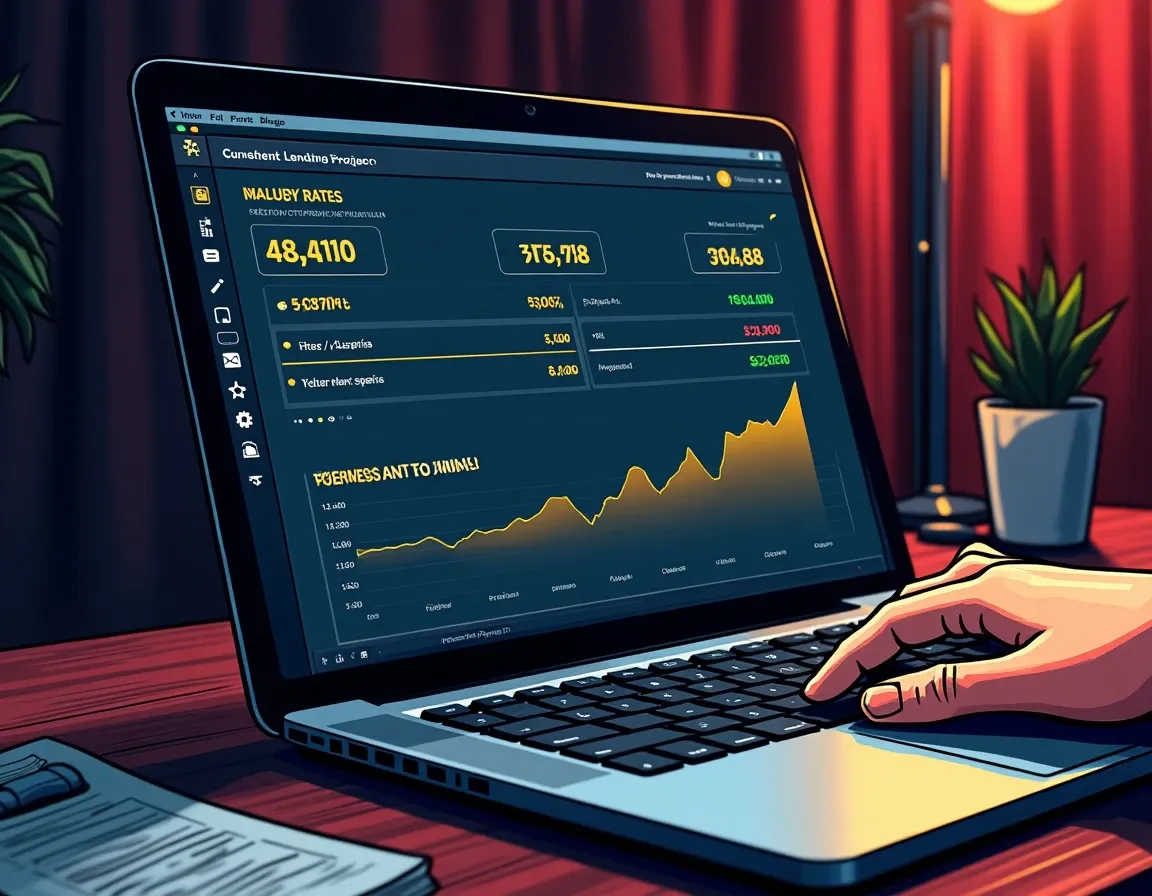
Jupiter Lend's USDC pool is currently offering 6.31% APY on approximately $497 million in deposits, up 1.16 percentage points from the prior week. Total value locked across Jupiter Lend sits at $1.112 billion, making it the ninth-largest lending protocol tracked by DefiLlama and the largest on Solana by a narrow margin over Kamino.
The question is not whether 6.31% looks attractive. It does.
The question is whether that rate reflects sustainable organic demand for borrowed USDC or whether it is inflated by temporary arbitrage, token emissions, or utilization spikes that will collapse within 30 to 90 days. If you allocate $50,000 into a position paying 6.31% and the rate drops to 3.2% two months later, you have earned approximately $525 instead of the $1,577 you modeled. If you sized the position as stable income and it becomes unstable, your allocation framework breaks.
This piece walks through the specific quantitative tests that separate stable 6%+ positions worth large allocation from incentive-pumped rates that will collapse. The framework applies to any on-chain lending rate, but we will use Jupiter Lend's current USDC position as the worked example.
How Lending Rates Actually Work: Utilization Curves and Revenue Sources

Most on-chain lending markets use variable interest rates determined by utilization thresholds. Utilization is defined as the ratio of borrowed funds to available liquidity. When 80% of deposited USDC is borrowed, utilization is 80%. When utilization rises, rates rise. When utilization falls, rates fall.
The protocol sets the curve. A typical curve might look like this: 2% APY at 0% utilization, 5% APY at 50% utilization, 8% APY at 80% utilization, and 25% APY at 95% utilization. The exact shape varies by protocol and by asset, but the mechanism is consistent across Aave, Compound, Kamino, and Jupiter Lend.
A 6.31% USDC rate implies utilization in the 70% to 85% range, depending on Jupiter's specific curve parameters. That is not unusual, but it is material. Rates below 4% typically correspond to utilization below 60%. Rates above 6% typically correspond to utilization above 75%.
The second variable is the source of the yield itself. Organic lending yield comes from interest paid by borrowers who are using that capital for leveraged positions, arbitrage, or liquidity provision elsewhere. Subsidized yield comes from protocol token emissions, fee rebates, or stacked rewards from external integrations. Jupiter Lend's architecture includes both.
Jupiter Lend v2, launched in August 2024, introduced Smart Collateral and Smart Debt features that allow deposited and borrowed assets to earn trading fees from decentralized exchange liquidity while simultaneously functioning as lending collateral. This means a depositor supplying USDC can earn the base lending rate plus a share of trading fees generated when that USDC is routed through Jupiter's exchange aggregator. Borrowers can also earn fees on borrowed assets, which offsets their borrowing cost.
That design is innovative, but it complicates the sustainability analysis. If the stated 6.31% rate includes both lending spread and trading fee pass-through, the lending component might be 4.5% and the trading component might be 1.8%. The lending component is driven by utilization and borrower demand. The trading component is driven by DEX volume and routing behavior, which fluctuates with market conditions.
Distinguishing between these two sources is the first step in the evaluation framework.
Jupiter's Fee and Emission Structure
Over the past 30 days, Jupiter Lend generated $4.11 million in fees, of which $207,241 was retained as protocol revenue. The remainder was distributed to liquidity providers, borrowers, and depositors through the Smart Collateral mechanism.
Jupiter's DAO has also proposed a plan to reduce net token emissions to near zero by indefinitely suspending releases from the Team Reserve, having the treasury absorb any sales of unlocked team tokens, and indefinitely postponing the "Jupuary" airdrop. If this proposal has been implemented, token emissions are no longer a meaningful subsidy to yields. If it has not yet passed or been executed, emissions remain a risk factor.
The protocol allocates 50% of on-chain revenue to open market buybacks of the JUP token. This means that of the $207,241 monthly protocol revenue, approximately $103,000 goes to buybacks and the remainder funds protocol operations or reserves. This structure does not directly subsidize lending yields, but it does mean the protocol's revenue retention is limited. That matters for long-term sustainability.
Jupiter Lend charges no fees to users of the Earn Protocol and offers flash loans with no fees. This is user-friendly, but it limits the protocol's ability to capture revenue from the deposit side of the market. Revenue comes primarily from the spread between borrowing and lending rates, plus trading fee pass-through from the Smart Collateral mechanism.
The Sustainability Test: Four Quantitative Checks
To determine whether a 6.31% USDC rate is stable or temporary, run four tests: utilization history, borrower composition, emission contribution, and exit liquidity depth.
Test One: Utilization History Over 90 Days
Request or chart the weekly utilization rate for Jupiter Lend's USDC pool over the past 90 days. If utilization has been stable between 70% and 85% for most of that period, the current rate is likely stable. If utilization spiked from 55% to 85% in the past two weeks, the rate is likely temporary.
Elevated utilization can be driven by short-term arbitrage opportunities, leverage farming campaigns, or liquidation cascades in other protocols that push borrowers to Jupiter. These drivers are not sustainable. Stable utilization above 75% is unusual in stablecoin lending markets outside of periods of sector-wide capital stress. During November and December 2024, Aave's stablecoin utilization rose above 95%, pushing variable borrow rates above 40%. Those conditions lasted approximately six weeks before normalizing.
If Jupiter's current 6.31% rate corresponds to utilization above 80% and that utilization level is recent, model the rate at 4.5% to 5.2% for allocation purposes.
Test Two: Borrower Composition and Concentration
Who is borrowing? If the top 10 borrowing addresses account for more than 40% of total borrowed USDC, the rate is vulnerable to sudden drops when those positions close. If borrowing is distributed across hundreds of smaller positions, the rate is more stable.
This data is available on-chain but requires block explorer analysis or third-party dashboards. Request borrower concentration metrics from Jupiter's documentation or community analytics channels. High concentration indicates that a small number of large positions are driving utilization, which means those positions closing will drop utilization and rates sharply.
Borrower behavior also matters. Are borrowers using USDC for leveraged SOL positions, for yield looping (borrowing USDC to deposit more USDC and amplify returns), or for external arbitrage? Leveraged SOL positions are directional bets that will close when SOL price moves. Yield looping is recursive and collapses when the loop becomes unprofitable. External arbitrage is temporary by definition. None of these are sustainable long-term borrowing demand.
Sustainable borrowing demand comes from market makers who need stablecoin inventory, from structured products that borrow stablecoins to deploy into other yield strategies, and from credit-based use cases where borrowers are financing real economic activity. Those categories are rare in crypto lending markets, but they exist.
Test Three: Token Emission Contribution
Verify whether any portion of the 6.31% rate is funded by JUP token emissions. If the Going Green proposal to eliminate net emissions has been fully implemented, token emissions are not a factor. If the proposal is pending or partially implemented, emissions may still be subsidizing yields.
Cross-reference the stated 6.31% USDC rate with the protocol's emission schedule and reward distribution. If Jupiter is distributing JUP tokens to USDC depositors as an incentive, those tokens must be valued at a reasonable discount to spot price because they cannot be sold immediately without slippage. A 1% APY token reward is worth approximately 0.6% to 0.8% in realized income after accounting for vesting, slippage, and tax treatment.
If token emissions contribute more than 1 percentage point to the stated rate, the organic lending rate is closer to 5.3% or lower. Model that as the sustainable baseline.
Test Four: Exit Liquidity Depth
How much USDC can you withdraw before utilization constraints bind? If the pool holds $497 million in deposits and utilization is 80%, approximately $99 million is available for withdrawal before utilization hits 100% and withdrawals are temporarily blocked.
Test exit depth by modeling a 10% and 25% withdrawal scenario. If you hold a $100,000 position and 25% of depositors attempt to withdraw simultaneously, does the protocol have sufficient liquidity to process your withdrawal without delay? If not, the position carries liquidity risk that offsets the yield advantage.
Jupiter Lend's total USDC pool is large enough that a $100,000 position is immaterial to overall liquidity. But if you are considering a $5 million allocation, you are now 1% of the pool and your exit could move utilization meaningfully. Size your position so that your withdrawal represents less than 5% of available liquidity.
Comparative Context: Solana Lending Sector and Historical Rate Stability
Jupiter Lend's $1.112 billion TVL represents approximately 41% of Solana's total lending market, which now exceeds $2.7 billion. Kamino holds the other major position at approximately $1.40 billion TVL as of early October, though that figure has fluctuated between $1.2 billion and $1.5 billion over the past 90 days.
Jupiter's TVL has been more volatile than Kamino's. Over the past three months, Jupiter's TVL ranged from $0.8 billion to $1.41 billion, a swing of more than 70%. Kamino's TVL has remained within a 20% band during the same period. Higher TVL volatility indicates that Jupiter is attracting more short-term capital and rate-chasing depositors, which suggests higher rate instability.
Kamino's USDC rate has historically been 20 to 40 basis points lower than Jupiter's during periods of comparable utilization. If Kamino is currently offering 5.8% on USDC and Jupiter is offering 6.31%, the 51-basis-point spread may reflect Jupiter's Smart Collateral trading fee component or temporary utilization premium.
Over the past six months, Solana stablecoin lending rates have ranged from 3.2% to 7.1% across all major protocols. Rates below 4% correspond to low-utilization environments with minimal leverage activity. Rates above 6% correspond to elevated utilization driven by short-term arbitrage or sector-wide capital stress. The current 6.31% rate is at the high end of the historical range, which suggests it is more likely to compress than to expand.
When 6.31% Is Worth Large Allocation
Allocate large capital into Jupiter Lend's USDC pool at 6.31% if the following conditions hold:
Utilization has been stable between 70% and 85% for at least 60 days. Borrower concentration is below 40% for the top 10 addresses. Token emissions contribute less than 0.5 percentage points to the stated rate. Available liquidity exceeds 20% of total deposits, meaning your withdrawal will not materially impact utilization.
Under those conditions, model the rate as 5.8% to 6.1% for the next 90 days and size the position as stable income. A $100,000 allocation at 5.9% APY generates $5,900 annually or $1,475 per quarter, which is predictable enough to support income planning.
When 6.31% Is Likely Temporary
Treat the 6.31% rate as temporary if utilization spiked in the past 14 days, if borrower concentration exceeds 50%, if token emissions contribute more than 1 percentage point, or if the rate is more than 75 basis points above Kamino's comparable USDC rate without a clear structural explanation.
Under those conditions, model the rate at 4.2% to 5.0% for allocation purposes and size the position as variable-rate exposure. Do not commit capital you need for predictable income streams. Treat the position as short-term yield capture and monitor utilization weekly.
Practical Allocation Framework
If you are evaluating a Jupiter Lend USDC position for the first time, start with a 10% allocation of your intended position size and monitor for 14 days. If the rate holds within 40 basis points of 6.31% during that period, increase to 50% of intended size. If the rate holds for another 30 days, increase to full size.
This staged approach costs you approximately 60 basis points in foregone yield if the rate proves stable, but it protects you from allocating $100,000 into a position that drops to 4.1% yield within 45 days. The cost of caution is $150 in foregone income. The cost of premature allocation is $550 in foregone yield from a better-timed entry or alternative deployment.
Set a rate floor. If Jupiter's USDC rate drops below 5.0%, withdraw and redeploy into stablecoin income alternatives that offer comparable or better risk-adjusted returns. A 5.0% floor ensures you are not holding a position for diminishing returns when better opportunities exist elsewhere.
Monitor weekly. Check utilization, borrowing concentration, and protocol fee generation every seven days. If utilization drops below 60% for two consecutive weeks, model the rate at 4.5% going forward. If borrowing concentration rises above 60%, reduce position size by half.
The Risks Jupiter Lend Carries That Other Protocols Do Not
Jupiter Lend offers loan-to-value ratios of 90%, compared to approximately 75% on most other lending protocols. Higher LTV ratios are attractive to borrowers because they allow more leverage per unit of collateral, but they increase liquidation risk for depositors. In a sharp SOL price decline, 90% LTV positions liquidate faster than 75% LTV positions, which can create cascading liquidations that drain available liquidity and temporarily block withdrawals.
The Smart Collateral and Smart Debt features add complexity. Your deposit earns lending yield plus trading fees, but the trading fee component is variable and depends on DEX routing volume. During low-volatility periods or market downturns, trading volume drops and the fee component compresses. This means the stated 6.31% rate may include a 1.5% trading fee component that drops to 0.4% when volume declines, leaving you with a 4.8% to 5.2% net rate.
Jupiter Lend's TVL volatility is higher than Kamino's, which suggests the platform attracts more short-term capital. When short-term capital exits, rates drop sharply. If you are holding a position sized for stable income and rates compress by 150 basis points in 30 days, your income forecast breaks.
The protocol's limited revenue retention also matters. With 50% of protocol revenue going to token buybacks and no user fees on deposits, Jupiter has less financial cushion to stabilize rates during periods of low utilization. Protocols with stronger revenue retention can subsidize rates temporarily to maintain depositor confidence. Jupiter cannot do that at scale.
The Takeaway
Jupiter Lend's 6.31% USDC rate is attractive, but sustainability depends on four variables you can measure: utilization stability over 90 days, borrower concentration below 40%, token emission contribution below 0.5 percentage points, and exit liquidity depth above 20% of total deposits. If those conditions hold, the rate is likely stable between 5.8% and 6.1% for the next quarter and worth large allocation. If utilization spiked recently, borrower concentration is high, or the rate includes material trading fee pass-through from variable DEX volume, model the rate at 4.5% to 5.2% and size the position as temporary yield capture. The difference between a stable 6% position and a collapsing 4.2% position is $900 annually on a $50,000 allocation. Run the four tests before you commit capital.
Frequently Asked Questions
What utilization rate does Jupiter Lend's 6.31% USDC rate indicate?
A 6.31% USDC rate typically corresponds to utilization between 70% and 85%, depending on the protocol's specific interest rate curve. Rates below 4% usually indicate utilization below 60%, while rates above 6% suggest utilization above 75%. Higher utilization drives higher rates because less capital is available to borrow, creating supply constraint. Check Jupiter Lend's current utilization on DefiLlama or the protocol dashboard to verify whether this rate reflects stable demand or a temporary spike.
How do Jupiter Lend's Smart Collateral and Smart Debt features affect the stated yield?
Jupiter Lend v2 allows deposited and borrowed assets to earn trading fees from DEX routing while functioning as lending collateral. This means the stated 6.31% rate may include both the base lending spread (driven by borrower interest payments) and a variable trading fee component (driven by Jupiter DEX volume). If DEX volume drops during low-volatility periods, the trading fee component compresses, potentially reducing the effective rate by 1 to 2 percentage points. Verify whether the rate you see is lending-only or includes stacked trading fees.
What borrower concentration level indicates a stable rate?
If the top 10 borrowing addresses account for less than 40% of total borrowed USDC, the rate is more stable because it reflects distributed demand. If concentration exceeds 50%, a few large positions are driving utilization, and their closure will cause the rate to drop sharply. Check on-chain borrower data using block explorers or protocol analytics dashboards. High concentration indicates temporary demand from leverage farmers or arbitrageurs who will close positions quickly, making the rate unsustainable.
How does Jupiter Lend's 90% LTV ratio affect depositor risk?
Jupiter Lend offers 90% loan-to-value ratios compared to 75% on most lending protocols. Higher LTV allows borrowers to use less collateral per dollar borrowed, increasing leverage. This increases liquidation risk for depositors because positions liquidate faster during collateral price declines, potentially creating cascading liquidations that drain available liquidity and temporarily block withdrawals. If you hold a large USDC position on Jupiter, monitor SOL and other collateral asset volatility closely, as sharp price drops trigger more liquidations at 90% LTV than at 75% LTV.
What rate floor should trigger reallocation from Jupiter Lend USDC?
Set a 5.0% rate floor. If Jupiter's USDC rate drops below 5.0%, the risk-adjusted return no longer justifies the platform-specific risks (high LTV liquidation risk, TVL volatility, variable Smart Collateral fees). At that point, alternative stablecoin lending opportunities on Aave, Compound, or other Solana protocols may offer better risk-adjusted returns. Monitor the rate weekly and execute reallocation within 48 hours if the floor is breached, as rates below 5% often indicate collapsing utilization that will continue downward.
You just reviewed four quantitative tests to evaluate a 6.31% rate that may drop to 4.2% next month. Those thresholds will shift as utilization and borrower composition change weekly.
Every Thursday: where crypto yield actually is - stablecoins, liquid staking and DeFi lending, with the risk named next to the rate and what changed since last week.
Get it free every ThursdayFree. No trade calls, no allocations, no hype. Unsubscribe in one click.