Table of Contents
The Question That Separates Prepared Investors From Surprised Ones
A protocol advertises 40% APY on staking. You allocate capital. Three months later, the token has declined 35%, erasing any yield you earned and then some. What you missed was the vesting schedule. A cliff unlock released 15% of total supply to early investors on a single day, and most of them sold within 48 hours.
The question worth answering is this: how do you read a token vesting schedule to predict when large supplies will hit the market, and how do you verify those schedules on-chain when project documentation is incomplete or misleading?
Token vesting schedules control when locked tokens become tradable. Teams, investors, and advisors typically receive allocations subject to multi-year vesting periods with cliff dates and linear release mechanisms. When those locks expire, new supply enters circulation. If the release is large relative to existing circulating supply, sell pressure follows. If you are staking or providing liquidity in that token, the yield you earn can be erased by price declines tied to predictable unlock events you could have anticipated.
The European Precedent: Why This Matters Beyond Token Mechanics

The dynamic at work here is not new. It is a supply shock, and monetary history has seen versions of this pattern for centuries. When the Banque de France suspended gold convertibility in 1936, the immediate effect was not inflation but the anticipation of inflation. Traders positioned ahead of the policy change, and by the time the suspension was official, the franc had already declined. The event itself mattered less than the foreknowledge that it was coming.
Token unlocks function the same way. The unlock date is public information, encoded in smart contracts or disclosed in documentation. The sell pressure begins before the unlock itself, as traders anticipate the new supply and position accordingly. By the time the tokens actually unlock, the price has often already adjusted downward.
The 2011-2012 eurozone sovereign debt crisis offers another parallel. Greek bond yields spiked not when Greece defaulted but when it became clear that a default was probable. The market priced in the future event long before it occurred. Vesting schedules give you the same kind of forward visibility. If you know a 10% supply increase is scheduled in six weeks, and you know who is receiving those tokens, you can estimate the likely sell pressure and adjust your position before the market reprices the asset.
How Vesting Schedules Are Structured
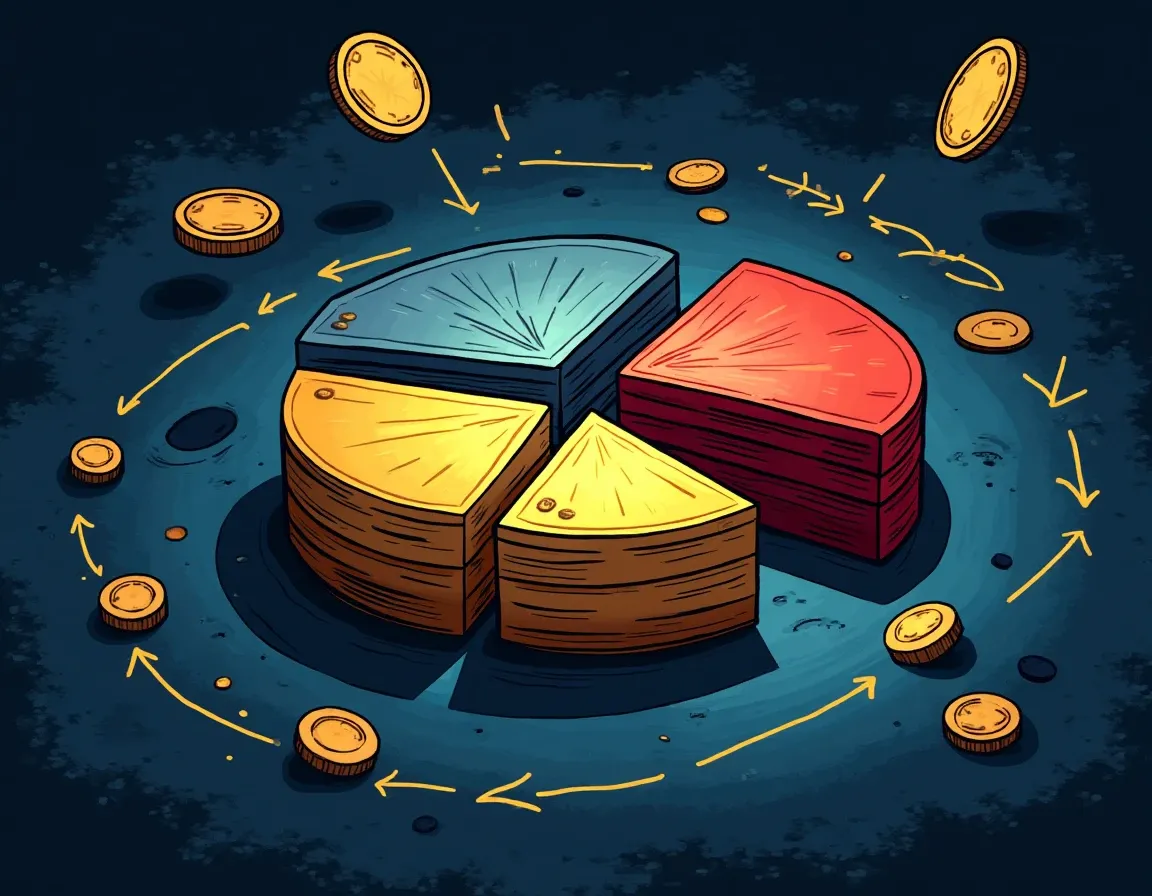
The most common vesting structure for team and early investor tokens follows a pattern that has become industry standard: a cliff period during which zero tokens are tradable, followed by a linear or monthly release over a multi-year period.
Team and founder allocations typically have 0% unlocked at token generation event (TGE), a 12-month cliff, and then a 36-month linear vesting period. Total duration: four years. During the first 12 months, none of those tokens can be sold. After the cliff, tokens unlock gradually, either monthly or continuously, until the full allocation is tradable.
Seed investors usually receive 5-10% of their allocation at TGE, face a 6-month cliff, and then vest over 18-24 months. Private sale participants get 10-15% at TGE, a 3-month cliff, and vest over 12-18 months. Public sale buyers receive 20-50% at TGE, no cliff, and vest over 6-12 months.
The structure reflects risk and lockup duration. The earlier the capital, the longer the vesting period and the stricter the cliff. Public buyers get immediate liquidity because they paid closer to market price and took execution risk.
What matters for sell pressure prediction is not the total vesting period but the size and timing of individual unlock events relative to circulating supply. A 5% unlock when 80% of tokens are already circulating has minimal impact. A 10% unlock when only 20% is circulating can move the market 15-30% in the week surrounding the event.
Cliff vs. Linear Release Patterns
There are two primary unlock mechanisms: cliff unlocks and linear vesting.
A cliff unlock releases a large block of tokens on a single date. If a project allocated 10 million tokens to seed investors with a 12-month cliff, all 10 million become tradable on the same day. That creates a predictable, concentrated sell pressure event. Even if not all recipients sell immediately, the market anticipates that some will, and prices adjust downward ahead of the unlock.
Linear vesting distributes the same 10 million tokens gradually. Instead of unlocking all at once, the contract might release approximately 27,000 tokens per day over the year following the cliff. Each daily release is negligible relative to trading volume, so sell pressure is diluted across time. The total supply increase is identical, but the market impact is far smaller.
Projects with smooth unlock curves, where no single month adds more than 2-3% to circulating supply, show better price stability than projects with large monthly cliff events. Historical data from DefiLlama's unlock tracker shows that tokens with lumpy unlock schedules experience 15-40% price declines in the 30 days surrounding major unlock events, while tokens with linear vesting schedules show no consistent correlation between unlock dates and price movement.
How to Verify Vesting Schedules On-Chain
Project websites and whitepapers are weak evidence. Teams can publish outdated schedules, omit details about admin controls, or describe vesting mechanisms that do not match what the smart contract actually enforces. The only reliable source is the blockchain itself.
On Ethereum and EVM-compatible chains, vesting is typically enforced by a separate smart contract that holds the locked tokens and releases them according to predefined rules. You can verify these contracts directly using Etherscan or equivalent block explorers.
Step-by-Step On-Chain Verification
First, locate the token contract address. This is public information, listed on CoinGecko, the project website, or the token's official documentation. Open the contract in Etherscan.
Second, check the contract's transaction history and holder distribution. If large amounts of tokens are held by a small number of addresses, those are likely vesting contracts, team wallets, or exchange reserves. Identify the largest holders.
Third, examine each large holder address. If it is a contract, open it and read the verified source code. Look for functions named `release`, `withdraw`, or `claim`, and check the logic that controls when those functions can be executed. The contract will specify a start date, a cliff duration, and a vesting duration. These parameters are the ground truth.
Fourth, verify whether the vesting contract has admin controls. Some contracts include functions like `setVestingSchedule` or `accelerateVesting` that allow the contract owner to modify terms after deployment. If those functions exist, the vesting schedule is not truly immutable, and the project could bypass locks.
Fifth, check for upgrade mechanisms. If the contract uses a proxy pattern (common with OpenZeppelin's upgradeable contracts), the underlying logic can be changed by the contract admin. That means the vesting schedule you read today could be altered tomorrow without any on-chain evidence until after the change is made.
Red Flags That Indicate Fake or Bypassable Vesting
A vesting chart on a project website is only credible if the token contract lacks mint controls, hidden admin permissions, transfer restrictions, blacklist functions, or upgrade paths that can bypass the locks. If any of those exist, the vesting schedule is unenforceable.
Fake vesting is common. A project publishes a four-year vesting chart for the team allocation but retains a `mint` function that can create new tokens and send them to any address. The vesting schedule is real for the tokens currently locked, but meaningless if the team can mint additional tokens outside the vesting contract.
Another pattern: the vesting contract enforces a schedule, but the token contract includes a `pause` function that prevents all transfers except those initiated by the contract owner. The team's tokens are technically locked, but they control who can trade and when. That is not vesting; it is administrative discretion dressed up as a schedule.
If you cannot verify the vesting schedule on-chain, or if the contract includes admin overrides, treat the published schedule as aspirational rather than binding.
How to Estimate Sell Pressure From Unlock Events
Not all unlocks create equal sell pressure. The impact depends on three factors: the size of the unlock relative to circulating supply, the identity of the recipients, and the token's existing liquidity.
Size Relative to Circulating Supply
A single unlock releasing 5% or more of circulating supply typically creates 5-15% sell pressure within 48 hours. That is the historical median from high-liquidity tokens tracked by Token Unlocks and DefiLlama. For lower-liquidity tokens, the impact can be larger.
The calculation is straightforward. If circulating supply is 100 million tokens and an unlock releases 10 million tokens to early investors, that is a 10% supply increase. If those investors sell even 30% of their allocation within the first week, that is 3 million tokens hitting the market. Compare that to the token's average daily trading volume. If daily volume is 2 million tokens, a 3 million token sell-off over a few days will overwhelm bid liquidity and push the price down.
Identity of the Recipients
Team and investor unlocks create more sell pressure than community or ecosystem unlocks. Early investors are profit-takers. They bought at a fraction of the current price, and many will liquidate at least a portion of their allocation to realize gains. Community airdrops and ecosystem grants are often distributed to users who are already engaged with the protocol, and their selling behavior is less predictable and more gradual.
Before acting on unlock data, verify who is receiving the unlocked tokens. If the unlock goes to a foundation wallet or an ecosystem fund, it may not hit the market immediately. If it goes to a known venture capital address or an early investor multisig, anticipate sell pressure.
Liquidity Depth
The same unlock event has different impacts depending on the token's existing liquidity. A 5% supply increase in a token with deep order books and $50 million daily volume is absorbed easily. The same 5% increase in a token with $2 million daily volume can cause a 20% price drop.
Check the token's liquidity on major decentralized exchanges and centralized order books. If the majority of liquidity is concentrated in one or two pools, and the unlock is large relative to that liquidity, expect volatility.
Combining Vesting Data With Emission Schedules
Vesting unlocks are only one source of new supply. Many tokens also have programmatic emissions, issuing new tokens as staking rewards, liquidity mining incentives, or validator payouts. To predict total sell pressure, you need to layer vesting unlocks on top of emission schedules.
If a token emits 2% of supply per month as staking rewards, and a vesting unlock adds another 5% in a single month, the combined supply increase is 7%. That is the total new supply hitting the market. If the token is not deflationary (burning tokens or removing them from circulation), that 7% will dilute existing holders unless demand increases proportionally.
Tools like Token Terminal and DefiLlama provide emission data alongside unlock schedules, allowing you to build a complete supply pressure timeline. For staking positions, this is critical. A 30% APY staking yield is not attractive if the token inflates 40% per year through combined emissions and unlocks. Your nominal yield is positive, but your real return is negative.
When Vesting Schedules Matter Most for Yield Positions
If you are providing liquidity or staking in a token with upcoming unlocks, the vesting schedule determines whether your yield position is sustainable.
Large unlocks depress token prices, which reduces the dollar value of your staking rewards even if the APY percentage remains unchanged. If you stake 10,000 tokens earning 40% APY, you will receive 4,000 tokens over the year. If the token price declines 30% due to unlock-related sell pressure, your 4,000 tokens are worth 30% less in dollar terms. Your effective yield is closer to 8%, not 40%.
The same applies to liquidity provision. If you are providing liquidity in a token pair and one side of the pair experiences a large unlock, the price imbalance creates impermanent loss. The fees you earn from swaps may not compensate for the loss from price divergence.
The optimal strategy is to avoid entering yield positions immediately before large unlocks and to consider exiting or reducing exposure in the weeks leading up to a major cliff event. The yield you earn in the interim is unlikely to offset the price impact.
How to Access and Interpret Unlock Data
Several free tools aggregate vesting and unlock data. DefiLlama's unlock tracker monitors over 500 protocols, showing upcoming unlock dates, amounts, and historical price impact. Token Unlocks and Tokenomist provide similar data with calendar views and impact estimates.
When using these tools, verify the data against on-chain sources. Aggregators rely on project-submitted information, which can be outdated or incomplete. Cross-reference the unlock schedule with the vesting contract itself.
Check whether unlocked tokens go to a wallet or directly to an exchange. Tokens transferred to known exchange deposit addresses indicate intent to sell. Tokens sent to a multi-signature wallet or a governance contract may remain off-market for months.
Monitor the historical behavior of previous unlocks for the same project. If past unlocks consistently triggered sell-offs, expect similar behavior from future events. If previous unlocks had no measurable price impact, the market may already be pricing in the dilution, or recipients may be long-term holders.
The Takeaway
Token vesting schedules are not background information. They are forward-looking supply shock indicators. A cliff unlock releasing 10% of supply to early investors will create sell pressure, and that pressure is predictable weeks in advance if you read the contract and verify the schedule on-chain. Most projects publish vesting charts, but the only reliable source is the smart contract itself. Check for admin overrides, mint functions, and upgrade paths. If the contract can be modified, the schedule is not enforceable. If you are staking or providing liquidity, vesting unlocks determine whether your yield will be erased by price declines tied to predictable supply increases you could have anticipated. The projects that survive have smooth, linear unlock schedules that prevent large single-day supply shocks. The projects that do not typically have lumpy vesting structures that concentrate sell pressure into a few high-impact events. That difference is visible on-chain months before it shows up in the price.
Frequently Asked Questions
What is a token vesting cliff and how does it affect sell pressure?
A cliff is a period during which zero tokens from an allocation are tradable. After the cliff date, tokens unlock either all at once or begin a linear vesting schedule. A 12-month cliff with a single-day unlock creates concentrated sell pressure because the entire allocation becomes liquid simultaneously. Linear vesting after a cliff distributes sell pressure over time, releasing small amounts daily or monthly, which has minimal market impact compared to lump-sum unlocks.
How can I verify a token vesting schedule on-chain instead of trusting project documentation?
Locate the token contract address on Etherscan or an equivalent block explorer. Identify large holder addresses, which are often vesting contracts. Open those contracts and read the verified source code, looking for functions like release or withdraw that define unlock timing. Check for admin controls such as setVestingSchedule or upgrade mechanisms that allow the project to modify terms. If those exist, the published schedule is not binding. The contract code is the only reliable source.
What percentage supply increase from a token unlock typically causes measurable price impact?
Unlocks releasing 5% or more of circulating supply typically create 5-15% sell pressure within 48 hours for liquid tokens. For lower-liquidity assets, the impact can reach 15-40% in the 30 days surrounding the unlock. The actual impact depends on who receives the tokens, whether they transfer to exchanges, and the token's existing trading volume. A 5% unlock absorbed by deep liquidity has minimal effect; the same increase in a low-volume token can trigger sharp declines.
Why do team and investor unlocks create more sell pressure than community unlocks?
Team and early investors typically bought tokens at a fraction of market price and view unlocks as profit-taking opportunities. They are more likely to liquidate portions of their allocation immediately to realize gains. Community recipients and ecosystem grants often go to engaged users who hold longer or sell gradually. Historical data shows team and investor unlocks correlate with higher immediate sell pressure, especially when tokens transfer directly to exchange deposit addresses before the unlock date.
How do I combine vesting unlocks with token emission schedules to predict total supply pressure?
Vesting unlocks and programmatic emissions both increase circulating supply. A token emitting 2% monthly as staking rewards plus a 5% vesting unlock in the same month creates 7% total new supply. If the token is not deflationary through burns or buybacks, that dilutes existing holders unless demand increases proportionally. Tools like DefiLlama and Token Terminal show both unlock schedules and emission rates, allowing you to build a complete supply timeline and calculate net inflation for any given period.
You now have the on-chain verification methods to read vesting schedules before unlock events move the market. Those schedules change, and new projects launch weekly with structures you will need to evaluate.
Every Thursday: where crypto yield actually is - stablecoins, liquid staking and DeFi lending, with the risk named next to the rate and what changed since last week.
Get it free every ThursdayFree. No trade calls, no allocations, no hype. Unsubscribe in one click.