Table of Contents
What You Are Checking, And Why It Matters For Your Position
The WETH-USDT pool on Uniswap V3 rose 4.35 percentage points to 26.66% APY this week, sitting on $66 million in total value locked. That rate produces $53,320 annually on a $200,000 position. If the jump reflects fee tier migration or sustained routing flow, you have a material income opportunity. If it reflects temporary arbitrage volume that evaporates in 72 hours, you paid gas to enter and you may exit with impermanent loss exceeding the brief fee capture you earned.
This article walks through the forensic protocol I use to distinguish the two. You will query Dune Analytics for fee tier distribution shifts, compare seven-day volume trends across the 0.3% and 0.05% fee tiers, check individual swap frequencies via the Uniswap v3 subgraph, and calculate the impermanent loss threshold at which 26.66% yield becomes unsustainable. This is the same protocol I ran in traditional gambling liquidity pools when operators shifted rake structures mid-quarter. The mechanics are identical.
Prerequisites
You need basic familiarity with Uniswap V3 concentrated liquidity, access to Dune Analytics (free tier works), and comfort reading GraphQL query results. If you have provided liquidity on V3 before, you have enough context. If you have not, read the DeFi protocols overview first to understand concentrated liquidity risk before deploying capital.
Step 1: Pull Fee Tier Distribution For WETH-USDT Across Seven Days

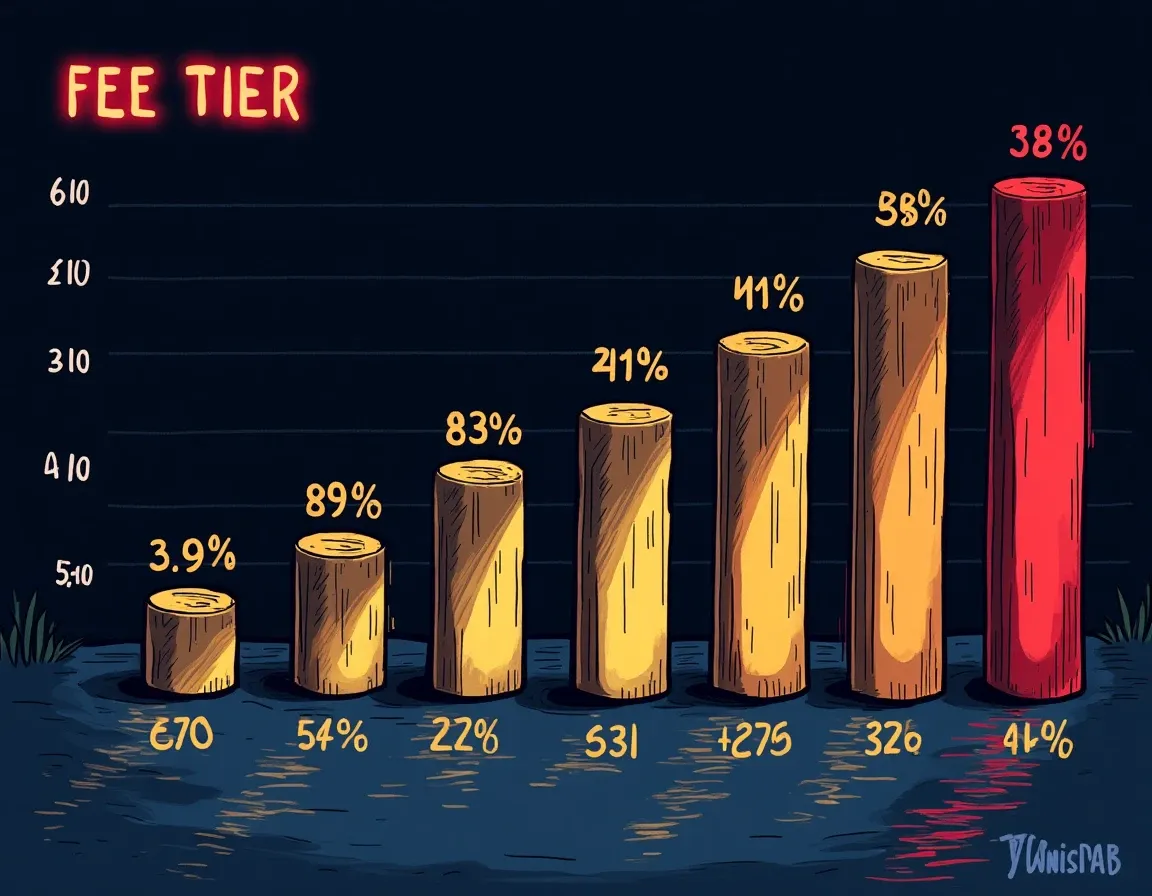
Uniswap V3 offers four fee tiers: 1%, 0.3%, 0.05%, and 0.01%. The WETH-USDT pair has historically concentrated liquidity in the 0.3% tier (33,840 positions) and the 0.05% tier (3,607 positions). When yield jumps 4.35 percentage points in one week, the first question is whether liquidity providers migrated from one tier to another, chasing volume by lowering fees.
Log into Dune Analytics and navigate to the Uniswap V3 pool metrics dashboard. Query the PoolDayData entity for WETH-USDT across both the 0.3% and 0.05% fee tiers over the past seven days. You are looking for two patterns:
- TVL share shifting from 0.3% to 0.05% or vice versa, indicating liquidity rebalancing
- Volume share increasing in one tier while TVL remains stable, indicating routing preference changes
If TVL in the 0.3% tier increased by more than 10% week-over-week while 0.05% tier TVL declined proportionally, that suggests LPs moved capital to capture higher fees from lower-competition routing. This is fee tier migration. It is typically sustainable for two to four weeks until the next rebalancing event.
If TVL remained stable in both tiers but volume in the 0.3% tier spiked 40% or more, that suggests temporary arbitrage activity or a one-time large swap. This is not sustainable. You are seeing arb volume, not structural yield.
How To Read The Data
The PoolDayData entity returns daily snapshots including volumeUSD, tvlUSD, and feesUSD. Calculate the fee-to-volume ratio for each day: feesUSD divided by volumeUSD should equal the fee tier percentage (0.3% or 0.05%). If the ratio exceeds the tier by more than 5 basis points, something is wrong with the data or the pool is capturing atypical volume.
Compare the seven-day moving average of volumeUSD for the current week against the prior three weeks. A spike exceeding two standard deviations from the mean indicates temporary activity. A gradual 15-25% increase over four weeks indicates structural routing change.
Step 2: Check Individual Swap Frequencies Via The Uniswap V3 Subgraph

Fee tier distribution tells you where the liquidity is. Swap frequency tells you how the volume arrived. If the 4.35pp jump came from a single large arbitrage trade or a brief flurry of MEV bot activity, it will not persist. If it came from sustained retail and aggregator routing, it has a better chance of holding.
Open the Uniswap V3 subgraph API and query the Swap entity for the WETH-USDT pool at the 0.3% fee tier. Filter for the past seven days. You are looking at two metrics: the number of swaps per day, and the distribution of swap sizes.
Healthy, sustainable volume shows 200 to 800 swaps per day with a log-normal distribution of sizes: many small retail swaps under $10,000, a moderate number of aggregator swaps between $50,000 and $200,000, and occasional large swaps above $500,000. Arbitrage volume shows 15 to 50 swaps per day with clustered sizes: five or six trades all between $1.2 million and $1.8 million, executed within a 20-minute window.
If you see the second pattern, the yield spike is temporary. If you see the first pattern sustained across all seven days, the yield spike may reflect genuine routing flow increases, possibly from a competitor DEX losing market share or from an aggregator adjusting routing logic.
Query Structure
Use this GraphQL query structure against the Uniswap V3 subgraph:
Query swaps for pool 0x11b815efB8f581194ae79006d24E0d814B7697F6 (WETH-USDT 0.3%) where timestamp is greater than [seven days ago in Unix time]. Return timestamp, amountUSD, and transaction hash. Order by timestamp descending, limit 500.
Export the results to CSV. Calculate the coefficient of variation for amountUSD (standard deviation divided by mean). A CV below 1.2 indicates diverse retail flow. A CV above 2.5 indicates concentrated arb activity.
Step 3: Calculate Impermanent Loss Break-Even At 26.66% APY
Even if the yield spike is sustainable, concentrated liquidity positions on Uniswap V3 amplify impermanent loss compared to full-range V2 positions. At 26.66% APY, you need to verify that realistic price movement over your expected holding period will not cost more in IL than you earn in fees.
Concentrated V3 positions do not use the standard V2 impermanent loss formula. The amplification factor depends on your range width. For a narrow range covering plus-or-minus 10% around current price (common for stablecoin-ETH pairs), the IL amplification factor is approximately 3x to 5x compared to a full-range position.
Use the impermanent loss calculator and input your expected range width. For WETH-USDT at $1,825, a typical range might be $1,640 to $2,010 (plus-or-minus 10%). Calculate IL for price moves of 10%, 20%, and 30% in either direction.
At 26.66% APY, you earn 2.22% per month. If a 15% price move costs you 4.5% in IL (amplified from 1.5% at full-range), you need at least two months of sustained yield to break even. If the yield spike is temporary and reverses in one week, you captured 0.51% in fees but lost 4.5% to IL and 0.2% to gas. That is a net loss of 4.19%.
Range Width Decision
Wider ranges reduce IL amplification but also reduce fee capture per dollar of TVL. Narrower ranges maximize fees but expose you to severe IL and to going out-of-range, at which point you stop earning entirely. For a yield spike you are not confident will last, widen your range by 25% compared to your normal strategy. This sacrifices 15-20% of potential fee income but cuts your IL exposure nearly in half.
Step 4: Verify Active Liquidity Distribution Via Tick Data
A 26.66% yield spike can also reflect out-of-range concentration. If 40% of the pool's liquidity went out-of-range due to recent price movement, the remaining in-range liquidity captures all the fees, temporarily inflating the displayed APY. This is not a sustainable opportunity. It is an artifact of price volatility.
Query the Pool entity from the Uniswap V3 subgraph and pull the tick distribution for WETH-USDT at the 0.3% fee tier. The liquidity field shows total deposited liquidity. The activeLiquidity field shows liquidity currently in-range and earning fees.
If activeLiquidity is less than 60% of liquidity, the yield spike reflects out-of-range concentration. When price mean-reverts and those positions come back in-range, your effective APY will drop by 30-50% as fee capture dilutes across the larger liquidity base.
If activeLiquidity is above 85% of liquidity, the yield reflects genuine fee generation across the full TVL, which is more sustainable.
How To Interpret The Ratio
Active liquidity below 70% is common after 8-15% price moves on major pairs like WETH-USDT. It typically normalizes within 48 to 96 hours as LPs rebalance or new LPs enter at the new price level. If you are evaluating the pool more than 72 hours after a known volatility event and active liquidity is still below 65%, something unusual is happening. Either LPs are not rebalancing (indicating weak confidence in the pool), or the pool is experiencing sustained one-directional flow (indicating possible structural demand shift).
Step 5: Check Protocol Fee Activation Risk
Uniswap V3 governance can activate protocol fees on individual pools, set between 10% and 25% of LP fees. If activated, your net yield drops immediately by that percentage. This is not theoretical. It has happened on other high-volume pairs when the DAO sought revenue.
Check the Uniswap governance forum and recent snapshot votes for any proposals targeting the WETH-USDT pool. If a fee activation vote is active or recently passed, your 26.66% APY may become 20-23.3% APY within days, with no advance warning to individual LPs.
This is a material sustainability risk. The DAO is more likely to activate fees on high-yield, high-TVL pools because they generate the most protocol revenue. If you see governance discussion around fee activation for major ETH pairs, treat the current yield as temporary regardless of the other forensic checks.
Step 6: Compare With The USDC-WETH Pool At The Same Fee Tier
WETH-USDT and USDC-WETH are functionally identical pairs for most routing purposes. If WETH-USDT jumped 4.35pp but USDC-WETH at the same fee tier remained stable or declined, that suggests the yield change is specific to the USDT side, possibly driven by Tether-related demand (arbitrage between exchanges with different USDT liquidity) rather than by ETH routing changes.
Pull the same seven-day volume and TVL data for USDC-WETH at 0.3% and compare the patterns. If both pools show similar yield increases, the driver is ETH-side demand (more people buying or selling ETH across all stablecoin pairs). This is typically more sustainable. If only WETH-USDT spiked, the driver is USDT-specific, which is more fragile and more likely tied to temporary arbitrage or exchange-specific flow.
Related read: How to evaluate USDC-WETH vs WETH-USDT pool dynamics.
Common Failure Modes When Auditing Yield Spikes
The most common mistake is treating tracker-displayed APY as realized APY. Trackers like DefiLlama calculate APY from recent fee generation and current TVL, often using a seven-day rolling window. If fees spiked on day six and seven but were normal on days one through five, the tracker shows an inflated annualized rate that will not persist.
Always pull raw daily fee data and calculate your own average. Do not rely on the headline number.
The second mistake is ignoring gas costs relative to position size. Entering and exiting a Uniswap V3 position costs $40 to $120 in gas depending on network conditions. On a $200,000 position, that is 0.02% to 0.06%, negligible. On a $10,000 position, that is 0.4% to 1.2%, which matters if you are chasing a temporary spike. If you determine the yield will only last one week, you need at least $80,000 deployed to justify the gas cost of entry and exit.
The third mistake is not accounting for range rebalancing frequency. Narrow ranges on volatile pairs go out-of-range frequently. If you need to rebalance every 72 hours to stay in-range, you pay gas four times per week. That can cost 0.8% to 2.4% weekly on a $50,000 position, which eliminates most of the yield advantage from the spike.
What To Do After Your Audit
If your forensic checks confirm fee tier migration or sustained routing flow increases, and active liquidity is above 80%, and no protocol fee activation is imminent, you have a legitimate income opportunity. Size your position according to your IL tolerance and deploy in tranches over 48 hours to avoid entering at a temporary volume peak.
If your checks show temporary arb activity, out-of-range concentration, or single-sided USDT demand with no corresponding movement in USDC-WETH, do not enter. Wait 72 hours and re-run the audit. Temporary spikes often reverse quickly, and the pools that sustain elevated yields show consistent patterns across multiple audits.
If you are already in the pool and your audit suggests the spike is temporary, calculate your unrealized IL and compare it to your fee capture so far. If you have been in-range for more than five days and captured more in fees than you currently have in unrealized IL, consider exiting and re-entering after the spike normalizes. If you just entered and have minimal fee capture, exit immediately to avoid paying IL on the reversal.
Position Sizing Ceiling
Even when the yield is sustainable, do not allocate more than 15% of your total DeFi yield portfolio to a single Uniswap V3 position. Concentrated liquidity is high-maintenance and high-risk. The income is real, but the volatility is also real. See How to size into WETH-USDT after a yield jump for detailed allocation ceilings tied to pool TVL and your personal IL tolerance.
The Takeaway
A 4.35 percentage point jump to 26.66% on $66 million TVL is worth investigating, but only after confirming the spike reflects fee tier migration or sustained routing flow rather than temporary arbitrage volume. Query Dune Analytics for fee tier distribution shifts, check swap frequency via the Uniswap V3 subgraph, calculate impermanent loss break-even at the stated APY, verify active liquidity is above 80%, and compare the pattern against USDC-WETH at the same fee tier. If all five checks confirm sustainability, you have a legitimate income opportunity worth $53,320 annually on $200,000 deployed. If any check fails, the spike is temporary and the risk-adjusted expected value is negative after gas and IL.
Frequently Asked Questions
How do I tell if a Uniswap V3 yield spike is from fee tier migration or temporary arbitrage?
Query PoolDayData for TVL distribution across the 0.3% and 0.05% fee tiers over seven days. If TVL shifted more than 10% from one tier to another while volume remained steady, that indicates fee tier migration. If TVL stayed flat but volume spiked 40% or more in one tier, that indicates temporary arbitrage activity. Fee tier migration typically sustains for two to four weeks. Arbitrage spikes reverse within 72 hours.
What is the impermanent loss break-even threshold for a 26.66% APY position?
At 26.66% APY you earn 2.22% per month. For a concentrated liquidity position with plus-or-minus 10% range width, a 15% price move typically costs 4.5% in impermanent loss (3x amplification over full-range). You need at least two months of sustained yield to break even after IL and gas costs. If the yield spike reverses in one week, you capture 0.51% in fees but lose 4.5% to IL, resulting in a net loss.
How does out-of-range liquidity affect displayed Uniswap V3 APY?
When 40% or more of pool liquidity goes out-of-range due to price movement, the remaining in-range liquidity captures all fees, temporarily inflating the displayed APY. Query the Pool entity activeLiquidity field and compare it to total liquidity. If active liquidity is below 70%, the yield spike reflects concentration, not genuine fee generation. When price normalizes and positions come back in-range, your effective APY will drop 30-50% as fees dilute across the full liquidity base.
Can Uniswap governance reduce my LP yield after I enter a position?
Yes. Uniswap V3 governance can activate protocol fees on individual pools, set between 10% and 25% of LP fees. If activated, your net yield drops immediately by that percentage with no advance warning to LPs. Check the governance forum for any proposals targeting high-yield, high-TVL pairs like WETH-USDT. The DAO is more likely to activate fees on pools generating the most protocol revenue, making this a material sustainability risk.
What position size justifies the gas cost of entering a Uniswap V3 pool to chase a yield spike?
Entering and exiting a Uniswap V3 position costs $40 to $120 in gas depending on network conditions. If you determine the yield spike will only last one week, you need at least $80,000 deployed to justify the round-trip gas cost. On smaller positions, gas eats 0.4% to 1.2% of capital, which can exceed the fee capture from a brief spike. Add range rebalancing costs if you are using a narrow range on a volatile pair.
You just walked through the five-check protocol to audit a 4.35pp yield spike on $66M TVL. That pool's economics will look different in 72 hours.
Every Thursday: where crypto yield actually is - stablecoins, liquid staking and DeFi lending, with the risk named next to the rate and what changed since last week.
Get it free every ThursdayFree. No trade calls, no allocations, no hype. Unsubscribe in one click.