Table of Contents
The Gap Between Quoted APY And What You Actually Earned

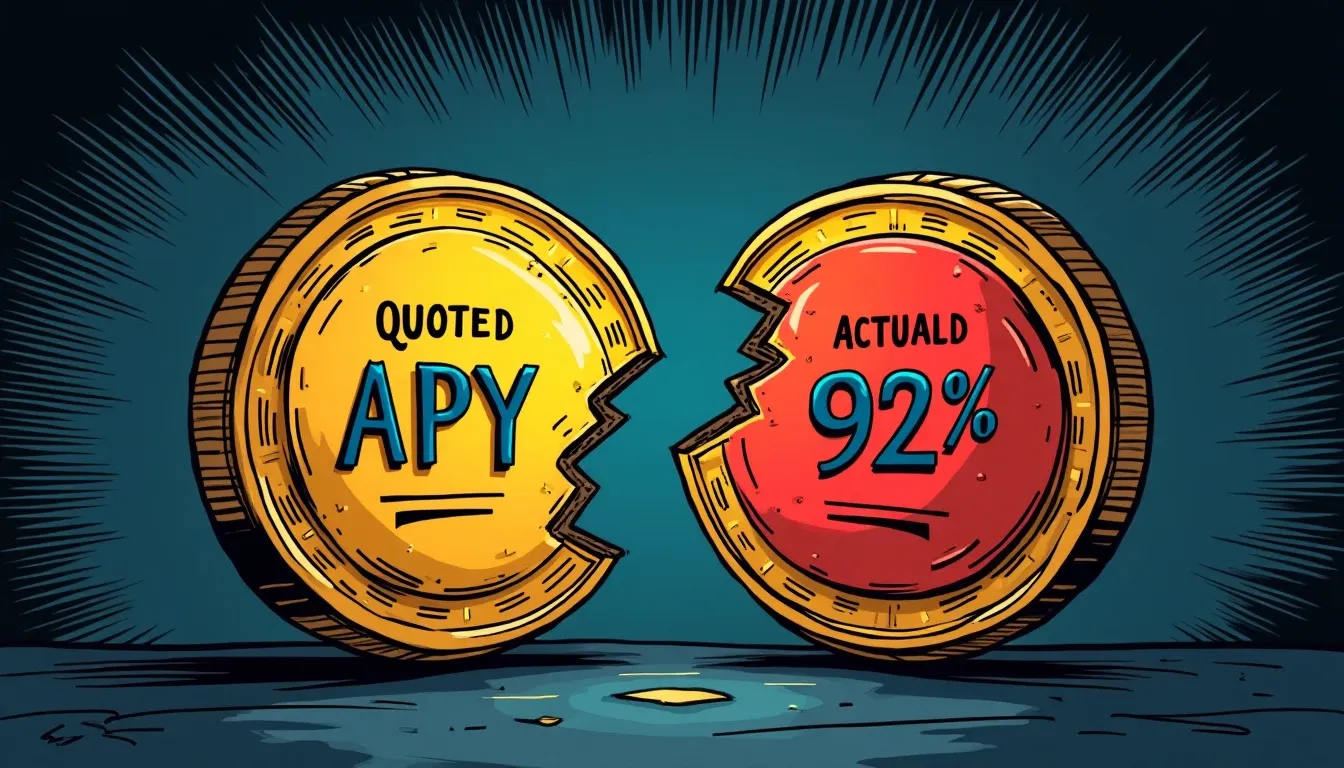
A Uniswap v3 pool quotes 18% APY on an ETH/USDC position. You deposit for 90 days, watch the dashboard daily, and when you withdraw the position your wallet shows an 11% annualized return. The question that matters is where the other seven percentage points went, and whether you can measure the gap before you commit capital rather than discovering it only after exit.
The gap is structural. Yield protocols quote annual percentage yields based on current fee velocity, current reward token prices, and the assumption that your position remains in range and fully active for 365 days without interruption. None of those assumptions hold in practice. Fee velocity changes with market volume. Reward tokens decline in price between the moment of APY calculation and the moment you claim and sell them. Concentrated liquidity positions move out of range when prices shift. Entry costs, exit costs, gas fees across dozens of transactions, impermanent loss realized at withdrawal, and slippage on reward token sales erode the quoted figure before it reaches your wallet.
This is not unique to decentralized finance. European sovereign debt markets in 2011 quoted yields above 20% on Greek bonds not because buyers would earn 20%, but because the market assigned a high probability that Greece would default before maturity. The yield reflected risk rather than return. In DeFi the mechanism is different but the principle is identical. A quoted APY is not a promise of what you will earn; it is a snapshot of current conditions combined with an optimistic compounding assumption. Your actual return comes after you subtract every form of friction the protocol does not advertise.
The Five-Component Formula For Actual Returns
Measuring what a yield position actually returned requires accounting for five distinct components. The formula is straightforward once you recognize that each stage of the lifecycle imposes costs or variability that the APY does not capture.
Component One: Entry Costs
Before a position begins earning, you pay to establish it. On Ethereum mainnet this means gas for token approvals, gas for the swap that balances your deposit ratio, and gas for the transaction that mints the liquidity provider token. At September 2026 gas levels a simple ETH transfer costs around $0.10 to $0.20, and a Uniswap swap using 180,000 gas costs approximately $0.21. Establishing a concentrated liquidity position typically requires three transactions: approve token A, approve token B, add liquidity. If gas is 1 gwei the total entry cost is often $0.50 to $0.80.
On Layer 2 networks like Arbitrum or zkSync Era, where transaction fees frequently fall below $0.10 and occasionally under $0.03, entry costs become negligible for positions above $1,000. On mainnet they matter more. A $500 position paying $0.60 in entry gas surrenders 0.12% before earning begins. At a 7% net APY that $0.60 represents roughly six days of yield. If you plan to hold for 30 days the entry cost alone reduces your annualized return by 1.4 percentage points.
Component Two: Fee Accrual
Trading fees are the primary source of real yield in liquidity pools. Uniswap pools charge 0.05% on stablecoin pairs, 0.3% on standard pairs like WBTC/ETH, and 1% on exotic or volatile pairs. Those fees accrue to liquidity providers in proportion to the share of pool liquidity they supply and the time their position remains in range.
Fee accrual is time-dependent and volume-dependent. A position in a 0.3% fee pool does not earn 0.3% per transaction on your capital; it earns a fraction of 0.3% of each trade that occurs within your price range, divided among all liquidity providers active in that range. High-volume pairs generate more absolute fees, but they also attract more competing liquidity, which dilutes your share. Low-volume pairs offer less competition but produce fewer fees to distribute.
The critical point is that fee accrual stops the moment price moves outside your concentrated range. A Uniswap v3 position set to a plus or minus 10% range around the current price earns nothing once ETH moves 11% in either direction. If your position remains out of range for 30 of your 90-day holding period, you earned fees for only 60 days, which cuts your annualized return by one-third before you account for any other friction.
Component Three: Reward Token Realization
Many DeFi protocols supplement trading fees with governance token emissions. These rewards appear in APY calculations at the price of the governance token at the moment the APY is quoted. By the time you claim and sell those tokens, the price has often declined, sometimes sharply.
Assume a protocol quotes 14% APY, with 7% derived from trading fees and 7% from token emissions. You claim your rewards weekly and sell them immediately into USDC. Over 90 days the reward token declines 20% against the dollar due to steady sell pressure from other farmers. Your realized return from emissions is not 7% annualized; it is 5.6%. The 1.4 percentage point gap comes from the difference between the token price used in the APY calculation and the price at which you actually sold.
This gap widens for protocols with high inflation rates or low liquidity for the reward token. A 14% APY backed by 10% annual token supply inflation is closer to 4% real yield in token terms once dilution is factored. If you cannot sell the reward token near the price used in the APY quote, the effective contribution of emissions to your return may be half what the dashboard displayed.
Component Four: Impermanent Loss Realized At Withdrawal
Impermanent loss is the difference in value between holding two assets in a liquidity pool versus holding them separately in a wallet. The loss is impermanent only while the position remains open; if prices return to the entry ratio before you withdraw, the loss disappears. The moment you exit the pool the impermanent loss becomes permanent and realized.
The standard formula for impermanent loss in a 50/50 pool is 2√R/(1+R) minus 1, where R is the ratio of the final price to the entry price. If you enter an ETH/USDC pool when ETH is $2,500 and exit when ETH is $3,000, the price ratio R is 1.2. The impermanent loss is approximately 0.6%. For a $10,000 position that is $60 in forgone value compared to simply holding the two assets.
Concentrated liquidity positions in Uniswap v3 amplify impermanent loss proportionally to the concentration factor. A position concentrated in a plus or minus 10% range experiences roughly ten times the impermanent loss of a full-range position for the same price move. If ETH rises 5% and your range is tight, the impermanent loss may reach 3% of position value, erasing weeks or months of fee income. The tighter the range, the higher the fee earnings, but also the greater the impermanent loss when price moves against you.
Stablecoin pairs like USDC/USDT on Curve largely eliminate impermanent loss because both tokens maintain $1 parity. For volatile pairs the loss is unavoidable and must be subtracted from gross fee earnings to arrive at net return.
Component Five: Exit Costs
Withdrawing from a liquidity pool, claiming final rewards, and converting the withdrawn tokens back to your preferred stablecoin or base asset imposes the same gas costs as entry, plus slippage on any token swaps. On Ethereum mainnet exit typically costs $0.50 to $0.80 in gas, matching entry. On Layer 2 networks the cost is negligible.
Exit slippage matters more for smaller or less liquid pools. If you withdraw $5,000 in a governance token and immediately sell it on a decentralized exchange with shallow liquidity, the market impact may cost 1% to 2% of the token's quoted price. For a position that earned 8% gross over 90 days, a 1.5% exit slippage cost reduces your net annualized return by six percentage points.
The combined effect of entry gas, exit gas, and exit slippage often totals 0.5% to 1.5% of position value. For a three-month hold that delivered 8% gross APY, those costs reduce realized annual return to 6% or 7%. The shorter the holding period, the larger the proportional impact of fixed entry and exit costs.
Worked Example: ETH/USDC On Uniswap V3

The calculation becomes concrete with a real scenario. You deposit 2 ETH and $5,000 USDC into a Uniswap v3 ETH/USDC pool with a 0.3% fee tier on Ethereum mainnet. You set a concentrated liquidity range of plus or minus 10% around the entry price of $2,500 per ETH. The quoted APY at entry is 18%, composed of 12% from trading fees and 6% from UNI token rewards. You hold the position for 90 days.
Step 1: Calculate Entry Costs
Gas at 1 gwei costs $0.21 per swap and roughly $0.50 to add liquidity. You pay $0.21 to swap a portion of USDC into ETH to match the pool ratio, then $0.50 to mint the LP position. Total entry cost: $0.71. On a $10,000 position that is 0.0071%, negligible over 90 days but relevant for smaller positions or shorter holds.
Step 2: Track Fee Accrual
Daily trading volume in the ETH/USDC 0.3% pool on Uniswap averages $150 million. Your $10,000 represents 0.00067% of the pool's $1.5 billion total value locked. You earn 0.00067% of the 0.3% fee on $150 million daily volume, which equals approximately $3.00 per day in fees, or $270 over 90 days if your position remains fully in range.
During the 90-day period ETH price rises from $2,500 to $2,800, then falls back to $2,600. For 20 of the 90 days your position is out of range and earns nothing. You earned fees for 70 days, not 90, reducing fee income to $210. Annualized over the $10,000 position, that is 8.4% APY from fees, not the 12% quoted at entry.
Step 3: Measure Reward Token Realization
The protocol distributes UNI rewards weekly. You claim and sell immediately. The APY calculation assumed UNI at $8.00. Over 90 days UNI declines to $6.40, a 20% drop. Your realized reward income is 80% of the quoted 6% APY, or 4.8% annualized. In dollar terms that is $120 over 90 days instead of the $150 the APY implied.
Step 4: Calculate Impermanent Loss
You entered when ETH was $2,500 and exited when ETH was $2,600. The price ratio R is 2,600 / 2,500 = 1.04. For a full-range position impermanent loss would be approximately 0.1%. For a concentrated position in a plus or minus 10% range, impermanent loss is amplified by roughly 10x, reaching 1.0% of position value, or $100.
If you had simply held 2 ETH and $5,000 USDC in your wallet, your final value would be (2 × $2,600) + $5,000 = $10,200. Your liquidity pool position returned $10,000 + $210 fees + $120 rewards - $100 impermanent loss = $10,230. The impermanent loss cost you $100 in forgone gains compared to holding.
Step 5: Account For Exit Costs
You pay $0.50 in gas to withdraw liquidity and $0.21 in gas to swap one of the withdrawn tokens back to USDC. If the withdrawn ETH is sold into a liquid market, slippage is negligible. Total exit cost: $0.71, matching entry.
Final Calculation
Your $10,000 position returned $210 in fees, $120 in rewards, minus $100 in impermanent loss, minus $1.42 in gas. Net profit: $228.58 over 90 days. Annualized, that is 9.14% APY. The protocol quoted 18% APY. Your realized return was 9.14%. The gap of 8.86 percentage points came from out-of-range time (reducing fees by 3.6 points), reward token price decline (reducing rewards by 1.2 points), impermanent loss (costing 4.0 points), and gas (costing 0.06 points).
This is typical. The gap between quoted APY and realized return routinely falls between five and ten percentage points for volatile pairs on concentrated liquidity protocols, and between two and four percentage points for stablecoin pairs or full-range positions.
Common Pitfalls That Widen The Gap
Several behavioral and structural traps widen the distance between quoted yield and actual return. Recognizing them before committing capital is the only defense.
Ignoring Out-Of-Range Time
Most liquidity providers underestimate how often their concentrated positions move out of range. A plus or minus 10% range feels wide when you set it, but ETH routinely moves 15% or 20% in a week during volatile periods. If you do not monitor the position daily and adjust the range, you may earn nothing for half your intended holding period. The APY calculation assumes 100% in-range time. Actual in-range time for tight ranges is often 60% to 80%, which directly scales down fee income.
Overestimating Reward Token Stability
Governance tokens are sold continuously by yield farmers. The larger the emission rate relative to protocol revenue, the more selling pressure accumulates. A token emitting 20% of supply annually to liquidity providers will decline in price unless buy pressure from protocol utility or speculation exceeds that 20% selling flow. Most do not. Assuming you will realize rewards at the price used in the APY quote is optimistic. A 15% to 25% discount between quote price and sale price is common for high-emission protocols.
Underestimating Impermanent Loss In Tight Ranges
Concentrated liquidity amplifies both fee earnings and impermanent loss. A position in a plus or minus 5% range may earn 20x the fees of a full-range position, but it also experiences 20x the impermanential loss for the same price movement. A 3% price move in a 5% range can produce 12% impermanent loss, erasing weeks of fee accumulation in hours. If you do not track the impermanent loss daily using a tool like DefiLlama or Revert Finance, you will discover the loss only at exit, when it is too late to adjust.
Failing To Track Gas Cumulatively
A single $0.50 gas fee is negligible. Twenty gas fees over 90 days for weekly reward claims, range adjustments, and rebalancing total $10, which on a $5,000 position is 0.2% of capital or roughly 0.8% annualized. On smaller positions or in higher-gas environments the cumulative gas cost can exceed 2% of position value, turning a marginal 5% APY position into a 3% net return or worse. Layer 2 protocols offer structural advantages here; when gas is under $0.01 per transaction, cumulative costs become irrelevant even for active strategies.
Tools That Measure Realized Returns
Several analytics platforms calculate what a position actually earned rather than what the APY implied. These tools are essential for anyone running yield strategies across multiple protocols or chains.
APY.vision tracks exact impermanent loss, fees earned, and net profit and loss for liquidity positions across Uniswap, SushiSwap, PancakeSwap, and other major decentralized exchanges. The platform updates in real time and shows whether your position is currently profitable after accounting for impermanent loss. For concentrated liquidity positions it displays current in-range status and historical in-range percentage, which directly predicts fee earnings over time.
Revert Finance specializes in Uniswap v3 analytics. It calculates position performance including fees, impermanent loss, range status, and whether adjusting your range would improve returns. The tool also estimates future returns based on historical fee velocity, allowing you to model whether tightening or widening your range would increase net yield after accounting for the gas cost of rebalancing.
DeBank aggregates wallet positions across lending protocols, staking, liquidity pools, and stablecoins into a single portfolio view. It shows total portfolio yield, protocol rankings by return, and alerts when a position's APY drops below a threshold you set. The platform does not calculate impermanent loss directly, but it tracks deposited value versus current value, which surfaces the combined effect of fees, rewards, and impermanent loss over time.
DefiLlama's yield page offers verified APY data, simulating what a holder would have actually earned by modeling daily on-chain withdrawals from each pool. This "verified APY" is typically two to five percentage points below the quoted APY for volatile pairs and within one percentage point for stablecoin pools. Comparing verified APY to quoted APY before entering a position reveals which protocols systematically overstate returns.
When The Gap Justifies Avoiding A Position Entirely
The decision framework is straightforward. If the expected gap between quoted APY and realized return exceeds the risk-free rate available in stablecoin lending, the position is not worth the complexity or the risk.
In September 2026 stablecoin lending on Aave or Morpho offers 4% to 6% APY with negligible impermanent loss, no reward token exposure, and minimal gas. If a Uniswap v3 position quotes 18% APY but you estimate 70% in-range time, a 20% reward token price decline, 2% impermanent loss, and 0.5% in cumulative gas, your realized return is approximately 10%. The 10% realized return carries smart contract risk, impermanent loss risk, and active management overhead. The 5% stablecoin lending rate carries only smart contract risk and requires no ongoing attention.
The yield premium for the volatile pair is five percentage points. The question is whether that premium compensates for the additional risks and time. For a $10,000 position the premium is $500 annually, or $125 over 90 days. If monitoring and rebalancing the position requires two hours per month, the implicit hourly rate is roughly $20. For many participants that is below the opportunity cost of their time, which makes the simpler stablecoin position the better choice even though the absolute yield is lower.
The gap also determines whether a position is worth entering on Ethereum mainnet versus a Layer 2 or alternative chain. If gas costs $0.50 per transaction on mainnet and $0.01 on Arbitrum, and you plan to claim rewards weekly for 12 weeks, the mainnet strategy costs $6.00 more in gas. On a $3,000 position that is 0.2% of capital. If the mainnet pool offers 8% APY and the Arbitrum pool offers 7.5% APY, the lower gas on Arbitrum makes it the higher-net-return option despite the lower quoted rate.
How To Apply This Before Committing Capital
The five-component formula becomes a pre-entry checklist. Before depositing into any yield position, estimate each component and calculate the expected realized return. If the estimate falls below your threshold, do not enter.
First, check current gas prices on the target chain and calculate total entry and exit costs. Add weekly or monthly gas for reward claims if the protocol does not auto-compound. Multiply by the number of expected transactions over your planned holding period.
Second, review historical fee velocity for the pool using DefiLlama or the protocol's native analytics. If the current APY is elevated relative to the 30-day or 90-day average, assume reversion to the mean rather than continuation of the current rate. For concentrated liquidity positions, estimate in-range time based on historical volatility. A plus or minus 10% range on ETH during a 30-day period with 40% annualized volatility will be out of range approximately 30% to 40% of the time. Reduce your expected fee income proportionally.
Third, examine the reward token's emission rate and price trend. If the protocol emits 20% of token supply annually and the token has declined 30% over the past 90 days, assume you will realize rewards at a 20% to 30% discount to the current price. Adjust the rewards component of APY downward by that percentage.
Fourth, model impermanent loss for your expected price scenario. If you believe ETH will rise 10% over your holding period, calculate impermanent loss at a 10% price move for your chosen range width. Subtract that loss from gross returns. If you believe price will move more than 15% in either direction, either widen your range or accept that impermanent loss will likely exceed fee income.
Fifth, compare your estimated realized return to the risk-free rate on stablecoin lending or to the return you would earn holding the underlying assets without providing liquidity. If the realized return premium is less than two or three percentage points, the position is not worth the added complexity and risk.
This process takes ten minutes per position and eliminates most poor allocation decisions before they cost you capital. The alternative is to discover the gap only after exit, when the losses are permanent and the time is already spent.
What To Do Next
Choose one current or planned yield position and calculate its realized return using the five-component formula. Track entry gas, estimate in-range time, model reward token price at claim, calculate impermanent loss at your expected exit price, and add exit gas. Compare the result to the quoted APY. The gap is your ongoing tax for not measuring.
If you are not currently tracking realized returns, start with APY.vision or Revert Finance for liquidity positions and DeBank for an aggregated portfolio view. Set a weekly reminder to review in-range status for any concentrated liquidity positions and adjust ranges when out-of-range time exceeds 20%. Claim and sell reward tokens weekly rather than holding them; the longer you wait, the more price risk you carry.
For future positions, calculate expected realized return before entry and reject any allocation where the gap between quoted and realized exceeds four percentage points unless the absolute realized return exceeds 10%. Most positions that fail this test are subsidized by emissions or elevated temporarily by short-term volume spikes, and neither condition persists.
The income mechanism here is knowing your true return, which is the only basis for deciding whether a strategy is worth continuing. Knowing when to exit a position depends on knowing what it actually earned, not what the dashboard claimed it would earn. Without that measurement you are managing APY quotes rather than managing capital, and the difference compounds across every position you hold.
Frequently Asked Questions
What is the typical gap between quoted DeFi APY and actual realized return?
For volatile pairs on concentrated liquidity protocols like Uniswap v3, the gap routinely falls between five and ten percentage points. For stablecoin pairs or full-range positions the gap is smaller, typically two to four percentage points. The gap comes from out-of-range time reducing fee income, reward token price declines between quote and sale, impermanent loss realized at exit, and cumulative gas costs across the holding period.
How does concentrated liquidity amplify impermanent loss?
A concentrated liquidity position in a plus or minus 10% range experiences roughly ten times the impermanent loss of a full-range position for the same price move. A 5% price movement in a tightly concentrated range can produce 25% to 50% impermanent loss, erasing weeks of fee income. The amplification factor scales with range tightness: a plus or minus 5% range amplifies impermanent loss approximately 20x compared to full range.
Why do reward tokens usually sell for less than the price used in APY calculations?
Governance tokens are sold continuously by yield farmers, creating persistent selling pressure. A protocol emitting 20% of token supply annually must generate equivalent buy pressure from utility or speculation to maintain price. Most do not. The time lag between APY calculation and your actual claim and sale allows price to decline, often 15% to 25% for high-emission protocols. The larger the emission rate relative to protocol revenue, the steeper the typical discount.
How much do cumulative gas fees reduce net returns on Ethereum mainnet?
For a position held 90 days with weekly reward claims, gas typically totals $6 to $10 at 1 gwei, or 0.1% to 0.2% of a $5,000 position. Annualized that is 0.4% to 0.8%. On smaller positions or in higher-gas periods cumulative gas can exceed 2% of capital annually. Layer 2 networks reduce this to near zero, with total gas often under $0.50 for the entire lifecycle of a three-month position.
What tools calculate actual DeFi returns rather than quoted APY?
APY.vision tracks exact impermanent loss, fees earned, and net profit and loss for liquidity positions across major DEXs in real time. Revert Finance specializes in Uniswap v3 analytics, showing position performance, range status, and rebalancing simulations. DefiLlama offers verified APY data that simulates daily on-chain withdrawals, revealing what holders actually earned. DeBank aggregates wallet positions and tracks deposited value versus current value across all protocols.
You have just seen the five-component formula that routinely reveals a five to ten percentage point gap between quoted and realized yield. That gap will be different for your next position.
Every Thursday: where crypto yield actually is - stablecoins, liquid staking and DeFi lending, with the risk named next to the rate and what changed since last week.
Get it free every ThursdayFree. No trade calls, no allocations, no hype. Unsubscribe in one click.