Table of Contents
What You Will Accomplish

You will build a repeatable process to find 1-3% higher yield on the same risk profile. Not by chasing APY numbers. By matching collateral requirements, lock periods, smart contract audit scores, and TVL across protocols, then isolating the actual rate difference after accounting for withdrawal friction and gas costs.
On a $300,000 allocation, a sustained 1% improvement generates $3,000 annually. A 3% improvement generates $9,000. The process takes two hours monthly versus reactive browsing that misses structural rate gaps.
Prerequisites: You already supply stablecoins or ETH to at least one DeFi lending protocol. You understand collateralization ratios and liquidation mechanics. You have used Etherscan or a block explorer to verify contract state.
Why Rates Differ At The Same Risk Level

On September 24, 2026, USDC suppliers on Aave's Ethereum market earned 3.62% while 92.7% of the $2.4 billion supplied was on loan. Morpho Blue's MetaMorpho vaults offered 4.1-6.8% on USDC with comparable collateral backing and audit coverage. Spark, aligned with the Sky protocol, offered 3.9-4.7%.
Same asset. Same chain. Different rates.
The gap is not risk. It is utilization, fee structure, and user inertia. Aave charges a 10% reserve factor on interest paid by borrowers. Morpho Blue enables curated vaults with custom fee splits. Spark subsidizes rates to attract Sky-aligned deposits. None of these differences show up in the headline APY number.
The failure mode: moving capital for a 0.3% rate bump, paying 0.5% in gas and slippage, then discovering the higher rate was temporary because utilization spiked. You net negative after friction costs.
The correct approach: match risk parameters first, calculate effective yield after friction, verify rate stability over 30 days, then move capital only when the net gain exceeds 1% annually.
Build Your Comparison Spreadsheet

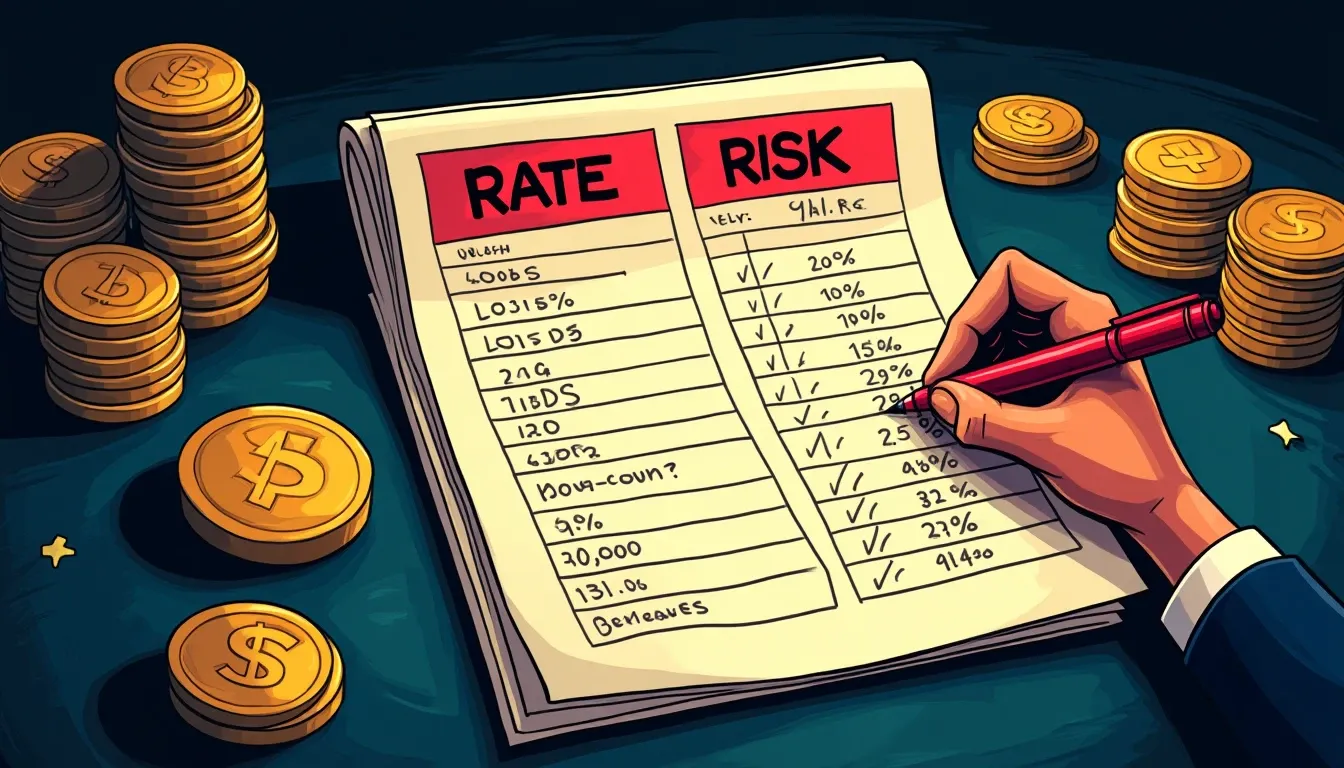
Create a spreadsheet with these columns:
- Protocol
- Asset
- Chain
- TVL
- Current APY
- Utilization %
- Collateral Accepted
- Audit Firm + Date
- Withdrawal Mechanism
- Estimated Gas Cost (bps)
- Effective Yield (APY minus friction)
- Risk Rating (1-5 scale)
Pull live data from DefiLlama for TVL, utilization, and rates. Protocol documentation covers collateral rules and withdrawal mechanics. Sherlock and DeFi Sentinel track audit history and exploit events.
Snapshot all data on the same date. TVL fluctuates with asset prices, deposits, and protocol migrations. A rate comparison from Monday versus Friday can reflect two different liquidity environments.
Risk Rating Methodology
Assign a 1-5 risk score based on:
- Audit coverage: No audit = 5. Single audit older than 12 months = 4. Multiple audits within 12 months = 2. Continuous audit program (Aave, Compound) = 1.
- TVL and market depth: Below $100M = +1 risk point. Above $1B = -1 risk point.
- Exploit history: Any loss event in past 24 months = +2 risk points. Post-exploit relaunch (Euler V2) = maintain elevated score until 12 months post-launch with no incidents.
- Governance and oracle architecture: Multisig with fewer than 5 signers = +1. Chainlink oracles = neutral. Custom oracle solution = +1.
Do not compare a protocol scored 2 against one scored 4. They are not the same risk level.
Match Collateral Requirements First
Aave V3 accepts 39% ETH, 28% liquid staking tokens, 14% BTC wrappers, and the remainder in major altcoins and stablecoin LP tokens as collateral. Morpho Blue enables isolated markets with customizable collateral per vault. Compound V3 restricts each market to a single borrow asset with limited collateral types.
If your current position on Aave accepts stETH collateral at a 1.25 liquidation threshold and you are comparing to a Morpho vault that requires ETH-only collateral at 1.15, the risk profiles diverge. The Morpho vault is more conservative. A higher rate there is not a free lunch. It reflects tighter collateral rules reducing borrower demand.
Match collateral composition before comparing rates. A 4.5% yield backed by ETH is structurally different from 4.5% backed by a mix of altcoins and stablecoin LP tokens. The latter carries correlation risk during market drawdowns.
Account For Utilization As A Rate Multiplier
Rates are not static. The supply rate equals the borrow rate scaled by utilization, minus the protocol's reserve factor. At 92.7% utilization, Aave borrowers paid 4.34% and lenders received 3.62%. At 60% utilization, the same borrow rate would deliver a lower supply rate.
A protocol showing 5.2% APY at 95% utilization is less stable than one showing 4.8% at 70% utilization. The first will drop sharply when borrowers repay and utilization falls. The second has room for utilization to rise, which would increase the rate.
Check 30-day utilization history on DefiLlama. If utilization spiked from 65% to 95% in the past week, the current rate is temporary. Wait for stabilization before redeploying capital.
Withdrawal Friction Tiers
Pooled markets like Aave and Compound have no lockup period, but withdrawals depend on available liquidity. When utilization reaches 100%, withdrawals wait until borrowers repay or new lenders arrive. Markets for DAI and USDC frequently exhibit periods above 80% utilization.
Isolated markets like Morpho Blue and Compound V3 operate independently with customizable parameters. Each market's liquidity is separate. A high utilization rate in one vault does not affect another.
Curated vaults like MetaMorpho add a wrapper layer. Check the underlying vault's asset liquidity, not just the wrapper's TVL. A vault with $50M TVL but only $5M withdrawable due to 90% utilization has meaningful friction.
Assign a withdrawal friction cost in basis points. Ethereum Layer 1 gas for a withdraw-and-redeposit cycle typically runs 20-50 bps depending on network congestion. If a protocol's utilization suggests withdrawal delays above 24 hours, add another 10-20 bps for opportunity cost.
Verify Audit Scope And Recency
A realistic pre-launch audit budget for a mid-complexity DeFi protocol in 2026 runs $60,000 to $120,000, including initial audit and at least one remediation review. Protocols whose codebases are forked are significantly less likely to engage auditors. Protocols deploying original code are more likely to undergo smart contract audits.
Audit adoption in DeFi correlates with protocol-level risk exposure, technical complexity, governance design, and code originality. The first quarter of 2026 alone saw $482 million lost across 44 security incidents. Reentrancy attacks, integer overflows, and oracle price manipulation remain top threats.
Check three audit dimensions:
- Firm reputation: Top-tier firms (Trail of Bits, OpenZeppelin, Sigma Prime, Certora) versus newer entrants. A known firm reduces but does not eliminate risk.
- Audit date relative to current code: If the last audit was 18 months ago and governance has since changed liquidation parameters, the audit does not cover current risk.
- Scope: Full protocol audit versus module-specific review. Some protocols audit the core lending logic but not the oracle or governance contracts.
Cross-reference the audit date with the protocol's governance timeline. A governance proposal that reduced collateralization ratios or increased reserve factors after the last audit introduces unaudited risk. For more on governance risk, see our multisig evaluation checklist.
Calculate Effective Yield After Friction
Effective yield equals the stated APY minus gas costs, withdrawal friction, and opportunity cost during lock or utilization-driven delays.
Example calculation for a $300,000 USDC position:
- Protocol A (current position): 3.8% APY, 75% utilization, no lockup, withdrawal costs 30 bps in gas. Effective yield: 3.8% - 0.3% = 3.5%.
- Protocol B (candidate): 4.5% APY, 92% utilization, no lockup, withdrawal costs 40 bps in gas, utilization suggests 12-hour delay adding 5 bps opportunity cost. Effective yield: 4.5% - 0.4% - 0.05% = 4.05%.
Net gain: 4.05% - 3.5% = 0.55%. On $300,000, that is $1,650 annually. If the move requires two transactions (withdraw from A, deposit to B) at 30 bps each, the breakeven period is 60 bps / 55 bps per year = 13 months. Only move capital if you expect to remain in Protocol B for more than 13 months.
If Protocol B's utilization has spiked recently and the 4.5% rate reflects temporary borrowing demand, the rate may drop to 3.9% within weeks. Effective yield falls to 3.45%, below your current position. The move costs you money.
Decision Tree: When To Move Capital
Use this decision tree for every comparison:
Step 1: Risk score match within ±1 point? If no, stop. Different risk levels.
Step 2: Collateral requirements and liquidation thresholds equivalent? If no, stop. Structural risk mismatch.
Step 3: Effective yield difference (after friction) above 1%? If no, stop. Friction cost exceeds gain.
Step 4: Target protocol's utilization stable over past 30 days (±10 percentage points)? If no, wait. Rate likely temporary.
Step 5: Audit coverage current within 12 months? If no, stop. Unaudited code changes introduce unknown risk.
Step 6: Estimated time in new position exceeds breakeven period (friction cost / annual gain)? If no, stop. You will not recover transaction costs before rebalancing again.
Only proceed to capital movement if all six checks pass.
Common Failure Modes And Real Examples
Failure mode 1: Chasing subsidized rates. Protocol offers 12% APY on USDC when market rates cluster around 4%. The gap is token emissions. If the protocol emits governance tokens worth 8% annually to lenders, you must account for dilution. Most governance tokens lose 60-80% of their value within six months of emission start. Your real yield is closer to 5.6% (4% + 1.6% from tokens after dilution), not 12%.
Failure mode 2: Ignoring withdrawal queues. You move $300,000 to a protocol offering 5.8% versus your current 4.2%. Utilization sits at 98%. Two weeks later, you need to withdraw. No liquidity available. You wait four days for borrowers to repay. During that time, you miss a 6.1% opportunity on another protocol and incur four days of opportunity cost. The delay erases your rate advantage.
Failure mode 3: Moving capital for sub-1% gains. Protocol A pays 3.9%. Protocol B pays 4.1%. You move $200,000 for a 0.2% gain ($400 annually). Gas costs are $120 round-trip (60 bps). Breakeven is 14 months. Three months later, Protocol A's utilization rises and its rate climbs to 4.3%. You are now underwater and contemplating another move, incurring another round of gas costs.
Failure mode 4: Cross-chain rate arbitrage without bridge-risk accounting. Ethereum mainnet offers 3.8% on USDC. Arbitrum offers 5.1%. You bridge $250,000 to Arbitrum. Bridge fee is 15 bps. Bridging back costs another 15 bps. Effective gain: 5.1% - 3.8% - 0.3% = 1.0%. You also introduced bridge contract risk and L2 sequencer risk, which are not present on mainnet. The risk-adjusted return is lower than the nominal 1.3% spread.
Monitor These Signals Monthly
Set a two-hour monthly review to check:
- Utilization drift: Has your current protocol's utilization changed by more than 15 percentage points in the past 30 days? If yes, recalculate effective yield. A drop from 85% to 65% will reduce your rate.
- New audit reports: Has your protocol or a competitor published a new audit? New findings may change the risk score.
- Governance changes: Has a governance vote altered collateral ratios, reserve factors, or liquidation thresholds? If yes, verify whether the change was audited.
- Rate spreads: Run the comparison spreadsheet again with current data. Has a 0.8% spread widened to 1.5%? That may justify a move. Has a 1.2% spread narrowed to 0.6%? The opportunity has closed.
- New protocol launches or vault offerings: MetaMorpho vaults, new Compound V3 markets, or Euler V2 vault deployments may introduce better risk-adjusted rates. Evaluate them against your decision tree.
Do not react to day-to-day rate fluctuations. DeFi protocols offer variable rates that respond to supply and demand. A single-day spike or drop is noise. A sustained 30-day trend is signal.
Edge Cases That Break The Model
Collateral deprecation risk: Lido's dominance raises decentralization questions. With approximately 28% of staked ETH, it approaches the threshold where it could theoretically influence consensus. The Lido DAO has implemented a self-limiting function, but this remains a philosophical debate. If Ethereum governance moves to penalize concentrated staking, stETH collateral may face haircuts. A protocol heavily backed by stETH carries tail risk not reflected in current audit scores or TVL.
Oracle manipulation during low liquidity: Smaller protocols with TVL below $200M may use Chainlink oracles, but the oracle's price feed depends on sufficient DEX liquidity for the asset. If liquidity drops below $10M during a market event, oracle prices can lag or spike, triggering unintended liquidations. Your risk score should penalize protocols with thin on-chain liquidity relative to TVL.
Governance attack surface: A protocol with a 5-of-9 multisig controlling treasury and parameter changes is more vulnerable than one with a 10-of-15 multisig plus a 48-hour timelock. Even if both protocols have identical audit coverage, the governance structure introduces different risk. For a deeper breakdown, review how to audit multisig composition before depositing.
Composability cascades: A protocol offering 6% APY may depend on another protocol's yield primitive (e.g., Morpho vault sourcing yield from an underlying Aave position). If the underlying position suffers an exploit or liquidity crunch, the wrapper protocol's yield drops to zero even though its own contracts were not compromised. Always trace the yield source to its origin.
What To Do Next
Open a spreadsheet. Add the columns listed in section three. Pull current data for your existing position and three competitor protocols offering higher stated APY on the same asset. Calculate effective yield after friction. Run the decision tree.
If no protocol passes all six checks, do nothing. Staying put is a decision. If one protocol passes, calculate the breakeven period and set a calendar reminder to re-evaluate in 30 days. If the rate spread persists, move capital.
Repeat this process monthly. Rate environments shift. What was a 0.6% gap in March may widen to 1.8% in June as utilization patterns change. The systematic process captures those shifts without requiring daily monitoring.
The Takeaway
A 1-3% improvement on a $300,000 allocation generates $3,000 to $9,000 annually. The difference between earning that and losing money on gas costs is a structured comparison process. Match risk scores and collateral requirements first. Calculate effective yield after friction. Verify rate stability over 30 days. Move capital only when the net gain exceeds 1% and the breakeven period fits your time horizon.
The mechanism that produces better risk-adjusted yield is not luck. It is systematic decomposition of what the rate actually consists of, what friction costs are, and whether the spread is structural or temporary. Most allocators skip those steps and chase APY. That is why the gaps persist.
Frequently Asked Questions
What is the minimum rate difference worth moving capital for?
Move capital only when the effective yield difference (after gas and friction costs) exceeds 1% annually and the breakeven period fits your time horizon. A 0.5% spread on Ethereum Layer 1 is typically break-even after accounting for withdrawal and redeposit gas costs of 20-50 basis points. Smaller spreads cost you money in transaction fees. Always calculate net gain after friction before moving.
How do I know if a higher APY reflects real yield or temporary subsidies?
Check the protocol's utilization history over 30 days on DefiLlama. If utilization spiked from 65% to 95% recently, the rate is likely temporary and will drop when borrowing demand normalizes. Also verify whether the yield includes token emissions. If the stated APY is 12% but the market baseline is 4%, the gap is usually governance token rewards that dilute 60-80% within six months. Your real yield is closer to the baseline plus 20-40% of the emission value.
What risk score difference disqualifies a comparison?
Do not compare protocols whose risk scores differ by more than one point on a 1-5 scale. A protocol scored 2 (multiple recent audits, high TVL, no exploit history) is structurally different from one scored 4 (single old audit, low TVL, or post-exploit relaunch). The higher rate on the riskier protocol compensates for that risk. It is not a free improvement. Match risk profiles first, then compare rates.
How often should I rerun the comparison process?
Monthly. Set a two-hour review to check utilization drift, new audits, governance changes, and rate spreads. DeFi rates are variable and respond to supply and demand. A 0.8% spread in March may widen to 1.5% in June or narrow to 0.3%. The systematic process captures structural shifts without requiring daily monitoring. Do not react to single-day rate fluctuations. A sustained 30-day trend is signal; daily moves are noise.
What if the protocol with the best rate has high utilization and withdrawal delays?
Account for withdrawal friction in your effective yield calculation. If a protocol shows 5.8% APY but 98% utilization suggests a four-day withdrawal delay, add 10-20 basis points for opportunity cost. If the delay exceeds your liquidity needs (e.g., you may need to withdraw on short notice), the protocol does not match your risk profile regardless of rate. Pooled markets like Aave and Compound have no lockup but depend on available liquidity. When utilization reaches 100%, withdrawals wait until borrowers repay.
You have just built a decision tree that isolates 1-3% structural rate gaps without increasing risk. Those gaps will shift as utilization and governance parameters change monthly.
Every Thursday: where crypto yield actually is - stablecoins, liquid staking and DeFi lending, with the risk named next to the rate and what changed since last week.
Get it free every ThursdayFree. No trade calls, no allocations, no hype. Unsubscribe in one click.