Table of Contents
What You Will Accomplish

You will build a breakeven model that compares your cumulative gas costs against expected airdrop allocations based on historical distribution data. This model uses chain-specific transaction fees, activity-level tiers, and opportunity cost to determine whether a farming strategy nets positive before you spend a dollar.
Most airdrop farming guides skip the cost accounting. They show you where to interact but not how to calculate whether the interaction is worth the gas. The blockchain shows exactly what you spent. It also shows what past airdrops paid at different activity levels. If you compare those two numbers honestly, most farming campaigns fail the breakeven test.
This framework requires a spreadsheet, access to gas trackers for your target chains, and historical allocation data from past airdrops. You will model total costs over a six-month farming cycle and compare that figure against conservative allocation estimates. If the expected value falls below 5% of your gas spend, the campaign does not pass the filter.
Step 1: Establish Your Gas Cost Baseline By Chain

Gas costs vary by three orders of magnitude depending on which chain you farm. A swap on Ethereum mainnet costs $0.03 as of October 2026. The same swap on Base costs $0.05 total per transaction. On Solana, approximately $0.001. The chain you choose determines whether you spend $1 or $200 for the same activity count.
Start by recording current gas prices for the chains where your target protocols operate. Check Etherscan for Ethereum mainnet. Use L2Beat or native block explorers for Base, Arbitrum, and Optimism. For Solana, reference Solscan. Record the cost of a standard token swap, a liquidity pool deposit, and a smart contract interaction. These are the three most common farming actions.
Base currently charges $0.05 to $0.15 per transaction. Arbitrum runs $0.08 to $0.20. Optimism sits at $0.15 to $0.30. Solana remains under $0.01. Layer 2 networks reduce costs by 10x to 100x compared with Ethereum mainnet. If your target protocol operates on multiple chains, you already know which one to farm.
Next, estimate your total interaction count over six months. Conservative farming requires at least 20 to 30 interactions to signal genuine usage. That includes swaps, LP deposits, bridge transactions, governance votes, and NFT mints. Multiply your interaction count by the per-transaction cost. On Base, 25 interactions cost $1.25 to $3.75. On Ethereum mainnet during moderate congestion, the same activity runs $750.
Add bridge costs. Moving capital from Ethereum to a Layer 2 costs $1 to $5 depending on mainnet gas at the time. This is a one-time expense, but it belongs in your total cost basis. If you farm three protocols on three different chains, you pay bridge fees three times.
Your baseline is the sum of transaction gas, bridge fees, and any protocol-specific fees like swap routing costs. Record this number in your spreadsheet. It is the denominator in your breakeven calculation.
Step 2: Model Expected Allocation Using Historical Precedents

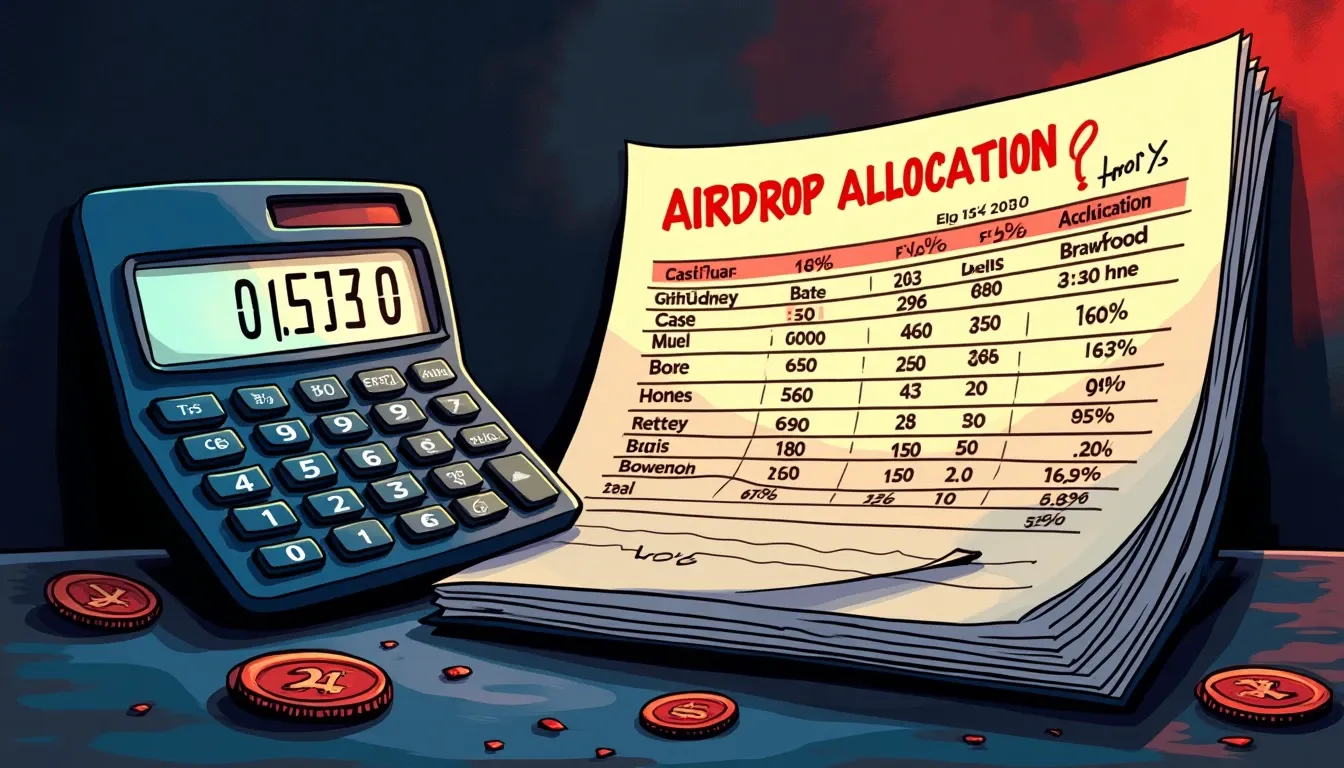
Historical airdrop data provides allocation ranges at different activity levels. Uniswap in September 2020 gave 400 UNI tokens to 251,534 addresses. At launch, that allocation was worth $1,200. Arbitrum in March 2023 distributed 625 to 10,250 ARB tokens to over 245,000 addresses. The median allocation was 1,250 ARB. Hyperliquid in November 2024 sent tokens to 94,000 users. The average allocation was 2,915 tokens, but the median was 64.53 tokens.
Notice the difference between average and median. Averages are inflated by whale allocations. The median tells you what a typical farmer actually received. If you are not a liquidity provider with seven-figure volume, model your expectation against the median, not the average.
Allocation formulas now use logarithmic scaling, not linear. $10,000 in transaction volume does not yield ten times the reward of $1,000 in volume. Projects like zkSync required interactions with at least 10 non-token smart contracts and trading at least 10 distinct ERC-20 tokens. Arbitrum required points across multiple categories including bridging, distinct monthly activity, and smart contract calls.
Your expected allocation depends on your activity tier. Define three tiers: minimum qualifying activity (10 to 15 interactions over three months), moderate activity (20 to 30 interactions over six months), and high activity (50+ interactions, liquidity provision, governance participation). Most retail farmers fall into the moderate tier.
Use historical medians to estimate allocation. For a moderate-tier farmer on a major protocol, assume allocation between $200 and $1,500 at token launch. For minimum-tier, assume $50 to $300. For high-tier, assume $1,000 to $5,000. These are conservative estimates based on Arbitrum, Optimism, and zkSync distributions.
Multiply your allocation estimate by 0.6 to account for token price volatility between snapshot and claim. Approximately 64% of airdrop recipients sell immediately at the token generation event, creating sell pressure. Even large allocations lose value fast if you do not claim within the first 48 hours.
Record your adjusted expected allocation in the spreadsheet. This is the numerator in your breakeven calculation.
Step 3: Calculate Breakeven Threshold And ROI Filter
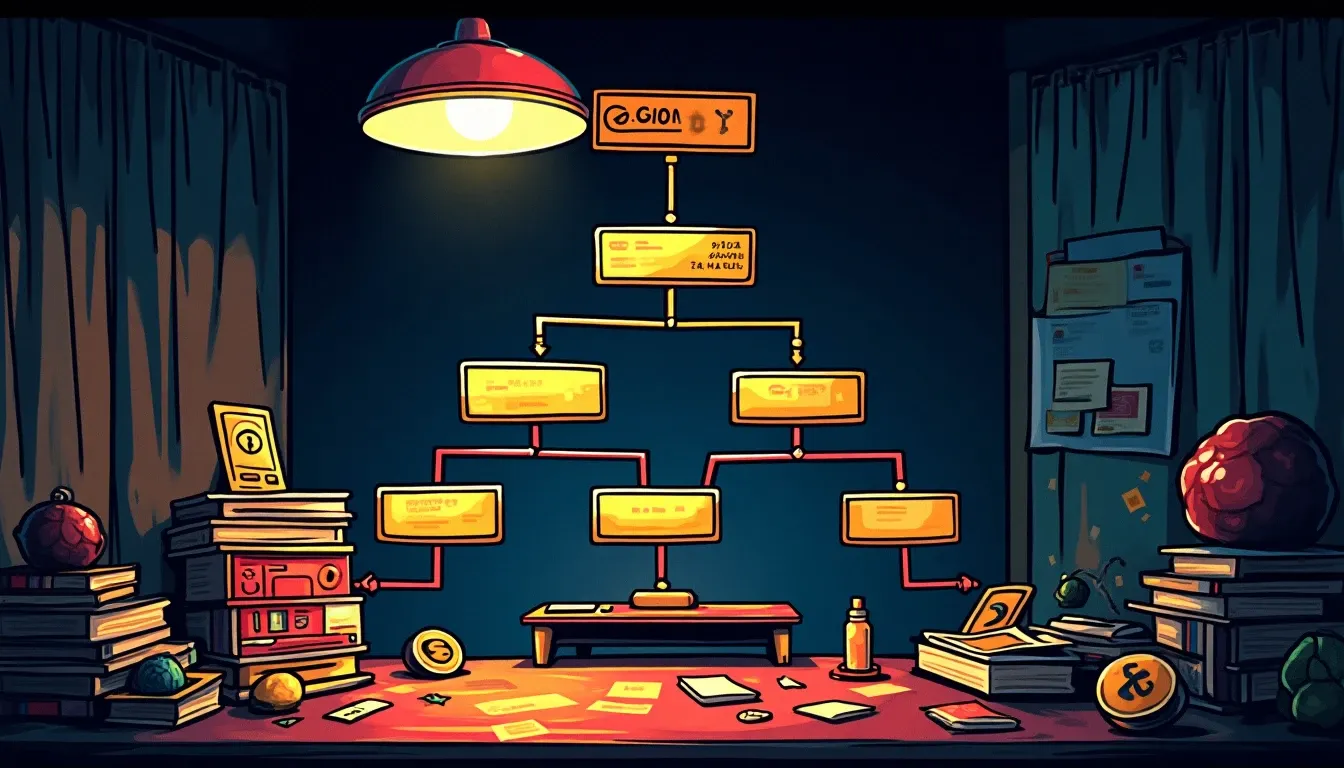
Your breakeven threshold is the point where expected allocation value exceeds total gas costs. If you spent $50 in gas and expect a $200 allocation, your breakeven ratio is 4:1. If you spent $150 and expect $180, your ratio is 1.2:1. The rule of thumb: interaction cost should fall under 5% of conservative allocation estimates. That yields a 20:1 return on gas spend, which accounts for uncertainty, token volatility, and opportunity cost.
Here is the formula:
Breakeven Ratio = (Expected Allocation x 0.6) / (Total Gas Cost + Bridge Fees)
If the ratio is below 5, the campaign fails the filter. You are spending too much gas relative to realistic expected value.
Apply this formula to a real example. You farm a protocol on Base for six months. You complete 25 transactions at $0.10 average cost. You paid $3 in bridge fees. Total cost: $5.50. You estimate moderate-tier allocation at $400, discounted to $240 after volatility. Breakeven ratio: 240 / 5.50 = 43.6. This campaign passes.
Now run the same activity on Ethereum mainnet during bull market gas conditions. Same 25 transactions, but at $15 average cost. Bridge fee: $5. Total cost: $380. Expected allocation remains $240. Breakeven ratio: 240 / 380 = 0.63. This campaign fails. You will lose money even if the allocation arrives exactly as modeled.
The difference is the chain. Most airdrop farming campaigns that fail the breakeven test fail because farmers chose the wrong execution layer. If a protocol operates on both Ethereum mainnet and a Layer 2, farming the Layer 2 increases your breakeven ratio by 50x to 100x.
Add a column to your spreadsheet for opportunity cost. If you lock $500 in a liquidity pool for six months to qualify for an airdrop, you are forgoing the yield that capital could earn elsewhere. At 5% stablecoin yield, you lose $12.50 in opportunity cost. Add this to your total cost basis. The breakeven ratio drops accordingly.
Finally, add a risk adjustment for snapshot timing. Protocols capture wallet eligibility at a specific block height but do not announce the date in advance. If you start farming two weeks before the snapshot, you pay full gas costs but may not accumulate enough activity to qualify. Multiply your expected allocation by 0.8 to account for timing risk if you enter a farming campaign less than four months before anticipated snapshot.
Step 4: Model Activity Level Requirements And Sybil Filters
Activity level determines allocation tier, but raw transaction count no longer works. Projects analyze interaction frequency, action diversity, multi-chain activity, wallet age, and funding patterns. Modern Sybil detection filters out 48% to 85% of farming wallets. If your activity pattern looks mercenary, you receive nothing regardless of transaction count.
ZkSync disqualified wallets that interacted with fewer than 10 distinct smart contracts. Arbitrum awarded points for activity across distinct months, not just total volume. Hyperliquid favored early testers who used the platform before it gained traction. Duration over volume is now the standard.
Your model must account for Sybil risk. If you run multiple wallets from the same funding source, interact with protocols in identical sequences, or execute transactions within seconds of each other across wallets, clustering algorithms will flag you. Sybil detection tools trace funding graphs, transaction timing, and behavioral sequences.
Add a Sybil risk discount to your expected allocation. If you farm with a single wallet using organic activity patterns, apply no discount. If you run 3 to 5 wallets with varied activity, apply a 20% discount. If you run 10+ wallets with automated or coordinated behavior, apply a 70% discount or assume disqualification.
The safest activity pattern: one wallet, six months of consistent use, interactions with 5+ protocols, participation in governance or testnets, and wallet age over one year. This pattern passes most filters and qualifies for moderate to high-tier allocations. The riskiest pattern: new wallet funded via Tornado Cash, identical transaction sequences across multiple addresses, and all activity concentrated in the final 30 days before anticipated snapshot.
Include Sybil risk in your breakeven model by adjusting expected allocation downward. A $400 allocation estimate with 70% Sybil risk becomes $120. If your gas costs total $80, your breakeven ratio drops from 5:1 to 1.5:1. The campaign no longer passes the filter.
Common Failure Modes And How To Recognize Them Early
The most common failure mode is farming the wrong chain. If your gas costs exceed $50 for a single protocol and you are not providing liquidity above $10,000, you already failed the breakeven test. Switch to a Layer 2 or exit the campaign.
The second failure mode is overestimating allocation. Farmers see Hyperliquid's average allocation of 2,915 tokens and assume they will receive similar amounts. The median was 64.53 tokens. If you model against the average instead of the median, your breakeven ratio inflates by 45x. Use medians.
The third failure mode is ignoring opportunity cost. Locking $2,000 in a liquidity pool for six months costs $50 in foregone stablecoin yield at 5% APY. Add impermanent loss if the pool is volatile. Add exit gas costs to remove liquidity. Your total cost basis is gas plus opportunity cost plus impermanent loss plus exit fees. Most farmers only count gas.
The fourth failure mode is late entry. If a protocol has been live for 18 months and you start farming three months before anticipated snapshot, you compete against wallets with much longer activity histories. Allocation formulas reward duration. You will land in the minimum tier even if you execute 50 transactions in three months. Start early or do not start.
The fifth failure mode is snapshot timing risk. Protocols announce airdrops after the snapshot, not before. You might farm for six months, then discover the snapshot occurred in month four. All activity after that date is worthless. This is unquantifiable risk. The only mitigation is starting early and farming continuously.
Watch for these signals: gas costs above $100 for a single protocol, allocation estimates based on averages instead of medians, locked capital with no yield offset, activity duration under four months, and protocols that have not announced tokenomics or governance structures. Any one of these signals suggests the campaign will fail breakeven.
What To Do Next: Build Your Model And Run Scenarios
Open a spreadsheet. Create columns for chain, transaction count, cost per transaction, bridge fees, total gas cost, opportunity cost, expected allocation, volatility adjustment, Sybil risk adjustment, and breakeven ratio. Input real gas costs from block explorers. Input realistic allocation estimates from historical medians.
Run three scenarios: conservative (minimum-tier allocation, high Sybil risk, unfavorable volatility), base case (moderate-tier allocation, low Sybil risk, median volatility), and optimistic (high-tier allocation, no Sybil risk, favorable volatility). Calculate breakeven ratio for each scenario. If the conservative scenario yields a ratio below 3, the campaign is too risky.
Compare multiple protocols. Rank them by breakeven ratio. Farm the top three. Ignore the rest. Your capital and time are finite. Farming 12 protocols spreads your activity too thin. You land in minimum tier across all of them. Farming three protocols with deep, consistent activity over six months puts you in moderate to high tier.
Update your model monthly. Gas costs change. Token launch expectations change. New historical data arrives when other protocols distribute airdrops. Adjust your allocation estimates based on the most recent comparable distribution. If the latest airdrop paid median allocations 40% lower than historical norms, discount your estimates accordingly.
Track your actual spending. Log every transaction hash, timestamp, and gas cost in a separate sheet. Compare actual gas spend against your model every 30 days. If actual costs exceed modeled costs by more than 20%, you are farming inefficiently. Reduce interaction frequency or switch to cheaper transaction types.
The model is not a prediction. It is a filter. Campaigns that pass the breakeven test under conservative assumptions are worth farming. Campaigns that fail are not. The blockchain will show you the exact cost. Historical distributions show you realistic allocations. The math is simple. Most farmers just do not run it.
The Takeaway
You now have a breakeven framework that uses chain-specific gas costs and historical allocation medians to determine whether airdrop farming nets positive. The critical variables are transaction cost per chain, activity tier based on duration and diversity, Sybil risk, and opportunity cost. If your conservative scenario yields a breakeven ratio above 5, the campaign passes. If it yields below 3, you will burn more in gas than you recover.
Gas prices fluctuate. Allocation formulas evolve. Sybil filters tighten. Run this model monthly using current gas data and the most recent airdrop distributions. The protocols that passed the filter last quarter may fail it this quarter. The numbers you see today will be different next month.
FAQ
Frequently Asked Questions
What is the minimum breakeven ratio that makes airdrop farming worth the gas cost?
A breakeven ratio of 5:1 or higher is the standard filter. This means your expected allocation after volatility adjustment should be at least five times your total gas and bridge costs. Ratios between 3:1 and 5:1 are marginal and depend on your risk tolerance. Ratios below 3:1 indicate you will likely spend more in gas than you recover from the airdrop, especially after accounting for Sybil risk and opportunity cost.
How do I estimate expected allocation when a protocol has not distributed an airdrop yet?
Use historical medians from comparable protocols. Arbitrum's median allocation was 1,250 ARB. ZkSync required 10+ smart contract interactions for eligibility. Model your allocation against the median, not the average, and apply a tier based on your activity level: minimum tier $50-$300, moderate tier $200-$1,500, high tier $1,000-$5,000. Discount by 40% for token volatility and another 20-70% based on your Sybil risk profile.
Which blockchain has the lowest gas costs for airdrop farming in 2026?
Solana has the lowest transaction costs at approximately $0.001 per transaction. Among Ethereum Layer 2 networks, Base offers the best value at $0.05-$0.15 per transaction, followed by Arbitrum at $0.08-$0.20. Ethereum mainnet costs $0.03 for token swaps but spikes during congestion. For systematic airdrop farming, Base and Solana offer the best cost efficiency with 50x-100x lower fees than Ethereum mainnet.
How does Sybil detection affect my expected allocation and breakeven calculation?
Sybil filters now exclude 48-85% of farming wallets by analyzing funding patterns, transaction timing, and address clustering. If you run multiple wallets from the same funding source with identical activity sequences, apply a 70% discount to your expected allocation or assume disqualification. Single-wallet farmers with organic activity and wallet age over one year face minimal Sybil risk. Include this adjustment in your breakeven model by reducing expected allocation before calculating the ratio.
Should I include opportunity cost in my airdrop farming breakeven model?
Yes. If you lock $500 in a liquidity pool for six months to qualify for an airdrop, you forgo yield that capital could earn elsewhere. At 5% stablecoin yield, the opportunity cost is $12.50 over six months. Add this to your total cost basis alongside gas and bridge fees. For volatile LP positions, also include estimated impermanent loss and exit gas costs. Most farmers only count gas and miss 30-50% of their true cost basis.
You just compared gas costs across five chains and modeled allocation tiers using real Arbitrum and zkSync data. Those gas prices and allocation formulas will shift next quarter.
Every Thursday: where crypto yield actually is - stablecoins, liquid staking and DeFi lending, with the risk named next to the rate and what changed since last week.
Get it free every ThursdayFree. No trade calls, no allocations, no hype. Unsubscribe in one click.