Table of Contents
The Question That Separates Yield Strategies That Survive From Those That Don't

The question is simple enough that most readers skip past it without pausing: where does the yield come from? Not the token name, not the APY number, but the actual economic mechanism generating the return. That mechanism determines whether the yield persists when market conditions turn or vanishes the moment you need it most.
I have watched three cycles now where readers deployed capital into high-APY strategies during bull markets, then watched those same strategies return zero during the following bear. The pattern repeats. The wrappers change. The lesson doesn't.
Structural yield persists across bull and bear markets because it comes from real economic activity: protocol fees, trading spreads, borrowing demand, or MEV capture. Cyclical yield appears during one phase of the market and disappears during another because it comes from token emissions, protocol subsidies, or leverage structures that only function when market conditions support them.
The difference matters because most readers allocate capital based on the APY number without asking which category they're entering. That confusion commits capital at exactly the wrong time, then holds it through the phase turn when the yield source dries up.
Structural Yield: What Persists When Market Conditions Turn

Structural yield comes from mechanisms that generate revenue regardless of whether the broader market is rising or falling. These strategies pay returns from actual protocol activity, user fees, or arbitrage opportunities that exist independent of token price.
Protocol Fees And Real Revenue
DEXs earn revenue by charging fees on trades, approximately 0.01% to 0.3% per swap. Aave charges a spread on the difference between borrowing and lending rates, plus a 0.09% fee on flash loans. During the TerraUSD collapse in May 2022, Curve made $7.5 million in revenue from transaction fees and swap fees in one week while the broader market was capitulating.
That week is the test.
When markets are falling and most yield strategies are going to zero, protocol fee structures keep paying because users keep trading, borrowing, and moving capital. The volume may decline, but the mechanism persists. The best DeFi protocols survived 2022 by generating revenue from real activity rather than subsidizing yield through emissions.
Real yield is return paid from actual protocol revenue rather than newly minted tokens. Current structural yields run lower than cyclical yields by design. Aave's largest USDT pool yields 1.84%, while several other pools sit below 2%. Those numbers look unimpressive compared to 2021 farm APYs, but they represent sustainable income that kept paying through the 2022 bear market while emission-based farms went to zero.
Staking And MEV Capture
Ethereum staking currently returns 2.8% to 4% APY against issuance of roughly 1%, putting real yield near 2% to 3%. Lido takes a 10% fee on rewards that trims a 3% gross return to roughly 2.4% net. Jito is the largest Solana LST at roughly $2.4 billion in JitoSOL TVL, charging a 4% protocol fee, and producing a blended 7.5% to 8.5% APY because MEV tips lift returns 50 to 150 basis points above plain SOL staking.
These yields come from validator economics and MEV extraction, both of which persist across cycles. When Ethereum price dropped 77% from November 2021 to June 2022, staking rewards kept accruing. The dollar value of those rewards fell with ETH price, but the percentage yield remained structurally intact because it comes from protocol issuance and transaction ordering, not from subsidies or leverage.
Funding Rate Carry In Derivatives
Perpetual futures account for over 90% of derivatives volume on most exchanges. The funding rate is the cash exchanged between long and short counterparties, typically paid every 8 hours. Over the past six years, the funding rate on Binance has averaged about 14% per annum against a U.S. T-bill rate that averaged around 3%, a gap of 11%.
Crypto carry persists at times exceeding 40% per annum and averages around 7-8% per year, offering an 8% return per year that carries no price risk as futures and spot prices converge at maturity. This yield comes from structural imbalance in derivatives markets where long positions persistently outnumber shorts, creating a premium that market-neutral traders capture through basis strategies.
During extreme market conditions, funding rates can spike to 0.1%+ per period with annualized funding costs exceeding 100% in volatile periods. The yield is structural because the imbalance persists, but the magnitude is cyclical. Patient allocators accumulate positions when funding is compressed and rotate when it spikes.
Cyclical Yield: What Disappears When The Phase Turns
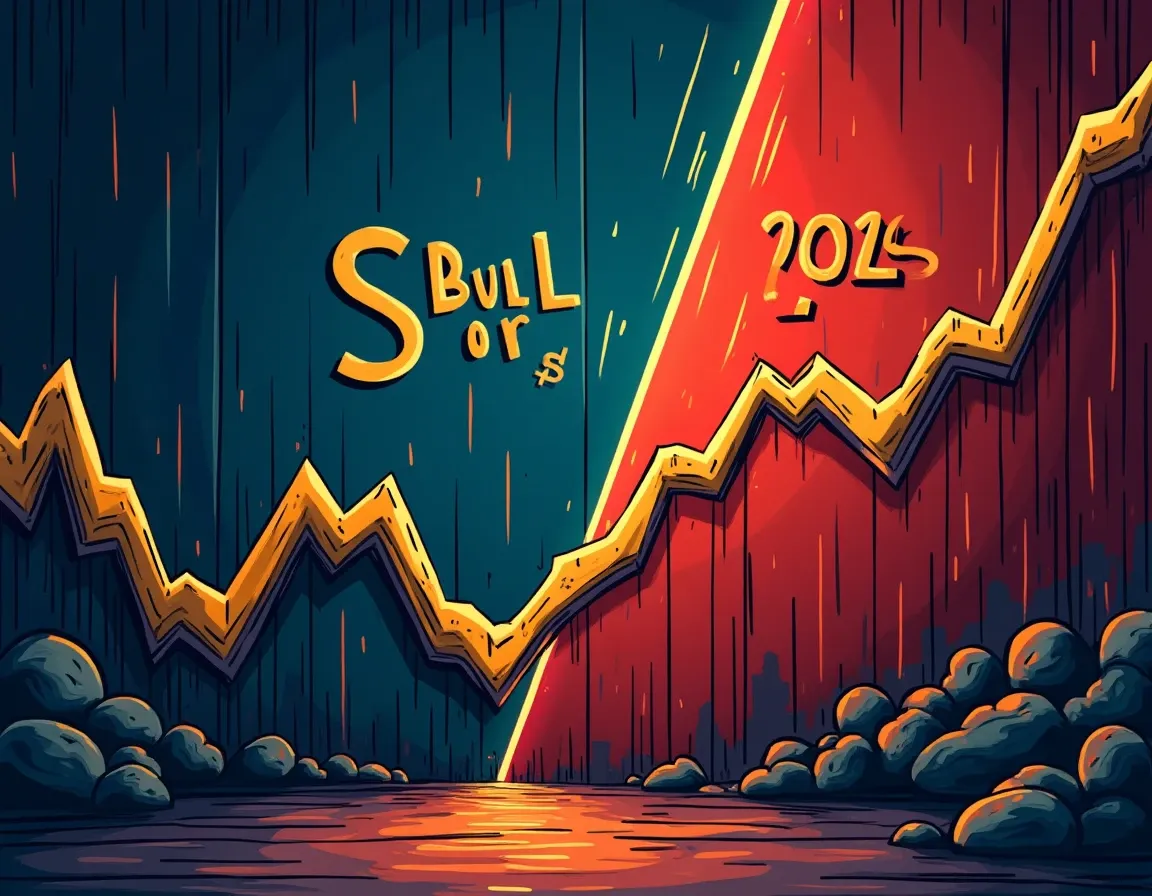
Cyclical yield comes from mechanisms that only function during specific market phases. These strategies pay high returns during bull markets and go to zero during bear markets because the yield source depends on market conditions that do not persist.
Token Emissions And Protocol Subsidies
The term "real yield" was popularized in late 2022 after the collapse of several "DeFi 2.0" tokens whose 1000%+ APRs were entirely funded by emissions. As token price fell, the dollar value of yield collapsed with it. Early adopters sometimes saw triple-digit APYs in yield farming, but those returns proved unsustainable.
The 2021 emission farms are the clearest case study. COMPOUND (COMPUSDT) topped in May 2021, dropped until June 2022, then formed a technical double-bottom around June 2023. A neutral sideways period between June 2022 and June 2023 marked a lost year where farms that had advertised 80% to 300% APY returned zero in dollar terms because the token used to pay yield lost 90% of its value.
Extra rewards that once boosted returns have largely disappeared, leaving only organic yield driven by borrowing demand. That demand is not strong enough to push yields higher without subsidy. Aave frames current yield weakness as cyclical rather than structural, pointing to depressed crypto sentiment as a key driver of reduced borrowing demand, noting that "stablecoin rates on Aave have largely tracked leverage demand" and "We do not see them as structurally lower going forward."
This is the exact confusion your allocation framework should demolish.
Borrowing demand is cyclical. Protocol fees are structural. A protocol that generates yield only when borrowing demand is high will stop paying when the cycle turns. A protocol that generates yield from transaction fees will keep paying at a lower rate, but it will keep paying.
Leverage Stack And Recursive Lending Risk
Recursive lending amplifies yield when the return on collateral exceeds borrowing cost, repeating deposit, borrow, and redeposit cycles until reaching a stable equilibrium. With wstETH collateral, the collateral accrues yield while debt does not. Each wstETH token represents slightly more ETH over time due to staking rewards, so effective supply APY exceeds borrow APR.
The strategy works during calm markets when collateral value is stable and borrowing rates remain below staking returns. It stops working when volatility spikes, collateral value drops, and liquidation thresholds compress. The June 2022 collapse liquidated billions in leveraged positions within 72 hours because collateral lost value faster than positions could be unwound.
Liquidity pool strategies that stack leverage on top of LP positions fail the same way. The yield looks high during low-volatility bull markets. It goes negative during volatility events when impermanent loss combines with liquidation cascades.
Market-Dependent Subsidy Programs
Protocols launch incentive programs during bull markets to attract TVL. Those programs advertise 20% to 60% APY through a combination of protocol fees and token emissions. The headline number attracts capital. The footnote explains that 80% of the yield comes from emissions that vest over 12 months and decline on a schedule.
By the time the emissions vest, the token price has dropped 60% and the program has ended. The gross APY was real. The net return was zero or negative after accounting for token depreciation and opportunity cost.
Sustainable yield comes from real economic activity. Trading fees, lending demand, arbitrage opportunities, and derivatives activity generate revenue tied directly to actual protocol usage. Those revenues tend to remain more durable because they are supported by ongoing market demand rather than inflationary rewards.
When The Distinction Costs You: The 2021-2023 Case Study
The 2021-2022 bear market lasted roughly 18 months before recovery began. BTC dropped from $69,000 to $16,000 (-77%), accompanied by LUNA collapse, 3AC bankruptcy, FTX implosion, and Celsius freeze. Every cyclical yield strategy deployed in 2021 went to zero by 2023. Every structural yield strategy kept paying.
Readers who entered emission-based farms in Q2 2021 at advertised APYs of 80% to 300% saw those yields compress to zero by Q4 2022. The protocols did not lie. The farms paid exactly what they advertised in token terms. The tokens lost 85% to 95% of their value, turning a 150% APY into a -60% realized return.
Readers who entered protocol fee strategies in Q2 2021 at advertised APYs of 3% to 8% saw those yields compress to 1.5% to 4% by Q4 2022. The decline was real, but the mechanism kept working. A 4% yield on a token that dropped 70% is still a -66% realized return, but the yield kept accruing and the protocol kept functioning. When the market recovered in 2023, those positions participated in the recovery with yield still intact.
The split between what LPs keep and what the treasury takes determines whether the protocol can fund development, reward token holders, and survive a bear market without inflating its token. Sustainable protocols tie fees to real usage rather than emissions that dilute holders.
Risk-Adjusted Yield Framework
Sophisticated investors rarely use APY as sole metric. One volatile 20% yield fluctuating with token incentives versus another consistent 8-10% yield from stable revenue sources may appear superior by raw numbers, yet volatility, drawdowns, and complexity reduce long-term performance. Many investors prefer stable returns because consistency enables stronger compounding.
The opportunity cost of a 1% rate difference is quantifiable and linear. The opportunity cost of deploying capital into a cyclical yield strategy at the wrong phase of the cycle is total.
During late 2021, the choice between a 5% structural yield and a 150% cyclical yield looked obvious. By late 2022, the 5% structural yield had returned +5% (minus token depreciation). The 150% cyclical yield had returned -85% after accounting for token collapse and program termination.
How To Identify Structural vs Cyclical Yield Before You Deploy Capital
The distinction is visible before you commit capital if you ask the right questions. Where does the yield come from? What happens to that yield source if market conditions reverse? Has this yield source persisted through prior bear markets?
Revenue Source Audit
Open the protocol documentation and locate the fee structure. DeFi yield aggregators publish APY breakdowns that separate protocol fees from token emissions. If 80% of the advertised yield comes from emissions, the yield is cyclical. If 80% comes from protocol fees or staking rewards, the yield is structural.
Aave, Curve, and Uniswap publish transparent fee dashboards showing revenue from real activity. Protocols that do not publish revenue breakdowns or that obscure the emission percentage are signaling that the yield is cyclical.
Historical Stress Test
Check the protocol yield during the 2022 bear market. If the protocol existed in 2021 and the yield went to zero by 2022, the yield is cyclical. If the yield compressed but remained positive, the yield is structural.
Ethereum staking launched in December 2020 and has paid continuously through two bear markets. The yield compressed from 6% to 3%, but it never stopped. Solana staking has paid continuously since 2020 with similar compression patterns. Those are structural yields.
Dozens of yield farms launched in 2021 with 200%+ APYs and terminated programs by 2022. Those were cyclical yields.
Mechanism Durability
Ask what market condition would cause the yield to stop. For protocol fee yields, the answer is "zero trading volume." For staking yields, the answer is "network shutdown." For emission yields, the answer is "end of incentive program" or "token price collapse."
The durability threshold tells you the category. Structural yields require catastrophic protocol failure to stop paying. Cyclical yields require only a phase change.
Cycle-Appropriate Allocation Strategy
The appropriate allocation depends on where you are in the cycle. During accumulation phases (2019, 2023), cyclical yields are compressed or absent. Structural yields persist at lower rates. This is when you accumulate quality assets for later deployment.
During markup phases (2020, 2024), cyclical yields begin appearing as protocols launch incentive programs. Structural yields expand modestly as activity increases. This is when you begin rotating a portion of capital into higher-yield strategies while maintaining structural yield positions.
During distribution phases (late 2021, potentially late 2025), cyclical yields reach maximum advertised APYs as protocols compete for TVL. Structural yields are healthy but lower than cyclical yields. This is when you rotate out of cyclical yields into structural yields or stablecoins, locking gains before the phase turns.
During capitulation phases (2022, potentially 2026), cyclical yields go to zero as programs terminate and tokens collapse. Structural yields compress but persist. This is when you hold structural positions and accumulate quality assets at depressed prices for the next cycle.
The readers who survived 2022 with capital intact were the ones who rotated out of cyclical yields in late 2021 and held structural yields or stablecoins through the downturn. The readers who deployed into 150% farms in Q2 2021 and held through 2022 lost most of their capital.
What The Current Environment Signals
As of October 2026, sustainable returns from fees, borrowing demand, and structured products are taking over as speculative incentives fade. Yield levels in crypto range from 1% to 15% APY depending on risk taken. Methods offering over 10% APY (restaking, yield farming) systematically come with high risk: increased smart contract complexity, risk of impermanent loss, or exposure to newer, less battle-tested protocols.
This is the maturation signal.
When the market stops rewarding cyclical yield and starts rewarding structural yield, the cycle is either in late distribution or early capitulation. The high-APY opportunities that defined 2021 have compressed. The durable fee-based yields that survived 2022 are still paying.
Staking returns across major chains have compressed to 2.5% to 8.5% depending on network. Those yields are structural. Stablecoin lending yields have compressed to 3.6% to 8.5% depending on platform and risk. Those yields are structural with cyclical variance in rate.
Emission-based farms that advertised 200% APY in 2021 are now advertising 15% to 40% APY in 2026, and most of that comes from token emissions on vesting schedules. Those yields are cyclical.
The allocation decision is visible. Structural yields are paying 2% to 8%. Cyclical yields are paying 15% to 40%. The spread between them is narrowing, which signals we are either in late markup or early distribution. When cyclical yields compress further or disappear, we will be in capitulation.
Readers who hold structural yields through the next phase turn will keep earning. Readers who chase the remaining cyclical yields will watch them go to zero when the turn happens.
The Takeaway
Structural yield persists across cycles because it comes from protocol fees, staking rewards, or derivatives imbalance that exists independent of market sentiment. Cyclical yield appears during bull markets and disappears during bear markets because it comes from emissions, subsidies, or leverage structures that only function when conditions support them. The readers who confuse the two commit capital at the wrong time and hold through the phase turn when the yield goes to zero. The readers who separate them accumulate structural positions during accumulation, rotate into cyclical positions during markup, rotate back into structural positions during distribution, and hold structural positions through capitulation. That rhythm has worked through three cycles. It will work through the next one.
Frequently Asked Questions
What is structural yield in crypto?
Structural yield comes from protocol fees, staking rewards, or derivatives imbalance that persists regardless of market conditions. Aave earns yield from the spread between lending and borrowing rates. Curve earns yield from swap fees. Ethereum staking earns yield from validator rewards. These mechanisms keep paying during bull and bear markets because they derive from actual protocol activity rather than token emissions or subsidies. The rate may compress during bear markets, but the mechanism continues functioning.
What is cyclical yield in crypto?
Cyclical yield comes from token emissions, protocol subsidies, or leverage structures that only function during specific market phases. Yield farms that advertised 150% to 300% APY in 2021 paid those returns through token emissions. When token price collapsed in 2022, the dollar value of yield went to zero even though the percentage remained nominally high. Cyclical yields appear during bull markets when protocols compete for TVL and disappear during bear markets when programs terminate or tokens lose value.
How do I identify structural vs cyclical yield before deploying capital?
Open the protocol documentation and locate the fee structure. DeFi aggregators publish APY breakdowns separating protocol fees from token emissions. If 80% of advertised yield comes from emissions, the yield is cyclical. If 80% comes from protocol fees or staking, the yield is structural. Check protocol yield during the 2022 bear market. If it went to zero, it was cyclical. If it compressed but remained positive, it is structural. Ask what market condition would stop the yield. Structural yields require catastrophic failure. Cyclical yields stop when the phase turns.
Why did 2021 yield farms go to zero by 2023?
Most 2021 yield farms paid returns through token emissions rather than protocol fees. When market conditions turned in 2022, token prices collapsed 85% to 95% and incentive programs terminated. A farm advertising 150% APY paid that rate in token terms, but if the token lost 90% of its value the realized dollar return was negative. COMPOUND topped in May 2021, dropped until June 2022, and formed a double-bottom by June 2023. Farms that depended on COMP emissions returned zero in dollar terms over that period despite nominally high APYs.
What yield strategies survive bear markets?
Protocol fee yields, staking rewards, and funding rate carry survive bear markets because they derive from structural activity. Ethereum staking has paid continuously since December 2020 through two bear markets, compressing from 6% to 3% but never stopping. Aave, Curve, and Uniswap kept generating fee revenue through 2022 even as volumes declined. Funding rates on perpetual futures compressed but remained positive because long-short imbalance persists across cycles. These yields compress during bears but continue paying, allowing holders to accumulate and participate in the next recovery.
You just reviewed the yield category framework that separates strategies that survive cycles from strategies that go to zero when the phase turns. Those thresholds will compress and expand with the next cycle.
Every Thursday: where crypto yield actually is - stablecoins, liquid staking and DeFi lending, with the risk named next to the rate and what changed since last week.
Get it free every ThursdayFree. No trade calls, no allocations, no hype. Unsubscribe in one click.