
Table of Contents
The Question

You see a token with a $50 million market cap. It looks small, accessible, early. Then you check its fully diluted valuation and find $800 million. That gap is not an accounting quirk. It is a calendar of future selling pressure written years in advance.
The difference between market cap and fully diluted valuation is the difference between what trades today and what exists tomorrow. Most retail investors look at market cap. Sophisticated allocators check FDV first.
Here is the answer in plain terms: market cap equals current price times circulating supply. Fully diluted valuation equals current price times total maximum supply. The gap between them represents locked tokens waiting to unlock.
How Market Cap and FDV Actually Work

Market cap measures the value of tokens trading right now. If 100 million tokens circulate at $1 each, market cap is $100 million. That number reflects real liquidity, real selling pressure, real equilibrium between current buyers and sellers.
Fully diluted valuation asks a different question: what if every token that will ever exist hit the market at today's price? If total max supply is 1 billion tokens at $1, FDV is $1 billion. It assumes the market could absorb all future supply without the price changing.
That assumption is wrong.
The gap between the two numbers tells you how much supply remains locked. A token with $100 million market cap and $1 billion FDV has 90% of its supply still to come. Unless demand grows proportionally when those tokens unlock, price declines to restore equilibrium.
This is not theory. CoinGecko's research confirms that tokens launched in 2024 had an average market cap-to-FDV ratio of just 12.3 percent. That means 87.7% of supply remains locked across recent launches.
Worked Example: Token A vs Token B
Token A trades at $1 with 800 million of 1 billion total supply circulating. Market cap: $800 million. FDV: $1 billion. The gap is $200 million, or 20% of total supply. Modest dilution risk remains.
Token B trades at $4 with 200 million of 1 billion total supply circulating. Market cap: $800 million. FDV: $4 billion. The gap is $3.2 billion, or 80% of total supply. Four times the circulating supply waits to unlock.
Both tokens have identical market caps. Token B has four times the eventual dilution. The price reflects float scarcity, not fundamental value.
Why the FDV Gap Predicts Sell Pressure
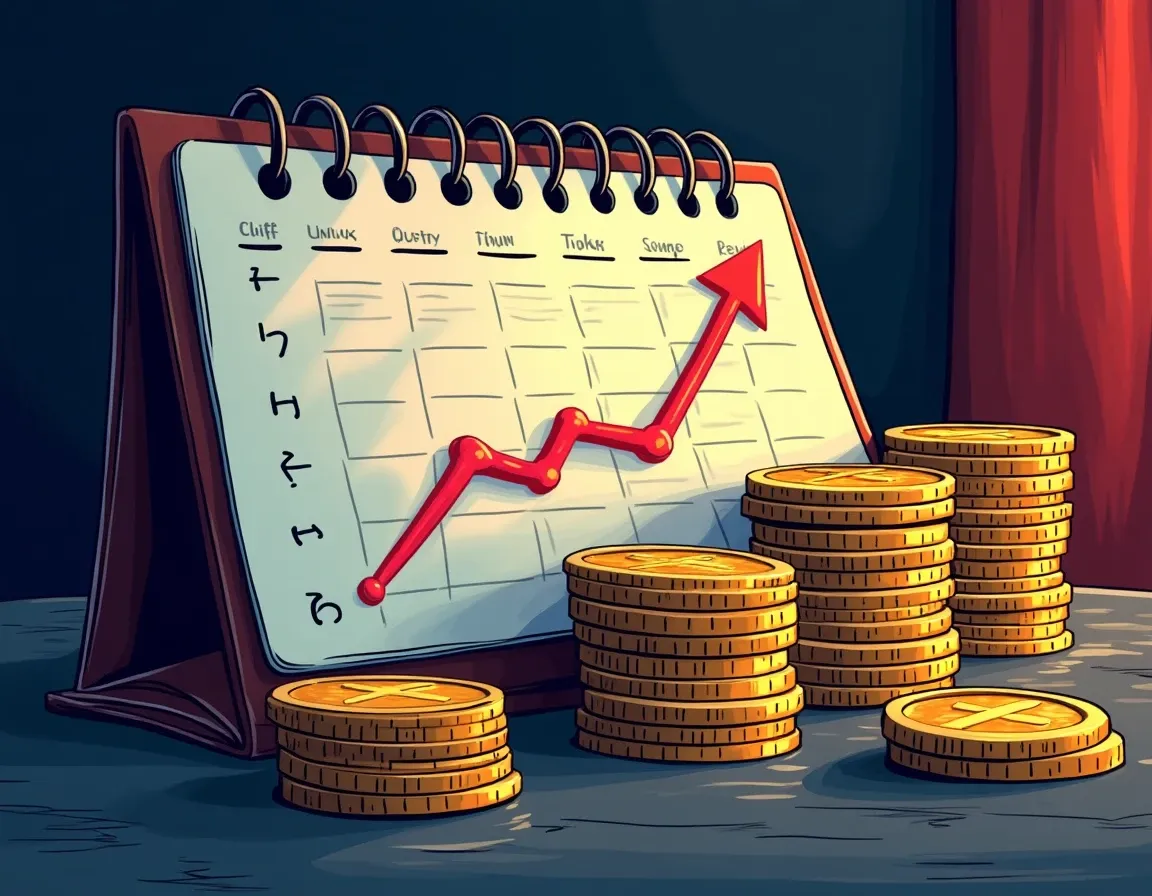
The gap between market cap and FDV is not static. It closes as tokens unlock. How it closes depends on the vesting schedule, holder incentives, and protocol revenue.
Vesting schedules determine when locked tokens become liquid. Common structures include cliff unlocks, linear vests, and staged releases. A cliff unlock releases nothing for 3 to 12 months, then dumps a large allocation all at once. Linear vesting releases fixed amounts daily or monthly over years. Staged unlocks combine cliffs at 6-month or 12-month intervals.
Cliff unlocks create the highest risk. When a cliff hits, recipients hold newly liquid tokens they acquired at seed or private-round prices far below current market. Even if they believe in the long-term thesis, they have every incentive to take some profit. The market prices in that pressure before the unlock arrives.
Solana offers the clearest case study. SOL reached a fully diluted valuation of $75 billion in November 2021 at $260 per token. Over 60% of supply remained locked with venture capitalists and the foundation. As tokens unlocked through 2022, price collapsed to $10, a 97% drop from all-time high. The protocol did not fail. Adoption continued. The unlock schedule simply delivered the dilution the FDV gap had warned about.
Arbitrum followed a similar pattern. ARB launched with roughly 12.5% of its 10 billion max supply circulating, creating an 8x FDV gap. Major 6-month cliff dates unlocked significant investor and team allocations simultaneously. ARB historically declined 10 to 15% in the 48 hours before cliff unlocks, with pressure most acute for the first 2 to 3 cliffs when investor allocations were largest relative to circulating supply.
Aptos and Sui launched with 7x to 10x+ gaps. Price declined as scheduled unlocks approached in both cases. The pattern repeats because the incentive structure does not change.
Supply Pressure Mechanics
A single unlock releasing 5% or more of circulating supply often creates 5 to 15% sell pressure within 48 hours. The exact magnitude depends on holder composition, market depth, and whether the protocol generates real fees.
When less than 20% of supply circulates, be extremely cautious. Projects unlocking large percentages monthly (above 5%) often collapse under sustained sell pressure. The HYPE unlock in September 2024 demonstrated this dynamic: $797 million scheduled to unlock, but historical claim rates sat at just 1.75%, showing that announced supply and realized supply diverge based on holder behavior.
The key variable is recipient incentive. Seed and private investors acquired tokens at 80 to 95% discounts to launch price. Even a 50% drop from peak still leaves them profitable. Team allocations carry similar dynamics. Foundation reserves might not sell, but the market does not know that in advance and prices the risk accordingly.
When the Gap Matters and When It Doesn't
The FDV gap matters most when three conditions align: low circulating supply, aggressive vesting schedules, and no revenue to offset dilution.
Low circulating supply creates artificial scarcity. A token with 10% float trades on supply-demand dynamics that will not persist when the other 90% unlocks. The lower the float, the easier it is for early hype to push price high, and the harder it is for that price to hold when supply increases.
Aggressive vesting schedules compress dilution into short windows. A token unlocking 10% per month for ten months delivers far more acute pressure than one unlocking 1% per month over eight years. The faster the unlock, the more the market has to absorb in less time.
No revenue eliminates the offset. If a protocol generates significant fees that flow to token holders, the token can accrue value independent of supply inflation. Uniswap's fee revenue and governance utility reduce the relative impact of unlock pressure. Protocols with zero revenue, zero total value locked, and zero product-market fit have nothing to offset dilution. The FDV gap becomes pure risk.
FDV/Market Cap Ratio Thresholds
Ratios between 1.0 and 1.5 indicate low dilution risk. Most supply already circulates. Future unlocks will not materially shift equilibrium.
Ratios between 1.5 and 5.0 represent moderate risk. Dilution is meaningful but manageable if the vesting schedule is slow and protocol fundamentals are strong.
Ratios between 5.0 and 20.0 signal high risk. You are betting that demand will grow faster than supply unlocks. That bet works when the protocol is shipping product and gaining users. It fails when the narrative stalls.
Ratios above 20.0 require speculative treatment. The circulating supply is so small relative to total that price reflects hype, not equilibrium. Unless you have strong conviction in explosive near-term adoption, you are gambling on greater-fool dynamics.
When the Gap Matters Less
Slow unlock schedules reduce risk. A large FDV-to-market-cap gap matters less when unlocks spread over three to four years in small increments. Time allows the protocol to grow revenue, attract users, and absorb supply without catastrophic price impact.
Real revenue offsets dilution. If a protocol generates fees that accrue to token holders, the token has value independent of supply dynamics. Ethereum's fee burn, for example, creates deflationary pressure that counteracts issuance. Protocols with strong unit economics can survive aggressive unlocks. Protocols with zero revenue cannot.
Some protocols have no hard cap. They mint new tokens indefinitely to fund staking rewards or security. In those cases, FDV rises over time as maximum supply increases. FDV becomes a moving target, and the ratio loses precision. For inflationary tokens, focus instead on net issuance after burns and annualized inflation rate.
How to Check the Unlock Schedule Yourself
You do not need proprietary tools to check unlock schedules. TokenUnlocks.com is the best free resource. It aggregates vesting data across major projects and shows exactly when and how many tokens unlock.
On CoinGecko's "Token Unlocks" tab, you can see monthly and annual schedules. Cross-check those numbers against the circulating supply and max supply figures. If CoinGecko, Coinbase, and DEXTools disagree on FDV, the token contract on Etherscan or the relevant block explorer is ground truth.
Look for four red flags in the vesting schedule:
- FDV-to-market-cap ratio above 20:1
- No publicly available vesting schedule
- Large team or insider allocation (above 20% of total supply)
- Near-term cliff unlock events (within three months of launch)
If all four are present, the investment is speculative at best. If three are present, you need exceptional conviction in near-term adoption to justify the dilution risk.
By checking a token's unlock schedule and FDV-to-circulating ratio, you avoid 90% of the worst dumps. The information is public. Most investors simply do not look.
What to Do with the Data
Once you have the unlock schedule, map it against the investment timeline. If major unlocks hit in six months and you plan to hold for a year, you will sit through that pressure. If you plan to exit in three months before the first cliff, the unlock is someone else's problem.
Compare the unlock schedule to protocol milestones. Is the team shipping product before or after the major unlocks? If a 30% supply unlock hits before mainnet launch, that is a structural problem. If it hits after six months of live revenue, the risk is lower.
Check holder composition when possible. If the unlock releases tokens to the foundation or long-term-aligned team members, sell pressure may be muted. If it releases tokens to mercenary VCs or market makers, expect immediate liquidation.
For a deeper framework on evaluating valuation across multiple metrics, see our beginner's guide to market cap in crypto.
FDV Limitations and Edge Cases
FDV is forward-looking, not predictive. It assumes every future token reaches the market at today's price. That assumption breaks in both directions.
If the protocol gains adoption and generates revenue, the price when later tranches unlock may be far higher than today. In that case, the current FDV underestimates future value. Ethereum had a high FDV gap in 2016. The unlock schedule delivered dilution, but price rose because adoption outpaced supply.
If the protocol fails to deliver, the price when unlocks hit may be far lower than today. The FDV gap was always a mirage because the market could never absorb full supply at launch price.
FDV also cannot account for behavior. If 80% of unlocked tokens get staked or locked in DeFi, effective circulating supply does not change even though nominal supply increased. Conversely, if unlocked tokens hit the market immediately, sell pressure exceeds the schedule's nominal impact.
A token can have a low FDV gap and still be a poor investment if the protocol generates no revenue and token holders have no claim on fees. Market cap alone hides long-run dilution risk. FDV alone hides current liquidity and holder incentives. Use both, plus revenue data, to build a complete picture.
Market Cap's Flaw
Market cap reflects only tradable float. It systematically understates long-run economic exposure when large allocations remain vested. A $100 million market cap looks small until you realize it represents 5% of total supply and venture investors hold the other 95% with unlocks starting next quarter.
In traditional equity markets, market cap approximates enterprise value because most shares are liquid or locked for regulatory reasons, not profit-taking incentives. In crypto, vesting schedules lock supply for the explicit purpose of preventing early dumps. When those locks expire, the selling pressure is predictable.
Market cap is useful for comparing tokens with similar float ratios. It fails when comparing a high-float token to a low-float token. FDV corrects for that by normalizing to full supply.
The Low Float, High FDV Trap
The highest-risk scenario occurs in low-float, high-FDV models. At launch, low circulating supply makes price control easier. A small amount of buy pressure pushes price high because the order book is thin. That creates the illusion of a successful launch.
Most remaining supply belongs to seed, private, venture, or team allocations released via vesting schedules. Those holders acquired tokens at 80 to 95% discounts. They are not underwater if price drops 50%. Retail buyers at launch price are.
As unlocks approach, the market prices in future supply. Price declines before the unlock hits. When the unlock arrives, realized selling pressure often exceeds expectations because recipients take profit into liquidity while it exists. The cycle repeats at each cliff until circulating supply normalizes or the project dies.
Binance Research estimated roughly $155 billion of tokens would unlock between 2024 and 2030. That is $155 billion of locked supply scheduled to become liquid, much of it held by investors who have already returned their fund on paper and are happy to take profit. If you ignore unlock schedules, you are betting against that calendar.
For context on how dilution dynamics intersect with broader accumulation patterns, see our analysis of Bitcoin shark accumulation, where similar supply-side behavior affects price discovery at a different scale.
The Takeaway
The gap between market cap and fully diluted valuation is a schedule of future selling pressure. It tells you how much supply waits to unlock, and the vesting calendar tells you when. Solana's 97% collapse, Arbitrum's predictable 10 to 15% pre-cliff drops, and 2024's 12.3% average circulating ratio all prove the same point: investors who ignore the unlock schedule do not avoid dilution. They get blindsided by it.
Check the FDV-to-market-cap ratio before you deploy capital. If it is above 20x, you are speculating on hype, not valuing a protocol. If it is above 5x, confirm the vesting schedule is slow and the protocol generates real revenue. If the unlock schedule is public and aggressive, price the dilution into your entry. If the unlock schedule is not public, do not deploy capital at all.
The information is free. The decision to use it is yours.
Frequently Asked Questions
What is the difference between market cap and fully diluted valuation?
Market cap equals current token price times circulating supply-the tokens trading now. Fully diluted valuation equals current price times maximum total supply-every token that will ever exist. The gap between them represents locked tokens scheduled to unlock via vesting schedules. A large gap signals future dilution risk because those locked tokens will eventually reach the market, typically held by investors who acquired them at deep discounts and have incentive to sell.
Why does the FDV to market cap ratio matter for investors?
The FDV-to-market-cap ratio tells you how much supply remains locked. Ratios above 20:1 indicate extreme dilution risk-only 5% of supply circulates, meaning 95% waits to unlock. Ratios between 5:1 and 20:1 signal high risk requiring strong protocol fundamentals to offset. Historical data shows tokens with ratios above 10:1 frequently experience 10 to 15% price drops around major unlock events as newly vested holders liquidate positions acquired at seed or private-round discounts.
How do I check a token's unlock schedule?
Use TokenUnlocks.com, the best free tool for viewing vesting schedules across major projects. CoinGecko's Token Unlocks tab also shows monthly and annual release calendars. Cross-check circulating supply and max supply figures across multiple sources. If data conflicts, verify the token contract directly on Etherscan or the relevant block explorer-that is ground truth. Look for FDV ratio, vesting transparency, team allocation size, and proximity of cliff unlocks to assess dilution risk before deploying capital.
Can a high FDV gap ever be acceptable?
Yes, when three conditions are met: slow unlock schedule spreading over three to four years, real protocol revenue offsetting dilution, and strong product-market fit driving adoption faster than supply increases. Ethereum had a high FDV gap in 2016 but delivered adoption that outpaced unlock pressure. The key is whether the protocol generates fees that accrue to token holders. Without revenue, a high FDV gap represents pure dilution risk with no fundamental offset.
What happened to Solana's price during its unlock schedule?
Solana reached $260 per token in November 2021 with a $75 billion fully diluted valuation and over 60% of supply locked with venture capitalists and the foundation. As tokens unlocked through 2022, price collapsed 97% to $10. The protocol did not fail-adoption continued and the network remained operational. The price decline was structural dilution playing out exactly as the FDV gap and vesting schedule predicted, demonstrating why unlock calendars matter more than narratives.
You just learned how to read unlock schedules and FDV gaps that predict 10 to 15% drops before they happen. Those schedules change every launch cycle.
Every Thursday: where crypto yield actually is - stablecoins, liquid staking and DeFi lending, with the risk named next to the rate and what changed since last week.
Get it free every ThursdayFree. No trade calls, no allocations, no hype. Unsubscribe in one click.